Abstract
Aim:
To explore the relationship between genomic DNA methylation and diabetic chronic complications.
Methods:
299 patients with type 2 diabetes mellitus (T2DM) hospitalized in the Second Affiliated Hospital of Soochow University were enrolled. We divided the patients into different complications groups and corresponding non-complication groups. Clinical and biochemical parameters were compared between the two groups. The level of genomic DNA methylation in leukocytes was determined by high-performance liquid chromatography-tandem mass spectrometry.
Results:
(1) Age, duration of diabetes, creatinine (Cr), blood urea nitrogen (BUN), genomic DNA methylation, 24- hour urine total protein (24-hUTP), and intima-media thickness (IMT) were significantly higher in the carotid plaque (CP) group. Waist-to-hip ratio (WHR), body mass index (BMI), estimated glomerular- filtration rate (eGFR), and albumin (Alb) were significantly lower in the CP group. Gender, age and BMI were the influencing factors of CP. (2) Age, duration, Cr, BUN, urinary microalbumin creatinine ratio (UACR), systolic blood pressure (SBP), TCSS, and 24- hUTP were significantly higher in the diabetic retinopathy (DR) group. eGFR, 2h postprandial C- peptide, and Alb were lower in the DR group. Age, duration, Cr, Alb, SBP, and the presence of DN were the influencing factors of DR. (3) Age, duration, HbA1c, BUN, TCSS, SBP, and IMT(R) were significantly higher in the diabetic nephropathy (DN) group. 2h postprandial C-peptide, and Alb were lower in the DN group. HbA1c, BUN, DR, and HBP were the influencing factors of DN. (4) Age, duration, total cholesterol (TC), low-density lipoprotein (LDL-C), triglyceride (TG), Cr, BUN, uric acid (UA), and SBP were significantly higher in the diabetic peripheral neuropathy (DPN) group. The level of genomic DNA methylation and eGFR were significantly lower in the DPN group. Age, duration, LDL-C, UA, the presence of DR, and the genomic DNA methylation level were the influencing factors for DPN. Incorporating the level of genomic DNA methylation into the prediction model could improve the ability to predict DPN on the basis of conventional risk factors.
Conclusion:
Low level of genomic DNA methylation is a relatively specific risk factor for DPN in patients with T2DM and not a contributing factor to the other chronic complications.
1 Introduction
The prevalence of type 2 diabetes mellitus (T2DM) is supposed to increase year by year, with the number of people suffering from diabetes likely to reach 147.2 million by 2045 (1). The symptoms of diabetes are usually not so obvious at the early stage that many patients are diagnosed when the complications have occurred. Chronic hyperglycemia leads to serious life-threatening diseases, including retinopathy, nephropathy, neuropathy and atherosclerosis (AS). Up till now, there is no effective treatment for these diabetes complications. Early intervention of the risk factors for diabetic complications is thought to be an effective strategy to delay and prevent the complications of diabetes.
Epigenetic modifications include DNA methylation, regulatory RNAs, and posttranslational histone tail modifications, such as methylation, phosphorylation, acetylation. DNA methylation refers to transferring a methyl from S-adenosylmethionine (SAM) to cytosine on a CpG dinucleotide by DNA methyltransferase (DNMTs). DNA methylation is associated with the abnormal gene expression, DNA repair, genomic instability, and changes in genetic traits. It alters the structure of chromatin and gene expression. It is reported that the role of DNA methylation is very important in T2DM and its chronic complications (2).
2 Research Design and Methods
2.1 Research Design
According to admission criteria, we collected and analyzed the clinical data, laboratory tests, and blood samples from T2DM patients. The patients were divided into diabetic nephropathy (DN) group and non-DN group, diabetic retinopathy (DR) group and non-DR group, diabetic peripheral neuropathy (DPN) group and non-DPN group, and carotid plaque (CP) group and non-carotid plaque (non-CP) group, according to the results of urinary albumin creatinine ratio (UACR), fundus photographs, Toronto Clinical Scoring System (TCSS) scores, and ultrasound scan of carotid artery, respectively.
2.2 Study Protocol
A total of 299 T2DM patients hospitalized in the endocrine department of the Second Affiliated Hospital of Soochow University were enrolled in this study. T2DM was diagnosed using WHO diagnostic criteria published in 1999. The following diseases or conditions were excluded: symptomatic cardiovascular disease, previous surgery to the carotid arteries, severe acute and chronic inflammation, chronic alcohol addiction, cancer, and other severe disorders. In addition, patients suffering from hyperosmotic, hyperthyroidism, acute complications of diabetes, including hyperglycemic hyperosmolar syndrome (HHS), diabetic ketoacidosis (DKA), and lactic acidosis, were also excluded. During interviews with the subjects, physicians or the coordinators completed case report forms, recording the disease profile of diabetes, and related treatment histories including the medicines they took. The protocol for this study was authorized by the Institutional Review Board of the Second Affiliated Hospital of Soochow University, and the authorized registration number is (2016) Ethics Review No.K11. Each patient was given complete information about this trial and was required to sign a written consent form. The sample data was saved electronically in a dedicated computer with a password only accessible by researchers, ensuring that the patients’ personal information was kept private. The samples were kept in a special biological sample storage refrigerator, and the key of refrigerator was held by the principal investigators. The blood samples could only be measured in the present study. The medical records of all the patients were retained in the hospital.
2.3 Clinical and Biochemical Measurements
Anthropometric measurements including body weight, height, measured with light clothes and bare feet, and blood pressure (BP), were performed on each patient. Hypertension refers to the measurement of blood pressure ≥140/90 mmHg in resting state. If the patient has previously been diagnosed with hypertension and is currently receiving antihypertensive medication, he or she will still be diagnosed with hypertension even if the measured blood pressure is less than 140/90mmHg. The formula: BMI (kg/m²) = weight(kg)/height(m)², was used to calculate body mass index (BMI). The waist-to-hip ratio (WHR) was obtained by dividing waist circumference (cm) by hip circumference (cm).
The “gold standard” for diagnosing DPN is the electroneuromyography testing. However, it is not suitable for large-scale screening of diabetic patients in practice. TCSS is well applied in early screening and diagnosis of DPN, because when the TCSS scores ≥ 6, the sensitivity and specificity are more than 70% (3). In the present study, TCSS was used to evaluate DPN, and the method was as previously described in details (4, 5). A technician with over 10 years of experience in neurological examinations handled the query and testing. Ask each patient for pain sensation (eg, stabbing, burning, or shock-like pain), numbness, tingling and weakness in the feet, similar symptoms on the upper limbs, and instability when walking. Sensory testing was performed on the first toe and the results were recorded as normal or abnormal. Ask patients how their toes feel when stimulated by needles, light touch, instruments of different temperatures, tuning forks, and how their joints positions feel. Lower limbs nerve reflexes, including knee reflex and ankle reflex, were tested separately. TCSS score was a continuous variable ranging from a minimum of 0 (no neuropathy) to a maximum of 19 points. 6 points were obtained from symptoms, 5 from sensory testing of distal toes, and 8 from lower limb reflexes. Patients with TCSS scores ≥ 6 points were assigned to the DPN group, and the scores<6 points were regarded as no DPN.
The blood samples were collected after all patients fasted for at least 8 hours. The fully automated blood cell analyzer (Sysmex kx-21N, Japan) was used to determine blood routines. Biochemical parameters, such as total cholesterol (TC), low-density lipoprotein (LDL-C), high-density lipoprotein (HDL-C), triglyceride (TG), creatinine (Cr), uric acid (UA), blood urea nitrogen (BUN), serum albumin (Alb), C-reactive protein (CRP), 24h urine total protein (24-hUTP) and urinary microalbumin creatinine ratio(UACR) were tested using an automated biochemical instrument (Cobas800-c702, Roche, Basel, Switzerland). Roche Cobas e601 (Roche Diagnostic, Germany) was used for fasting C-peptides and 2 hours postprandial C-peptides. The Bole D100 glycation hemoglobin meter (Bole, USA) was used for glycosylated hemoglobin. eGFR was calculated with the modified MDRD equation. Intima-media thickness (IMT) of the carotid artery and carotid plaque were tested by the Korea GE Color Ultrasound Diagnostic Instrument (LOGIQ S7). Diagnosis of atherosclerosis was according to the 2009 Chinese Physicians Association Ultrasound Division Vascular Ultrasound Guidelines. The normal IMT of the carotid artery is less than 1.0mm. The diagnostic criteria for thickening of the carotid artery are 1.0mm≤ IMT ≤ 1.5mm. The diagnostic criteria for atherosclerotic plaque formation are that the carotid intimal thickening exceeds 50% of the peripheral IMT or protrudes into the vascular lumen, and IMT ≥ 1.5mm (6).
2.4 Genomic DNA Methylation Detection
The HiPure Blood DNA Kits (D3111, Magen) were used to extract DNA from white blood cells. As previously described in details (4), LC-MS/MS (Agilent 1260-API 4000, USA) was used to determine the level of genomic DNA methylation. DNA was cracked with 200μl of 99% formic acid at 140°C for 90 minutes, and fragment was suspended with 200μl water for next analysis. The volume of injection was 10μl. Mass spectrometric measurement was carried out on an API 4000 instrument (SCIEX, Ontario, Canada). We ran the tandem mass spectrometers with multiple reaction monitoring modes, m/z 112.1→95.1 and m/z 126.1→109.1 for Cyt and 5-mCyt, respectively. 5-methylcytosine hydrochloride (5-mCyt) and Cytosine (Cyt) were bought from Sigma-Aldrich (MKBX8310V and MKBQ8997V, USA). The genomic DNA methylation level was calculated as the percentage of DNA methylation using the following formula: DNA methylation%= 5-mCyt/(5-mCyt + Cyt)× 100%.
2.5 Statistical Methods
Patients’ characteristics were compared by presence of DPN or not, presence of DR or not, presence of DN or not and presence of CP or not. All data were shown as means ± standard error (SEM). We used Software SPSS 24.0 for data analysis. Normality was checked for all data prior to analysis. Two-sample t-test, Mann-Whitney U test, or χ2 test were used to compare the differences between the two groups. Spearman correlation analysis was used to analyze the associations among clinical and biochemical factors, the level of genomic DNA methylation, and TCSS scores. Multiple logistic regressions analysis was used to evaluate the influencing factors of different diabetic chronic complications. Multiple linear regression analysis was used to evaluate the influencing factors of genomic DNA methylation. A p value less than 0.05 was considered statistically significant.
3 Results
3.1 Patients
A total of 299 patients with T2DM were recruited in the present study. Of the 299 diabetic patients, average age was 54.43 years with 33.78% being female, and average BMI was 25.56 kg/m2.
3.2 Diabetic Complications
3.2.1 Carotid Plaque
As shown in Table 1, the patients were divided into the CP group and the non-CP group. Age, duration of diabetes, Cr, BUN, 24-hUTP, IMT and the level of genomic DNA methylation were much higher in the CP group (**p < 0.01, *p < 0.05, compared with non-CP, two-sample t-test and Mann-Whitney U test). BMI, WHR, Alb and eGFR were significantly lower in the CP group (**p < 0.01, *p < 0.05, compared with non-DN, Mann-Whitney U test). Male patients and smokers were more likely to develop CP (**p < 0.01, *p < 0.05, χ2 test). In the multiple logistic regression analysis, we set the presence or absence of CP as the dependent variable and the other fourteen variables as independent variables. The findings revealed that gender, age and BMI were still independently associated with the risk of CP, while duration, WHR, Cr, BUN, eGFR, the level of genomic DNA methylation, Alb, 24-hUTP and smoking were no longer related (Table 2, **p < 0.01, *p < 0.05, p>0.05).
Table 1
| Variables | Non-CP (n=143) | CP (n=156) | p Value |
|---|---|---|---|
| Gender (M: F) | 86: 57 | 112: 44 | 0.030* |
| Age (yr) | 49.700 ± 1.056 | 58.780 ± 1.006 | 0.000** |
| Duration (yr) | 6.704 ± 0.501 | 9.211 ± 0.578 | 0.013* |
| BMI (kg/m2) | 26.592 ± 0.375 | 24.867 ± 0.293 | 0.000** |
| WHR | 0.958 ± 0.006 | 0.942 ± 0.005 | 0.029* |
| FPG (mmol/L) | 9.095 ± 0.381 | 8.983 ± 0.355 | 0.775 |
| Fasting C-peptide(ng/ml) | 1.909 ± 0.098 | 1.827 ± 0.082 | 0.822 |
| C-peptide 2h postprandial(ng/ml) | 4.585 ± 0.274 | 4.369 ± 0.265 | 0.595 |
| HbA1c (%) | 8.864 ± 0.186 | 8.954 ± 0.209 | 0.924 |
| TG (mmol/L) | 2.017 ± 0.151 | 1.871 ± 0.129 | 0.713 |
| TC (mmol/L) | 4.786 ± 0.089 | 4.752 ± 0.098 | 0.799 |
| LDL-C (mmol/L) | 2.814 ± 0.074 | 2.887 ± 0.076 | 0.493 |
| HDL-C (mmol/L) | 1.073 ± 0.026 | 1.066 ± 0.025 | 0.648 |
| Cr (umol/L) | 65.969 ± 1.911 | 72.213 ± 2.286 | 0.030* |
| UA (umol/L) | 337.270 ± 9.072 | 322.010 ± 6.911 | 0.177 |
| BUN (mmol/L) | 5.518 ± 0.177 | 5.953 ± 0.162 | 0.030* |
| eGFR (ml/min/1.73m2) | 118.615 ± 3.538 | 105.314 ± 2.846 | 0.003** |
| UACR (mg/g) | 210.860 ± 74.493 | 179.936 ± 35.951 | 0.448 |
| CRP (mg/L) | 8.158 ± 1.243 | 5.853 ± 0.192 | 0.749 |
| Genomic DNA methylation (%) | 9.638 ± 0.731 | 10.885 ± 0.624 | 0.042* |
| TCSS | 6.350 ± 0.405 | 7.430 ± 0.376 | 0.074 |
| Alb(g/L) | 42.535 ± 0.401 | 41.292 ± 0.356 | 0.011* |
| 24h-UTP (g/24h urine) | 118.243 ± 48.737 | 163.487 ± 41.635 | 0.002** |
| IMT(L)(mm) | 0.686 ± 0.015 | 0.851 ± 0.002 | 0.000** |
| IMT(R)(mm) | 0.671 ± 0.012 | 0.789 ± 0.013 | 0.000** |
| SBP (mmHg) | 137.221 ± 1.337 | 142.528 ± 1.906 | 0.084 |
| DBP (mmHg) | 82.228 ± 0.742 | 79.924 ± 0.926 | 0.055 |
| DR (Y: N) | 24: 118 | 35: 121 | 0.231 |
| DPN (Y: N) | 31: 37 | 66: 48 | 0.107 |
| DN (Y: N) | 24: 119 | 37: 119 | 0.137 |
| Smoke (Y: N) | 34: 109 | 54: 102 | 0.040* |
| HBP (Y: N) | 68: 75 | 87: 69 | 0.155 |
Clinical and biochemical characteristics in CP group and non-CP group.
CP, carotid plaque; Duration, duration of diabetes; BMI, body mass index; WHR, waist-to-hip ratio; FPG, fasting plasma glucose; HbA1c, glycated hemoglobin A1c; TG, triglycerides; TC, total cholesterol; LDL-c, low density lipoprotein cholesterol; HDL-c, high density lipoprotein cholesterol; Cr, creatinine; UA, uric acid; BUN, blood urea nitrogen; eGFR, estimated glomerular filtration rate; UACR, urinary albumin creatinine ratio; CRP, c-reactive protein; TCSS, Toronto Clinical Scoring System; Alb, albumin; 24h-UTP, 24-hour urine total protein; IMT(L), intima-media thickness(left); IMT(R), intima-media thickness(right); SBP, systolic blood pressure; DBP, diastolic blood pressure; DR, diabetic retinopathy; DPN, diabetic peripheral neuropathy; DN, diabetic nephropathy; HBP, high blood pressure. Data are means ± SEM or numbers of patients. The level of DNA methylation, duration of diabetes, BMI, WHR, fasting C-peptide, C-peptide 2h postprandial, HbA1c, FPG, CRP, TG, Cr, BUN, Alb, eGFR, 24h-UTP, UACR and IMT were non-parametric and Mann-Whitney U test was used to compare them between two groups. **p<0.01, *p < 0.05. p values for differences between the both groups were obtained by two-sample t-test, Mann-Whitney U test or χ2 test.
Table 2
| B | Std.Error | p Value | OR | 95% Confidence Interval for OR | ||
|---|---|---|---|---|---|---|
| Lower Bound | Upper Bound | |||||
| Constant | 2.146 | 1.921 | 0.264 | 8.553 | – | – |
| Gender | -1.454 | 0.417 | 0.000** | 0.234 | 0.103 | 0.529 |
| Age (yr) | 0.083 | 0.018 | 0.000** | 1.086 | 1.048 | 1.126 |
| BMI (kg/m2) | -0.173 | 0.062 | 0.000** | 0.841 | 0.745 | 0.949 |
CP as dependent variable in multiple logistic regression analysis.
In multiple logistic regression analysis, carotid plaque, as dependent variable, and the other 14 variables, gender, duration, age, BMI, WHR, Cr, BUN, eGFR, the level of DNA methylation, Alb, 24-hUTP, smoking, IMT(L) and IMT(R), as independent variables, were included in the same model. Only 3 variables, gender, age and BMI were the risk factors of CP (**p < 0.01).
3.2.2 Diabetic Retinopathy
As shown in Table 3, the patients were divided into the DR group and the non-DR group. Age, duration, Cr, BUN, UACR, SBP, TCSS and 24-hUTP was much higher in the DR group (**p < 0.01, *p < 0.05, compared with non-DR, two-sample t-test and Mann-Whitney U test). Alb, 2h postprandial C-peptide and eGFR was significantly lower in the DR group (**p < 0.01, *p < 0.05, compared with non-DR, Mann-Whitney U test). The presence of DR was associated with the presence of DN and DPN (**p < 0.01, *p < 0.05, χ2 test). In the multiple logistic regression analysis, we set the presence or absence of DR as the dependent variable and the other thirteen variables as the independent variables. The findings revealed that age, duration, Alb, Cr, SBP and the presence of DN were still independently associated with the risk of DR, while 2h postprandial C-peptide, BUN, eGFR, UACR, TCSS, 24-hUTP and DPN were no longer related (Table 4, **p < 0.01, *p < 0.05, p>0.05).
Table 3
| Variables | Non-DR (n=239) | DR (n=59) | p Value |
|---|---|---|---|
| Gender (M: F) | 160: 79 | 37: 22 | 0.538 |
| Age (yr) | 53.640 ± 0.887 | 57.790 ± 1.506 | 0.013* |
| Duration (yr) | 7.049 ± 0.412 | 12.147 ± 0.901 | 0.000** |
| BMI (kg/m2) | 25.712 ± 0.278 | 25.193 ± 0.466 | 0.365 |
| WHR | 0.951 ± 0.005 | 0.941 ± 0.007 | 0.467 |
| FPG (mmol/L) | 8.997 ± 0.278 | 9.302 ± 0.691 | 0.660 |
| Fasting C-peptide (ng/ml) | 1.924 ± 0.072 | 1.674 ± 0.131 | 0.080 |
| C-peptide 2h postprandial (ng/ml) | 4.683 ± 0.219 | 3.723 ± 0.355 | 0.025* |
| HbA1c (%) | 8.910 ± 0.159 | 8.849 ± 0.305 | 0.793 |
| TG (mmol/L) | 1.942 ± 0.110 | 1.955 ± 0.231 | 0.613 |
| TC (mmol/L) | 4.733 ± 0.745 | 4.922 ± 0.153 | 0.263 |
| LDL-C (mmol/L) | 2.829 ± 0.059 | 2.955 ± 0.123 | 0.348 |
| HDL-C (mmol/L) | 1.051 ± 0.019 | 1.134 ± 0.047 | 0.095 |
| Cr (umol/L) | 66.064 ± 1.319 | 82.047 ± 5.175 | 0.022* |
| UA (umol/L) | 325.70 ± 6.412 | 343.930 ± 12.084 | 0.200 |
| BUN (mmol/L) | 5.529 ± 0.117 | 6.655 ± 0.363 | 0.007** |
| eGFR (ml/min/1.73m2) | 115.311 ± 2.431 | 96.739 ± 5.578 | 0.001** |
| UACR (mg/g) | 129.135 ± 42.454 | 466.765 ± 109.892 | 0.000** |
| CRP (mg/L) | 7.283 ± 0.742 | 5.544 ± 0.747 | 0.852 |
| Genomic DNA methylation | 10.290 ± 0.539 | 10.600 ± 1.091 | 0.781 |
| TCSS | 6.420 ± 0.303 | 9.020 ± 0.611 | 0.000** |
| Alb (g/L) | 42.464 ± 0.280 | 39.843 ± 0.6401 | 0.000** |
| 24h-UTP (g/24h urine) | 86.212 ± 28.764 | 343.518 ± 106.389 | 0.002* |
| IMT (L) (mm) | 0.767 ± 0.164 | 0.781 ± 0.291 | 0.544 |
| IMT (R) (mm) | 0.721 ± 0.010 | 0.768 ± 0.250 | 0.071 |
| SBP (mmHg) | 137.502 ± 1.231 | 149.161 ± 2.993 | 0.000** |
| DBP (mmHg) | 80.538 ± 0.632 | 82.714 ± 1.591 | 0.208 |
| DN (Y: N) | 67: 172 | 36: 23 | 0.000** |
| DPN (Y: N) | 92: 73 | 11: 36 | 0.000** |
| CP (Y: N) | 121: 118 | 35: 24 | 0.231 |
| HBP (Y: N) | 118: 121 | 36: 23 | 0.109 |
Clinical and biochemical characteristics in DR group and non-DR group.
Data are means ± SEM or numbers of patients. The level of DNA methylation, duration of diabetes, WHR, fasting C-peptide, C-peptide 2h postprandial, HbA1c, FPG, CRP, TG, Cr, BUN, Alb, eGFR, 24h-UTP, UACR and IMT were non-parametric and we used Mann-Whitney U test to compare them between two groups. *p < 0.05, **p < 0.01. p values for differences between the both groups were obtained by two-sample t-test, Mann-Whitney U test or χ2 test.
Table 4
| B | Std.Error | p Value | OR | 95% Confidence Interval for OR | ||
|---|---|---|---|---|---|---|
| Lower Bound | Upper Bound | |||||
| Constant | 1.033 | 3.004 | 0.731 | 2.809 | – | – |
| Age (yr) | 0.024 | 0.025 | 0.017** | 0.941 | 0.895 | 0.989 |
| Cr (umol/L) | 0.019 | 0.007 | 0.010* | 1.019 | 1.004 | 1.034 |
| Alb (g/L) | -0.171 | 0.060 | 0.005** | 0.843 | 0.749 | 0.949 |
| SBP (mmHg) | 0.038 | 0.013 | 0.004** | 1.039 | 1.012 | 1.066 |
| DN | 0.967 | 0.484 | 0.046* | 2.629 | 1.018 | 6.794 |
DR as dependent variable in multiple logistic regression analysis.
In multiple logistic regression analysis, DR, as dependent variable, and the other 13 variables, Age, duration, 2h postprandial C-peptide, Cr, BUN, eGFR, UACR, TCSS, Alb, 24-hUTP, SBP, the presence of DN and the presence of DPN, as independent variables, were included in the same model. 6 variables, age, duration, Cr, Alb, SBP and DN were the risk factors of DR (**p < 0.01, *p < 0.05).
3.2.3 Diabetic Nephropathy
As shown in Table 5, the patients were divided into the DN group and the non-DN group. Age, duration, HbA1c, BUN, TCSS, SBP and IMT(R) were significantly higher in the DN group (**p < 0.01, *p < 0.05, compared with non-DN, two-sample t-test and Mann-Whitney U test). 2h postprandial C-peptide and Alb were much lower in DN group (**p < 0.01, *p < 0.05, compared with non-DN, Mann-Whitney U test). DN was associated with the presence of DR, DPN and HBP (**p < 0.01, *p < 0.05, χ2 test). In the multiple logistic regression analysis, we set the presence or absence of DN as a dependent variable and the other twelve variables as independent variables. The findings revealed that HbA1c, BUN, the presence of DR and HBP were still independently associated with the risk of DN, while age, duration, TCSS, Alb, SBP, IMT(R), 2h postprandial C-peptide and the presence of DPN were no longer related (Table 6, **p < 0.01, *p < 0.05, p>0.05).
Table 5
| Variables | Non-DN (n=195) | DN (n=104) | p Value |
|---|---|---|---|
| Gender (M: F) | 159: 79 | 39: 22 | 0.672 |
| Age (yr) | 53.430 ± 0.869 | 58.360 ± 1.682 | 0.012* |
| Duration (yr) | 7.17 ± 0.412 | 11.28 ± 0.930 | 0.000** |
| BMI (kg/m2) | 25.62 ± 0.281 | 25.33 ± 0.448 | 0.602 |
| WHR | 0.95 ± 0.012 | 0.94 ± 0.019 | 0.650 |
| FPG (mmol/L) | 8.95 ± 0.297 | 9.37 ± 0.607 | 0.553 |
| Fasting C-peptide (ng/ml) | 1.90 ± 0.078 | 1.73 ± 0.131 | 0.421 |
| C-peptide 2h postprandial (ng/ml) | 4.70 ± 0.223 | 3.62 ± 0.385 | 0.005* |
| HbA1c (%) | 8.74 ± 0.164 | 9.58 ± 0.309 | 0.007* |
| TG (mmol/L) | 1.91 ± 0.119 | 2.06 ± 0.257 | 0.876 |
| TC (mmol/L) | 4.74 ± 0.073 | 4.89 ± 0.152 | 0.330 |
| LDL-C (mmol/L) | 2.84 ± 0.062 | 2.88 ± 0.117 | 0.753 |
| HDL-C (mmol/L) | 1.06 ± 0.023 | 1.11 ± 0.049 | 0.456 |
| UA (umol/L) | 326.50 ± 6.43 | 339.74 ± 11.68 | 0.341 |
| BUN (mmol/L) | 5.40 ± 0.107 | 7.09 ± 0.372 | 0.000** |
| CRP (mg/L) | 7.19 ± 0.735 | 5.93 ± 0.329 | 0.880 |
| Genomic DNA methylation (%) | 10.441 ± 0.641 | 10.309 ± 0.698 | 0.591 |
| TCSS | 6.53 ± 0.303 | 8.58 ± 0.621 | 0.003** |
| Alb(g/L) | 42.50 ± 0.278 | 39.52 ± 0.624 | 0.000** |
| IMT (L) (mm) | 0.750 ± 0.175 | 0.804 ± 0.240 | 0.214 |
| IMT (R) (mm) | 0.708 ± 0.012 | 0.772 ± 0.016 | 0.005** |
| SBP (mmHg) | 137.317 ± 1.388 | 144.918 ± 2.119 | 0.000** |
| DBP (mmHg) | 80.743 ± 0.711 | 81.608 ± 1.099 | 0.274 |
| DR (Y: N) | 19:219 | 40:20 | 0.000** |
| DPN (Y: N) | 76:89 | 33: 15 | 0.006** |
| CP (Y: N) | 119: 119 | 37: 24 | 0.137 |
| Smoke (Y: N) | 69: 169 | 19: 42 | 0.742 |
| HBP (Y: N) | 112: 126 | 43: 18 | 0.001** |
Clinical and biochemical characteristics in DN group and non-DN group.
Data are means ± SEM or numbers of patients. The level of DNA methylation, age, duration of diabetes, WHR, fasting C-peptide, C-peptide 2h postprandial, HbA1c, FPG, CRP, TG, Cr, BUN, Alb, 24h-UTP, UACR and IMT were non-parametric and Mann-Whitney U test was used to compare them between two groups. **p < 0.01, *p < 0.05. p values for differences between the both groups were obtained by two-sample t-test, Mann-Whitney U test or χ2 test.
Table 6
| B | Std.Error | p Value | OR | 95% Confidence Interval for OR | ||
|---|---|---|---|---|---|---|
| Lower Bound | Upper Bound | |||||
| Constant | -0.536 | 2.170 | 0.805 | 0.585 | – | – |
| HbA1c (%) | 0.160 | 0.079 | 0.042* | 1.173 | 1.006 | 1.369 |
| BUN (mmol/L) | 0.222 | 0.098 | 0.023* | 1.249 | 1.030 | 1.513 |
| DR | 0.922 | 0.352 | 0.009** | 2.514 | 1.260 | 5.016 |
| HBP | 1.032 | 2.170 | 0.009** | 2.807 | 1.297 | 6.077 |
DN as dependent variable in multiple logistic regression analysis.
In multiple logistic regression analysis, DN, as dependent variable, and the other 12 variables, age, duration, HbA1c, BUN, TCSS, Alb, IMT(R), SBP, 2h postprandial C-peptide, the presence of DR, DPN and HBP, as independent variables, were included in the same model. Only 4 variables, HbA1c, BUN, DR, and HBP were the risk factors of DN (**p < 0.01, *p < 0.05).
3.2.4 Diabetic Peripheral Neuropathy
As shown in Table 7, the patients were divided into the DPN group and the non-DPN group. The characteristics as follows were significantly higher in the DPN group: age, duration, TG, TC, LDL-C, Cr, UA, BUN and SBP (**p < 0.01, *p < 0.05, compared with non-DPN, two-sample t-test and Mann-Whitney U test). The levels of genomic DNA methylation and eGFR were significantly lower in the DPN group (**p<0.01, *p<0.05, compared with non-DPN, Mann-Whitney U test). The presence of DPN was associated with the presence of DR and DN (**p < 0.01, *p < 0.05, χ2 test). In order to explore the predictive ability of genomic DNA methylation in DPN, we established two multiple logistic regression models and performed ROC analysis. In the first multiple logistic regression analysis, we set the presence or absence of DPN as a dependent variable, and the other twelve variables except for the level of genomic DNA methylation as independent variables. The findings revealed that age, duration, LDL-C, UA, and the presence of DR were still independently associated with the risk of DPN, while TC, Cr, BUN, eGFR, CRP, SBP, and the presence of DN were no longer related (Table 8, **p < 0.01, *p < 0.05, p>0.05). The area under the ROC curve (AUC) for the five conventional risk factors was 0.872, as shown in Figure 1. In the second multiple logistic regression analysis, we set the presence or absence of DPN as a dependent variable, and the other thirteen variables including the level of genomic DNA methylation as independent variables. The results showed that the level of genomic DNA methylation was also still independently associated with the risk of DPN (Table 9, **p < 0.01, *p < 0.05). Introducing the genomic DNA methylation level into the model statistically increased the AUC to 0.883. The AUC for composite factors was greater than any single conventional risk factors, with a sensitivity of 81.9%, specificity of 85.7%, as shown in Figure 1.
Table 7
| Variables | Non-DPN (n=86) | DPN (n=100) | p Value |
|---|---|---|---|
| Gender (M: F) | 52: 34 | 67: 33 | 0.355 |
| Age (yr) | 56.870 ± 1.310 | 63.030 ± 1.207 | 0.001** |
| Duration (yr) | 5.819 ± 0.551 | 12.472 ± 0.752 | 0.000** |
| BMI (kg/m2) | 25.407 ± 0.401 | 25.060 ± 0.283 | 0.471 |
| WHR | 0.944 ± 0.005 | 0.940 ± 0.006 | 0.423 |
| FPG (mmol/L) | 8.536 ± 0.517 | 9.319 ± 0.491 | 0.275 |
| HbA1c (%) | 8.612 ± 0.289 | 8.819 ± 0.234 | 0.575 |
| Fasting C-peptide (ng/ml) | 1.880 ± 0.115 | 1.890 ± 0.118 | 0.950 |
| C-peptide 2 hours postprandial (ng/ml) | 4.858 ± 3.40 | 4.493 ± 0.330 | 0.508 |
| TG (mmol/L) | 1.527 ± 0.163 | 1.968 ± 0.140 | 0.007** |
| TC (mmol/L) | 4.426 ± 0.135 | 4.865 ± 0.114 | 0.013* |
| LDL-C (mmol/L) | 2.549 ± 0.096 | 2.954 ± 0.098 | 0.004** |
| HDL-C (mmol/L) | 1.102 ± 0.031 | 1.074 ± 0.032 | 0.363 |
| Cr (umol/L) | 63.800 ± 2.204 | 78.340 ± 3.352 | 0.001** |
| UA (umol/L) | 303.150 ± 10.737 | 346.350 ± 10.425 | 0.001** |
| BUN (mmol/L) | 5.555 ± 0.210 | 6.409 ± 0.240 | 0.009** |
| eGFR (ml/min/1.73m2) | 113.719 ± 3.278 | 95.108 ± 3.414 | 0.000** |
| UACR (mg/g) | 218.321 ± 119.476 | 340.638 ± 123.155 | 0.159 |
| CRP (mg/L) | 5.452 ± 0.070 | 6.998 ± 1.403 | 0.311 |
| Genomic DNA methylation (%) | 11.361 ± 0.783 | 9.244 ± 0.556 | 0.015* |
| Alb (g/L) | 42.002 ± 0.521 | 41.041 ± 0.449 | 0.119 |
| 24h-UTP (g/24h urine) | 171.5 ± 75.758 | 306.596 ± 88.895 | 0.234 |
| IMT (L) (mm) | 0.80 ± 0.002 | 0.84 ± 0.003 | 0.538 |
| IMT (R) (mm) | 0.760 ± 0.002 | 0.78 ± 0.002 | 0.606 |
| SBP (mmHg) | 136.51 ± 1.970 | 147.240 ± 2.350 | 0.002** |
| DBP (mmHg) | 78.78 ± 1.16 | 79.58 ± 1.06 | 0.612 |
| DR (Y: N) | 11: 92 | 36: 73 | 0.000** |
| DKD (Y: N) | 15: 89 | 33: 76 | 0.006** |
| CP (Y: N) | 15: 89 | 70: 39 | 0.908 |
| Smoke (Y: N) | 31: 73 | 36: 73 | 0.613 |
| HBP (Y: N) | 53: 51 | 71: 38 | 0.082 |
Clinical and biochemical characteristics in DPN group and non-DPN group.
Data are means ± SEM or numbers of patients. The level of DNA methylation, duration of diabetes, WHR, fasting C-peptide, C-peptide 2h postprandial, HbA1c, FPG, CRP, TG, Cr, BUN, Alb, eGFR, 24h-UTP, UACR and IMT were non-parametric and Mann-Whitney U test was used to compare them between two groups. **p < 0.01, *p < 0.05. p values for differences between the both groups were obtained by two-sample t-test, Mann-Whitney U test or χ2 test.
Table 8
| B | Std.Error | p Value | OR | 95% Confidence Interval for OR | ||
|---|---|---|---|---|---|---|
| Lower Bound | Upper Bound | |||||
| Constant | -9.618 | 1.879 | 0.000* | 0000 | – | – |
| Age (yr) | 0.044 | 0.018 | 0.013* | 1.045 | 1.010 | 1.083 |
| Duration (yr) | 0.180 | 0.041 | 0.000* | 1.197 | 1.104 | 1.297 |
| UA (umol/L) | 0.006 | 0.002 | 0.005** | 1.006 | 1.002 | 1.010 |
| LDL-C (mmol/L) | 1.255 | 0.292 | 0.000** | 3.508 | 1.981 | 6.211 |
| DR | 1.570 | 0.578 | 0.007** | 4.807 | 1.549 | 14.913 |
DPN as dependent variable in multiple logistic regression analysis.
In multiple logistic regression analysis, DPN, as dependent variable, and the other 12 variables, age, duration, TG, TC, LDL-C, Cr, UA, BUN, eGFR, SBP, the presence of DR and DN, as independent variables, were included in the same model. 6 variables, age, duration, TG, LDL-C and the presence of DR were the risk factors of DPN (**p < 0.01, *p < 0.05).
Figure 1
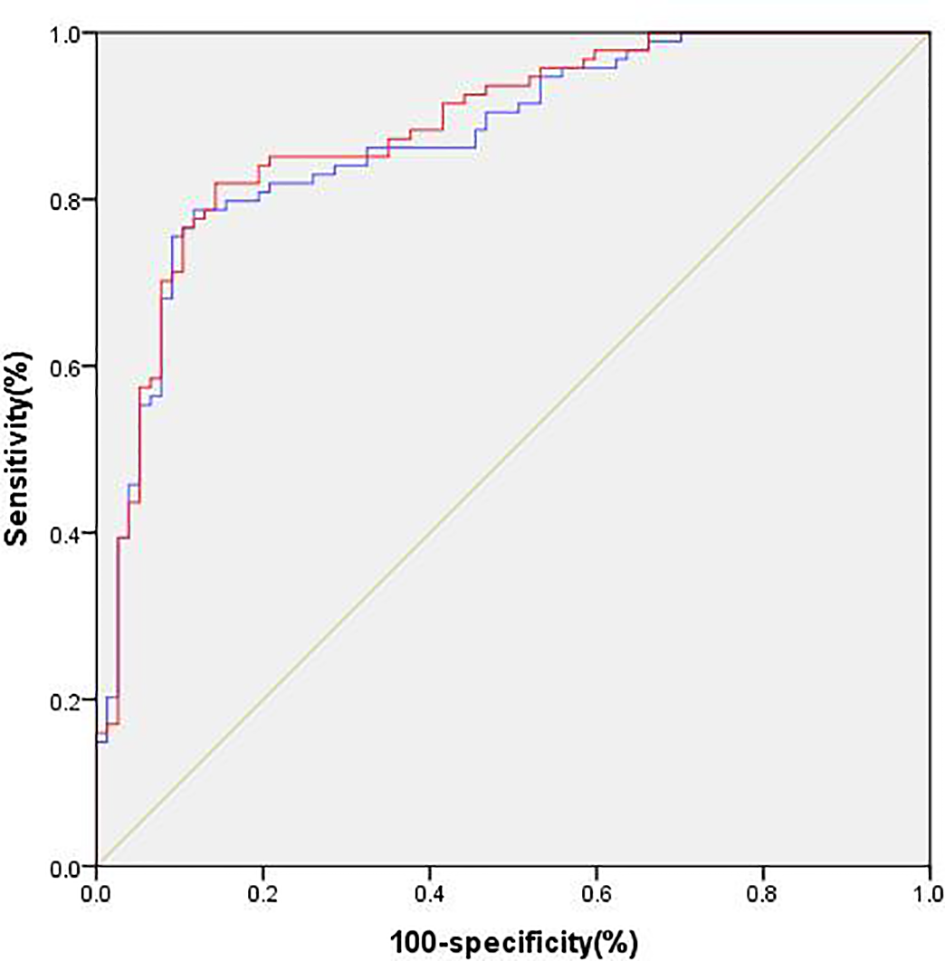
Predictive ability of different models of DPN. Model 1 (blue), conventional model including age, duration, TG, TC, LDL-C, Cr, UA, BUN, eGFR, SBP, the presence of DR and DN. Model 2 (red), model 1 plus the level of genomic DNA methylation.
Table 9
| B | Std.Error | p Value | OR | 95% Confidence Interval for OR | ||
|---|---|---|---|---|---|---|
| Lower Bound | Upper Bound | |||||
| Constant | -8.670 | 1.884 | 0.000* | 0000 | – | – |
| Age (yr) | 0.044 | 0.018 | 0.013** | 1.045 | 1.009 | 1.082 |
| Duration (yr) | 0.179 | 0.041 | 0.000* | 1.195 | 1.103 | 1.296 |
| UA (umol/L) | 0.005 | 0.002 | 0.019** | 1.005 | 1.001 | 1.009 |
| LDL-C (mmol/L) | 1.270 | 0.291 | 0.000** | 3.561 | 2.014 | 6.296 |
| Genomic DNA methylation (%) | -6.917 | 3.655 | 0.041* | 0.001 | 0.000 | 1.279 |
| DR | 1.683 | 0.609 | 0.006** | 5.380 | 1.631 | 17.748 |
DPN as dependent variable in multiple logistic regression analysis.
In multiple logistic regression analysis, DPN, as dependent variable, and the other 13 variables, age, duration, TG, TC, LDL-C, Cr, UA, BUN, eGFR, SBP, the presence of DR and DN, the level of genomic DNA methylation, as independent variables, were included in the same model. 6 variables, age, duration, TG, LDL-C, DR and the level of genomic DNA methylation were the risk factors of DPN (**p < 0.01, *p < 0.05).
3.3 The Influencing Factors of Genomic DNA Methylation
To investigate the factors that influenced genomic DNA methylation, we performed further correlation analysis among the genomic DNA methylation, clinical characteristics, and TCSS scores, and the results were shown in Table 10. The genomic DNA methylation level was negatively correlated with BMI, TG and TCSS, and the correlation coefficients (r values) were -0.189, -0.152, and -0.278, respectively (∗p<0.05, ∗∗p<0.01). In the multiple linear regression analysis, we set the genomic DNA methylation level as a dependent variable and the other 3 variables as independent variables. TCSS and BMI were the risk factors of genomic DNA methylation. Unstandardized coefficients for BMI was -0.069(-0.111, -0.027) and for TCSS was -0.303 (-0.443, -0.164), respectively (Table 11, ∗∗p<0.01, *p < 0.05). T2DM patients with higher BMI and TCSS scores had lower levels of genomic DNA methylation.
Table 10
| Variables | BMI | TG | TCSS | |
|---|---|---|---|---|
| Genomic of DNA methylation (%) | r | -0.189 | -0.152 | -0.278 |
| p | 0.01* | 0.039* | 0.000** |
Correlation analysis among genomic DNA methylation and the other variables.
The r value indicated the 3 variables, BMI, TG, TCSS, were likely to be related to the level of genomic of DNA methylation (**p < 0.01, *p < 0.05).
Table 11
| Unstandardized coefficients | Standardized coefficients | T | p Value | 95% Confidence Interval for B | |||
|---|---|---|---|---|---|---|---|
| B | Std.Error | Beta | Lower Bound | Upper Bound | |||
| BMI (kg/m2) | -0.069 | 0.021 | -0.226 | -3.241 | 0.001** | -0.111 | -0.027 |
| TCSS | -0.303 | 0.071 | -0.299 | -4.294 | 0.000** | -0.443 | -0.164 |
Genomic DNA methylation as dependent variable in multiple linear regression analysis.
In multiple linear regression analysis, genomic of DNA methylation, as dependent variable, and the other 3 variables, BMI, TG, TCSS, as independent variables, were included in the same model. Only two variables, BMI and TCSS were the risk factors of the level of genomic DNA methylation (**p < 0.01).
4 Discussion
Diabetes mellitus is estimated to affect 380 million people worldwide by 2025 (7). The disease leads to macrovascular and microvascular complications, including diabetic macroangiopathy, diabetic nephropathy, diabetic retinopathy, and diabetic peripheral neuropathy. Chronic complications of diabetes negatively affect the quality of patients’ life. It is important to study the clinical characteristics and the risk factors of diabetic complications, providing potential targets for clinical treatments.
Cardiovascular disease is considered to be the most common cause of disability and death in patients with diabetes. Pathophysiology is thrombus, plaque ulceration, luminal stenosis or bleeding from atherosclerosis. Cervical atherosclerosis is considered to be the most important risk factor for acute ischemic cerebrovascular disease. Therefore, in this study, we analyzed the related risk factors of carotid atherosclerosis in patients with diabetes. As shown in the results, gender, age and BMI were independently associated with the risk of CP, consistent with the most studies (8–10). However, there was no difference in lipid parameters, such as TC, TG, and LDL-C, between the CP group and the non-CP group, which might be on account of the interference of lipid-lowering drugs taken by some patients when they were admitted to the hospital.
Diabetic retinopathy, diabetic nephropathy and diabetic peripheral neuropathy are all microvascular complications, which have common pathogenesis including hyperglycemia, polyol metabolic abnormalities, protein non-enzyme glycation, cytokines, free radical action, inflammatory media oxidative stress and genetic background (11). So, patients with one microvascular complication were more likely to have other microvascular complications (12). The results of this study are consistent with the above conclusion. Growing clinical studies have explored the risk factors for microvascular complications in diabetes. Most studies discovered that the prevalence of diabetic microvascular complications increased with age and duration (13). Hypertension and lipid metabolism disorders has a promoting effect on the development of microvascular lesion in diabetes (14, 15). Another widely recognized factor is HbA1c, which can be used as an important indicator for blood glucose levels and diabetic microvascular complications (16). Serum albumin was also reported to be closely related to microvascular complications of diabetes and considered as a marker of chronic inflammation and oxidative stress in DM patients (16). Similar results were all obtained in this study.
Interestedly, we found that the level of genomic DNA methylation might be an independent risk factor of DPN. DPN is considered to be affected by both genetic and lifestyle factors. At present, epigenetic mechanisms, such as DNA methylation, RNA regulation, histone modifications, and chromatin remodeling, have emerged as a potential link between environmental factors and gene expression (17). DNA methylation affects gene expression and is an essential epigenetic process. Hyperglycemia causes changes in DNA methylation, which in turn alter the expression of genes and many key molecules, ultimately leading to chronic complications of diabetes (18). Assessment of DNA methylation status includes gene-specific and genome-wide DNA methylation analysis. We previously found that P2x3r gene in dorsal root ganglion neurons was significantly demethylated, upregulating the expression of the P2X3 receptor and leading to diabetic painful neuropathy in rats with diabetes (19). We also found that DNA demethylation of cystathionine-β-synthetase (CBS), an endogenous H2S synthase, was involved in diabetic gastric hypersensitivity (20). A comprehensive analysis of DNA methylation profiles of sural nerves in DPN patients also suggests the important role of DNA methylation in DPN progression (21). We wondered whether the level of genomic DNA methylation in leukocytes was associated with DPN. In this study, we found that the genomic DNA methylation level was significantly lower in DPN patients. The logistic regression analysis showed that the level of genomic DNA methylation was an independent risk factor of DPN.
Studies have shown links between DNA methylation and other chronic complications of diabetes. Abnormal DNA methylation in the proximal tubules was reported to be associated with DN (22). Elisabet et al. found that genome-wide DNA methylation level in blood could be considered as a predictive biomarker for DR (23). In the present study, we meant to figure out whether genomic DNA methylation is a influencing factor for DPN or for all chronic complications of diabetes, including DR, DPN, DN and CP. We grouped the population according to different complications and found that the genomic DNA methylation level was significantly higher in patients with CP, but didn’t change in patients with DN and DR. Taking CP as a dependent variable, the logistic regression analysis showed that the level of genomic DNA methylation was not an independent risk factor of CP. Based on the findings, we inferred that genomic DNA methylation is a relatively specific risk factor for DPN. In addition, our results suggested that incorporating the level of genomic DNA methylation into the prediction model could improve the ability to predict DPN on the basis of conventional risk factors.
To further clarify the relationship between DPN and genomic DNA methylation, we analyzed the factors that influenced genomic DNA methylation using the correlation analysis and multiple stepwise regression analysis. In addition to TCSS, BMI was found to be another negative influencing factor for genomic DNA methylation. The result was consistent with previous researches. Miina Ollikainen et al. found significant differences in DNA methylation between twins, when the heavier co-twins had excess liver fat (24). Wahl S. found that DNA methylation status in leukocytes changed in obesity associated with metabolic disorders (25). These studies confirm that obesity is a factor that causes changes in DNA methylation. In the presence study, BMI and WHR were not the influencing factor of DPN, so obesity or not did not interfere with the effect of genomic DNA methylation on DPN.
What is the link between DPN and genomic DNA methylation? It is well known that DNA methylation status is affected by factors such as environment, age, gender, and diseases, and is always in the process of dynamic change. DNA methylation may vary between different cells, tissues or individuals, and even between different periods of development of the same individual. In general, CpG island, located in the gene promoter region, is in a methylated state, which often leads to a reduction in the gene expression. The higher the degree of DNA methylation, the lower its transcription activity, and the methylation in the part of the gene regulates the extension and slicing of gene transcription (26). Evidence from both the Diabetes Control and Complications Trial has revealed that long-term hyperglycemia could lead to persistent diabetic complications even after better control was established, which was well known as the legacy effect or the metabolic memory phenomenon (27). Because of the existence of “metabolic memory”, the treatment of complications of diabetes is very difficult. Ansgar S. Olsen’s data showed that metabolic memory is heritable and that the inheritance is associated with DNA demethylation and abnormal gene expression induced by hyperglycemia. In our present study, the results show that the lower the level of genomic DNA methylation, the higher TCSS scores, suggesting that patients with lower genomic DNA methylation level were more likely to develop to DPN. It was reported that folic acid levels in diabetes patients’ blood was associated with reduced genomic DNA methylation (28). Long-term vitamin B12 and folic acid treatment was demonstrated to alter the genomic DNA methylation level in patients (29). Vitamin B12 and folic acid deficiency play important roles in accelerating diabetic neuropathy, while they are biomarkers of one-carbon metabolism. We hypothesize that one-carbon unit deficiency in diabetic patients results in genomic DNA demethylation, which in turn stimulates the activation of key genes and activates additional signal pathways that lead to DPN.
This study had some limitations. Firstly, the study was cross-sectional and therefore could not longitudinally observe the relationship between genomic DNA methylation and the evolution of diabetic complications. Secondly, the sample size of the study was small, and the selected patients were hospitalized ones, which might cause bias. Therefore, multicenter studies with larger sample are required. Thirdly, we speculated that vitamin B12 and folic acid affected the genomic DNA methylation level, but we didn’t test the levels of vitamin B12 and folic acid.
5 Conclusion
As the above results have shown, low level of genomic DNA methylation is a relatively specific risk factor for diabetic peripheral neuropathy in patients with type 2 diabetes, rather than a specific risk factor for other chronic complications of diabetes, such as DN, DR or CP.
Funding
This work was supported by grants from the National Natural Science Foundation of China (82071234 to H-HZ, 82170836 to JH) and from the Jiangsu Youth Medical Talents Project (QNRC2016874 to H-HZ).
Publisher’s Note
All claims expressed in this article are solely those of the authors and do not necessarily represent those of their affiliated organizations, or those of the publisher, the editors and the reviewers. Any product that may be evaluated in this article, or claim that may be made by its manufacturer, is not guaranteed or endorsed by the publisher.
Statements
Data availability statement
The original contributions presented in the study are included in the article/supplementary material. Further inquiries can be directed to the corresponding authors.
Ethics statement
The studies involving human participants were reviewed and approved by the Institutional Review Board of the Second Affiliated Hospital of Soochow University. The patients/participants provided their written informed consent to participate in this study.
Author contributions
XW, WY, YZ collected and analyzed the data and wrote the article. SZ, MJ collected and analyzed the data. JH reviewed and edited the article. H-HZ designed and supervised the study and edited the article. H-HZ or JH is the guarantor of this study and, as such, had full access to all the data in the study and takes responsibility for the authenticity of the data and the accuracy of the data analysis. All authors contributed to the article and approved the submitted version.
Conflict of interest
The authors declare that the research was conducted in the absence of any commercial or financial relationships that could be construed as a potential conflict of interest.
Abbreviations
T2DM, type 2 diabetes mellitus; CP, Carotid plaque; AS, Atherosclerosis; DN, Diabetic Nephropathy; DR, Diabetic Retinopathy; DPN, Diabetic peripheral neuropathy; TCSS, Toronto Clinical Scoring System; HHS, hyperglycemic hyperosmolar syndrome; DKA, diabetic ketoacidosis; DBP, Diastolic blood pressure; SBP, Systolic blood pressure; BMI, Body mass index; WHR, Waist-to-hip ratio; FPG, Fasting plasma glucose; HbA1c, Glycated hemoglobin; TG, Triglyceride; TC, Total cholesterol; LDL-C, Low density lipoprotein; HDL-C, High density lipoprotein; Cr, Creatinine; BUN, Blood urea nitrogen; UA, Uric acid; Alb, Albumin; CRP, C-reactive protein; 24-hUTP, 24-hour urine total protein; UACR, Urine microalbumin creatinine ratio; eGFR, Estimated glomerular filtration rate; IMT, Intima-media thickness; LC-MS/MS, Liquid chromatography-tandem mass spectrometry.
References
1
Sinclair A Saeedi P Kaundal A Karuranga S Malanda B Williams R et al . Diabetes and Global Ageing Among 65-99-Year-Old Adults: Findings From the International Diabetes Federation Diabetes Atlas, 9 Edition. Diabetes Res Clin Pract (2020) 162:108078. doi: 10.1016/j.diabres.2020.108078
2
Raciti G Nigro C Longo M Parrillo L Miele C Formisano P et al . Personalized Medicine and Type 2 Diabetes: Lesson From Epigenetics. Epigenomics (2014) 6:229–38. doi: 10.2217/epi.14.10
3
Binns-Hall O Selvarajah D Sanger D Walker J Scott A Tesfaye S et al . One-Stop Microvascular Screening Service: An Effective Model for the Early Detection of Diabetic Peripheral Neuropathy and the High-Risk Foot. Diabetic Med J Br Diabetic Assoc (2018) 35:887–94. doi: 10.1111/dme.13630
4
Zhang H Han X Wang M Hu Q Li S Wang M et al . The Association Between Genomic DNA Methylation and Diabetic Peripheral Neuropathy in Patients With Type 2 Diabetes Mellitus. J Diabetes Res (2019) 2019):2494057. doi: 10.1155/2019/2494057
5
Bril V Perkins B . Validation of the Toronto Clinical Scoring System for Diabetic Polyneuropathy. Diabetes Care (2002) 25:2048–52. doi: 10.2337/diacare.25.11.2048
6
Touboul P Hennerici M Meairs S Adams H Amarenco P Bornstein N et al . Mannheim Carotid Intima-Media Thickness and Plaque Consensus (2004-2006-2011). An Update on Behalf of the Advisory Board of the 3rd, 4th and 5th Watching the Risk Symposia, at the 13th, 15th and 20th European Stroke Conferences, Mannheim, Germany, 2004, Brussels, Belgium, 2006, and Hamburg, Germany, 2011. Cerebrovascular Dis (Basel Switzerland) (2012) 34:290–6. doi: 10.1159/000343145
7
Tarr J Kaul K Chopra M Kohner EM Chibber R . Pathophysiology of Diabetic Retinopathy. ISRN Ophthalmol (2013) 2013:343560. doi: 10.1155/2013/343560
8
van der Heijden D van Leeuwen M Janssens G Lenzen MJ van de Ven PM Eringa EC et al . Body Mass Index is Associated With Microvascular Endothelial Dysfunction in Patients With Treated Metabolic Risk Factors and Suspected Coronary Artery Disease. J Am Heart Assoc (2017) 6(9):e006082. doi: 10.1161/JAHA.117.006082
9
Rovella V Anemona L Cardellini M Saggini A Santeusanio G Bonanno E et al . The Role of Obesity in Carotid Plaque Instability: Interaction With Age, Gender, and Cardiovascular Risk Factors. Cardiovasc Diabetol (2018) 17:46. doi: 10.1186/s12933-018-0685-0
10
Vlachopoulos C Aznaouridis K Stefanadis C . Prediction of Cardiovascular Events and All-Cause Mortality With Arterial Stiffness: A Systematic Review and Meta-Analysis. J Am Coll Cardiol (2010) 55:1318–27. doi: 10.1016/j.jacc.2009.10.061
11
Ahsan H . Diabetic Retinopathy–Biomolecules and Multiple Pathophysiology. Diabetes Metab syndrome (2015) 9:51–4. doi: 10.1016/j.dsx.2014.09.011
12
Al-Rubeaan K Abu El-Asrar AM Youssef AM Subhani SN Ahmad NA Al-Sharqawi AH et al . Diabetic Retinopathy and Its Risk Factors in a Society With a Type 2 Diabetes Epidemic: A Saudi National Diabetes Registry-Based Study. Acta Ophthalmologica (2015) 93:E140–7. doi: 10.1111/aos.12532
13
Pai Y Lin C Lee I Chang MH . Prevalence and Biochemical Risk Factors of Diabetic Peripheral Neuropathy With or Without Neuropathic Pain in Taiwanese Adults With Type 2 Diabetes Mellitus. Diabetes Metab syndrome (2018) 12:111–6. doi: 10.1016/j.dsx.2017.09.013
14
Iqbal Z Bashir B Ferdousi M Kalteniece A Alam U Malik RA et al . Lipids and Peripheral Neuropathy. Curr Opin Lipidol (2021) 32:249–57. doi: 10.1097/MOL.0000000000000770
15
Kazamel M Stino A Smith A . Metabolic Syndrome and Peripheral Neuropathy. Muscle Nerve (2021) 63:285–93. doi: 10.1002/mus.27086
16
Yaribeygi H Atkin S Sahebkar A . A Review of the Molecular Mechanisms of Hyperglycemia-Induced Free Radical Generation Leading to Oxidative Stress. J Cell Physiol (2019) 234:1300–12. doi: 10.1002/jcp.27164
17
Maunakea A Chepelev I Zhao K . Epigenome Mapping in Normal and Disease States. Circ Res (2010) 107:327–39. doi: 10.1161/CIRCRESAHA.110.222463
18
Hao J Hua L Fu X Zhang X Zou Q Li Y et al . Genome-Wide DNA Methylation Analysis of Human Peripheral Blood Reveals Susceptibility Loci of Diabetes-Related Hearing Loss. J Hum Genet (2018) 63:1241–50. doi: 10.1038/s10038-018-0507-y
19
Zhang H Hu J Zhou Y Qin X Song ZY Yang PP et al . Promoted Interaction of Nuclear Factor-κb With Demethylated Purinergic P2X3 Receptor Gene Contributes to Neuropathic Pain in Rats With Diabetes. Diabetes (2015) 64:4272–84. doi: 10.2337/db15-0138
20
Zhang H Hu J Zhou Y Hu S Wang YM Chen W et al . Promoted Interaction of Nuclear Factor-κb With Demethylated Cystathionine-β-Synthetase Gene Contributes to Gastric Hypersensitivity in Diabetic Rats. J Neurosci Off J Soc Neurosci (2013) 33:9028–38. doi: 10.1523/JNEUROSCI.1068-13.2013
21
Guo K Elzinga S Eid S Figueroa-Romero C Hinder LM Pacut C et al . Genome-Wide DNA Methylation Profiling of Human Diabetic Peripheral Neuropathy in Subjects With Type 2 Diabetes Mellitus. Epigenetics (2019) 14:766–79. doi: 10.1080/15592294.2019.1615352
22
Marumo T Yagi S Kawarazaki W Nishimoto M Ayuzawa N Watanabe A et al . Diabetes Induces Aberrant DNA Methylation in the Proximal Tubules of the Kidney. J Am Soc Nephrol JASN (2015) 26:2388–97. doi: 10.1681/ASN.2014070665
23
Agardh E Lundstig A Perfilyev A Volkov P Freiburghaus T Lindholm E et al . Genome-Wide Analysis of DNA Methylation in Subjects With Type 1 Diabetes Identifies Epigenetic Modifications Associated With Proliferative Diabetic Retinopathy. BMC Med (2015) 13:182. doi: 10.1186/s12916-015-0421-5
24
Ollikainen M Ismail K Gervin K Kyllönen A Hakkarainen A Lundbom J et al . Genome-Wide Blood DNA Methylation Alterations at Regulatory Elements and Heterochromatic Regions in Monozygotic Twins Discordant for Obesity and Liver Fat. Clin Epigenet (2015) 7:39. doi: 10.1186/s13148-015-0073-5
25
Wahl S Drong A Lehne B Loh M Scott WR Kunze S et al . Epigenome-Wide Association Study of Body Mass Index, and the Adverse Outcomes of Adiposity. Nature (2017) 541:81–6. doi: 10.1038/nature20784
26
Jones P . Functions of DNA Methylation: Islands, Start Sites, Gene Bodies and Beyond. Nat Rev Genet (2012) 13:484–92. doi: 10.1038/nrg3230
27
Intine R Sarras M . Metabolic Memory and Chronic Diabetes Complications: Potential Role for Epigenetic Mechanisms. Curr Diabetes Rep (2012) 12:551–9. doi: 10.1007/s11892-012-0302-7
28
Nilsson E Matte A Perfilyev A de Mello VD Käkelä P Pihlajamäki J et al . Epigenetic Alterations in Human Liver From Subjects With Type 2 Diabetes in Parallel With Reduced Folate Levels. J Clin Endocrinol Metab (2015) 100:E1491–501. doi: 10.1210/jc.2015-3204
29
Yadav D Shrestha S Lillycrop K Joglekar CV Pan H Holbrook JD et al . Vitamin B Supplementation Influences Methylation of Genes Associated With Type 2 Diabetes and Its Intermediate Traits. Epigenomics (2018) 10:71–90. doi: 10.2217/epi-2017-0102
Summary
Keywords
type 2 diabetes, genomic DNA methylation, chronic complications, diabetic peripheral neuropathy, LC-MS/MS
Citation
Wang X, Yang W, Zhu Y, Zhang S, Jiang M, Hu J and Zhang H-H (2022) Genomic DNA Methylation in Diabetic Chronic Complications in Patients With Type 2 Diabetes Mellitus. Front. Endocrinol. 13:896511. doi: 10.3389/fendo.2022.896511
Received
15 March 2022
Accepted
20 May 2022
Published
29 June 2022
Volume
13 - 2022
Edited by
Bin Lu, Fudan University, China
Reviewed by
Naishi Li, Peking Union Medical College Hospital (CAMS), China; Pawan Kumar Kare, Gandhi Medical College Bhopal, India
Updates
Copyright
© 2022 Wang, Yang, Zhu, Zhang, Jiang, Hu and Zhang.
This is an open-access article distributed under the terms of the Creative Commons Attribution License (CC BY). The use, distribution or reproduction in other forums is permitted, provided the original author(s) and the copyright owner(s) are credited and that the original publication in this journal is cited, in accordance with accepted academic practice. No use, distribution or reproduction is permitted which does not comply with these terms.
*Correspondence: Hong-Hong Zhang, zhh55022@sina.com; Ji Hu, huji@suda.edu.cn
†These authors have contributed equally to this work
This article was submitted to Neuroendocrine Science, a section of the journal Frontiers in Endocrinology
Disclaimer
All claims expressed in this article are solely those of the authors and do not necessarily represent those of their affiliated organizations, or those of the publisher, the editors and the reviewers. Any product that may be evaluated in this article or claim that may be made by its manufacturer is not guaranteed or endorsed by the publisher.