Abstract
Background and Aim:
Non-alcoholic fatty liver disease (NAFLD) is closely related to cardiovascular diseases (CVD). A newly proposed definition is metabolic dysfunction-associated fatty liver disease (MAFLD), which was changed from NAFLD. The clinical effect of this change on abnormalities of cardiac structure and function is yet unknown. We aimed to examine whether MAFLD is associated with left ventricular (LV) diastolic dysfunction (LVDD) and cardiac remolding and further identify the impact of different subgroups and severity of MAFLD.
Method:
We evaluated 228 participants without known CVDs. Participants were categorized by the presence of MAFLD and the normal group. Then, patients with MAFLD were subclassified into three subgroups: MAFLD patients with diabetes (diabetes subgroup), overweight/obesity patients (overweight/obesity subgroup), and lean/normal-weight patients who had two metabolic risk abnormalities (lean metabolic dysfunction subgroup). Furthermore, the severity of hepatic steatosis was assessed by transient elastography (FibroScan®) with a controlled attenuation parameter (CAP), and patients with MAFLD were divided into normal, mild, moderate, and severe hepatic steatosis groups based on CAP value. Cardiac structure and function were examined by echocardiography.
Results:
LVDD was significantly more prevalent in the MAFLD group (24.6% vs. 60.8%, p < 0.001) compared to the normal group. The overweight subgroup and diabetes subgroup were significantly associated with signs of cardiac remolding, including interventricular septum thickness, LV posterior wall thickness, left atrial diameter (all p < 0.05), relative wall thickness, and LV mass index (all p < 0.05). Additionally, moderate-to-to severe steatosis patients had higher risks for LVDD and cardiac remolding (all p-values < 0.05).
Conclusion:
MAFLD was associated with LVDD and cardiac remolding, especially in patients with diabetes, overweight patients, and moderate-to-to severe steatosis patients. This study provides theoretical support for the precise prevention of cardiovascular dysfunction in patients with MAFLD.
Introduction
Non-alcoholic fatty liver disease (NAFLD) has become a common metabolic disease worldwide, with the estimated prevalence of a quarter of the population (1) and is an independent risk factor for cardiovascular diseases (CVDs) (2, 3). It is a clinicopathological syndrome characterized by diffuse hepatocellular bullae fat, excluding excessive alcohol consumption and other clearly defined causes of liver damage (4). In 2020, an international panel of experts reached a consensus to change the name from NAFLD to metabolic dysfunction-associated fatty liver disease (MAFLD); this new definition does not require exclusion of patients with alcohol consumption, or other chronic liver diseases, and the presence of metabolic abnormalities in lean and normal-weight fatty liver patients and is a more appropriate overarching term than the former name NAFLD (5, 6). Therefore, the renaming of fatty liver diseases may have different effects on the results of some clinical studies (7).
Importantly, the main cause of death in patients with NAFLD is CVDs, rather than hepatic causes (8). MAFLD is a kind of heterogeneous disease, which can be categorized into different subtypes based on the inclusion criteria, and the effects on CVDs might be different in MAFLD subtypes (9). Abnormalities of left ventricular (LV) diastolic function and cardiac structure may have no obvious clinical manifestations in the early stage, but the progression of the disease can induce heart failure or other life-threatening cases. In recent years, some studies have investigated whether hepatic adipose deposition has adverse effects on cardiac structure and function, especially research on a relationship between different subtypes and severity of fatty liver and risk of CVDs (10–12). There are differences in long-term outcomes among MAFLD patients with different diagnostic criteria, and some subtypes may have higher risks of all-cause mortality, which is of great significance for the precise prevention of poor prognosis (9). However, the correlation between MAFLD and abnormalities of LV diastolic function and cardiac structure is lacking. In this study, Doppler echocardiography was used to assess differences in LV structure and diastolic function among subtypes and the severity of MAFLD patients. It is helpful to identify early intervention and actively monitor high-risk population groups to avoid serious heart damage.
Methods
Study Participants
This cross-sectional study population consisted of patients who visit the metabolic disease center in Hangzhou Normal University Affiliated Hospital and were enrolled between March 2021 and May 2022 in the Hangzhou Normal University Affiliated Hospital for health examinations. The baseline characteristics were compared among the groups. All subjects were assessed by imaging techniques to investigate the clinical association between MAFLD and LV diastolic dysfunction (LVDD) and cardiac remolding. This study protocol and analysis of the data were approved by the institutional review board of the hospital.
A total of 332 participants were initially evaluated, 30 (9.04%) individuals were excluded because of the absence of the echocardiographic images, 28 (8.43%) individuals were removed because of lack of complete laboratory tests, and 46 (13.86%) individuals were excluded because of history of CVDs including heart failure, ischemic heart disease, severe arrhythmia, and moderate or severe valvular heart disease. Finally, a total number of 228 subjects were included in this study. The evaluation of screening programs is presented in Figure 1.
Figure 1

Flowchart of enrolled study participants.
Clinical Assessment and Laboratory Measurements
Demographics, medical history, waist circumference, and social habits including smoking and alcohol consumption, were obtained via an outpatient collection at the first visit. Smoking status was categorized into never, past, or current smoking. Current smoking was defined as having smoked at least 1 cigarette per day; history of alcohol consumption was categorized into never, past, little drinking (1–19 g/day), moderate drinking (20–39 g/day), and excessive drinking (≥40 g/day). Body mass index (BMI) was calculated as weight (kg) divided by the square of the height (m). Waist circumference was measured at the midpoint between the lower ribs and the iliac crest after normal expiration. Blood pressure was measured on both sides and read by a mercury sphygmomanometer after at least 5 min of rest, and systolic and diastolic blood pressure was recorded. Blood samples were collected from all participants after overnight fasting to determine laboratory parameters, such as cholesterol level, plasma glucose, related indexes of liver function, and inflammation.
Hypertension was defined as blood pressure ≥ 140/90 mmHg and/or current antihypertensive therapy. Diabetes was defined according to the 2020 China Guideline for Type 2 Diabetes. It mainly includes typical diabetes symptoms and one of the following conditions: fasting plasma glucose (FPG) level ≥7.0 mmol/L or random and postprandial blood glucose level ≥11.1 mmol/L or glycosylated hemoglobin (HbA1c) level ≥6.5%. Participants with a previous history of diabetes or the current use of glucose-lowering agents were also regarded as current diabetic patients.
Measurements of Hepatic Steatosis and Fibrosis
Abdominal ultrasound (Philips Epiq 7C Color Doppler ultrasound diagnostic instrument) or transient elastography (FibroScan® 501, Echosens, Paris, France) was used to diagnose fatty liver, and it was also confirmed that it was done by trained radiologists who were blinded to the data of all participants, including general information, laboratory data, and echocardiography. The severity of hepatic steatosis was estimated using controlled attenuation parameter (CAP) values, which were examined by FibroScan®. According to CAP value, the severity of fatty liver was categorized into three grades, which have respectively established cutoff values of 248, 268, and 280 dB/m for >S0, >S1, and >S2 and described as mild, moderate, or severe hepatic steatosis (13). The liver stiffness measurements (LSMs) in each patient were also measured, and their median value was computed. The LSM was stated in kilopascals. For the LSM cut-off value, ≥8.0 kPa is used for ruling in liver fibrosis (14).
Diagnosis of Metabolic Dysfunction-Associated Fatty Liver Disease
MAFLD was diagnosed by the international expert consensus statement in 2020 (15). The criteria include evidence of hepatic steatosis and meanwhile complicated with any one of the following three conditions: overweight/obesity (BMI ≥ 23 kg/m2), presence of type 2 diabetes mellitus (T2DM), or lean/normal subjects with metabolic dysregulation. Metabolic dysfunction was defined as the concurrence of at least two metabolic risk abnormalities (Table 1).
Table 1
| The inclusion criteria of metabolic risk abnormalities |
|---|
|
The inclusion criteria of metabolic risk abnormalities.
SBP, systolic blood pressure; DBP, diastolic blood pressure; HDL-cholesterol, high-density lipoprotein cholesterol; HbA1c, hemoglobin A1c.
Subgroups of Metabolic Dysfunction-Associated Fatty Liver Disease
In this study, subgroups of MAFLD were classified by two methods. First, patients with MAFLD were divided into three subgroups according to their inclusion criteria, including diabetic patients (diabetes subgroup), non-diabetes but overweight/obesity patients (overweight/obesity subgroup), and lean/normal-weight patients who had two metabolic risk abnormalities (lean metabolic dysfunction subgroup). Since the histological steatosis severity is closely associated with CVD (16, 17), patients with MAFLD were divided into three grades—mild, moderate, and severe—based on the CAP cutoff value, as previously described.
Echocardiography
All participants were managed by professional sonographers using a Philips Epiq 7C Color Doppler Ultrasound diagnostic instrument, with X5-1 (1~5 MHz) probe. Before the examination, the patients were instructed to be quiet for at least 15 min while in a supine position or left decubitus position and to perform calm breathing. The measurement method was in accordance with the Chinese Adult Echocardiography Measurement guidelines. The images were analyzed by another experienced echocardiographer, blinded to who has hepatic steatosis. The parameters of cardiac structure, including left atrial diameter (LAD), LV end-diastolic diameter (LVEDD), interventricular septum thickness (IVST), and LV posterior wall thickness (LVPWT) were routinely measured. LV mass (LVM) was calculated with following formula: LVM= 0.8 X {1.04[(LVEDD+IVST+PWT)3 -(LVEDD)3 ]} + 0.6 g(18). Body surface area (BSA) was calculated by the following formula: 0.0061 × Height + 0.0124 × Weight − 0.0099. LVM index (LVMI) was calculated as LVM divided by the BSA. LV end-diastolic volume (LVEDV) is calculated by the following formula: 7.0/(2.4 + LVEDD) × LVEDD3. The relative wall thickness (RWT) was calculated by the formula (2 × PWT)/LVEDD, and increased RWT was defined as RWT > 0.42 (19). Peak velocities of the early (E) and late (A) phases of the mitral inflow were also measured, and an E/A ratio < 1 was considered as decreased diastolic function and defined as cardiac insufficiency. The LVDD was diagnosed by sonographers, and its prevalence was recorded.
Statistical Analysis
All continuous variables were expressed as mean and SD (mean ± SD). The proportions for categorical variables were represented as the number of cases in each category and percentages. Two data groups were compared using Student’s t-test and the ANOVA test when it was necessary to compare at least three data groups for continuous variables. The prevalence of LVDD was presented as the number of cases in each category and percentage using the chi-square test for linear-by-linear association. Additionally, the trend in the proportion of each subgroup in MAFLD and the prevalence of LVDD in MAFLD subgroups were analyzed using the Jonckheere–Terpstra test (Figure 2).
Figure 2
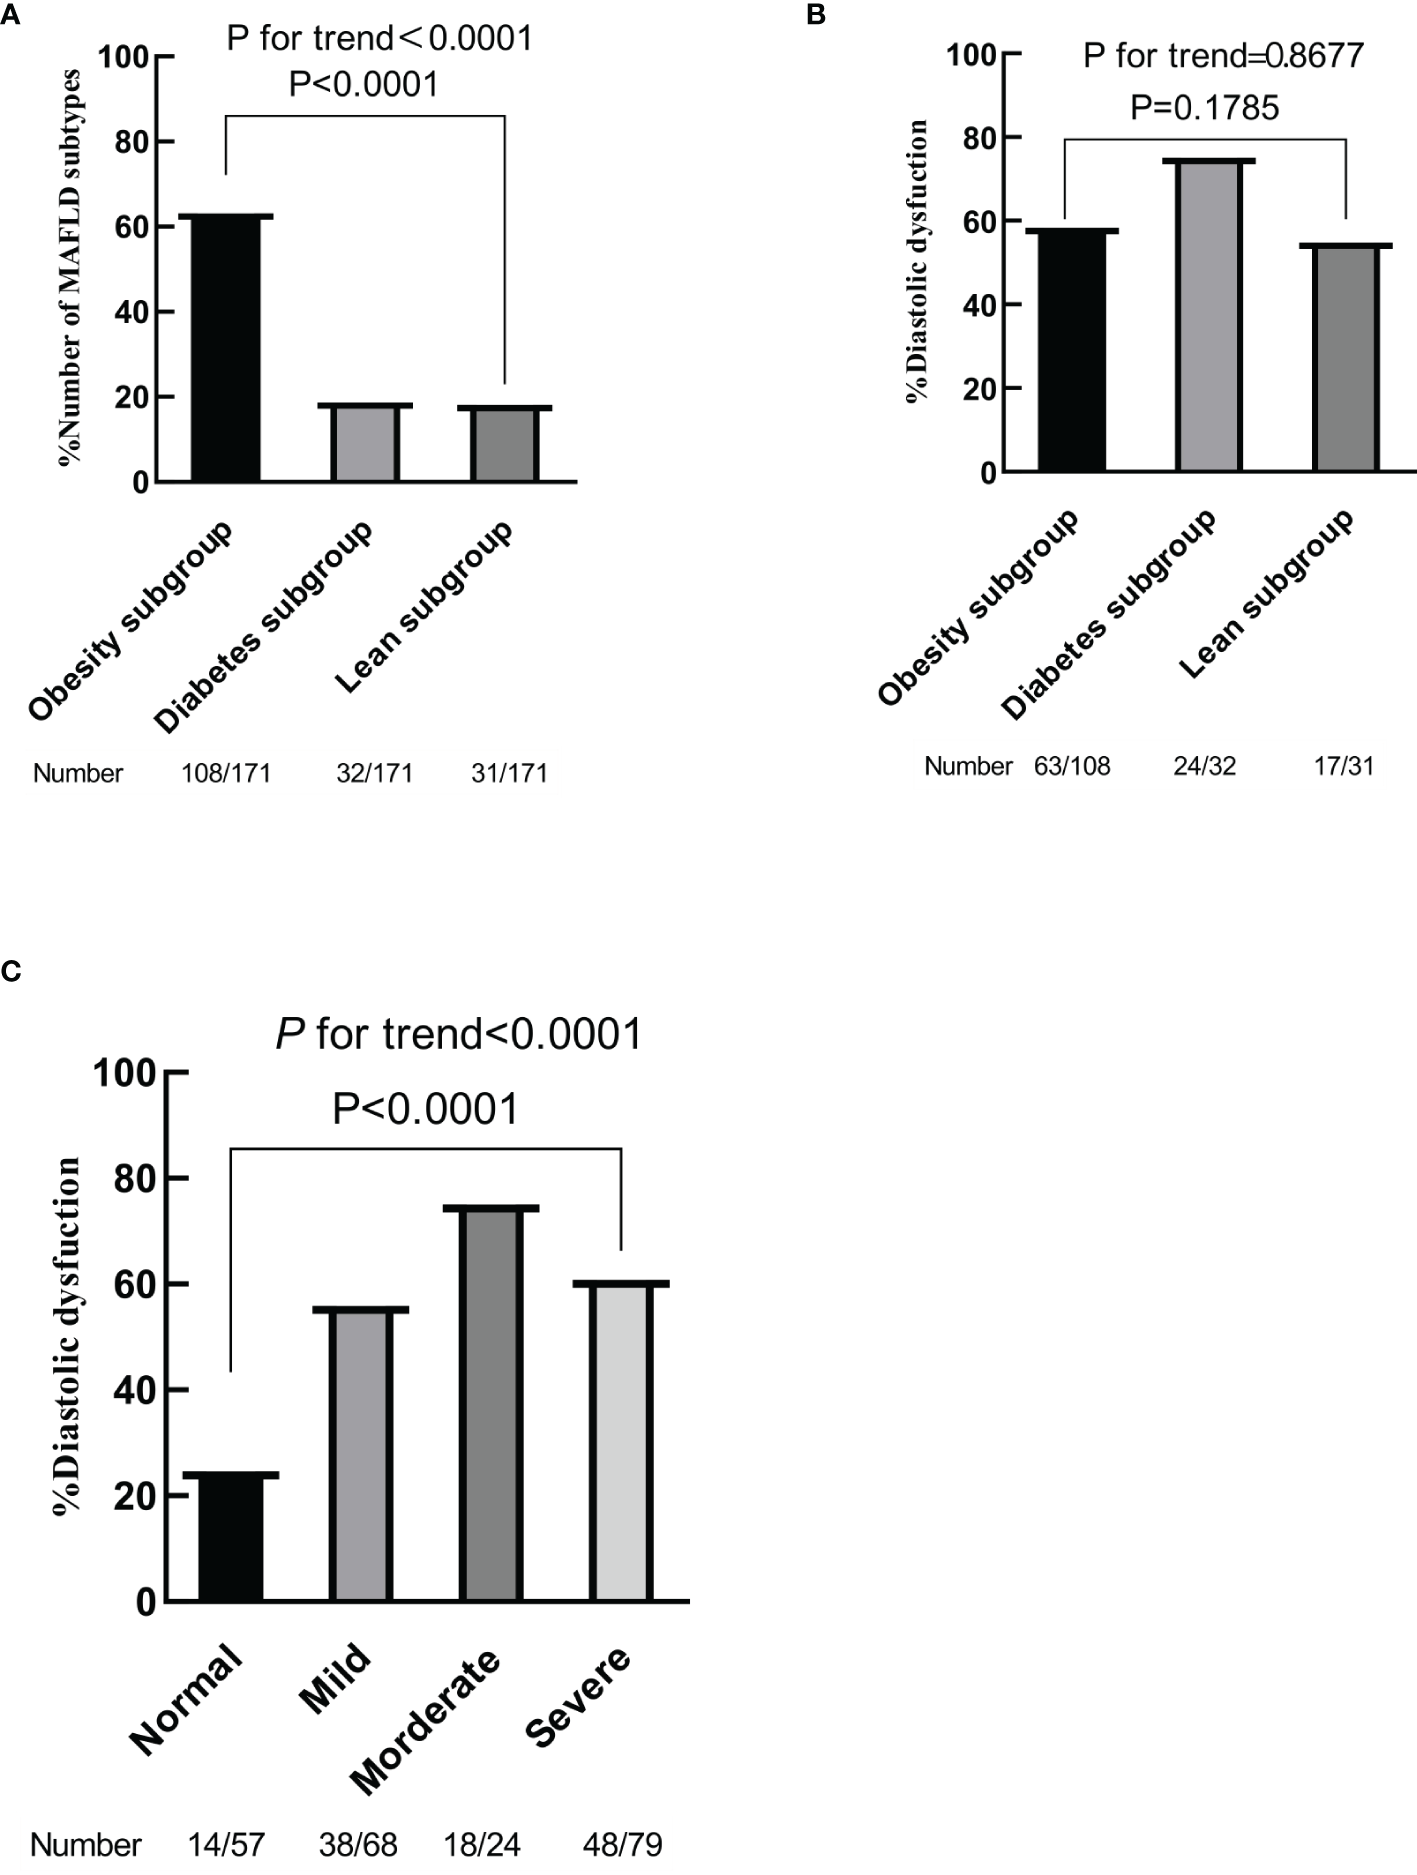
Prevalence of different metabolic dysfunction-associated fatty liver disease (MAFLD) subgroups (A). Prevalence of left ventricular diastolic dysfunction according to MAFLD subtypes (B). Prevalence of left ventricular diastolic dysfunction according to the degree of hepatic steatosis (C). p for trend by chi-square test for linear-by-linear association.
The analysis of the impact of hepatic steatosis on the cardiac structure was done in 2 steps. First, differences in the echocardiographic parameters between groups of patients with hepatic steatosis and no steatosis were analyzed using Student’s t-test (Table 2) and comparison between subgroups of MAFLD using the ANOVA test (Tables 3, 4). Meanwhile, the relationship between liver fibrosis and cardiac structure was analyzed in Table 5. Second, a series of multivariable linear regression analyses were applied to assess the influence of different subgroups of MAFLD on echocardiographic parameters of cardiac structure with a 95% CI, after controlling for potential confounding factors. Model 2 was adjusted for age, sex, smoking, alcohol consumption, BMI and hypertension and further adjusted for alanine transaminase (ALT), aspartate transaminase (AST), and total cholesterol (TC) in Model 3. The p-values in all cases were calculated, and it was considered that there is a statistically significant difference between the means of the compared groups when the p-value was less than 0.05. Statistical analyses were performed using SPSS version 21.0 software (IBM Corp., Armonk, NY, USA).
Table 2
| Characteristics | Normal | MAFLD | p-Value |
|---|---|---|---|
| (N = 57) | (N = 171) | ||
| Age (years) | 40.89 ± 12.91 | 48.84 ± 11.64 | <0.001 |
|
Sex (female/male)
Male Female |
33 (57.9%) 24 (42.1%) |
121 (70.8%) 50 (29.2%) |
0.102 |
| Type 2 diabetes mellitus (%) | 2 (3.5%) | 32 (18.7%) | 0.004 |
| Hypertension (%) | 18 (31.6%) | 105 (61.4%) | <0.001 |
|
Smoking habit
Never Presence Quitting |
2 (3.5%) | 32 (18.7%) | 0.004 |
|
Dairy alcohol consumption (g/day)
0 1–19 20–39 ≥40 |
45 (78.9%) 10 (17.5%) 0 (0%) 2 (3.5%) |
125 (73.1%) 39 (22.8%) 3 (1.8%) 4 (2.3%) |
0.579 |
| Height (cm) | 167.01 ± 9.21 | 167.19 ± 7.17 | 0.894 |
| Weight (kg) | 65.07 ± 11.87 | 71.73 ± 11.28 | <0.001 |
| Body mass index (kg/m2) | 23.12 ± 3 | 25.57 ± 3.05 | <0.001 |
| Waist circumference (cm) | 83.56 ± 11.52 | 92 ± 9.01 | <0.001 |
| Left SBP (mmHg) | 125.36 ± 18.61 | 137.56 ± 20.48 | <0.001 |
| Left DBP (mmHg) | 83.47 ± 10.99 | 90.94 ± 13.08 | <0.001 |
| Right SBP (mmHg) | 127.24 ± 18.83 | 139.45 ± 20.78 | <0.001 |
| Right DBP (mmHg) | 85.12 ± 11.11 | 92.06 ± 12.9 | <0.001 |
| Red blood cell count (×1012/L) | 4.76 ± 0.58 | 4.89 ± 0.45 | 0.118 |
| MCHC (g/L) | 331.75 ± 29.8 | 336.89 ± 10.6 | 0.207 |
| White blood cell count (×109/L) | 5.85 ± 1.3 | 6.45 ± 1.71 | 0.017 |
| Neutrophil count (×109/L) | 3.34 ± 1.08 | 3.95 ± 1.43 | 0.001 |
| Platelet count (×109/L) | 230.78 ± 47.2 | 229.46 ± 70.61 | 0.895 |
| ALT (U/L) | 25.43 ± 23.16 | 33.2 ± 28.26 | 0.062 |
| AST (U/L) | 24.21 ± 10.03 | 27.4 ± 24.21 | 0.334 |
| Lactate dehydrogenase (U/L) | 169.42 ± 34.05 | 186.52 ± 76.03 | 0.102 |
| γ-GGT (U/L) | 29.4 ± 30.05 | 39.53 ± 39.39 | 0.077 |
| ALP (U/L) | 75.8 ± 26.61 | 84.28 ± 20.16 | 0.012 |
| Total protein (g/L) | 72.31 ± 3.46 | 71.11 ± 4.58 | 0.041 |
| Albumin (g/L) | 44.59 ± 3.36 | 43.66 ± 3.25 | 0.065 |
| Globulin (g/L) | 27.54 ± 4.3 | 27.33 ± 3.24 | 0.701 |
| Total bilirubin (μmol/L) | 16.54 ± 8.41 | 15.07 ± 5.62 | 0.222 |
| Triglyceride (mmol/L) | 1.18 ± 0.73 | 1.91 ± 1.18 | <0.001 |
| Total cholesterol (mmol/L) | 4.89 ± 1.07 | 4.57 ± 1.08 | 0.055 |
| HDL‐cholesterol (mmol/L) | 1.35 ± 0.26 | 1.13 ± 0.31 | <0.001 |
| LDL‐cholesterol (mmol/L) | 2.89 ± 0.72 | 2.76 ± 0.75 | 0.262 |
| Fasting blood glucose (mmol/L) | 5.42 ± 0.51 | 6.27 ± 1.87 | <0.001 |
| BUN (mmol/L) | 4.93 ± 1.13 | 5.27 ± 1.46 | 0.116 |
| Creatinine (mmol/L) | 68.6 ± 16.01 | 73.86 ± 18.58 | 0.057 |
| Uric acid (μmol/L) | 330 ± 75.18 | 373.59 ± 89.06 | <0.001 |
| CRP (mg/L) | 1.08 ± 1.48 | 2 ± 4.29 | 0.017 |
| HbA1c (%) | 5.55 ± 0.4 | 5.96 ± 1.04 | <0.001 |
| CAP (dB/m) | 219.75 ± 20.31 | 287.4 ± 34.79 | <0.001 |
| LSM (kPa) | 4.55 ± 0.92 | 5.27 ± 1.33 | <0.001 |
| IVST (mm) | 0.93 ± 0.11 | 1.05 ± 0.14 | <0.001 |
| LVPWT (mm) | 0.89 ± 0.1 | 0.98 ± 0.1 | <0.001 |
| LVEDD (mm) | 4.57 ± 0.4 | 4.73 ± 0.38 | 0.010 |
| LA diameter (mm) | 3.21 ± 0.41 | 3.39 ± 0.41 | 0.004 |
| RWT | 0.39 ± 0.04 | 0.41 ± 0.05 | <0.001 |
| LVEDV (ml) | 97.3 ± 19.81 | 104.98 ± 19.83 | 0.012 |
| LVM (g) | 142.02 ± 34.75 | 172.64 ± 37.22 | <0.001 |
| LVMI (BSA) | 78.06 ± 17.28 | 90.91 ± 18.18 | <0.001 |
| LVDD (%) | 14 (24.6%) | 104 (60.8%) | <0.001 |
Characteristics of the study samples.
Values are mean ( ± SD). Statistically significant values are highlighted in bold (P<0.05).
SBP, systolic blood pressure; DBP, diastolic blood pressure; MCHC, mean corpuscular hemoglobin concentration; AST, aspartate aminotransferase; ALT, alanine aminotransferase; γ-GGT, gamma-glutamyl transpeptidase; ALP, alkaline phosphatase; HDL-cholesterol, high-density lipoprotein cholesterol; LDL-cholesterol, low-density lipoprotein cholesterol; CRP, C-reactive protein; HbA1c, hemoglobin A1c; CAP, controlled attenuation parameter; LSM, liver stiffness measurements; BSA, body surface area; IVST, interventricular septum thickness; LVPWT, left ventricular posterior wall thickness; LA, left atrial; RWT, relative wall thickness; LVEDD, left ventricular end-diastolic diameter; LVM, left ventricular mass; LVMI, left ventricular mass index; LVDD, left ventricular diastolic dysfunction.
Table 3
| MAFLD | ||||
|---|---|---|---|---|
| Characteristics | Obesity subgroup | Diabetes subgroup | Lean subgroup | p-Value |
| (N = 108) | (N = 32) | (N = 31) | ||
| Age (years) | 46.47 ± 10.87 | 55.84 ± 10.37 | 49.9 ± 12.72 | <0.001*+ |
|
Sex (female/male)
Male Female |
79 (73.1%) 29 (26.9%) |
25 (78.1%) 7 (21.9%) |
17 (54.8%) 14 (45.2%) |
0.085 |
| Type 2 diabetes mellitus (%) | 0 (0%) | 32 (100%) | 0 (0%) | <0.001*#+ |
| Hypertension (%) | 70 (64.8%) | 20 (62.5%) | 15 (48.4%) | 0.251 |
|
Smoking habit
Never Presence Quitting |
76 (70.4%) 26 (24.1%) 6 (5.4%) |
25 (78.1%) 7 (21.9%) 0 (0%) |
25 (80.6%) 6 (19.4%) 0 (0%) |
0.380 |
|
Dairy alcohol consumption (g/day)
0 1–19 20–39 ≥40 |
75 (69.4%) 27 (25.0%) 2 (1.9%) 4 (3.7%) |
22 (68.8%) 9 (28.1%) 1 (3.1%) 0 (0%) |
28 (90.3%) 3 (9.7%) 0 (0%) 0 (0%) |
0.258 |
| Height (cm) | 167.52 ± 6.59 | 166.96 ± 7.09 | 166.25 ± 9.13 | 0.675 |
| Weight (kg) | 74.92 ± 9.6 | 72.41 ± 12.15 | 59.91 ± 7.63 | <0.001#+ |
| Body mass index (kg/m2) | 26.63 ± 2.41 | 25.85 ± 3.07 | 21.61 ± 1.41 | <0.001#+ |
| Waist circumference (cm) | 94.72 ± 7.76 | 91.31 ± 9.4 | 83.22 ± 6.82 | <0.001*#+ |
| Left SBP (mmHg) | 138.02 ± 20.53 | 141.31 ± 21.09 | 132.09 ± 19.18 | 0.189 |
| Left DBP (mmHg) | 92.3 ± 13.02 | 90.56 ± 14.49 | 86.61 ± 11.05 | 0.010# |
| Right SBP (mmHg) | 139.55 ± 21.09 | 142.96 ± 20.96 | 135.48 ± 19.42 | 0.361 |
| Right DBP (mmHg) | 93.42 ± 13.45 | 92.28 ± 12.27 | 87.09 ± 10.47 | 0.054 |
| Red blood cell count (×1012/L) | 4.97 ± 0.42 | 4.86 ± 0.5 | 4.66 ± 0.42 | 0.003# |
| MCHC (g/L) | 337.24 ± 10.53 | 337.21 ± 12.81 | 335.35 ± 8.26 | 0.673 |
| White blood cell count (×109/L) | 6.55 ± 1.78 | 6.51 ± 1.54 | 6.03 ± 1.63 | 0.324 |
| Neutrophil count (×109/L) | 3.99 ± 1.5 | 3.96 ± 1.12 | 3.84 ± 1.5 | 0.880 |
| Platelet count (×109/L) | 233.61 ± 80.02 | 217.59 ± 48.18 | 227.25 ± 52.9 | 0.523 |
| ALT (U/L) | 35.74 ± 27.35 | 36.4 ± 39.12 | 21.06 ± 9.52 | 0.029#+ |
| AST (U/L) | 29.01 ± 28.59 | 27.12 ± 17.99 | 22.09 ± 5.71 | 0.375 |
| Lactate dehydrogenase (U/L) | 191.75 ± 91.08 | 175.06 ± 30.01 | 180.12 ± 44.27 | 0.485 |
| γ-GGT (U/L) | 42.09 ± 33.9 | 44.43 ± 63.71 | 25.54 ± 15.81 | 0.088 |
| ALP (U/L) | 83.34 ± 19.38 | 92.03 ± 22.85 | 79.54 ± 18.23 | 0.035*+ |
| Total protein (g/L) | 71.58 ± 4.51 | 69.64 ± 4.84 | 71 ± 4.31 | 0.106 |
| Albumin (g/L) | 44.01 ± 2.79 | 42.96 ± 3.15 | 43.16 ± 4.54 | 0.176 |
| Globulin (g/L) | 27.57 ± 3.19 | 26.66 ± 3.69 | 27.19 ± 2.87 | 0.366 |
| Total bilirubin (μmol/L) | 15.3 ± 5.95 | 14.31 ± 4.18 | 15.04 ± 5.85 | 0.686 |
| Triglyceride (mmol/L) | 2.01 ± 1.22 | 1.75 ± 0.91 | 1.7 ± 1.28 | 0.302 |
| Total cholesterol (mmol/L) | 4.64 ± 1.07 | 4.26 ± 1.14 | 4.65 ± 1.04 | 0.204 |
| HDL‐cholesterol (mmol/L) | 1.1 ± 0.23 | 1.05 ± 0.2 | 1.3 ± 0.55 | 0.003#+ |
| LDL‐cholesterol (mmol/L) | 2.84 ± 0.7 | 2.54 ± 0.83 | 2.7 ± 0.82 | 0.121 |
| Fasting glucose (mmol/L) | 5.72 ± 0.76 | 8.62 ± 3.02 | 5.76 ± 1.08 | <0.001*+ |
| BUN (mmol/L) | 5.14 ± 1.51 | 5.74 ± 1.51 | 5.22 ± 1.15 | 0.122 |
| Creatinine (mmol/L) | 75.52 ± 19.07 | 71.99 ± 17.67 | 70 ± 17.54 | 0.284 |
| Uric acid (μmol/L) | 395.15 ± 92.8 | 343.28 ± 71.17 | 329.8 ± 66.04 | <0.001*# |
| CRP (mg/L) | 1.81 ± 2.83 | 2.64 ± 6.65 | 2.03 ± 5.41 | 0.633 |
| HbA1c (%) | 5.6 ± 0.39 | 7.55 ± 1.47 | 5.61 ± 0.34 | <0.001*+ |
| CAP (dB/m) | 292.29 ± 34.3 | 286.84 ± 36.4 | 270.96 ± 30.49 | 0.010# |
| LSM (kPa) | 5.34 ± 1.47 | 5.55 ± 1.06 | 4.72 ± 0.87 | 0.029#+ |
| Visceral fat (cm2) | 82.67 ± 34.01 | 88.59 ± 24 | 56.7 ± 17.58 | <0.001#+ |
| Abdominal subcutaneous fat (cm2) | 199.26 ± 73.47 | 161.9 ± 64.72 | 130.48 ± 36.11 | <0.001*# |
| IVST (mm) | 1.04 ± 0.12 | 1.13 ± 0.2 | 0.97 ± 0.11 | <0.001*#+ |
| LVPWT (mm) | 0.99 ± 0.09 | 1.04 ± 0.09 | 0.89 ± 0.1 | <0.001*#+ |
| LVEDD (mm) | 4.76 ± 0.37 | 4.77 ± 0.32 | 4.56 ± 0.4 | 0.024#+ |
| LA diameter (mm) | 3.45 ± 0.41 | 3.45 ± 0.37 | 3.14 ± 0.37 | 0.001#+ |
| RWT | 0.41 ± 0.04 | 0.44 ± 0.05 | 0.39 ± 0.04 | 0.001*#+ |
| LVEDV (ml) | 106.87 ± 19.9 | 106.68 ± 16.96 | 96.63 ± 20.75 | 0.034#+ |
| LVM (g) | 174.89 ± 34.02 | 190.9 ± 34.06 | 145.96 ± 37.61 | <0.001*#+ |
| LVMI (BSA) | 90.26 ± 17.19 | 100.46 ± 17.01 | 83.32 ± 19 | 0.001*+ |
| LVDD (%) | 63 (58.3%) | 24 (75.0%) | 17 (54.8%) | 0.179 |
Characteristics of different MAFLD subgroups.
Values are mean ( ± SD). Statistically significant values are highlighted in bold (P<0.05).
SBP, systolic blood pressure; DBP, diastolic blood pressure; MCHC, mean corpuscular hemoglobin concentration; AST, aspartate aminotransferase; ALT, alanine aminotransferase; γ-GGT, gamma-glutamyl transpeptidase; ALP, alkaline phosphatase; HDL-cholesterol, high-density lipoprotein cholesterol; LDL-cholesterol, low-density lipoprotein cholesterol; CRP, C-reactive protein; HbA1c, hemoglobin A1c; CAP, controlled attenuation parameter; LSM, liver stiffness measurements; BSA, body surface area; IVST, interventricular septum thickness; LVPWT, left ventricular posterior wall thickness; LA, left atrial; RWT, relative wall thickness; LVEDD, left ventricular end-diastolic diameter; LVM, left ventricular mass; LVMI, left ventricular mass index; LVDD, left ventricular diastolic dysfunction.
*p < 0.05 obesity subgroup vs. diabetes subgroup.
#p < 0.05 obesity subgroup vs. lean subgroup.
+p < 0.05 diabetes subgroup vs. lean subgroup.
Table 4
| Characteristics | Normal | Mild | Moderate | Severe | p-Value |
|---|---|---|---|---|---|
| CAP < 248 | 248 ≤ CAP < 268 | 268 ≤ CAP ≤ 80 | CAP > 280 | ||
| (N = 57) | (N = 68) | (N = 24) | (N = 79) | ||
| Age (years) | 40.89 ± 12.91 | 49.22 ± 12.03 | 51.58 ± 10.50 | 47.69 ± 11.6 | <0.001 |
|
Sex (female/male)
Male Female |
33 (57.9%) 24 (42.1%) |
47 (69.1%) 21 (30.9%) |
14 (58.3%) 10 (41.7%) |
60 (75.9%) 19 (24.1%) |
0.113 |
| Type 2 diabetes mellitus (%) | 2 (3.5%) | 12 (17.6%) | 5 (20.8%) | 15 (19.0%) | 0.047 |
| Hypertension (%) | 18 (31.6%) | 39 (57.4%) | 15 (62.5%) | 51 (64.6%) | 0.001 |
|
Smoking habit
Never Presence Quitting |
49 (86.0%) 7 (12.3%) 1 (1.8%) |
52 (76.5%) 15 (22.1%) 1 (1.5%) |
19 (79.2%) 4 (16.7%) 1 (4.2%) |
55 (69.6%) 20 (25.3%) 4 (5.1%) |
0.397 |
|
Dairy alcohol consumption (g/day)
0 1–19 20–39 ≥40 |
45 (78.9%) 10 (17.5%) 0 (0%) 2 (3.5%) |
53 (77.9%) 14 (20.6%) 0 (0%) 1 (1.5%) |
19 (79.2%) 4 (16.7%) 1 (4.2%) 0 (0%) |
53 (67.1%) 21 (26.6%) 2 (2.5%) 3 (3.8%) |
0.521 |
| Height (cm) | 167.01 ± 9.21 | 167.85 ± 7.77 | 162.87 ± 6.00 | 167.93 ± 6.56 | 0.044 |
| Weight (kg) | 65.07 ± 11.87 | 68.46 ± 9.68 | 65.45 ± 8.56 | 76.45 ± 11.46 | <0.001 |
| Body mass index (kg/m2) | 23.12 ± 3 | 24.24 ± 2.5 | 24.67 ± 2.86 | 27 ± 2.94 | <0.001 |
| Waist circumference (cm) | 83.56 ± 11.52 | 88.14 ± 7.85 | 88.16 ± 7.2 | 96.48 ± 8.41 | <0.001 |
| Left SBP (mmHg) | 125.36 ± 18.61 | 137.08 ± 19.09 | 141.08 ± 24.77 | 136.91 ± 20.4 | 0.002 |
| Left DBP (mmHg) | 83.47 ± 10.99 | 90.32 ± 11.57 | 89.33 ± 13.22 | 91.97 ± 14.3 | 0.001 |
| Right SBP (mmHg) | 127.24 ± 18.83 | 139.36 ± 18.55 | 141.87 ± 25.96 | 138.79 ± 21.09 | 0.002 |
| Right DBP (mmHg) | 85.12 ± 11.11 | 91.82 ± 11.27 | 90.04 ± 13.92 | 92.88 ± 13.95 | 0.001 |
| Red blood cell count (×1012/L) | 4.76 ± 0.58 | 4.78 ± 0.47 | 4.76 ± 0.46 | 5.03 ± 0.4 | 0.002 |
| MCHC (g/L) | 331.75 ± 29.8 | 336.08 ± 10.54 | 335.58 ± 11.85 | 337.98 ± 10.29 | 0.233 |
| White blood cell count (×109/L) | 5.85 ± 1.3 | 6.16 ± 1.39 | 5.94 ± 1.51 | 6.85 ± 1.93 | 0.001 |
| Neutrophil count (×109/L) | 3.34 ± 1.08 | 3.75 ± 1.12 | 3.89 ± 1.65 | 4.15 ± 1.58 | 0.007 |
| Platelet count (×109/L) | 230.78 ± 47.2 | 229.27 ± 92.01 | 221.45 ± 52.85 | 232.05 ± 52.38 | 0.870 |
| ALT (U/L) | 25.43 ± 23.16 | 30 ± 29.34 | 24.87 ± 13.04 | 38.49 ± 29.87 | 0.021 |
| AST (U/L) | 24.21 ± 10.03 | 29.33 ± 36.07 | 23.04 ± 6.63 | 27.07 ± 11.73 | 0.454 |
| Lactate dehydrogenase (U/L) | 169.42 ± 34.05 | 191.51 ± 114.56 | 185.87 ± 29.48 | 182.43 ± 32.13 | 0.347 |
| γ-GGT (U/L) | 29.4 ± 30.05 | 31.66 ± 21.46 | 32.87 ± 24.65 | 48.32 ± 51.59 | 0.015 |
| ALP (U/L) | 75.8 ± 26.61 | 84.54 ± 20.25 | 88.08 ± 17.43 | 82.89 ± 20.91 | 0.088 |
| Total protein (g/L) | 72.31 ± 3.46 | 70.74 ± 4.94 | 70.74 ± 4.32 | 71.55 ± 4.33 | 0.223 |
| Albumin (g/L) | 44.59 ± 3.36 | 43.15 ± 4.02 | 43.45 ± 2.87 | 44.16 ± 2.51 | 0.089 |
| Globulin (g/L) | 27.54 ± 4.3 | 27.29 ± 3.23 | 27.28 ± 2.89 | 27.37 ± 3.38 | 0.977 |
| Total bilirubin (μmol/L) | 16.54 ± 8.41 | 14.71 ± 5.06 | 15.52 ± 7.55 | 15.24 ± 5.47 | 0.322 |
| Triglyceride (mmol/L) | 1.18 ± 0.73 | 1.92 ± 1.28 | 1.6 ± 1.08 | 1.99 ± 1.12 | <0.001 |
| Total cholesterol (mmol/L) | 4.89 ± 1.07 | 4.46 ± 0.98 | 4.5 ± 1.3 | 4.69 ± 1.1 | 0.141 |
| HDL‐cholesterol (mmol/L) | 1.35 ± 0.26 | 1.19 ± 0.41 | 1.14 ± 0.3 | 1.07 ± 0.19 | <0.001 |
| LDL‐cholesterol (mmol/L) | 2.89 ± 0.72 | 2.61 ± 0.69 | 2.73 ± 0.95 | 2.9 ± 0.72 | 0.058 |
| Fasting blood glucose (mmol/L) | 5.42 ± 0.51 | 6.46 ± 2.37 | 6.16 ± 1.5 | 6.14 ± 1.45 | 0.004 |
| BUN (mmol/L) | 4.93 ± 1.13 | 5.25 ± 1.28 | 5.24 ± 1.43 | 5.29 ± 1.63 | 0.531 |
| Creatinine (mmol/L) | 68.6 ± 16.01 | 73.6 ± 19.54 | 71.22 ± 17.57 | 74.88 ± 18.18 | 0.338 |
| Uric acid (μmol/L) | 330 ± 75.18 | 351.08 ± 81.09 | 378.41 ± 84.65 | 391.51 ± 93.55 | 0.001 |
| CRP (mg/L) | 1.08 ± 1.48 | 1.29 ± 2.4 | 3.72 ± 7.99 | 2.1 ± 3.86 | 0.023 |
| HbA1c (%) | 5.55 ± 0.4 | 5.98 ± 1.03 | 6.03 ± 0.94 | 5.93 ± 1.09 | 0.036 |
| CAP (dB/m) | 219.75 ± 20.31 | 255.83 ± 6.01 | 272.75 ± 2.62 | 319.03 ± 25.64 | <0.001 |
| LSM (kPa) | 4.55 ± 0.92 | 5 ± 1.01 | 5.27 ± 1.22 | 5.5 ± 1.56 | 0.001 |
| IVST (mm) | 0.93 ± 0.11 | 1.02 ± 0.13 | 1.05 ± 0.15 | 1.07 ± 0.15 | <0.001 |
| LVPWT (mm) | 0.89 ± 0.1 | 0.96 ± 0.11 | 0.96 ± 0.1 | 1.01 ± 0.1 | <0.001 |
| LVEDD (mm) | 4.57 ± 0.4 | 4.72 ± 0.39 | 4.68 ± 0.47 | 4.75 ± 0.33 | 0.126 |
| LA diameter (mm) | 3.21 ± 0.41 | 3.29 ± 0.35 | 3.48 ± 0.70 | 3.46 ± 0.32 | 0.002 |
| RWT | 0.39 ± 0.04 | 0.4 ± 0.04 | 0.41 ± 0.06 | 0.42 ± 0.04 | 0.026 |
| LVEDV (ml) | 97.3 ± 19.81 | 104.74 ± 20.74 | 103.28 ± 25.75 | 105.7 ± 17.04 | 0.16 |
| LVM (g) | 142.02 ± 34.75 | 167.21 ± 39.81 | 167.68 ± 36.49 | 178.83 ± 34.55 | <0.001 |
| LVMI (BSA) | 78.06 ± 17.28 | 89.74 ± 20.31 | 93.55 ± 19.85 | 91.11 ± 15.7 | 0.004 |
| LVDD (%) | 14 (24.6%) | 38 (55.9%) | 18 (75.0%) | 48 (60.8%) | <0.001 |
Characteristics of different degrees of MAFLD patients (CAP subgroup).
Values are mean ( ± SD). Statistically significant values are highlighted in bold (P<0.05).
SBP, systolic blood pressure; DBP, diastolic blood pressure; MCHC, mean corpuscular hemoglobin concentration; AST, aspartate aminotransferase; ALT, alanine aminotransferase; γ-GGT, gamma-glutamyl transpeptidase; ALP, alkaline phosphatase; HDL-cholesterol, high-density lipoprotein cholesterol; LDL-cholesterol, low-density lipoprotein cholesterol; CRP, C-reactive protein; HbA1c, hemoglobin A1c; CAP, controlled attenuation parameter; LSM, liver stiffness measurements; BSA, body surface area; IVST, interventricular septum thickness; LVPWT, left ventricular posterior wall thickness; LA, left atrial; RWT, relative wall thickness; LVEDD, left ventricular end-diastolic diameter; LVM, left ventricular mass; LVMI, left ventricular mass index; LVDD, left ventricular diastolic dysfunction.
Table 5
| Characteristics | Normal | LSM < 8.0 | LSM ≥ 8.0 | p-Value |
|---|---|---|---|---|
| (N = 60) | (N = 164) | (N = 12) | ||
| IVST (mm) | 0.93 ± 0.11 | 1.04 ± 0.14 | 1.09 ± 0.12 | <0.001 |
| LVPWT (mm) | 0.89 ± 0.1 | 0.98 ± 0.1 | 1.03 ± 0.12 | <0.001 |
| LVEDD (mm) | 4.57 ± 0.4 | 4.73 ± 0.38 | 4.72 ± 0.27 | 0.035 |
| LA diameter (mm) | 3.21 ± 0.41 | 3.39 ± 0.41 | 3.4 ± 0.38 | 0.014 |
| RWT | 0.39 ± 0.04 | 0.41 ± 0.05 | 0.43 ± 0.05 | 0.001 |
| LVEDV (ml) | 97.3 ± 19.81 | 105.06 ± 20.25 | 103.89 ± 13.57 | 0.042 |
| LVM (g) | 142.02 ± 34.75 | 171.96 ± 37.47 | 181.63 ± 33.91 | <0.001 |
| LVMI (BSA) | 78.06 ± 17.28 | 90.81 ± 18.45 | 92.18 ± 14.66 | <0.001 |
Comparison of cardiac structure according to liver fibrosis status.
Values are mean ( ± SD). Statistically significant values are highlighted in bold (P<0.05).
LSM, liver stiffness measurements; IVST, interventricular septum thickness; LVPWT, left ventricular posterior wall thickness; LA, left atrial; RWT, relative wall thickness; LVEDD, left ventricular end-diastolic diameter; LVM, left ventricular mass; LVMI, left ventricular mass index.
Results
Clinical Characteristics
In the final analysis, a total of 228 participants were stratified by presence or absence of MAFLD, and their clinical, laboratory, and metabolic characteristics are stated in Table 2. Of the study subjects, the mean age (40.89 ± 12.91 vs. 48.84 ± 11.64) and sex were not significantly different. The incidence of type 2 diabetes (3.5% vs. 18.7%) and hypertension (31.6% vs. 61.4%) were higher in subjects with MAFLD (all p < 0.05), compared to normal people. Patients with MAFLD had significantly higher BMI, waistline, white blood cell count, neutrophil count, and metabolic parameters, such as triglyceride, fasting blood glucose (FBG), serum uric acid (UA), and HbA1c and lower levels of high-density lipoprotein cholesterol (HDL-cholesterol) as compared to those without MAFLD (all p < 0.05).
Then MAFLD patients were divided into 3 subgroups: 108 overweight/obesity patients (overweight/obesity subgroup), 32 patients with diabetes mellitus (diabetes subgroup), and 31 lean or normal-weight patients but with at least 2 metabolic risk abnormalities (lean metabolic dysfunction subgroup), according to the above method. Overweight/obesity MAFLD patients account for the largest proportion as shown in Figure 2A (63.16% vs. 18.71% vs. 18.13%; p < 0.000, p for trend < 0.000). As expected, there were differences in some pronounced metabolism abnormalities among the three subgroups, such as BMI, FBG, HbA1c, uric acid, and HDL-cholesterol (all p < 0.05 [Table 3]). Measures of abdominal subcutaneous fat tissue and waist circumference were the largest in the overweight/obesity subgroup, but the diabetes subgroup had higher content in visceral fat than the other two groups (all p < 0.05 [Table 3]).
Next, an analysis of the severity of hepatic steatosis found that moderate and severe hepatic steatosis had more undesirable clinical characteristics when compared to the mild steatosis group (Table 4). The value of serum uric acid, for instance, increases according to the severity of MAFLD (330.00 ± 75.18 in the normal group, 351.08 ± 81.09 in mild hepatic steatosis group, 378.41 ± 84.65 in moderate hepatic steatosis group, and 391.51 ± 93.55 in severe hepatic steatosis group; p = 0.001).
Association of Metabolic Dysfunction-Associated Fatty Liver Disease With Left Ventricular Diastolic Dysfunction and Cardiac Remolding (Echocardiographic Characteristics)
When compared to the normal group, more patients with MAFLD had LVDD (24.6% vs. 60.8%, p < 0.001 [Table 2]). We further assessed left diastolic function between each subgroup of MAFLD. There were no significant differences between the three groups as shown in Table 3 and Figure 2B (p = 0.1785, p for trend = 0.8677). In addition, we investigated the relationship between the severity of hepatic steatosis with MAFLD and LVDD by the same method as above. Moderate-to-to severe hepatic steatosis had higher prevalence of LVDD as shown in Table 4 and Figure 2C (p < 0.0001, p for trend < 0.0001).
Some markers of cardiac remolding demonstrated alterations in patients with MAFLD, manifested by increased IVST, LVPWT, LAD, RWT, LVM, and LVMI (all p < 0.05 [Table 2]). Then we analyzed the echocardiographic characteristics of MAFLD subgroups (Table 3). There were significant differences in echocardiographic parameters, including IVST, LVPWT, LVEDD, LA, RWT, LVEDV, LVM, and LVMI (all p < 0.05 [Table 3]). In particular, most indicators of the diabetes subgroup, compared with the other two groups, showed more obvious abnormalities. This result might indicate that different subgroups of MAFLD may affect the different degrees of the cardiac structure change. Furthermore, when the severity of hepatic steatosis was evaluated by CAP measurement, the moderate-to-to severe hepatic steatosis group showed significantly increased markers of cardiac structure, including IVST, LVPWT, LAD, and LVM when compared with the normal and mild steatosis groups (all p < 0.05 [Table 4]). What is more, we analyzed the relationship between the presence of liver fibrosis with MAFLD and cardiac structure. When MAFLD was stratified by LSM value, liver fibrosis patients had higher parameters of cardiac structure compared with non-liver fibrosis patients (all p < 0.05 [Table 5]).
Multivariable Regression Analyses
To assess whether different subgroups and severity of MAFLD are independently related to cardiac structure, multivariable linear regression analyses were performed to adjust for clinically important factors as described above (Tables 6, 7). Consequently, MAFLD patients in the diabetes and overweight/obesity subgroups were closely associated with markers of cardiac remolding in Model 1 (all p < 0.05 [Table 6]) and continuous with sight attenuation in regression coefficient after adjustment with age, sex, smoking, alcohol consumption, BMI and hypertension; the diabetes subgroups remained associated with increased IVST, LVPWT, RWT, LVM, and LVMI (all p < 0.05 [Table 6]). Further adjustment for ALT, AST, and TC in Model 3 remained significant in the diabetes subgroup [all p < 0.05 (Table 6)]. These results may provide guidance for the targeted diagnosis and treatment of high-risk patients. Similarly, to assess whether the severity of hepatic steatosis is associated with LV remolding using the above method, we found that severe hepatic steatosis patients were significantly associated with indicators of cardiac abnormality, including an increase of IVST, LVPWT, RWT, LADs, LVM, and LVMI [all p < 0.05 (Table 7)].
Table 6
| Variable | Model 1: unadjusted | Model 2: age, sex, smoking, alcohol consumption, BMI, and hypertension adjusted | Model 3: Model 2 + ALT, AST, and TC adjusted | ||||||
|---|---|---|---|---|---|---|---|---|---|
| β | 95% CI | p | β | 95% CI | p | β | 95% CI | p | |
| IVST | |||||||||
| No MAFLD | 1.00 (reference) | 1.00 (reference) | 1.00 (reference) | ||||||
| Obesity subgroup | 0.117 | (0.074–0.16) | 0.000 | 0.049 | (0.001–0.097) | 0.046 | 0.048 | (0–0.097) | 0.051 |
| Diabetes subgroup | 0.201 | (0.143–0.259) | 0.000 | 0.114 | (0.051–0.176) | 0.000 | 0.118 | (0.055–0.181) | 0.000 |
| Leansubgroup | 0.043 | (−0.015 to 0.102) | 0.146 | 0.021 | (−0.036 to 0.078) | 0.471 | 0.024 | (−0.034 to 0.081) | 0.415 |
| LVPWT | |||||||||
| No MAFLD | 1.00 (reference) | 1.00 (reference) | 1.00 (reference) | ||||||
| Obesity subgroup | 0.097 | (0.064–0.129) | 0.000 | 0.037 | (0.001–0.073) | 0.046 | 0.034 | (−0.002 to 0.071) | 0.066 |
| Diabetes subgroup | 0.153 | (0.109–0.197) | 0.000 | 0.085 | (0.038–0.132) | 0.000 | 0.083 | (0.035–0.13) | 0.001 |
| Lean subgroup | 0.001 | (−0.044 to 0.045) | 0.976 | −0.005 | (−0.049 to 0.038) | 0.806 | −0.005 | (−0.049 to 0.038) | 0.809 |
| LVEDD | |||||||||
| No MAFLD | 1.00 (reference) | 1.00 (reference) | 1.00 (reference) | ||||||
| Obesity subgroup | 0.191 | (0.068–0.315) | 0.002 | −0.005 | (−0.141 to 0.131) | 0.942 | −0.013 | (−0.149 to 0.124) | 0.854 |
| Diabetes subgroup | 0.193 | (0.027–0.359) | 0.023 | −0.004 | (−0.18 to 0.172) | 0.966 | 0.000 | (−0.178 to 0.178) | 0.997 |
| Lean subgroup | −0.014 | (−0.182 to 0.154) | 0.869 | 0.017 | (−0.144 to 0.179) | 0.833 | 0.024 | (−0.138 to 0.186) | 0.771 |
| LA | |||||||||
| No MAFLD | 1.00 (reference) | 1.00 (reference) | 1.00 (reference) | ||||||
| Obesity subgroup | 0.241 | (0.111–0.371) | 0.000 | −0.012 | (−0.151 to 0.126) | 0.860 | −0.023 | (−0.162 to 0.117) | 0.750 |
| Diabetes subgroup | 0.249 | (0.073 to 0.425) | 0.006 | −0.085 | (−0.265 to 0.095) | 0.354 | −0.105 | (−0.287 to 0.077) | 0.258 |
| Lean subgroup | −0.065 | (−0.243 to 0.112) | 0.469 | −0.122 | (−0.287 to 0.044) | 0.149 | −0.129 | (−0.295 to 0.037) | 0.128 |
| RWT | |||||||||
| No MAFLD | 1.00 (reference) | 1.00 (reference) | 1.00 (reference) | ||||||
| Obesity subgroup | 0.026 | (0.011–0.042) | 0.001 | 0.018 | (0–0.037) | 0.048 | 0.018 | (0–0.036) | 0.055 |
| Diabetes subgroup | 0.051 | (0.03–0.072) | 0.000 | 0.038 | (0.015–0.062) | 0.002 | 0.037 | (0.013–0.061) | 0.003 |
| Lean subgroup | 0.003 | (−0.018 to 0.024) | 0.809 | −0.004 | (−0.025 to 0.018) | 0.743 | −0.004 | (−0.026 to 0.018) | 0.703 |
| LVEDV | |||||||||
| No MAFLD | 1.00 (reference) | 1.00 (reference) | 1.00 (reference) | ||||||
| Obesity subgroup | 9.572 | (3.243–15.901) | 0.003 | −0.193 | (−7.201 to 6.816) | 0.957 | −0.589 | (−7.63 to 6.451) | 0.869 |
| Diabetes subgroup | 9.376 | (0.837 to 17.915) | 0.032 | −0.416 | (−9.521 to 8.688) | 0.928 | −0.243 | (−9.442 to 8.957) | 0.959 |
| Lean subgroup | −0.669 | (−9.296 to 7.958) | 0.879 | 0.852 | (−7.489 to 9.193) | 0.841 | 1.188 | (−7.179 to 9.554) | 0.780 |
| LVM | |||||||||
| No MAFLD | 1.00 (reference) | 1.00 (reference) | 1.00 (reference) | ||||||
| Obesity subgroup | 32.867 | (21.667–44.067) | 0.000 | 8.286 | (−3.504 to 20.076) | 0.167 | 7.427 | (−4.378 to 19.232) | 0.216 |
| Diabetes subgroup | 48.873 | (33.762–63.984) | 0.000 | 21.532 | (6.216–36.848) | 0.006 | 21.843 | (6.418–37.268) | 0.006 |
| Lean subgroup | 3.937 | (−11.329 to 19.204) | 0.612 | 2.632 | (−11.399 to 16.664) | 0.712 | 3.316 | (−10.713 to 17.344) | 0.642 |
| LVMI | |||||||||
| No MAFLD | 1.00 (reference) | 1.00 (reference) | 1.00 (reference) | ||||||
| Obesity subgroup | 12.197 | (6.568–17.826) | 0.000 | 5.426 | (−0.886 to 11.737) | 0.092 | 5.042 | (−1.282 to 11.367) | 0.118 |
| Diabetes subgroup | 22.396 | (14.801–29.991) | 0.000 | 12.031 | (3.832–20.229) | 0.004 | 12.322 | (4.058–20.587) | 0.004 |
| Lean subgroup | 5.261 | (−2.411 to 12.934) | 0.178 | 0.888 | (−6.623 to 8.399) | 0.816 | 1.292 | (−6.224 to 8.808) | 0.735 |
Multivariable linear regression analysis assessing the influence of subgroups of MAFLD on echocardiographic markers of myocardial morphology.
IVST, interventricular septum thickness; LVPWT, left ventricular posterior wall thickness; LA, left atrial; RWT, relative wall thickness; LVEDD, left ventricular end-diastolic diameter; LVM, left ventricular mass; LVMI, left ventricular mass index. Statistically significant values are highlighted in bold (P<0.05).
Table 7
| Variable | Model 1: unadjusted | Model 2: age, sex, smoking, alcohol consumption, BMI, and hypertension adjusted | Model 3: Model 2 + ALT, AST, and TC adjusted | ||||||
|---|---|---|---|---|---|---|---|---|---|
| β | 95% CI | p | β | 95% CI | p | β | 95% CI | p | |
| IVST | |||||||||
| No MAFLD | 1.00 (reference) | 1.00 (reference) | 1.00 (reference) | ||||||
| MAFLD | 0.119 | (0.077–0.161) | 0.000 | 0.047 | (0.004–0.09) | 0.034 | 0.047 | (0.004–0.091) | 0.034 |
| MAFLD grade | |||||||||
| No MAFLD | 1.00 (reference) | 1.00 (reference) | 1.00 (reference) | ||||||
| Mild | 0.094 | (0.045–0.143) | 0.000 | 0.037 | (−0.01 to 0.085) | 0.124 | 0.037 | (−0.011 to 0.085) | 0.133 |
| Moderate | 0.122 | (0.055–0.188) | 0.000 | 0.055 | (−0.009 to 0.119) | 0.093 | 0.056 | (−0.008 to 0.121) | 0.087 |
| Severe | 0.140 | (0.093–0.188) | 0.000 | 0.057 | (0.006–0.109) | 0.029 | 0.058 | (0.006–0.109) | 0.028 |
| LVPWT | |||||||||
| No MAFLD | 1.00 (reference) | 1.00 (reference) | 1.00 (reference) | ||||||
| MAFLD | 0.090 | (0.057–0.123) | 0.000 | 0.028 | (−0.005 to 0.061) | 0.095 | 0.026 | (−0.007 to 0.059) | 0.125 |
| MAFLD grade | |||||||||
| No MAFLD | 1.00 (reference) | 1.00 (reference) | 1.00 (reference) | ||||||
| Mild | 0.065 | (0.027–0.103) | 0.001 | 0.022 | (−0.014 to 0.059) | 0.228 | 0.018 | (−0.018 to 0.055) | 0.325 |
| Moderate | 0.071 | (0.02–0.123) | 0.007 | 0.020 | (−0.028 to 0.069) | 0.410 | 0.020 | (−0.028 to 0.069) | 0.412 |
| Severe | 0.116 | (0.08–0.153) | 0.000 | 0.040 | (0.001–0.079) | 0.045 | 0.039 | (0–0.078) | 0.051 |
| LVEDD | |||||||||
| No MAFLD | 1.00 (reference) | 1.00 (reference) | 1.00 (reference) | ||||||
| MAFLD | 0.154 | (0.038–0.271) | 0.010 | 0.003 | (−0.117 to 0.122) | 0.965 | 0.001 | (−0.119 to 0.121) | 0.985 |
| MAFLD grade | |||||||||
| No MAFLD | 1.00 (reference) | 1.00 (reference) | 1.00 (reference) | ||||||
| Mild | 0.148 | (0.011–0.285) | 0.034 | 0.044 | (−0.088 to 0.176) | 0.511 | 0.040 | (−0.093 to 0.173) | 0.558 |
| Moderate | 0.112 | (−0.074 to 0.298) | 0.238 | 0.007 | (−0.17 to 0.183) | 0.940 | 0.008 | (−0.169 to 0.186) | 0.926 |
| Severe | 0.173 | (0.04–0.306) | 0.011 | −0.062 | (−0.203 to 0.08) | 0.392 | −0.057 | (−0.199 to 0.084) | 0.425 |
| LA | |||||||||
| No MAFLD | 1.00 (reference) | 1.00 (reference) | 1.00 (reference) | ||||||
| MAFLD | 0.187 | (0.062–0.312) | 0.004 | −0.058 | (−0.181 to 0.065) | 0.355 | −0.068 | (−0.191 to 0.056) | 0.282 |
| MAFLD grade | |||||||||
| No MAFLD | 1.00 (reference) | 1.00 (reference) | 1.00 (reference) | ||||||
| Mild | 0.080 | (−0.065 to 0.225) | 0.277 | −0.098 | (−0.234 to 0.037) | 0.152 | −0.116 | (−0.252 to 0.02) | 0.095 |
| Moderate | 0.273 | (0.076–0.469) | 0.007 | 0.061 | (−0.12 to 0.242) | 0.508 | 0.053 | (−0.129 to 0.234) | 0.568 |
| Severe | 0.253 | (0.112–0.393) | 0.000 | −0.050 | (−0.195 to 0.095) | 0.499 | −0.052 | (−0.197 to 0.094) | 0.484 |
| RWT | |||||||||
| No MAFLD | 1.00 (reference) | 1.00 (reference) | 1.00 (reference) | ||||||
| MAFLD | 0.027 | (0.012–0.042) | 0.000 | 0.013 | (−0.003 to 0.03) | 0.115 | 0.012 | (−0.004 to 0.029) | 0.141 |
| MAFLD grade | |||||||||
| No MAFLD | 1.00 (reference) | 1.00 (reference) | 1.00 (reference) | ||||||
| Mild | 0.016 | (−0.001 to 0.034) | 0.064 | 0.007 | (−0.012 to 0.025) | 0.476 | 0.005 | (−0.013 to 0.024) | 0.570 |
| Moderate | 0.025 | (0.001–0.048) | 0.038 | 0.012 | (−0.012 to 0.036) | 0.339 | 0.012 | (−0.013 to 0.036) | 0.349 |
| Severe | 0.036 | (0.02–0.053) | 0.000 | 0.024 | (0.004–0.043) | 0.016 | 0.023 | (0.004–0.042) | 0.021 |
| LVEDV | |||||||||
| No MAFLD | 1.00 (reference) | 1.00 (reference) | 1.00 (reference) | ||||||
| MAFLD | 7.679 | (1.703–13.654) | 0.012 | 0.138 | (−6.033 to 0.6.308) | 0.965 | 0.056 | (−6.145 to 0.6.258) | 0.986 |
| MAFLD grade | |||||||||
| No MAFLD | 1.00 (reference) | 1.00 (reference) | 1.00 (reference) | ||||||
| Mild | 7.442 | (0.399–14.485) | 0.038 | 2.241 | (−4.552 to 0.9.035) | 0.516 | 2.018 | (−4.848 to 0.8.885) | 0.563 |
| Moderate | 5.979 | (−3.565 to 0.15.522) | 0.218 | 0.759 | (−8.36 to 0.9.877) | 0.870 | 0.840 | (−8.308 to 0.9.987) | 0.857 |
| Severe | 8.399 | (1.583–15.215) | 0.016 | −3.323 | (−10.62 to 0.3.974) | 0.370 | −3.115 | (−10.434 to 0.4.203) | 0.402 |
| LVM | |||||||||
| No MAFLD | 1.00 (reference) | 1.00 (reference) | 1.00 (reference) | ||||||
| MAFLD | 30.618 | (19.579–41.657) | 0.000 | 7.857 | (−2.66 to 0.18.375) | 0.142 | 7.528 | (−3.015 to 0.18.071) | 0.161 |
| MAFLD grade | |||||||||
| No MAFLD | 1.00 (reference) | 1.00 (reference) | 1.00 (reference) | ||||||
| Mild | 25.187 | (12.288–38.086) | 0.000 | 8.792 | (−2.864 to 0.20.448) | 0.139 | 7.989 | (−3.754 to 0.19.731) | 0.181 |
| Moderate | 25.652 | (8.174–43.13) | 0.004 | 7.150 | (−8.495 to 0.22.796) | 0.369 | 7.326 | (−8.318 to 0.22.969) | 0.357 |
| Severe | 36.801 | (24.318–49.284) | 0.000 | 6.763 | (−5.759 to 0.19.284) | 0.288 | 6.955 | (−5.56 to 0.19.471) | 0.275 |
| LVMI | |||||||||
| No MAFLD | 1.00 (reference) | 1.00 (reference) | 1.00 (reference) | ||||||
| MAFLD | 12.848 | (7.434–18.262) | 0.000 | 4.627 | (−1.009 to 0.10.263) | 0.107 | 4.519 | (−1.135 to 0.10.173) | 0.117 |
| MAFLD grade | |||||||||
| No MAFLD | 1.00 (reference) | 1.00 (reference) | 1.00 (reference) | ||||||
| Mild | 11.685 | (5.311–18.059) | 0.000 | 4.624 | (−1.614 to 0.10.863) | 0.145 | 4.279 | (−2.009 to 0.10.567) | 0.181 |
| Moderate | 15.493 | (6.856–24.13) | 0.000 | 6.893 | (−1.481 to 0.15.267) | 0.106 | 6.989 | (−1.388 to 0.15.367) | 0.102 |
| Severe | 13.046 | (6.877–19.214) | 0.000 | 3.610 | (−3.092 to 0.10.312) | 0.290 | 3.769 | (−2.933 to 0.10.471) | 0.269 |
Multivariable linear regression analysis assessing the influence of severity of MAFLD on echocardiographic markers of myocardial morphology.
IVST, interventricular septum thickness; LVPWT, left ventricular posterior wall thickness; LA, left atrial; RWT, relative wall thickness; LVEDD, left ventricular end-diastolic diameter; LVM, left ventricular mass; LVMI, left ventricular mass index. Statistically significant values are highlighted in bold (P<0.05)
Discussion
The association between NAFLD and CVD has been extensively reported in the literature (20). However, the emergence of a new definition of MAFLD may produce different results in clinical studies. The main findings of our results demonstrated that patients with MAFLD exhibited significant alterations in cardiac structure and diastolic function as compared with normal people. Interestingly, different subgroups of patients with MAFLD had varying influences on cardiac function and structure. Furthermore, the prevalence of LVDD and remolding increased with the severity of hepatic steatosis. In addition, consistent with our previous studies, individuals with MAFLD had higher BMI and neutrophil counts and more markers of metabolism abnormalities (21).
In our study, the patients with MAFLD demonstrated signs of cardiac remodeling, as showed by the increased RWT and LVMI when compared with the normal group; these results are similar to previous findings on the effects of NAFLD on cardiac structure (22). Fatty liver and CVDs not only interact, but more importantly, hepatic steatosis may serve as a marker of adipose ectopic deposition in the myocardium and pericardium. Although several studies showed that subjects with NAFLD were associated with cardiac structural abnormalities and diastolic dysfunction (23, 24), these associations between the liver and heart were not sufficiently demonstrated in the different disease states of patients with hepatic steatosis. There are no studies to demonstrate the effects of different subtypes of MAFLD on cardiac structure and diastolic function. When we observed whether the adverse effects of MAFLD subtypes were different, the results suggested that the cardiac structure of MAFLD patients with different diagnostic criteria may be different, and the diabetes subgroup may have a higher risk of cardiac remodeling than lean MAFLD and overweight/obesity MAFLD subjects. Many studies have documented the high prevalence of NAFLD in type 2 diabetes patients, and there are some pathological associations between them, such as insulin resistance, chronic inflammation, and disorder of lipid metabolism (25, 26). Evidence from other studies suggested that NAFLD impaired myocardial dysfunction related to reduced myocardial glucose uptake in patients with type 2 diabetes and impaired myocardial reserve (27). A study on the association of MAFLD with diabetes, chronic kidney disease, and CVD with a 4.6-year follow-up in Chinese found that MAFLD was associated with higher risks of incident diabetes and CVD (28). T2DM can accelerate the progression of NAFLD into non-alcoholic steatohepatitis (NASH), liver fibrosis, cirrhosis, and even liver cancer. The coexistence of the two diseases can have a synergistic effect to exacerbate the damage to the heart and even increases the risk of life-threatening sequelae. In multivariate linear regression analysis, the LVM, LVEDV, and RWT were increased in the diabetes and overweight/obesity subgroups. To better evaluate whether the fatty liver is associated with cardiac remolding, age, sex, alcohol consumption, and other clinically important factors were adjusted, and the association between them remained significant. The results implied that overweight/obesity and diabetic MAFLD patients were significant risk factors for cardiac remolding. Published studies suggest that obesity adversely affects the cardiac structure and LV function before the onset of organic heart disease (18). A recent study found that NASH patients with extreme obesity were associated with LV concentric remodeling and hyperdynamic circulation (29). Like them, we have measured the waist circumstance, and subcutaneous fat, and these indicators were significantly higher in the overweight/obesity subgroup; the patterns of fat distribution may be related to the metabolic abnormalities and ectopic deposition of fat in the myocardium.
Numerous studies have shown that NAFLD is associated with LVDD (30). Many case–control trials have demonstrated the echocardiography of LVDD in NAFLD patients on whether adults, children, and adolescents are comparable to the corresponding control population without NAFLD (31–34). In our study, LVDD was significantly more prevalent in patients with MAFLD compared to normal people, in particular, in the diabetes subgroup (75.0%). There is growing evidence that hepatic steatosis and fibrosis contribute to the pathogenesis of cardiac functional abnormity (10, 35–37). Regarding the mechanisms of hepatic steatosis that adversely affect cardiac function, several hypotheses were proposed; for example, elevated epicardial fat thickness has a paracrine effect on the myocardium and contributes to altered diastolic function (38). Moreover, fatty liver disease releases proinflammatory cytokines, adhesion molecules, and procoagulant factors that promote myocardial oxidative stress, fibrosis, and deposition of advanced glycation end-products with subsequent diastolic stiffness and dysfunction (39). T2DM and fatty liver have been associated with subclinical manifestations of cardiac structure, function, and myocardial metabolism. The independent association between fatty liver and diastolic dysfunction in patients with type 2 diabetes with underlying systemic insulin resistance and hyperglycemia is noteworthy (40). Hepatic insulin resistance and even whole-body insulin are universally observed in MAFLD patients with T2DM, and it may explain the reason for more LVDD occurring in MAFLD patients with diabetes (27). Although there was no statistical significance in abnormal LV dysfunction among the three subgroups, the possibility of significant statistical significance between them cannot be ruled out with the increase in the number of subjects and the extension of follow-up time. Therefore, individualized management is required for MAFLD, which is of significant meaning for preventing complications of MAFLD (41).
Depending on the severity of fatty degeneration and fibrosis, the risk of LVDD is significantly increased (27, 35). However, the emergence of a new definition of MAFLD has hardly been investigated, as well as its dose-dependent association with severity of steatosis with higher prevalence of LVDD or cardiac remolding. In contrast, our research subjects were thoroughly examined, using the transient elastography with CAP value to quantify hepatic steatosis. Based on these results, we have found that the cardiac remodeling gradually worsened with the aggravation of hepatic steatosis and higher prevalence of LVDD in moderate to severe hepatic steatosis. What is more, most markers of cardiac remolding were significantly associated with liver fibrosis. Moreover, multivariate linear regression analysis also showed that the severity of hepatic steatosis was significantly correlated with the change in cardiac structure. Moderate-to-to severe hepatic steatosis may aggravate the insulin resistance of the liver. The liver, as the target organ and initiator organ of insulin resistance (40), secretes more proinflammatory factors that affect myocardial metabolism and cause microcirculation disorders, which leads to structural and functional disorders of the heart (42). In the moderate to severe hepatic steatosis group, obesity, hypertension, diabetes, and dyslipidemia might be important factors in exacerbating cardiac injury. In addition, a dose dependence was established between the neutrophil count and aggravation of hepatic steatosis. Therefore, reasonable treatment of MAFLD can slow down the disease progression and help reduce the occurrence of cardiovascular complications.
However, some limitations should also be noted. First, we have used hepatic elastography to assess the severity of hepatic steatosis rather than liver biopsies. Liver biopsies are the gold standard for the diagnosis of fat accumulation in the liver and allow the assessment of the evidence of inflammation and ballooning degeneration of hepatocytes, which are the most important histological features for predicting disease progression of MAFLD, but this approach is invasive and not suitable for most patients. Second, we did not have evaluated objective measures of the participants’ physical activity. A study pointed out the positive effect of physical activity on fibrosis and CVD in patients with NAFLD (43). This is one of the potential factors that can be used to conduct future prospective studies to clarify the effect of physical activity on cardiac function and structure in patients with MAFLD. Third, LSM results suggested that a small number of our study participants have fibrosis, and we will further elaborate on it in future studies. Therefore, these limitations should be taken into account when interpreting our study findings and analyzing the results objectively.
In conclusion, our results revealed the significant association of MAFLD with LVDD and cardiac remolding in the general population, which indicated the clinical significance of MAFLD as a potential risk factor for cardiovascular events. What is more, we further demonstrated that diabetic, overweight, and moderate to severe steatosis patients were most closely associated with abnormalities of cardiac structure and function, which is of great significance for the precise intervention of MAFLD. We also suggest that medical professionals need to screen patients with MAFLD for cardiac injury to prevent disease progression.
Funding
This study was funded by the Health Science and Technology Project of Zhejiang Province, China (2020KY216) and the Hangzhou City Health Science and Technique Program (OO20190126).
Publisher’s Note
All claims expressed in this article are solely those of the authors and do not necessarily represent those of their affiliated organizations, or those of the publisher, the editors and the reviewers. Any product that may be evaluated in this article, or claim that may be made by its manufacturer, is not guaranteed or endorsed by the publisher.
Statements
Data availability statement
The original contributions presented in the study are included in the article/supplementary material. Further inquiries can be directed to the corresponding author.
Ethics statement
The studies involving human participants were reviewed and approved by Hangzhou Normal University Affiliated Hospital. The patients/participants provided their written informed consent to participate in this study.
Author contributions
ZY was responsible for the study concept and design. DP did the statistical analysis and wrote the manuscript. MW, JS, LS, YZ, WZ, CC, JT, CW, JN, WW, and JJ collected clinical specimens. All authors critically revised the paper and approved the final version.
Acknowledgments
Thanks to all participants in this study and all clinicians for their tremendous work in this study.
Conflict of interest
The authors declare that the research was conducted in the absence of any commercial or financial relationships that could be construed as a potential conflict of interest.
References
1
Lazarus JV Mark HE Anstee QM Arab JP Batterham RL Castera L et al . Advancing the Global Public Health Agenda for NAFLD: A Consensus Statement. Nat Rev Gastroenterol Hepatol (2022) 19(1):60–78. doi: 10.1038/s41575-021-00523-4
2
Abdallah LR de Matos RC YPDM ES Vieira-Soares D Muller-Machado G Pollo-Flores P . Non-Alcoholic Fatty Liver Disease and Its Links With Inflammation and Atherosclerosis. Curr Atheroscler Rep (2020) 22(1):7. doi: 10.1007/s11883-020-0820-8
3
Chang W Wang Y Sun L Yu D Li Y Li G . Evaluation of Left Atrial Function in Type 2 Diabetes Mellitus Patients With Nonalcoholic Fatty Liver Disease by Two-Dimensional Speckle Tracking Echocardiography. Echocardiography (2019) 36(7):1290–7. doi: 10.1111/echo.14400
4
Tilg H Effenberger M . From NAFLD to MAFLD: When Pathophysiology Succeeds. Nat Rev Gastroenterol Hepatol (2020) 17(7):387–8. doi: 10.1038/s41575-020-0316-6
5
Eslam M Sanyal AJ George J, International Consensus P . MAFLD: A Consensus-Driven Proposed Nomenclature for Metabolic Associated Fatty Liver Disease. Gastroenterology (2020) 158(7):1999–2014.e1. doi: 10.1053/j.gastro.2019.11.312
6
Younossi ZM Rinella ME Sanyal AJ Harrison SA Brunt EM Goodman Z et al . From NAFLD to MAFLD: Implications of a Premature Change in Terminology. Hepatology (2021) 73(3):1194–8. doi: 10.1002/hep.31420
7
Lin S Huang J Wang M Kumar R Liu Y Liu S et al . Comparison of MAFLD and NAFLD Diagnostic Criteria in Real World. Liver Int (2020) 40(9):2082–9. doi: 10.1111/liv.14548
8
Lee H Lee YH Kim SU Kim HC . Metabolic Dysfunction-Associated Fatty Liver Disease and Incident Cardiovascular Disease Risk: A Nationwide Cohort Study. Clin Gastroenterol Hepatol (2021) 19(10):2138–2147.e10. doi: 10.1016/j.cgh.2020.12.022
9
Chen X Chen S Pang J Tang Y Ling W . Are the Different MAFLD Subtypes Based on the Inclusion Criteria Correlated With All-Cause Mortality? J Hepatol (2021) 75(4):987–9. doi: 10.1016/j.jhep.2021.06.013
10
Parvanescu T Vitel A Sporea I Mare R Buz B Bordejevic DA et al . Significant Association Between Left Ventricular Diastolic Dysfunction, Left Atrial Performance and Liver Stiffness in Patients With Metabolic Syndrome and Non-Alcoholic Fatty Liver Disease. Diabetes Metab Syndr Obes (2021) 14:1535–45. doi: 10.2147/DMSO.S300450
11
Chung GE Lee JH Lee H Kim MK Yim JY Choi SY et al . Nonalcoholic Fatty Liver Disease and Advanced Fibrosis are Associated With Left Ventricular Diastolic Dysfunction. Atherosclerosis (2018) 272:137–44. doi: 10.1016/j.atherosclerosis.2018.03.027
12
Makker J Tariq H Bella JN Kumar K Chime C Patel H et al . Preclinical Cardiac Disease in Nonalcoholic Fatty Liver Disease With and Without Metabolic Syndrome. Am J Cardiovasc Dis (2019) 9(5):65–77.
13
Karlas T Petroff D Sasso M Fan JG Mi YQ de Ledinghen V et al . Individual Patient Data Meta-Analysis of Controlled Attenuation Parameter (CAP) Technology for Assessing Steatosis. J Hepatol (2017) 66(5):1022–30. doi: 10.1016/j.jhep.2016.12.022
14
Mozes FE Lee JA Selvaraj EA Jayaswal ANA Trauner M Boursier J et al . Diagnostic Accuracy of non-Invasive Tests for Advanced Fibrosis in Patients With NAFLD: An Individual Patient Data Meta-Analysis. Gut (2022) 71(5):1006–19. doi: 10.1136/gutjnl-2021-324243
15
Eslam M Newsome PN Sarin SK Anstee QM Targher G Romero-Gomez M et al . A New Definition for Metabolic Dysfunction-Associated Fatty Liver Disease: An International Expert Consensus Statement. J Hepatol (2020) 73(1):202–9. doi: 10.1016/j.jhep.2020.03.039
16
Hsu PF Wang YW Lin CC Wang YJ Ding YZ Liou TL et al . The Association of the Steatosis Severity in Fatty Liver Disease With Coronary Plaque Pattern in General Population. Liver Int (2021) 41(1):81–90. doi: 10.1111/liv.14637
17
Olubamwo OO Virtanen JK Voutilainen A Kauhanen J Pihlajamaki J Tuomainen TP . Association of Fatty Liver Index With the Risk of Incident Cardiovascular Disease and Acute Myocardial Infarction. Eur J Gastroenterol Hepatol (2018) 30(9):1047–54. doi: 10.1097/MEG.0000000000001183
18
Dias KA Spence AL Sarma S Oxborough D Timilsina AS Davies PSW et al . Left Ventricular Morphology and Function in Adolescents: Relations to Fitness and Fatness. Int J Cardiol (2017) 240:313–9. doi: 10.1016/j.ijcard.2017.03.047
19
Lang RM Badano LP Mor-Avi V Afilalo J Armstrong A Ernande L et al . Recommendations for Cardiac Chamber Quantification by Echocardiography in Adults: An Update From the American Society of Echocardiography and the European Association of Cardiovascular Imaging. Eur Heart J Cardiovasc Imaging (2015) 16(3):233–70. doi: 10.1093/ehjci/jev014
20
Anstee QM Mantovani A Tilg H Targher G . Risk of Cardiomyopathy and Cardiac Arrhythmias in Patients With Nonalcoholic Fatty Liver Disease. Nat Rev Gastroenterol Hepatol (2018) 15(7):425–39. doi: 10.1038/s41575-018-0010-0
21
Tang J Chen C Zhou M Wang J Feng Z Wang M . NLR Contributed to the Diagnosis and Detection of Nonalcoholic Fatty Liver Disease: A Meta - Analysis. Clin Res Hepatol Gastroenterol (2021), 101847. doi: 10.1016/j.clinre.2021.101847
22
Jung JY Park SK Ryoo JH Oh CM Kang JG Lee JH et al . Effect of non-Alcoholic Fatty Liver Disease on Left Ventricular Diastolic Function and Geometry in the Korean General Population. Hepatol Res (2017) 47(6):522–32. doi: 10.1111/hepr.12770
23
Moise CG Donoiu I Tartea GC Mirea O Rogoveanu I . Assessment of Left Ventricular Diastolic Function in Young Adults With Nonalcoholic Fatty Liver Disease. Curr Health Sci J (2021) 47(1):23–7. doi: 10.12865/CHSJ.47.01.04
24
VanWagner LB Wilcox JE Colangelo LA Lloyd-Jones DM Carr JJ Lima JA et al . Association of Nonalcoholic Fatty Liver Disease With Subclinical Myocardial Remodeling and Dysfunction: A Population-Based Study. Hepatology (2015) 62(3):773–83. doi: 10.1002/hep.27869
25
Labenz C Kostev K Alqahtani SA Galle PR Schattenberg JM . Impact of Non-Alcoholic Fatty Liver Disease on Metabolic Comorbidities in Type 2 Diabetes Mellitus. Exp Clin Endocrinol Diabetes (2022) 130(3):172–7. doi: 10.1055/a-1378-4679
26
Scapaticci S D'Adamo E Mohn A Chiarelli F Giannini C . Non-Alcoholic Fatty Liver Disease in Obese Youth With Insulin Resistance and Type 2 Diabetes. Front Endocrinol (Lausanne) (2021) 12:639548. doi: 10.3389/fendo.2021.639548
27
Lee M Kim KJ Chung TH Bae J Lee YH Lee BW et al . Nonalcoholic Fatty Liver Disease, Diastolic Dysfunction, and Impaired Myocardial Glucose Uptake in Patients With Type 2 Diabetes. Diabetes Obes Metab (2021) 23(4):1041–51. doi: 10.1111/dom.14310
28
Liang Y Chen H Liu Y Hou X Wei L Bao Y et al . Association of MAFLD With Diabetes, Chronic Kidney Disease, and Cardiovascular Disease: A 4.6-Year Cohort Study in China. J Clin Endocrinol Metab (2021). doi: 10.1210/clinem/dgab641
29
Styczynski G Kalinowski P Michalowski L Paluszkiewicz R Ziarkiewicz-Wroblewska B Zieniewicz K et al . Cardiac Morphology, Function, and Hemodynamics in Patients With Morbid Obesity and Nonalcoholic Steatohepatitis. J Am Heart Assoc (2021) 10(8):e017371. doi: 10.1161/JAHA.120.017371
30
Lee H Kim G Choi YJ Huh BW Lee BW Kang ES et al . Association Between Non-Alcoholic Steatohepatitis and Left Ventricular Diastolic Dysfunction in Type 2 Diabetes Mellitus. Diabetes Metab J (2020) 44(2):267–76. doi: 10.4093/dmj.2019.0001
31
Simon TG Bamira DG Chung RT Weiner RB Corey KE . Nonalcoholic Steatohepatitis is Associated With Cardiac Remodeling and Dysfunction. Obes (Silver Spring) (2017) 25(8):1313–6. doi: 10.1002/oby.21879
32
Lee H Kim G Lee YH . Response: Association Between Non-Alcoholic Steatohepatitis and Left Ventricular Diastolic Dysfunction in Type 2 Diabetes Mellitus (Diabetes Metab J 2020;44:267-76). Diabetes Metab J (2020) 44(3):486–7. doi: 10.4093/dmj.2020.0127
33
El Amrousy D Elgendy E Awad ME El Razaky O . Three-Dimensional Speckle Tracking Echocardiography for Early Detection of Left Ventricular Dysfunction in Children With non-Alcoholic Fatty Liver Diseases. Cardiol Young (2021) 31(4):562–7. doi: 10.1017/S104795112000445X
34
Pacifico L Chiesa C Anania C De Merulis A Osborn JF Romaggioli S et al . Nonalcoholic Fatty Liver Disease and the Heart in Children and Adolescents. World J Gastroenterol (2014) 20(27):9055–71. doi: 10.3748/wjg.v20.i27.9055
35
Petta S Argano C Colomba D Camma C Di Marco V Cabibi D et al . Epicardial Fat, Cardiac Geometry and Cardiac Function in Patients With Non-Alcoholic Fatty Liver Disease: Association With the Severity of Liver Disease. J Hepatol (2015) 62(4):928–33. doi: 10.1016/j.jhep.2014.11.030
36
Baktir AO Sarli B Altekin RE Karaman A Arinc H Saglam H et al . Non Alcoholic Steatohepatitis is Associated With Subclinical Impairment in Left Ventricular Function Measured by Speckle Tracking Echocardiography. Anatol J Cardiol (2015) 15(2):137–42. doi: 10.5152/akd.2014.5212
37
Canada JM Abbate A Collen R Billingsley H Buckley LF . Relation of Hepatic Fibrosis in Nonalcoholic Fatty Liver Disease to Left Ventricular Diastolic Function and Exercise Tolerance. Am J Cardiol (2019) 123(3):466–73. doi: 10.1016/j.amjcard.2018.10.027
38
Psychari SN Rekleiti N Papaioannou N Varhalama E Drakoulis C Apostolou TS et al . Epicardial Fat in Nonalcoholic Fatty Liver Disease: Properties and Relationships With Metabolic Factors, Cardiac Structure, and Cardiac Function. Angiology (2016) 67(1):41–8. doi: 10.1177/0003319715576672
39
van Heerebeek L Hamdani N Handoko ML Falcao-Pires I Musters RJ Kupreishvili K et al . Diastolic Stiffness of the Failing Diabetic Heart: Importance of Fibrosis, Advanced Glycation End Products, and Myocyte Resting Tension. Circulation (2008) 117(1):43–51. doi: 10.1161/CIRCULATIONAHA.107.728550
40
Peterson V Norton GR Raymond A Libhaber CD Millen AM Majane OH et al . Insulin Resistance-Associated Decreases in Left Ventricular Diastolic Function are Strongly Modified by the Extent of Concentric Remodeling in a Community Sample. Int J Cardiol (2016) 220:349–55. doi: 10.1016/j.ijcard.2016.06.206
41
Huang J Ou W Wang M Singh M Liu Y Liu S et al . MAFLD Criteria Guide the Subtyping of Patients With Fatty Liver Disease. Risk Manag Healthc Policy (2021) 14:491–501. doi: 10.2147/RMHP.S285880
42
Watanabe S Kumazaki S Kusunoki K Inoue T Maeda Y Usui S et al . A High-Fat and High-Cholesterol Diet Induces Cardiac Fibrosis, Vascular Endothelial, and Left Ventricular Diastolic Dysfunction in SHRSP5/Dmcr Rats. J Atheroscler Thromb (2018) 25(5):439–53. doi: 10.5551/jat.40956
43
Chun HS Lee M Lee HA Oh SY Baek HJ Moon JW et al . Association of Physical Activity With Risk of Liver Fibrosis, Sarcopenia, and Cardiovascular Disease in NAFLD. Clin Gastroenterol Hepatol (2022) 6:S1542-3565(22)00001-5. doi: 10.1016/j.cgh.2021.12.043
Summary
Keywords
metabolic dysfunction-associated fatty liver disease, cardiac remodeling, left ventricular diastolic dysfunction, type 2 diabetes mellitus, obesity
Citation
Peng D, Yu Z, Wang M, Shi J, Sun L, Zhang Y, Zhao W, Chen C, Tang J, Wang C, Ni J, Wen W and Jiang J (2022) Association of Metabolic Dysfunction-Associated Fatty Liver Disease With Left Ventricular Diastolic Function and Cardiac Morphology. Front. Endocrinol. 13:935390. doi: 10.3389/fendo.2022.935390
Received
03 May 2022
Accepted
03 June 2022
Published
19 July 2022
Volume
13 - 2022
Edited by
Rosario Scaglione, University of Palermo, Italy
Reviewed by
Vincent Wong, The Chinese University of Hong Kong, China; Nengguang Fan, Shanghai First People’s Hospital, China; Giuseppina Rosaria Umano, University of Campania Luigi Vanvitelli, Italy
Updates
Copyright
© 2022 Peng, Yu, Wang, Shi, Sun, Zhang, Zhao, Chen, Tang, Wang, Ni, Wen and Jiang.
This is an open-access article distributed under the terms of the Creative Commons Attribution License (CC BY). The use, distribution or reproduction in other forums is permitted, provided the original author(s) and the copyright owner(s) are credited and that the original publication in this journal is cited, in accordance with accepted academic practice. No use, distribution or reproduction is permitted which does not comply with these terms.
*Correspondence: Zhenqiu Yu, yuzhenqiuaz@sina.cn
This article was submitted to Cardiovascular Endocrinology, a section of the journal Frontiers in Endocrinology
Disclaimer
All claims expressed in this article are solely those of the authors and do not necessarily represent those of their affiliated organizations, or those of the publisher, the editors and the reviewers. Any product that may be evaluated in this article or claim that may be made by its manufacturer is not guaranteed or endorsed by the publisher.