 Parham Mardi1,2
 Fatemeh Abdi1Amir Ehsani3Ehsan Seif1
 Shirin Djalalinia4,5Javad Heshmati6
 Ehsan Shahrestanaki7,8Armita Mahdavi Gorabi9*
 Mostafa Qorbani1,10*
- 1Non-Communicable Diseases Research Center, Alborz University of Medical Sciences, Karaj, Iran
- 2Student Research Committee, Alborz University of Medical Sciences, Karaj, Iran
- 3University of Medical Sciences, Tehran, Iran
- 4Development of Research and Technology Center, Deputy of Research and Technology, Ministry of Health and Medical Education, Tehran, Iran
- 5Non-Communicable Diseases Research Center, Endocrinology and Metabolism Population Sciences Institute, Tehran University of Medical Sciences, Tehran, Iran
- 6Songhor Healthcare Center, Kermanshah University of Medical Sciences, Kermanshah, Iran
- 7Department of Epidemiology, School of Public Health, Iran University of Medical Sciences, Tehran, Iran
- 8Probiotic Research Center, Alborz University of Medical Sciences, Karaj, Iran
- 9Social Determinants of Health Research Center, Alborz University of Medical Sciences, Karaj, Iran
- 10Chronic Diseases Research Center, Endocrinology and Metabolism Population Sciences Institute, Tehran University of Medical Sciences, Tehran, Iran
Introduction: Novel atherogenic lipid indices, including non-high-density lipoprotein cholesterol (non-HDL-C) which is calculated by subtracting the HDL-C value from the total cholesterol level, atherogenic index (ratio between triglycerides (TG) and HDL-C concentrations (TG/HDL-C)), and Diff-C (calculated by subtracting low-density lipoprotein (LDL-C) from non-HDL-C), have been known as valuable predictors of dyslipidemia and subsequent cardiovascular diseases. Previous studies have reported the potential association of novel atherogenic lipid indices with metabolic syndrome (MetS). This meta-analysis aimed to assess the pooled association of novel atherogenic lipid indices with MetS or its components.
Methods: A systematic search was conducted through PubMed, Scopus, and Web of Science (WoS) databases from January 2000 until March 2021 to evaluate the association of novel atherogenic lipid indices, including non-HDL-C, atherogenic index, and the difference between non-HDL-C and LDL-C (Diff-C) with MetS. Observational studies were included without any language restriction. As exclusive studies evaluating the association of non-HDL-C with metabolic syndrome (MetS) were eligible to be included in quantitative analyses, a random-effect meta-analysis was performed to pool the odds ratios (ORs). A stratified meta-analysis was performed based on the definition of MetS [Adult Treatment Panel (ATP) and International Diabetes Federation (IDF)] and the studied population.
Results: Overall, 318 studies were retrieved from an initial systematic search. After screening, 18 and five studies were included in the qualitative and quantitative syntheses, respectively. Qualitative synthesis revealed an association between non-HDL-C, Diff-C, and atherogenic index with MetS and its components. Stratified meta-analysis showed that an increased non-HDL-C level was associated with an increased odds of MetS based on ATP criteria (OR: 3.77, 95% CI: 2.14-5.39) and IDF criteria (OR: 2.71, 95% CI: 1.98-3.44) in adults (OR: 3.53, 95% CI: 2.29-4.78) and in children (OR: 2.27, 95% CI: 1.65-2.90).
Conclusion: Novel atherogenic lipid indices, including atherogenic index, Diff-c, and non-HDL-C, are strongly associated with increased odds of MetS and its components. The indices could be considered as potential predictors of MetS and its components in clinical practice.
Introduction
Metabolic syndrome (MetS) is a well-established risk factor which increases the likelihood of experiencing cardiovascular events (1). The current study considers diagnoses of metabolic syndrome (MetS) and other cardiometabolic risk factors such as hypertension, central obesity, insulin resistance, hyperinsulinemia, diabetes, and hyperlipidemia as outcomes. It is estimated that the prevalence of these risk factors has risen remarkably (2, 3). Five of these risk factors comprise a syndrome called MetS. Although several definitions of MetS have been introduced, the five parameters serum glucose levels, high-density lipoprotein cholesterol (HDL-C), triglyceride (TG), obesity, and blood pressure have generally been the defining factors of the syndrome (4). Among all MetS components, hyperlipidemia has been recognized as an independent and significant risk factor for cardiovascular disease (CVD) (5). According to the Framingham Heart Study, among the parameters measured in the lipid profile, a low level of HDL-C and a high level of low-density lipoprotein cholesterol (LDL-C) are strongly associated with the increased risk of CVDs (6). This information reveals that the incident risk of CVD is increased by 2%–3% with each mg/dL decrease in HDL-C levels (7). The Framingham Heart Study’s findings on LDL-C have been repeatedly confirmed by other studies (8–10) to the point that controlling LDL-C levels is currently recognized as the primary target in treating hyperlipidemia (11).
Based on the National Cholesterol Education Program Adult Treatment Panel (NCEP ATP III) suggestion, the secondary target in treating hyperlipidemia in patients with a triglyceride higher than 200 is non-high-density lipoprotein cholesterol (non-HDL-C) (11). Non-HDL-C measures LDL-C, VLDL-C, chylomicrons, lipoprotein(a), IDL, and chylomicron remnant. Non-HDL cholesterol (non-HDL-C) is calculated by subtracting the HDL-C value from the total cholesterol level. Although several components make up non-HDL, this index mainly comprises atherogenic lipoproteins such as LDL, very low-density lipoprotein (VLDL-C), and intermediate-density lipoprotein (IDL-C). Different studies have shown that even after a significant decrease in LDL-C levels, a considerable amount of residual risk for CVD incidence remains. It was concluded that other lipids (other than LDL-C) are also involved in increasing the risk of CVD (12, 13). One of the indices measuring these lipids is non-HDL-C. Non-HDL-C measures different components such as LDL-C, VLDL-C, chylomicrons, lipoprotein(a), IDL, and chylomicron remnants. Moreover, the atherogenic index (ratio between TG and HDL-C concentrations (TG/HDL-C) and Diff-C (calculated by subtracting LDL-C from non-HDL-C)) measures the cumulative effects of these lipids on the CVD risk increment. The data extracted from Framingham’s study show that some of these components, such as VLDL-C, even further increase the risk of CVD incidence compared to LDL-C; the importance of this result is so significant that a study demonstrated that after multivariate adjustment for the non-HDL-C level, LDL-C would not increase the risk of CVD independently (14).
The accompanying of high non-HDL-C and other metabolic syndrome parameters showed a cumulative increment in CVD mortality risk. In other words, the risk of developing CVD is 200 times higher in diabetic patients than in non-diabetic patients (15). If diabetes is accompanied by dyslipidemia, the risk of CVD is further increased in the patients. Prior studies have searched for lipid targets to help decrease this added risk (16–18), and they conclude that compared to LDL-C, non-HDL-C is a stronger predictor for CVD fatality in diabetic patients (19). This study aims to evaluate the association of non-HDL-C, atherogenic index, and Diff-C with MetS and its components.
Methods
This systematic review and meta-analysis were performed according to the Preferred Reporting Items for Systematic Reviews and Meta-Analyses (PRISMA) statement.
Study question
• Are novel atherogenic lipid indices associated with metabolic syndrome?
Information sources and search strategy
A systematic search was independently carried out through PubMed, Scopus, and Web of Science (WoS) databases (from January 2000 until March 2021) by two reviewers (ES and FA) on the link of MetS and the atherogenic index, Diff-c, or non-HDL-C. The search strategy is demonstrated in Supplementary Table 1. Moreover, other resources, related gray literature, publications’ reference lists, and related key journals were searched for additional publications.
Study selection
EndNote reference management software was used for the study selection process so as to manage the papers. After removing duplicate papers, the title and abstract of the articles were evaluated based on the inclusion criteria. Eventually, the full texts were screened in detail. The selection process was independently conducted by two authors (PM and MQ).
Eligibility criteria
The following criteria were considered for screening the included articles: 1) observational studies which include participants’ novel atherogenic lipid indices including atherogenic index, Diff-C, or non-HDL-C level; 2) articles must include data on patients’ MetS or its components’ diagnosis, including hypertension, obesity, insulin resistance, hyperinsulinemia, diabetes, hyperlipidemia, and coronary heart disease; 3) articles must demonstrate a link between MetS or its components’ diagnosis and the atherogenic lipid indices; 4) articles can be published in any language.
Data collection process and data items
The data extraction form has been filled by two researchers independently. Another researcher resolved conflicts.
Quality assessment
Quality assessment was conducted by the Strengthening the Reporting of Observational Studies in Epidemiology (STROBE) Statement. This statement provides general reporting recommendations for descriptive observational studies and studies which investigate the associations between exposures and health outcomes. Both of these guidelines consist of 25 subitems. Each of these subitems was rated yes (1 point) or no (0 points); the final quality assessment score is the sum of these subitem points. The quality assessment was carried out by two researchers independently based on the guidelines’ items.
Data synthesis
Results are presented as odds ratio (OR) and its 95% confidence interval (95% CI). STATA version 11.2 (StataCorp, College Station, TX) software was used to conduct the meta-analysis. We conducted a meta-analysis when two or more than two studies report the association between an atherogenic lipid index with MetS or its components. The pooled estimate of ORs and their 95%CI were calculated based on extracted data from the studies which were included in quantitative analysis. The heterogeneity was evaluated based on the I2 statistic and the chi-square-based Q test. Lack of heterogeneity was defined when the p-value was more than 0.10. Random or fixed effect models were used to pool the association of non-HDL-C-C with MetS. Subgroup analysis was used based on the study population (adults/children) and criteria (ATP III/IDF). Publication bias was assessed by using Begg’s test. We considered a substantial publication bias whenever the p-value was calculated less than 0.1. Sensitivity analysis was performed to assess the effect of exclusion of studies which did not adjust the potential confounders.
Results
Study and patient characteristics
Our searches revealed 269 studies from PubMed, 317 studies from Scopus, and 205 studies from the Web of Science. In addition, our manual search for gray literature yielded 456 studies. After the rejection of duplicates, we screened 415 studies, followed by a full-text assessment for eligibility for 222 papers. Finally, 19 (20–38) and 5 (20, 25, 27, 29, 31) studies were included in the qualitative and quantitative syntheses, respectively. The detailed flow diagram is demonstrated in Figure 1. Four of the included studies were cohorts, while 14 of them were cross-sectional studies. Seven studies were originated from the United States, followed by three papers that originated from Iran. The largest sample size was for Miyazaki et al.’s study with 5,853 participants, and the smallest sample size was for Dharuni et al.’s study with 100 participants. Studies’ provenance, sample size, target population, and their patients’ characteristics are summarized in Table 1.
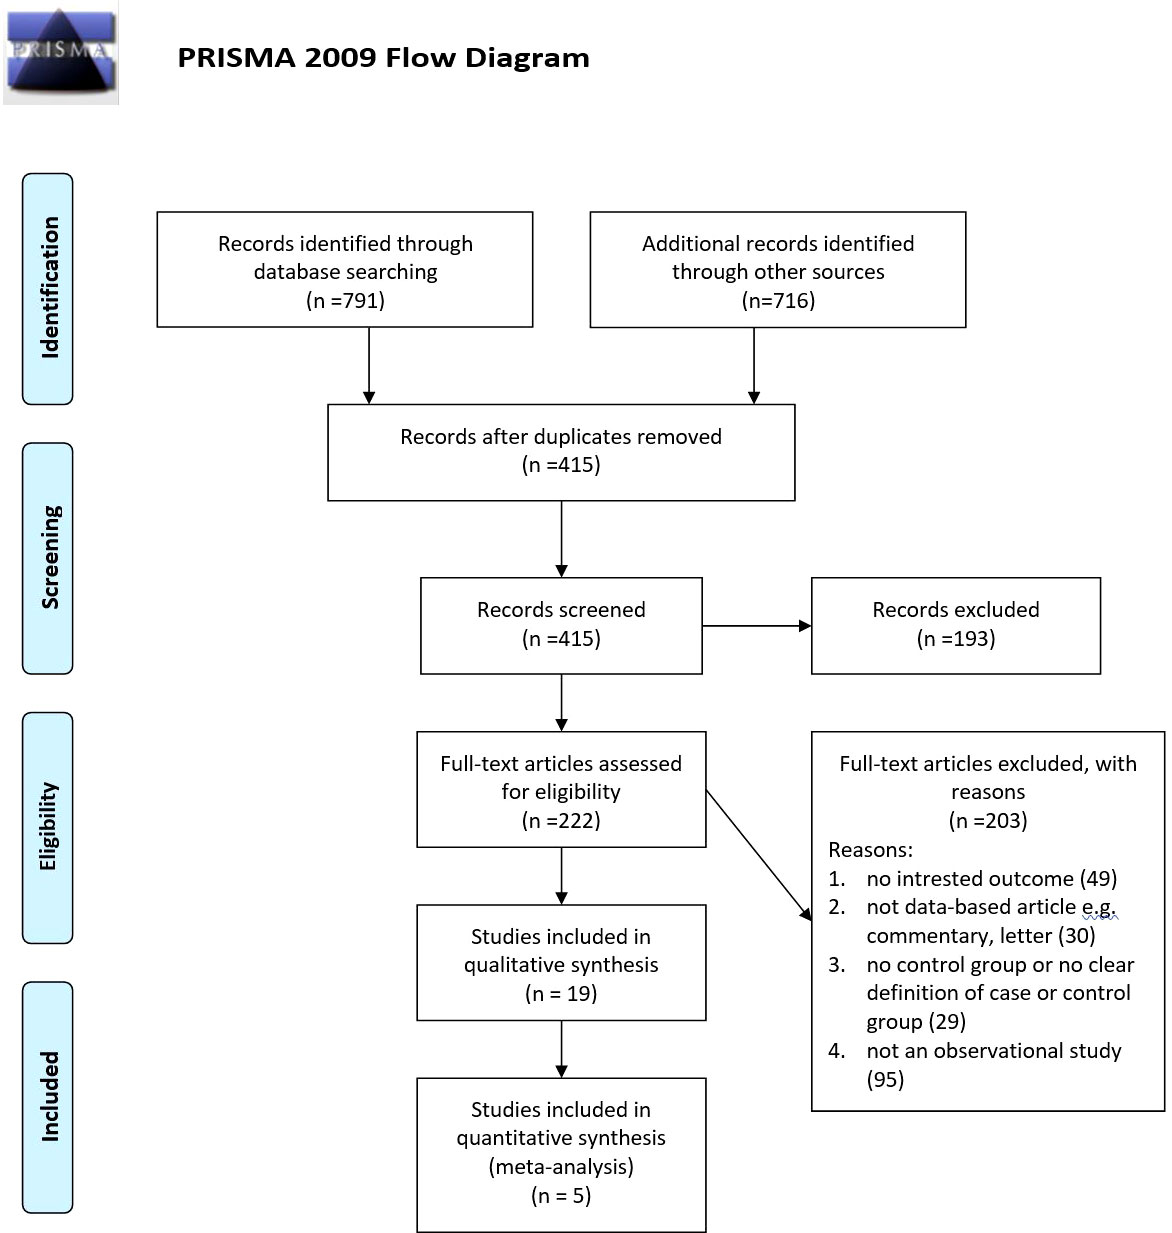
Figure 1 PRISMA diagram for searching resources.
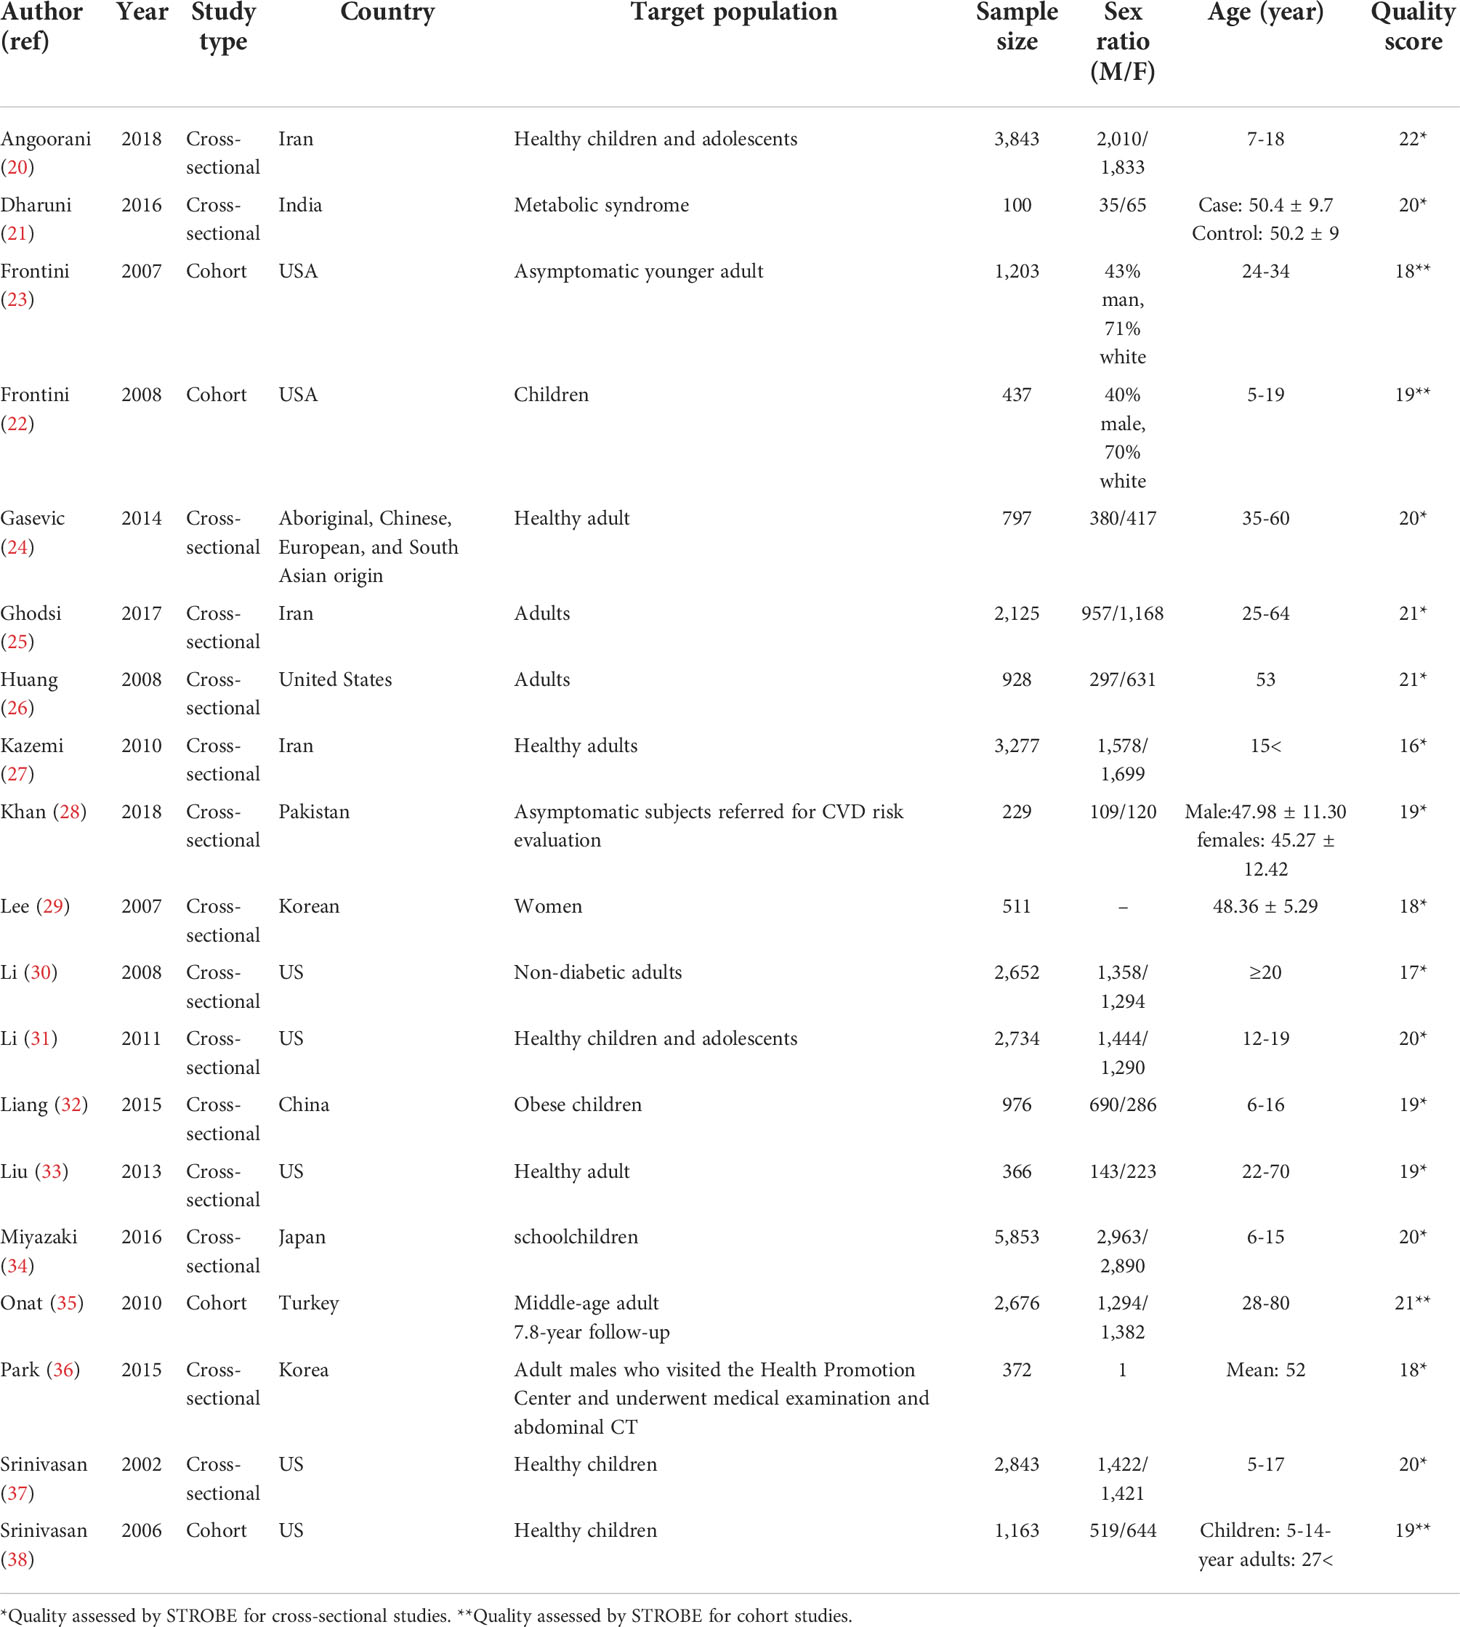
Table 1 Characteristics of the included studies.
Qualitative synthesis
Diagnostic values of Diff-C, non-HDL-C, and atherogenic index
Ten of included papers reported diagnostic values, including sensitivity, specificity, the area under the ROC curve (AUC) of Diff-C, non-HDL-C, and atherogenic index to predict metabolic syndrome or one of its diagnostic components. The highest sensitivity, specificity, and AUC for Diff-C reported in the literature were 0.86 (0.78-0.93) (20), 89.1 (25), and 0.828 (0.770-0.887) (25), respectively. Similarly, non-HDL-C showed a sensitivity ranging from 0.22 in Liu et al.’s (33) study to predict insulin resistance to 75.7 in Ghodsi et al.’s (25) study to predict MetS diagnoses by ATP III criteria. While the highest specificity for non-HDL-C was 89% for patients diagnosed with MetS by Harmonious criteria (33), the lowest specificity was reported 57.1 in Ghodsi et al.’s (25) study for patients diagnosed with MetS IDF criteria. Likewise, the atherogenic index showed AUC, ranging from 0.625 (32) to 0.872 (24). Table 2 demonstrates diagnostic values of Diff-C, non-HDL-C, and atherogenic index to predict MetS or its components.
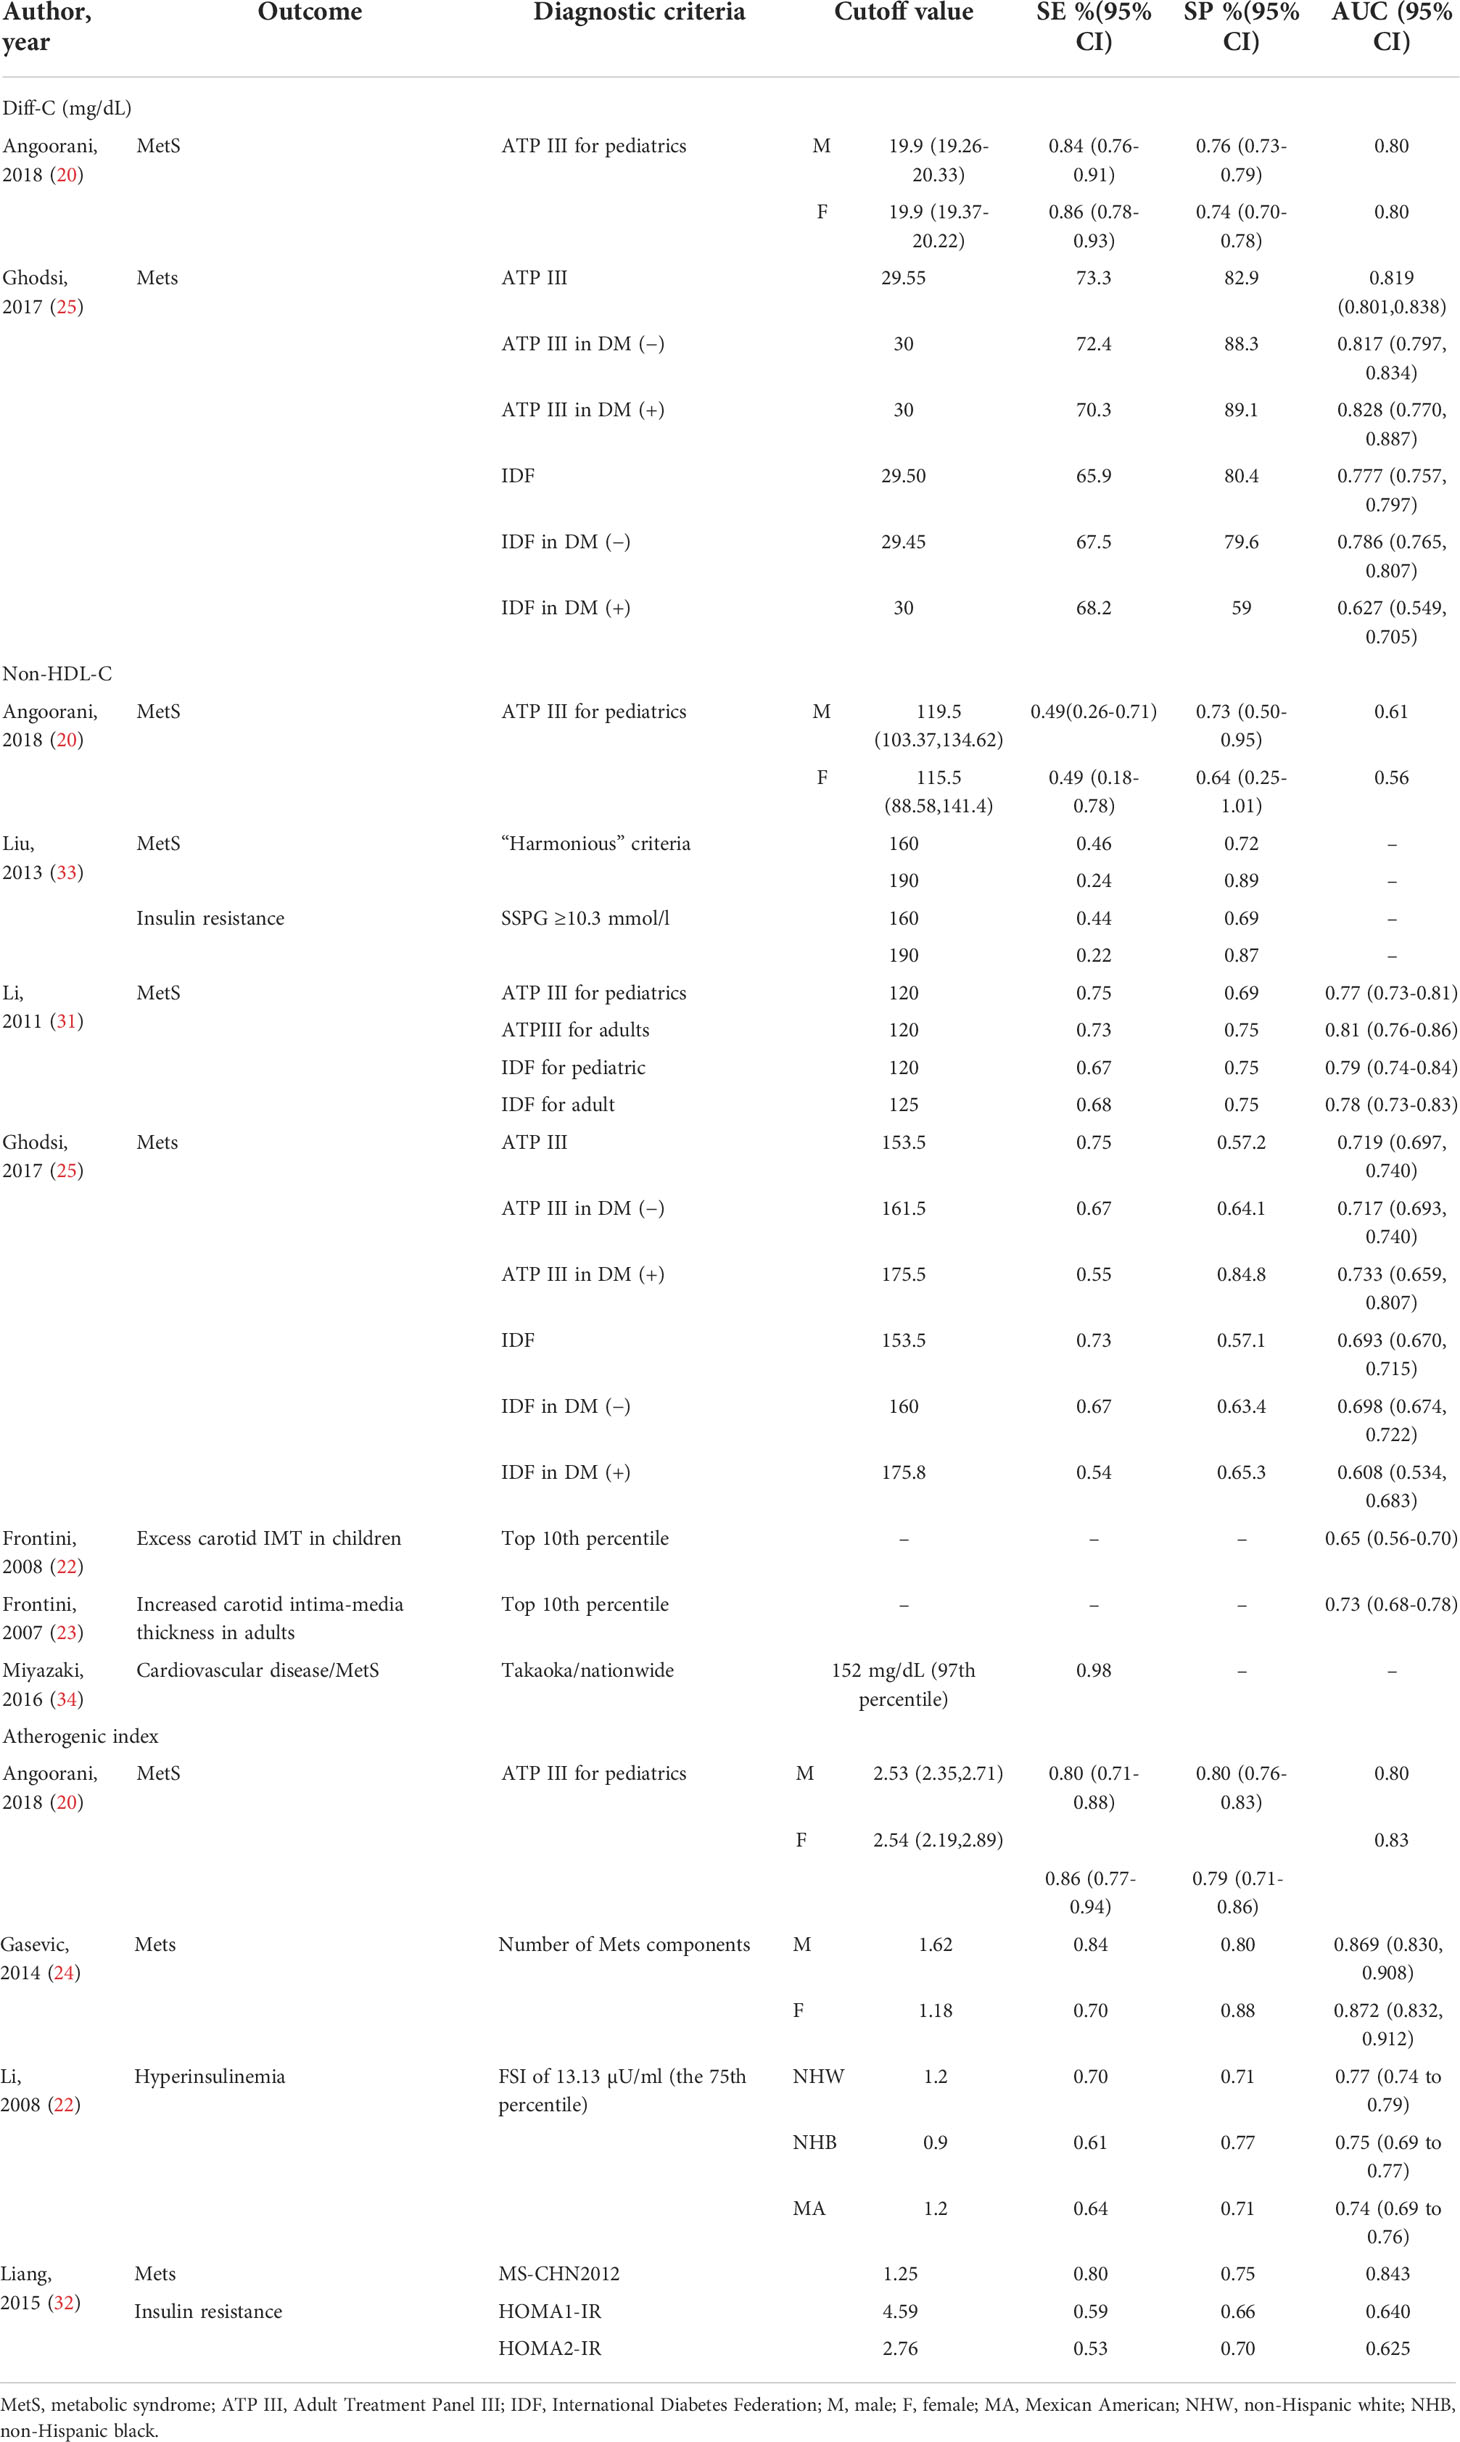
Table 2 Characteristics of the included studies which assessed the diagnostic value of Diff-C, non-HDL, and atherogenic index to predict CMRFs.
Association of Diff-C, non-HDL-C, and atherogenic index and MetS or its components
Our search yielded 14 articles measuring OR, correlation coefficient, risk ratio, Spearman correlation, Pearson correlation, multiple linear regression, t-test, and Poisson regression analysis to evaluate the association of Diff-C, non-HDL-C, and atherogenic index with MetS or its components. Regarding the association of MetS and Diff-C, the highest adjusted OR was 26.29 (17.71-39.05) in patients diagnosed by ATP III, followed by 10.71 (7.47–15.35) in patients diagnosed by IDF, both reported in Ghodsi et al.’s study (25). Non-HDL-C showed a relatively strong correlation with MetS with ORs as high as 5.87 (3.92-8.80) (25) and Spearman correlation results as high as 0.95 p < 0.0001 (37). Similarly, ORs reported for atherogenic index and MetS range from 1.00 (0.92 to 1.09) in Angoorani et al.’s (20) study per one-unit increment of the atherogenic index to predict high blood pressure to 40.26 to predict high triglyceride level (20) (Table 3).
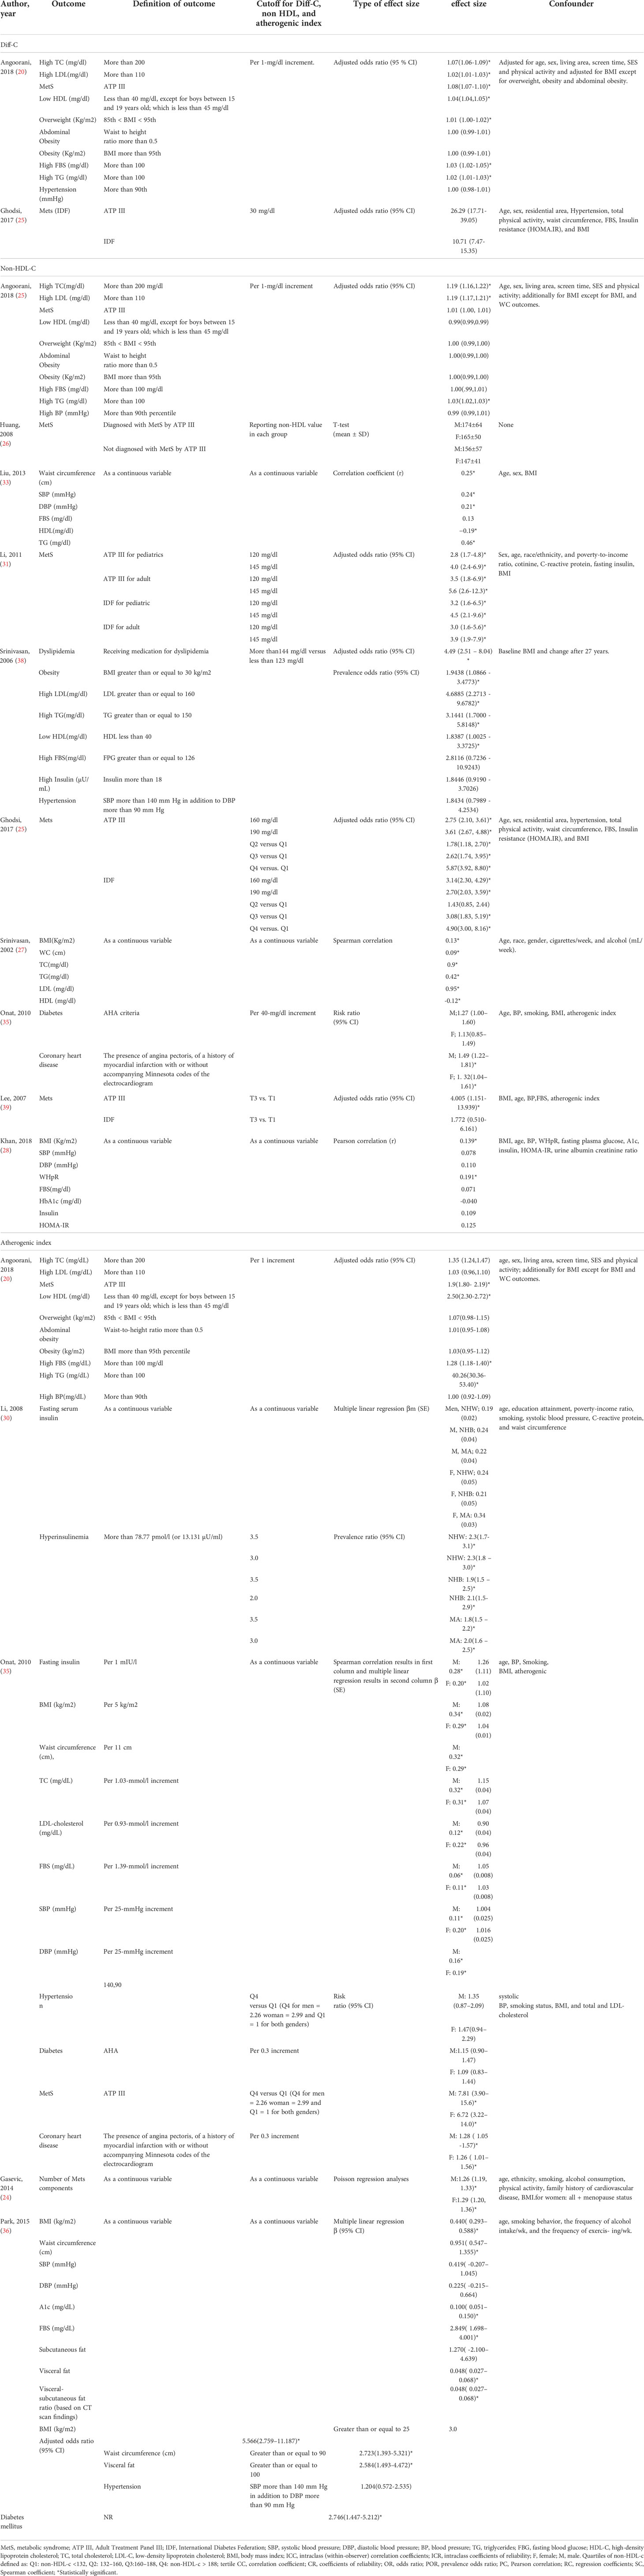
Table 3 Characteristics of the included studies which assessed relationship between Diff-C, non-HDL, and atherogenic index and CMRFs.
Quantitative synthesis
Data were from 17,860 participants of the five papers included in quantitative analysis which revealed that metabolic syndrome is linked with non-HDL-C in both adults (OR 3.53, 95% CI: 2.29-4.78) and children (OR 2.27, 95% CI: 1.65-2.90). Concerning the two different definitions used for metabolic syndrome in studies, the current meta-analysis demonstrated that the non-HDL-C level is correlated with metabolic syndrome using either ATP III diagnostic criteria (OR 3.77, 95% CI: 2.14-5.39) or IDF diagnostic criteria (OR 2.71, 95% CI: 1.98-3.44). The meta-analysis results are summarized in Table 4. Also, Figure 2 illustrates the forest plot of included studies.
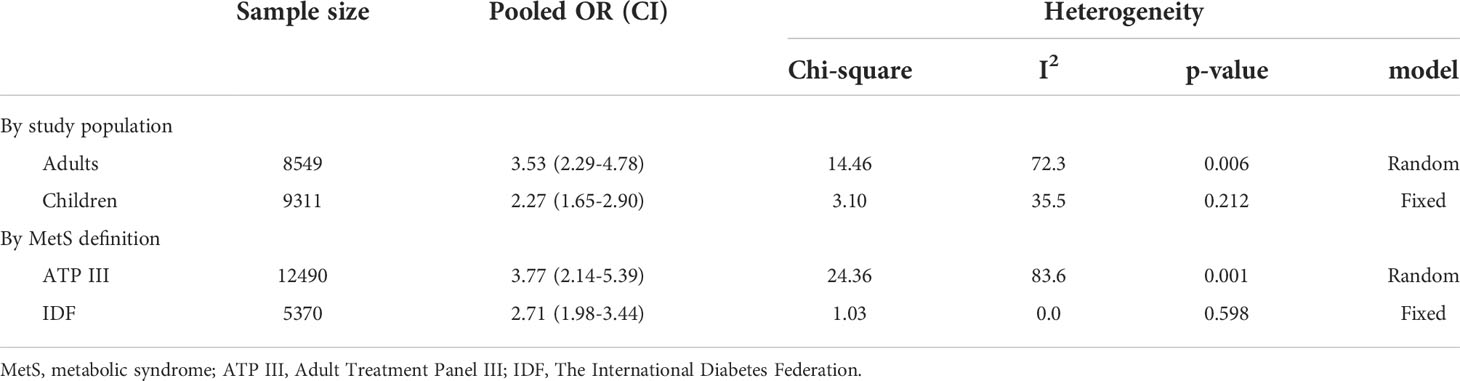
Table 4 Meta-analysis of the association between non-HDL-C with metabolic syndrome.
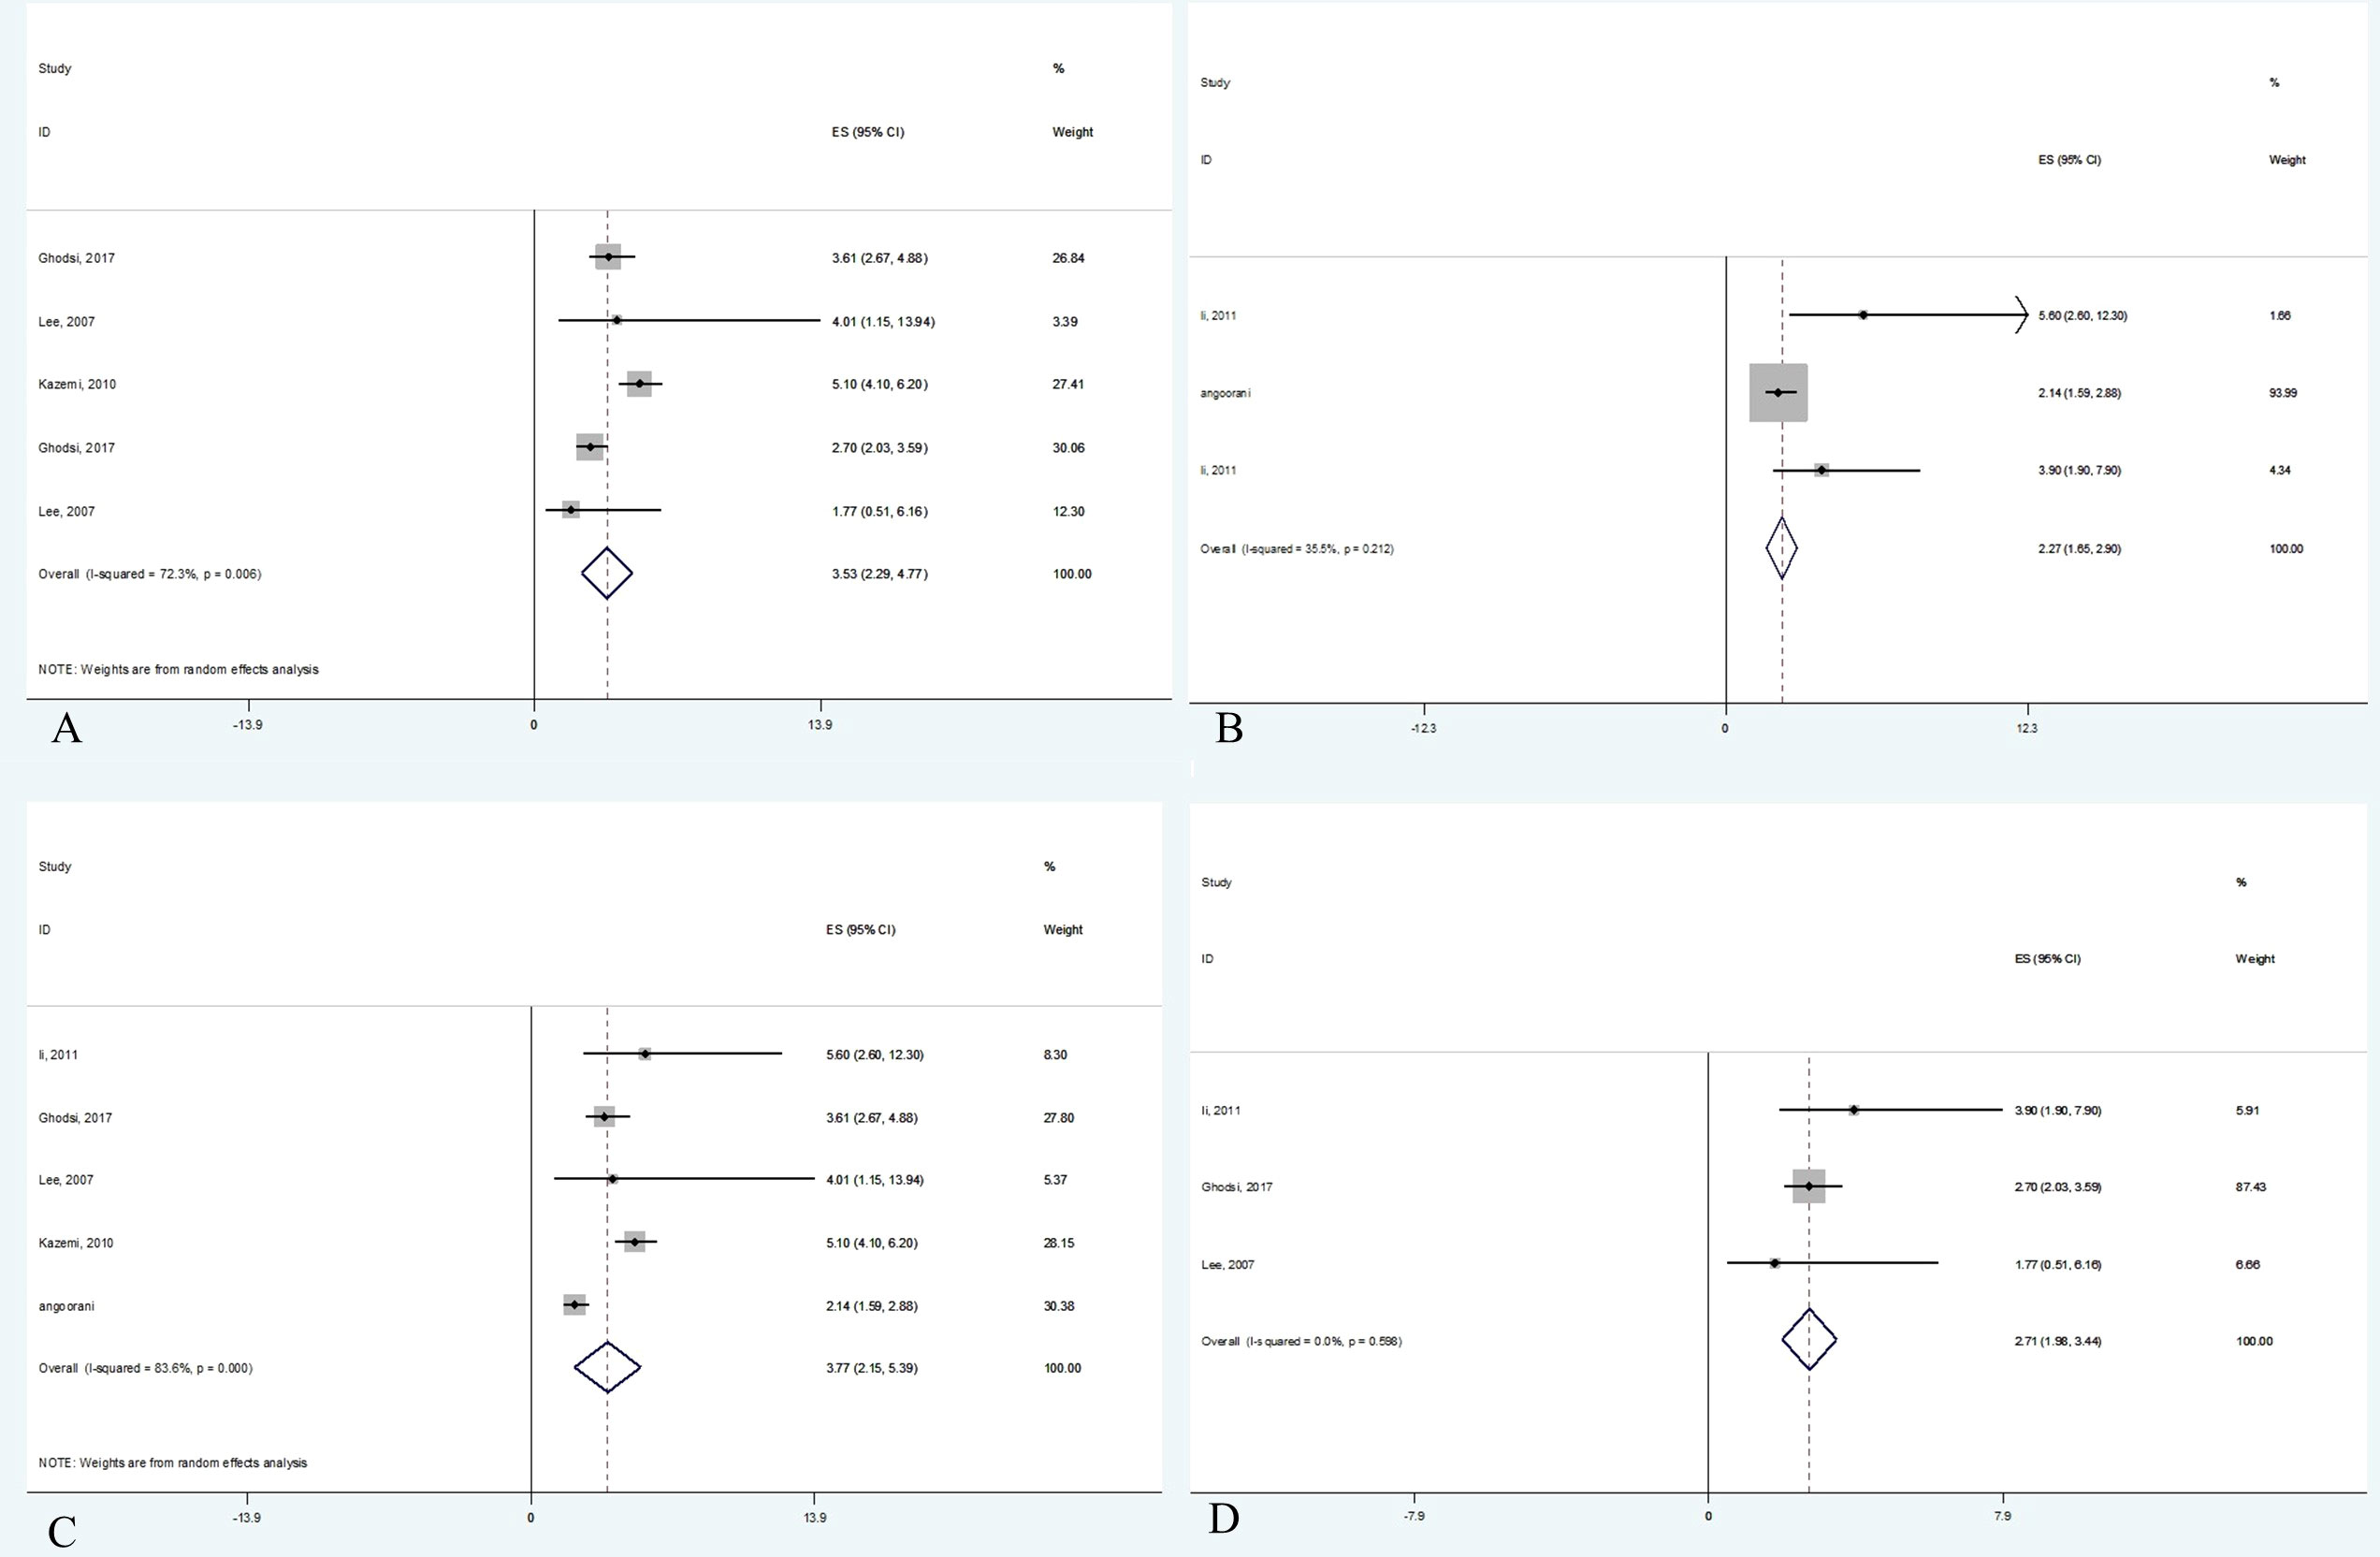
Figure 2 Forest plot of studies included in meta-analysis. (A) The association between non-HDL-C with metabolic syndrome in adults. (B) The association between non-HDL-C with metabolic syndrome in children. (C) The association between non-HDL-C with metabolic syndrome based on ATP III criteria. (D) The association between non-HDL-C with metabolic syndrome based on IDF criteria.
Publication bias
Begg’s (p = 0.567) showed no evidence of significant publication bias between non-HDL-C level and odds of being diagnosed with MetS. None of the included study population dramatically influenced the overall pooled OR. The funnel plot is demonstrated in Figure 3.

Figure 3 Funnel plot of studies included in quantitative analysis.
Discussion
This study demonstrated that not merely can atherogenic lipid indices predict the diagnosis of MetS or its components but also these indices are correlated with higher odds of being diagnosed with these risk factors, including Mets, obesity, hypertriglyceridemia, reduced HDL cholesterol, diabetes, and hypertension.
In other words, our findings revealed that the odds of being diagnosed with MetS are nearly three times higher in patients with high non-HDL-C levels. Our data revealed that not only is non-HDL-C a reliable test to predict the MetS diagnosis in adults but also there are higher odds of being diagnosed with MetS in children with increased non-HDL-C levels. As pediatric MetS is a strong predictor of adulthood MetS (40), these patients are at a higher risk of type 2 diabetes and cardiovascular events (41). Moreover, the previous studies proved that interventions in pediatric MetS patients in early life could prevent MetS complications (42, 43). Therefore, this study proposes non-HDL-C as a marker to predict the odds of being diagnosed with MetS in pediatric patients.
In this study, we compared the criteria with which the MetS is diagnosed. It should be noted that in the same population the number of patients diagnosed by ATP III criteria is lower compared to patients diagnosed by IDF criteria (44). That is to say, ATP III has higher sensitivity, while IDF has higher specificity to diagnose MetS, and on average, patients diagnosed by ATP III are at a higher risk of cardiovascular events in comparison to patients diagnosed by IDF (45). Nevertheless, as confidence intervals regarding ATPIII and IDF overlap, this study demonstrated that the correlation of MetS and non-HDL is regardless of the MetS criteria.
Regardless of the criteria in which MetS is defined, it consists of five components, including obesity, hypertriglyceridemia, reduced HDL cholesterol, diabetes, and hypertension. The current study indicated a notable link between non-HDL-C and atherogenic index. Likewise, Sheth et al.’s study showed a significant correlation between obesity and non-HDL-C. Besides, they concluded that non-HDL-C and obesity have a cumulative role, and both should be considered possible biomarkers for CVD (46).
Another cardiometabolic risk factor is hypertriglyceridemia. This systematic review identified a notable association between hypertriglyceridemia and increased non-HDL-C and atherogenic index levels. Genetic and epidemiologic studies confirmed a causal association between elevated triglyceride and atherosclerosis (47, 48).
In the comparison of hypertriglyceridemia, and non-HDL-C, on the one hand, Puri et al. showed that non-HDL-C is more closely connected with coronary atheroma progression compared to triglyceride. In other words, non-HDL-C is linearly related to plaque progression, while only patients with triglyceride levels higher than 200 mg/dl showed an increment in risk of progression of coronary atheroma (49).
On the other hand, Bonito et al.’s study stated that non-HDL-C level is a weaker predictor for CVD incidence compared to triglyceride. It should be noted that their data demonstrated that patients with increased non-HDL-C and triglyceride levels are at a much higher risk of CVD compared to patients who solely have one increased parameter. That is to say, their data suggests that non-HDL-C and hypertriglyceridemia have a cumulative effect (50). Our data revealed that patients with increased non-HDL-C are at a higher risk of hypertriglyceridemia, and both are at a higher risk of MetS complications, especially CVD and atherosclerosis. For example, a cross-sectional article, which was conducted on 2,843 participants of the Bogalusa Heart Study, showed that non-HDL-C was related positively to triglycerides (Spearman correlation coefficient r = 0.42, p-value < 0.05) (37).
Another significant risk factor of CVD is diabetes. This study proved that diabetic patients have higher non-HDL-C levels compared to non-diabetic patients. Interestingly, diabetic patients with increased non-HDL-C levels are at a higher risk of severe coronary artery disease, regardless of their LDL-C level. In other words, in order to reduce CVD incidence in diabetic patients, not merely decreasing the LDL-C cholesterol is crucial but also reducing non-HDL-C levels should be considered (51).
This study showed that patients with increased non-HDL-C levels are at a higher risk of hypertension incidence. For example, Liu et al.’s article, a cross-sectional study conducted on 366 adult volunteers, showed that non-HDL-C levels and SBP and DBP are correlated (Spearman correlation coefficient r = 0.21, p-value < 0.05) (33). To justify this coincidence, Halperin et al. stated that dyslipidemia, especially high non-HDL-C level, is correlated with atherosclerosis, which may be an essential factor in the development of hypertension (52).
Limitations
This study has some limitations which have to be addressed. First, the number of studies included was relatively low. In addition, some of these studies reported a small number of indices. Second, the heterogeneity of included studies, especially in terms of cutoff points of lipid, metabolic syndrome definition, and study population (children and adults), made the comparability of included articles challenging. Third, it should be noted that non-HDL comprises different lipoproteins, each of which affects the outcome differently. This study focused on overall effects of these lipoproteins, instead of assessing each of their effects, separately. Fourth, although we included adjusted studies in the meta-analysis, it should be considered that confounders may be different in included studies. Fifth, it should be considered that the Diff-C amount is alike the TG level; however, it also includes the remnant cholesterol (53).
Conclusion
Although a limited number of studies were included in our study, non-HDL-C, Diff-C, and atherogenic index have shown to be associated with increased odds of being diagnosed with metabolic syndrome or its components. These findings were consistent in both adults and children and MetS diagnosed with both ATP III and IDF diagnostic criteria. Concerning the distinct designs and different diagnostic criteria, cohort studies with higher sample sizes should be conducted to more strongly evaluate the association between these lipid markers and MetS.
Data availability statement
The original contributions presented in the study are included in the article/Supplementary Material. Further inquiries can be directed to the corresponding authors.
Author contributions
PM interpreted the data and drafted the manuscript. MQ and AG designed the study, interpreted the data, reviewed the article critically, and revised it for important intellectual content. FA and AE participated in systematic search conduction. JH and ESh participated in data extraction, and quality assessment. PM, ES, and SD analyzed and interpreted the data. All authors contributed to the article and approved the submitted version.
Funding
This study was funded by Alborz University of Medical Sciences.
Conflict of interest
The authors declare that the research was conducted in the absence of any commercial or financial relationships that could be construed as a potential conflict of interest.
Publisher’s note
All claims expressed in this article are solely those of the authors and do not necessarily represent those of their affiliated organizations, or those of the publisher, the editors and the reviewers. Any product that may be evaluated in this article, or claim that may be made by its manufacturer, is not guaranteed or endorsed by the publisher.
Supplementary material
The Supplementary Material for this article can be found online at: https://www.frontiersin.org/articles/10.3389/fendo.2022.957136/full#supplementary-material
References
1. Park S, Lee S, Kim Y, Lee Y, Kang MW, Han K, et al. Altered risk for cardiovascular events with changes in the metabolic syndrome status: A nationwide population-based study of approximately 10 million persons. Ann Internal Med (2019) 171(12):875–84. doi: 10.7326/M19-0563
2. Ford ES, Giles WH, Dietz WH. Prevalence of the metabolic syndrome among US adults: Findings from the third national health and nutrition examination survey. Jama. (2002) 287(3):356–9. doi: 10.1001/jama.287.3.356
3. Miranda JJ, Carrillo-Larco RM, Ferreccio C, Hambleton IR, Lotufo PA, Nieto-MartSínez R, et al. Trends in cardiometabolic risk factors in the americas between 1980 and 2014: A pooled analysis of population-based surveys. Lancet Global Health (2020) 8(1):e123–e33. doi: 10.1016/S2214-109X(19)30484-X
4. Cannon CP. Cardiovascular disease and modifiable cardiometabolic risk factors. Clin cornerstone (2007) 8(3):11–28. doi: 10.1016/S1098-3597(07)80025-1
5. Nelson RH. Hyperlipidemia as a risk factor for cardiovascular disease. Primary Care: Clinics Office Practice (2013) 40(1):195–211. doi: 10.1016/j.pop.2012.11.003
6. Gordon T, Castelli WP, Hjortland MC, Kannel WB, Dawber TR. High density lipoprotein as a protective factor against coronary heart disease: the framingham study. Am J Med (1977) 62(5):707–14. doi: 10.1016/0002-9343(77)90874-9
7. Gordon DJ, Probstfield JL, Garrison RJ, Neaton JD, Castelli WP, Knoke JD, et al. High-density lipoprotein cholesterol and cardiovascular disease. Four prospective Am Stud Circulation (1989) 79(1):8–15. doi: 10.1161/01.cir.79.1.8
8. Barter P, Gotto AM, LaRosa JC, Maroni J, Szarek M, Grundy SM, et al. HDL cholesterol, very low levels of LDL cholesterol, and cardiovascular events. New Engl J Med (2007) 357(13):1301–10. doi: 10.1056/NEJMoa064278
9. Sever PS, Dahlöf B, Poulter NR, Wedel H, Beevers G, Caulfield M, et al. Prevention of coronary and stroke events with atorvastatin in hypertensive patients who have average or lower-than-average cholesterol concentrations, in the Anglo-Scandinavian cardiac outcomes trial–lipid lowering arm (ASCOT-LLA): A multicentre randomised controlled trial. Lancet (2003) 361(9364):1149–58. doi: 10.1016/S0140-6736(03)12948-0
10. Unit ES. Efficacy and safety of cholesterol-lowering treatment: prospective meta-analysis of data from 90 056 participants in 14 randomised trials of statins. Lancet. (2005) 366(9493):1267–78. doi: 10.1016/S0140-6736(05)67394-1
11. Grundy SM, Becker D, Clark LT, Cooper RS, Denke MA, Wm. JH, et al. Third report of the national cholesterol education program (NCEP) expert panel on detection, evaluation, and treatment of high blood cholesterol in adults (Adult treatment panel III) final report. Circulation. (2002) 106(25):3143–421. doi: 10.1161/circ.106.25.3143
12. Cannon CP, Braunwald E, McCabe CH, Rader DJ, Rouleau JL, Belder R, et al. Intensive versus moderate lipid lowering with statins after acute coronary syndromes. New Engl J Med (2004) 350(15):1495–504. doi: 10.1056/NEJMoa040583
13. LaRosa JC, Grundy SM, Waters DD, Shear C, Barter P, Fruchart J-C, et al. Intensive lipid lowering with atorvastatin in patients with stable coronary disease. New Engl J Med (2005) 352(14):1425–35. doi: 10.1056/NEJMoa050461
14. Liu J, Sempos CT, Donahue RP, Dorn J, Trevisan M, Grundy SM. Non–high-density lipoprotein and very-low-density lipoprotein cholesterol and their risk predictive values in coronary heart disease. Am J Cardiol (2006) 98(10):1363–8. doi: 10.1016/j.amjcard.2006.06.032
15. Grundy SM, Howard B, Smith S Jr., Eckel R, Redberg R, Bonow RO. Prevention conference VI: Diabetes and cardiovascular disease: Executive summary: Conference proceeding for healthcare professionals from a special writing group of the American heart association. Circulation. (2002) 105(18):2231–9. doi: 10.1161/01.CIR.0000013952.86046.DD
16. Association AD. Dyslipidemia management in adults with diabetes. Diabetes Care (2004) 27(suppl 1):s68–71. doi: 10.2337/diacare.27.2007.S68
17. Cannon CP. Mixed dyslipidemia, metabolic syndrome, diabetes mellitus, and cardiovascular disease: Clinical implications. Am J Cardiol (2008) 102(12):5L–9L. doi: 10.1016/j.amjcard.2008.09.067
18. Rader DJ. Effect of insulin resistance, dyslipidemia, and intra-abdominal adiposity on the development of cardiovascular disease and diabetes mellitus. Am J Med (2007) 120(3):S12–S8. doi: 10.1016/j.amjmed.2007.01.003
19. Liu J, Sempos C, Donahue RP, Dorn J, Trevisan M, Grundy SM. Joint distribution of non-HDL and LDL cholesterol and coronary heart disease risk prediction among individuals with and without diabetes. Diabetes Care (2005) 28(8):1916–21. doi: 10.2337/diacare.28.8.1916
20. Angoorani P, Khademian M, Ejtahed H-S, Heshmat R, Motlagh ME, Vafaeenia M, et al. Are non-high–density lipoprotein fractions associated with pediatric metabolic syndrome? The CASPIAN-V study. Lipids Health disease. (2018) 17(1):1–9. doi: 10.1186/s12944-018-0895-1
21. Dharuni R, Maruthi-Prasad B, Vishwanath H, Harish R. Evaluation of triglyceride: HDL-c ratio and non-HDL-C as harbingers of increased cardiovascular risk in metabolic syndrome. Int J Res Med Sci (2016) 4:4050–4. doi: 10.18203/2320-6012.ijrms20162932
22. Frontini MG, Srinivasan SR, Xu J, Tang R, Bond MG, Berenson GS. Usefulness of childhood non–high density lipoprotein cholesterol levels versus other lipoprotein measures in predicting adult subclinical atherosclerosis: The bogalusa heart study. Pediatrics. (2008) 121(5):924–9. doi: 10.1542/peds.2007-1472
23. Frontini MG, Srinivasan SR, Xu J-H, Tang R, Bond MG, Berenson G. Utility of non–high-density lipoprotein cholesterol versus other lipoprotein measures in detecting subclinical atherosclerosis in young adults (the bogalusa heart study). Am J Cardiol (2007) 100(1):64–8. doi: 10.1016/j.amjcard.2007.01.071
24. Gasevic D, Frohlich J, Mancini GJ, Lear SA. Clinical usefulness of lipid ratios to identify men and women with metabolic syndrome: a cross-sectional study. Lipids Health disease. (2014) 13(1):1–10. doi: 10.1186/1476-511X-13-159
25. Ghodsi S, Meysamie A, Abbasi M, Ghalehtaki R, Esteghamati A, Malekzadeh MM, et al. Non–high-density lipoprotein fractions are strongly associated with the presence of metabolic syndrome independent of obesity and diabetes: a population-based study among Iranian adults. J Diabetes Metab Disord (2017) 16(1):1–13. doi: 10.1186/s40200-017-0306-6
26. Huang J, Parish R, Mansi I, Yu H, Kennen EM, Davis T, et al. Non-high-density lipoprotein cholesterol in patients with metabolic syndrome. J Invest Med (2008) 56(7):931–6. doi: 10.2310/JIM.0b013e318182080a
27. Kazemi SA, Franak Sharifi MS, Koosha A, Mousavinasab N. The predictive role of non-HDL cholesterol for metabolic syndrome. Iranian J Diab Lipid Disorders (2011) 10(2):208–13.
28. Khan SH, Asif N, Ijaz A, Manzoor SM, Niazi NK, Fazal N. Status of non-HDL-cholesterol and LDL-cholesterol among subjects with and without metabolic syndrome. Group. (2018) 2(14):15.
29. Choi BH, Hye JS, Cha CK, Ahn Y. (Non-HDL cholesterol as a risk factor of metabolic syndrome in Korean women). Korean J Obes (2007) 16(3):102–10. doi: 10.1186/s12944-018-0895-1
30. Li C, Ford ES, Meng Y-X, Mokdad AH, Reaven GM. Does the association of the triglyceride to high-density lipoprotein cholesterol ratio with fasting serum insulin differ by race/ethnicity? Cardiovasc Diabetol (2008) 7(1):1–9. doi: 10.1186/1475-2840-7-4
31. Li C, Ford ES, McBride PE, Kwiterovich PO, McCrindle BW, Gidding SS. Non–high-density lipoprotein cholesterol concentration is associated with the metabolic syndrome among US youth aged 12-19 years. J pediatrics (2011) 158(2):201–7. doi: 10.1016/j.jpeds.2010.07.050
32. Liang J, Fu J, Jiang Y, Dong G, Wang X, Wu W. TriGlycerides and high-density lipoprotein cholesterol ratio compared with homeostasis model assessment insulin resistance indexes in screening for metabolic syndrome in the chinese obese children: A cross section study. BMC pediatrics (2015) 15(1):1–7. doi: 10.1186/s12887-015-0456-y
33. Liu A, Reaven G. Is measurement of non-HDL cholesterol an effective way to identify the metabolic syndrome? Nutrition Metab Cardiovasc Dis (2013) 23(11):1122–7. doi: 10.1016/j.numecd.2012.12.001
34. Miyazaki A, Oguri A, Ichida F. Non-high-density lipoprotein cholesterol as a cardiovascular risk screening tool in children. Pediatr Int (2016) 58(6):439–44. doi: 10.1111/ped.12891
35. Onat A, Can G, Kaya H, Hergenç G. “Atherogenic index of plasma”(log10 triglyceride/high-density lipoprotein– cholesterol) predicts high blood pressure, diabetes, and vascular events. J Clin lipidol (2010) 4(2):89–98. doi: 10.1016/j.jacl.2010.02.005
36. Park H-R, Shin S-R, Han AL, Jeong YJ. The correlation between the triglyceride to high density lipoprotein cholesterol ratio and computed tomography-measured visceral fat and cardiovascular disease risk factors in local adult male subjects. Korean J Family Med (2015) 36(6):335. doi: 10.4082/kjfm.2015.36.6.335
37. Srinivasan SR, Myers L, Berenson GS. Distribution and correlates of non-high-density lipoprotein cholesterol in children: the bogalusa heart study. Pediatrics. (2002) 110(3):e29–e. doi: 10.1542/peds.110.3.e29
38. Srinivasan SR, Frontini MG, Xu J, Berenson GS. Utility of childhood non–high-density lipoprotein cholesterol levels in predicting adult dyslipidemia and other cardiovascular risks: the bogalusa heart study. Pediatrics. (2006) 118(1):201–6. doi: 10.1542/peds.2005-1856
39. Lee KH, Son JC, Kim BT, Choi BH, Hye JS, Cha CK, et al. Non-HDL cholesterol as a risk factor of metabolic syndrome in Korean women. Korea J Obes (2007) 16:102–10.
40. Magnussen CG, Koskinen J, Chen W, Thomson R, Schmidt MD, Srinivasan SR, et al. Pediatric metabolic syndrome predicts adulthood metabolic syndrome, subclinical atherosclerosis, and type 2 diabetes mellitus but is no better than body mass index alone: the bogalusa heart study and the cardiovascular risk in young finns study. Circulation. (2010) 122(16):1604–11. doi: 10.1161/CIRCULATIONAHA.110.940809
41. Koskinen J, Magnussen CG, Sinaiko A, Woo J, Urbina E, Jacobs DR Jr., et al. Childhood age and associations between childhood metabolic syndrome and adult risk for metabolic syndrome, type 2 diabetes mellitus and carotid intima media thickness: The international childhood cardiovascular cohort consortium. J Am Heart Assoc (2017) 6(8):1–17. doi: 10.1161/JAHA.117.005632
42. Weihe P, Weihrauch-Blüher S. Metabolic syndrome in children and adolescents: Diagnostic criteria, therapeutic options and perspectives. Curr Obes Rep (2019) 8(4):472–9. doi: 10.1007/s13679-019-00357-x
43. Tagi VM, Samvelyan S, Chiarelli F. Treatment of metabolic syndrome in children. Hormone Res paediatrics (2020) 93(4):215–25. doi: 10.1159/000510941
44. Ramli AS, Daher AM, Noor Khan Nor-Ashikin M, Mat-Nasir N, Keat Ng K, Miskan M, et al. JIS definition identified more Malaysian adults with metabolic syndrome compared to the NCEP-ATP III and IDF criteria. BioMed Res Int (2013) 2013:760963. doi: 10.1155/2013/760963
45. Nilsson PM, Engström G, Hedblad B. The metabolic syndrome and incidence of cardiovascular disease in non-diabetic subjects–a population-based study comparing three different definitions. Diabetic Med (2007) 24(5):464–72. doi: 10.1111/j.1464-5491.2007.02142.x
46. Sheth J, Shah A, Sheth F, Trivedi S, Nabar N, Shah N, et al. The association of dyslipidemia and obesity with glycated hemoglobin. Clin Diabetes Endocrinol (2015) 1(1):1–7. doi: 10.1186/s40842-015-0004-6
47. Nordestgaard BG, Varbo A. Triglycerides and cardiovascular disease. Lancet (2014) 384(9943):626–35. doi: 10.1016/S0140-6736(14)61177-6
48. Do R, Willer CJ, Schmidt EM, Sengupta S, Gao C, Peloso GM, et al. Common variants associated with plasma triglycerides and risk for coronary artery disease. Nat Genet (2013) 45(11):1345–52. doi: 10.1038/ng.2795
49. Puri R, Nissen Steven E, Shao M, Elshazly Mohamed B, Kataoka Y, Kapadia Samir R, et al. Non-HDL cholesterol and triglycerides. Arteriosclerosis Thrombosis Vasc Biol (2016) 36(11):2220–8. doi: 10.1161/ATVBAHA.116.307601
50. Di Bonito P, Valerio G, Grugni G, Licenziati MR, Maffeis C, Manco M, et al. Comparison of non-HDL-cholesterol versus triglycerides-to-HDL-cholesterol ratio in relation to cardiometabolic risk factors and preclinical organ damage in overweight/obese children: The CARITALY study. Nutrition Metab Cardiovasc Dis (2015) 25(5):489–94. doi: 10.1016/j.numecd.2015.01.012
51. Peters AL. Clinical relevance of non-HDL cholesterol in patients with diabetes. Clin Diab (2008) 26(1):3. doi: 10.2337/diaclin.26.1.3
52. Halperin Ruben O, Sesso Howard D, Ma J, Buring Julie E, Stampfer Meir J, Michael Gaziano J. Dyslipidemia and the risk of incident hypertension in men. Hypertension. (2006) 47(1):45–50. doi: 10.1161/01.HYP.0000196306.42418.0e
Keywords: dyslipidemia, non-high-density lipoprotein cholesterol, metabolic syndrome, cardiovascular disease, cardiometabolic, cholesterol
Citation: Mardi P, Abdi F, Ehsani A, Seif E, Djalalinia S, Heshmati J, Shahrestanaki E, Gorabi AM and Qorbani M (2022) Is non-high-density lipoprotein associated with metabolic syndrome? A systematic review and meta-analysis. Front. Endocrinol. 13:957136. doi: 10.3389/fendo.2022.957136
Received: 30 May 2022; Accepted: 11 August 2022;
Published: 13 September 2022.
Edited by:
Yun Kyung Cho, Asan Medical Center, South KoreaReviewed by:
Malgorzata Wojcik, Jagiellonian University Medical College, PolandMaria Camila Pruper de Freitas, Faculty of Public Health, University of São Paulo, Brazil
Copyright © 2022 Mardi, Abdi, Ehsani, Seif, Djalalinia, Heshmati, Shahrestanaki, Gorabi and Qorbani. This is an open-access article distributed under the terms of the Creative Commons Attribution License (CC BY). The use, distribution or reproduction in other forums is permitted, provided the original author(s) and the copyright owner(s) are credited and that the original publication in this journal is cited, in accordance with accepted academic practice. No use, distribution or reproduction is permitted which does not comply with these terms.
*Correspondence: Armita Mahdavi Gorabi, YXJtaXRhbWFoZGF2aTYxQGdtYWlsLmNvbQ==; Mostafa Qorbani, bXFvcmJhbmkxMzc5QHlhaG9vLmNvbQ==