 Mengyu Li1,2,3†
 Mingzhu Mao1,2,4†Dingyang Wei1,2,4Miao Liu1,2,3
 Xinyue Liu1,2,3Hongmei Leng1,2,4Yiya Wang1,2,4Sizhu Chen1,2,3Ruifan Zhang1,2Yong Zeng1,2Min Wang5
 Jie Li1,2*
 Jie Zhong1,2*
- 1Department of Ophthalmology, Sichuan Provincial People’s Hospital, University of Electronic Science and Technology of China, Chengdu, China
- 2Department of Ophthalmology, Chinese Academy of Sciences Sichuan Translational Medicine Research Hospital, Chengdu, China
- 3Eye School, Chengdu University of Traditional Chinese Medicine, Chengdu, China
- 4School of Medicine, University of Electronic Science and Technology of China, Chengdu, China
- 5Department of Ophthalmology, Dayi Shaoxiang Hospital, Chengdu, China
Introduction: The study aimed to determine the effect of the scanning area used for high-speed ultra-widefield swept-source optical coherence tomography angiography (SS-OCTA) on the detection rate of diabetic retinopathy (DR) lesions.
Methods: This prospective, observational study involved diabetic patients between October 2021 and April 2022. The participants underwent a comprehensive ophthalmic examination and high-speed ultra-widefield SS-OCTA using a 24 mm × 20 mm scanning protocol. A central area denoted as “12 mm × 12 mm-central” was extracted from the 24 mm × 20 mm image, and the remaining area was denoted as “12 mm~24mm-annulus.” The rates of detection of DR lesions using the two scanning areas were recorded and compared.
Results: In total, 172 eyes (41 eyes with diabetes mellitus without DR, 40 eyes with mild to moderate non-proliferative diabetic retinopathy (NPDR), 51 eyes with severe NPDR, and 40 eyes with proliferative diabetic retinopathy (PDR) from 101 participants were included. The detection rates of microaneurysms (MAs), intraretinal microvascular abnormalities (IRMAs), and neovascularization (NV) for the 12 mm × 12 mm central and 24 mm × 20 mm images were comparable (p > 0.05). The detection rate of NPAs for the 24 mm × 20 mm image was 64.5%, which was significantly higher than that for the 12 mm × 12 mm central image (52.3%, p < 0.05). The average ischemic index (ISI) was 15.26% for the 12 mm~24mm-annulus, which was significantly higher than that for the 12 mm × 12 mm central image (5.62%). Six eyes had NV and 10 eyes had IRMAs that only existed in the 12 mm~24mm-annulus area.
Conclusions: The newly developed high-speed ultra-widefield SS-OCTA can capture a 24 mm × 20 mm retinal vascular image during a single scan, which improves the accuracy of detecting the degree of retinal ischemia and detection rate of NV and IRMAs.
1 Introduction
Diabetic retinopathy (DR), one of the most common microvascular complications of diabetes, is among the main causes of vision loss among the working-age population globally. Several meta-analyses have predicted that the global prevalence of diabetes will be 600–700 million people in the next two decades (1, 2). Another study reported an estimated prevalence of 34.6% for all forms of DR and 7.0% for proliferative DR (PDR) (3). PDR is the leading cause of vision loss and preventable blindness in the working-age population.
Within the past decade, several novel imaging technologies have been developed for screening and diagnosing DR. These include laser scanning fundus imaging and swept-source optical coherence tomography angiography (SS-OCTA). As a noninvasive alternative, SS-OCTA has been used in examinations for retinal neovascular diseases including DR. Previous studies have demonstrated that OCTA can detect vascular lesions in DR, such as microaneurysms (MAs), intraretinal microvascular abnormalities (IRMAs), neovascularization (NV), capillary non-perfusion areas (NPAs), hard exudates (HEs), and diabetic macular edema (DME) (4–6).
However, most of the commonly used commercial SS-OCTA devices used in previous studies had a scan area of 12 mm × 12 mm or less centered on the fovea by a single scan. Due to the limitation of the range of observation, clinically significant information outside the scan area may not be captured. Several studies have reported that the imaging area can be increased by stitching images together after multiple scans or adding dioptric lenses to expand the field of view (FOV) (7–10). However, these scanning protocols or techniques required longer durations of acquisition and may introduce more artifacts (8, 10).
The recently developed TowardPi high-speed ultra-widefield SS-OCTA systems have an A-scan rate of 400 kHz (BMizar), which can capture an area of 24 mm × 20 mm (about 120° FOV) in a single scan. In this study, we used the latest high-speed ultra-widefield SS-OCTA to obtain a 24 mm × 20 mm retinal blood flow image and compared its detection of DR lesions detection with a relatively narrower 12 mm × 12 mm image.
2 Methods
2.1 Participants
This prospective observational study involved patients with DR or diabetes mellitus recruited from the ophthalmic outpatient department of Sichuan Provincial People’s Hospital from October 2021 to April 2022. A total of 172 eyes from 101 participants were included; the participants were 56.50 ± 10.58 (25–86) years old. The durations of diabetes (since diagnosis) among the participants ranged from 1 month to 32 years (Table 1). This study was approved by the Ethics Committee of Sichuan Provincial People’s Hospital. Informed consent was obtained from the patients before the examination. All procedures were conducted following the guidelines of the Declaration of Helsinki.
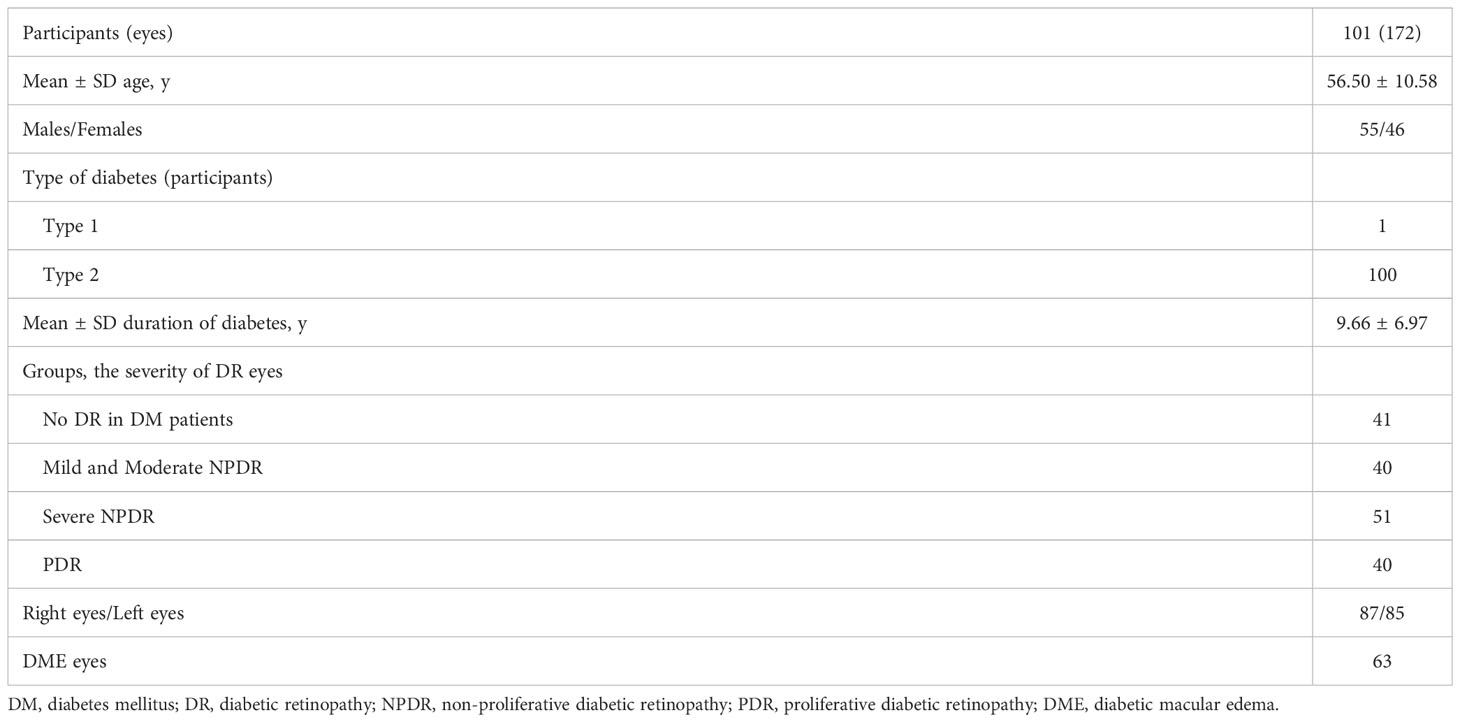
Table 1 Demographic characteristics of participants.
2.2 Inclusion and exclusion criteria
The inclusion criterion was diabetes mellitus diagnosed with or without DR. The exclusion criteria were as follows: uncooperative patients with extremely poor visual acuity or inability to fix the bulbus oculi and severe opacity of the refractive media; vitreoretinopathy caused by other eye diseases; complications other than hypertension, dyslipidemia, and abnormal renal function; intraocular surgery other than for cataracts; poor images, including images with a system built-in automatic quality score below 6/10 (5), images with severe motion artifacts preventing accurate analysis, and blurry images (11); and opacities of the refractive media affecting more than 30% of OCTA images (Supplementary SFig. 1) (12).
2.3 Examination procedure
All patients underwent a comprehensive ophthalmic examination, including best-corrected visual acuity, intraocular pressure, computerized optometry, fundus photography, ocular biometry, and high-speed ultra-widefield OCTA. We used TowardPi high-speed ultra-widefield SS-OCTA systems (BM-400K BMizar, TowardPi Medical Technology; Beijing, China) to examine the patients. The instrument used a swept frequency laser with a center wavelength of 1,060 nm and a scanning speed of 400,000 times/s. With patient cooperation and no tracking, a single image was obtained in 15 seconds with a scan depth of 6 mm and a FOV of 120° resulting in a maximum fundus imaging area of 24 mm × 20 mm.
The participants were instructed to look at the inner marker light, and a 24 mm × 20 mm SS-OCTA image was obtained with the fovea as the center. Image quality was automatically rated on a scale of 1 to 10 by built-in software. If the image quality is poor (<6/10), the process was repeated and new images were obtained when the image quality was poor; images with better quality were selected for the analysis. For each participant, SS-OCTA was performed using the 24 mm × 20 mm scanning mode, and 76 eyes from 38 patients were also scanned using 12 mm × 12 mm scanning mode at the same time.
2.4 Image analysis
The images were annotated by two experienced ophthalmologists. Disagreements between them were openly adjudicated by an independent senior retina specialist (ZL) who had more than 30 years of working experience in diagnosing and treating DR. All lesions were identified based on their characteristics on high-speed ultra-widefield SS-OCTA images, as in previous reports (6, 10, 13). MAs were defined as moderate or hyperreflective spots, and they had various morphologic patterns, including fusiform, saccular, curved, and rarely coiled shapes, in the SS-OCTA images (14). Adjacent to the NPAs, the IRMAs appeared as tortuous, dilated, and annular abnormal microvessels in the retina. After segmentation error correction, the NVs were observed as extraretinal vessels present on the vitreoretinal interface slab. The NPAs were defined as absence of capillary beds between a terminal arteriole and a proximal venule or larger vessel (15), and potential NPAs with areas less than 0.2 mm² were not delineated (16). The hard exudates appeared on the B-scan as bright hyperreflective lesions with posterior shadows (10).
Each 24 mm × 20 mm SS-OCTA image was marked with a 12 mm × 12 mm square centered on the macula with the built-in tool and divided into 12 mm × 12 mm-central and 12 mm~24mm-annulus areas (Figure 1). The presence or absence of MAs, IRMAs, NV, NPAs, HEs, and DME was marked in each area (Figure 2). The dimensions of the NPAs (mm2) were also recorded (16). The ischemic Index (ISI) was calculated by dividing NPAs by the corresponding retinal area (17). To evaluate the accuracy of the 12 mm × 12 mm-central scanning area, which was obtained partially from an area of 24 mm × 20 mm, 76 eyes were selected for both the 12 mm × 12 mm and 24 mm × 20 mm high-speed ultra-widefield SS-OCTA scans.
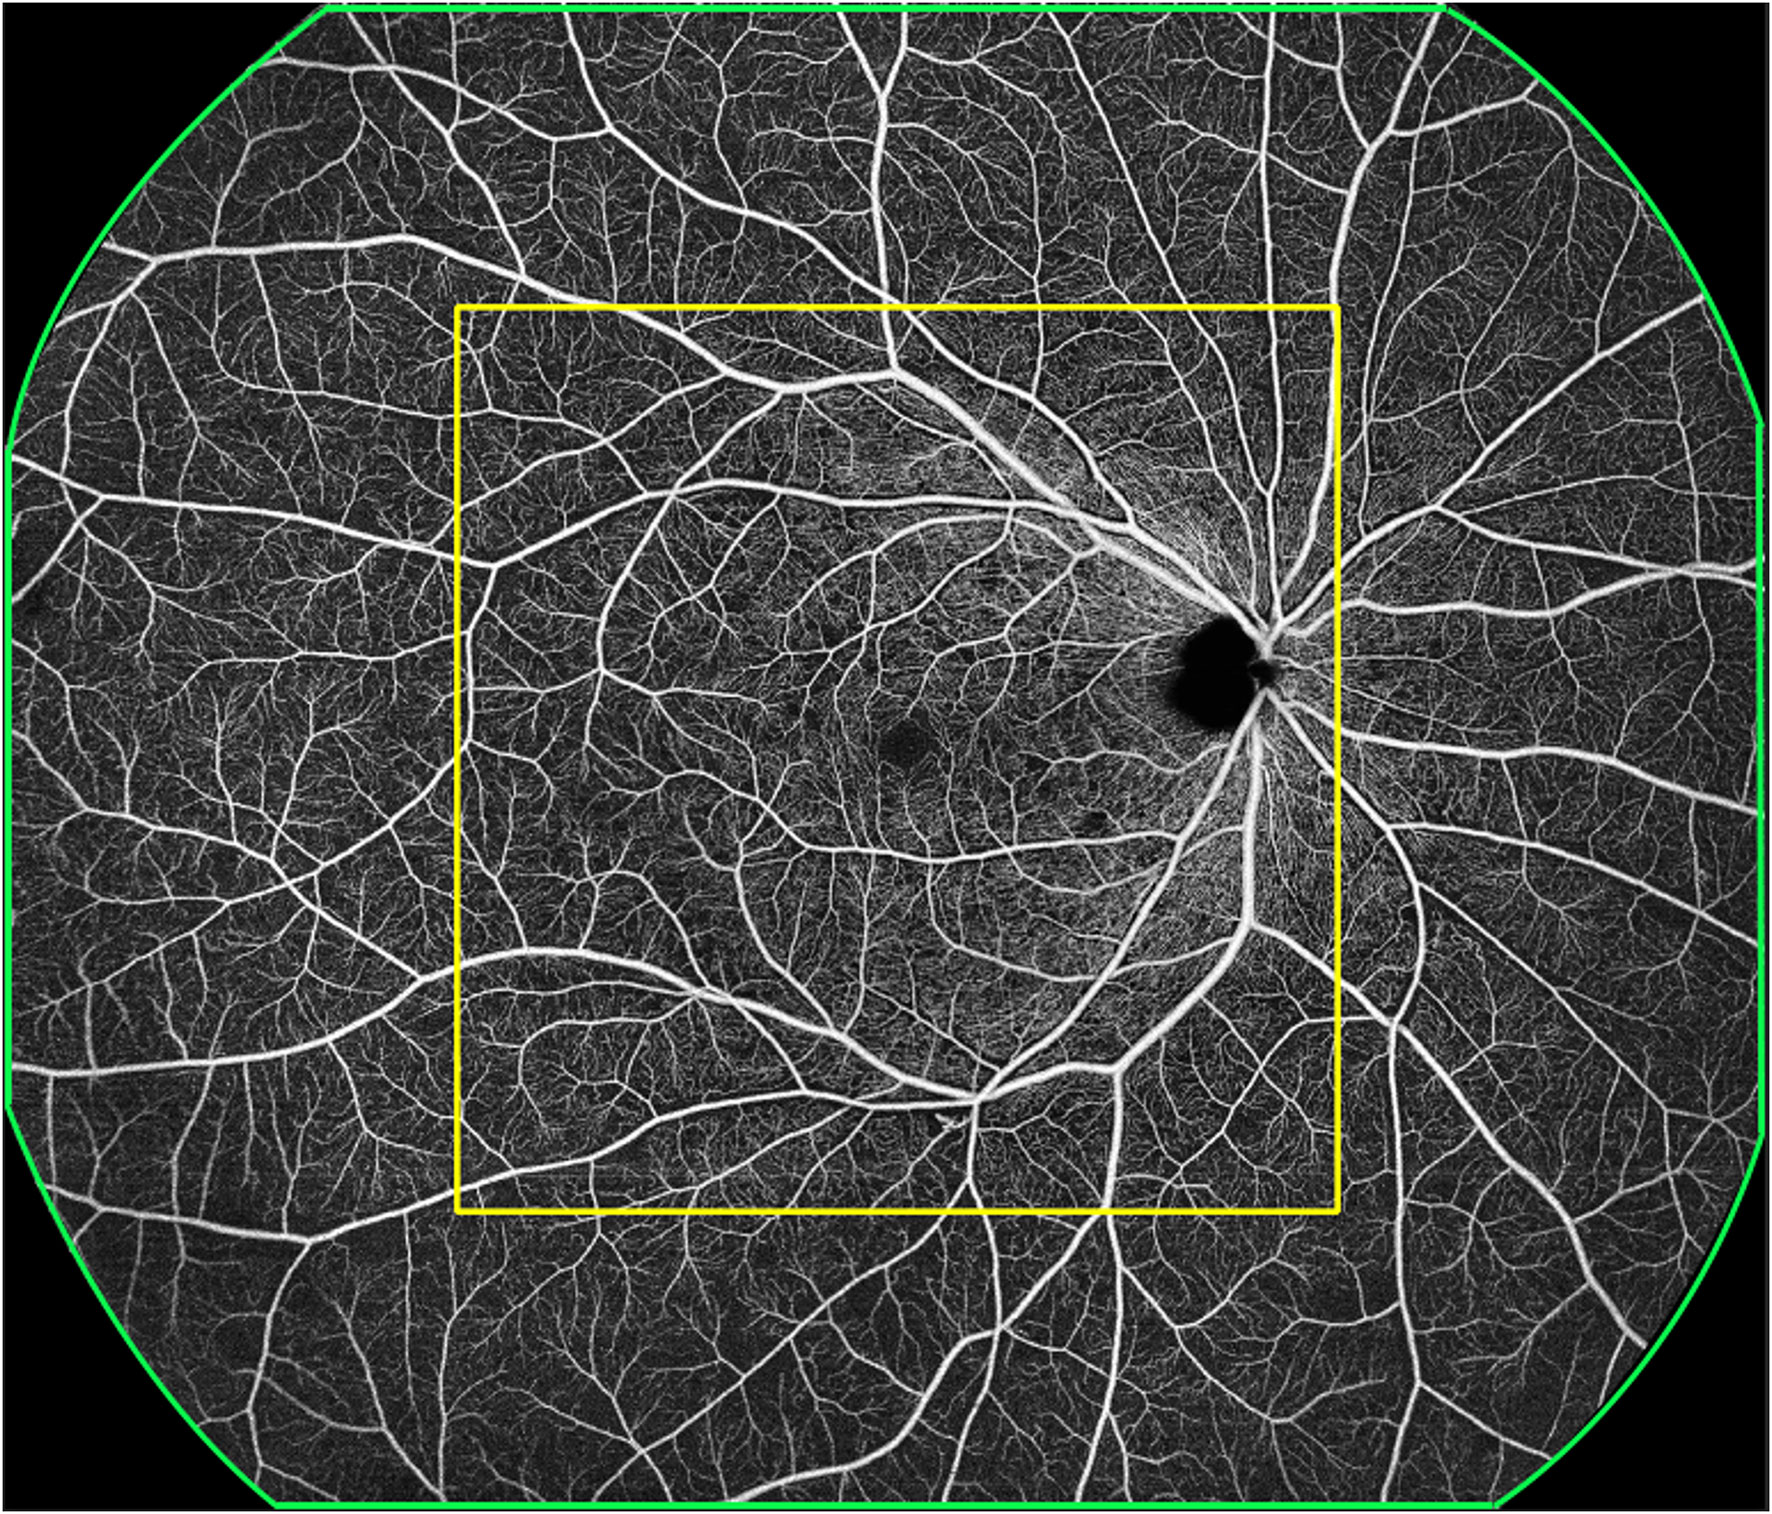
Figure 1 A representative OCTA image. The green outline represents the 24 mm × 20 mm scanning area, with the imaging centered on the fovea. The yellow outline represents the 12 mm × 12 mm scanning area, with the imaging centered on the fovea; this was termed the 12 mm × 12 mm central. The area outside the yellow outline and within the green outline was termed 12 mm~24mm-annulus.
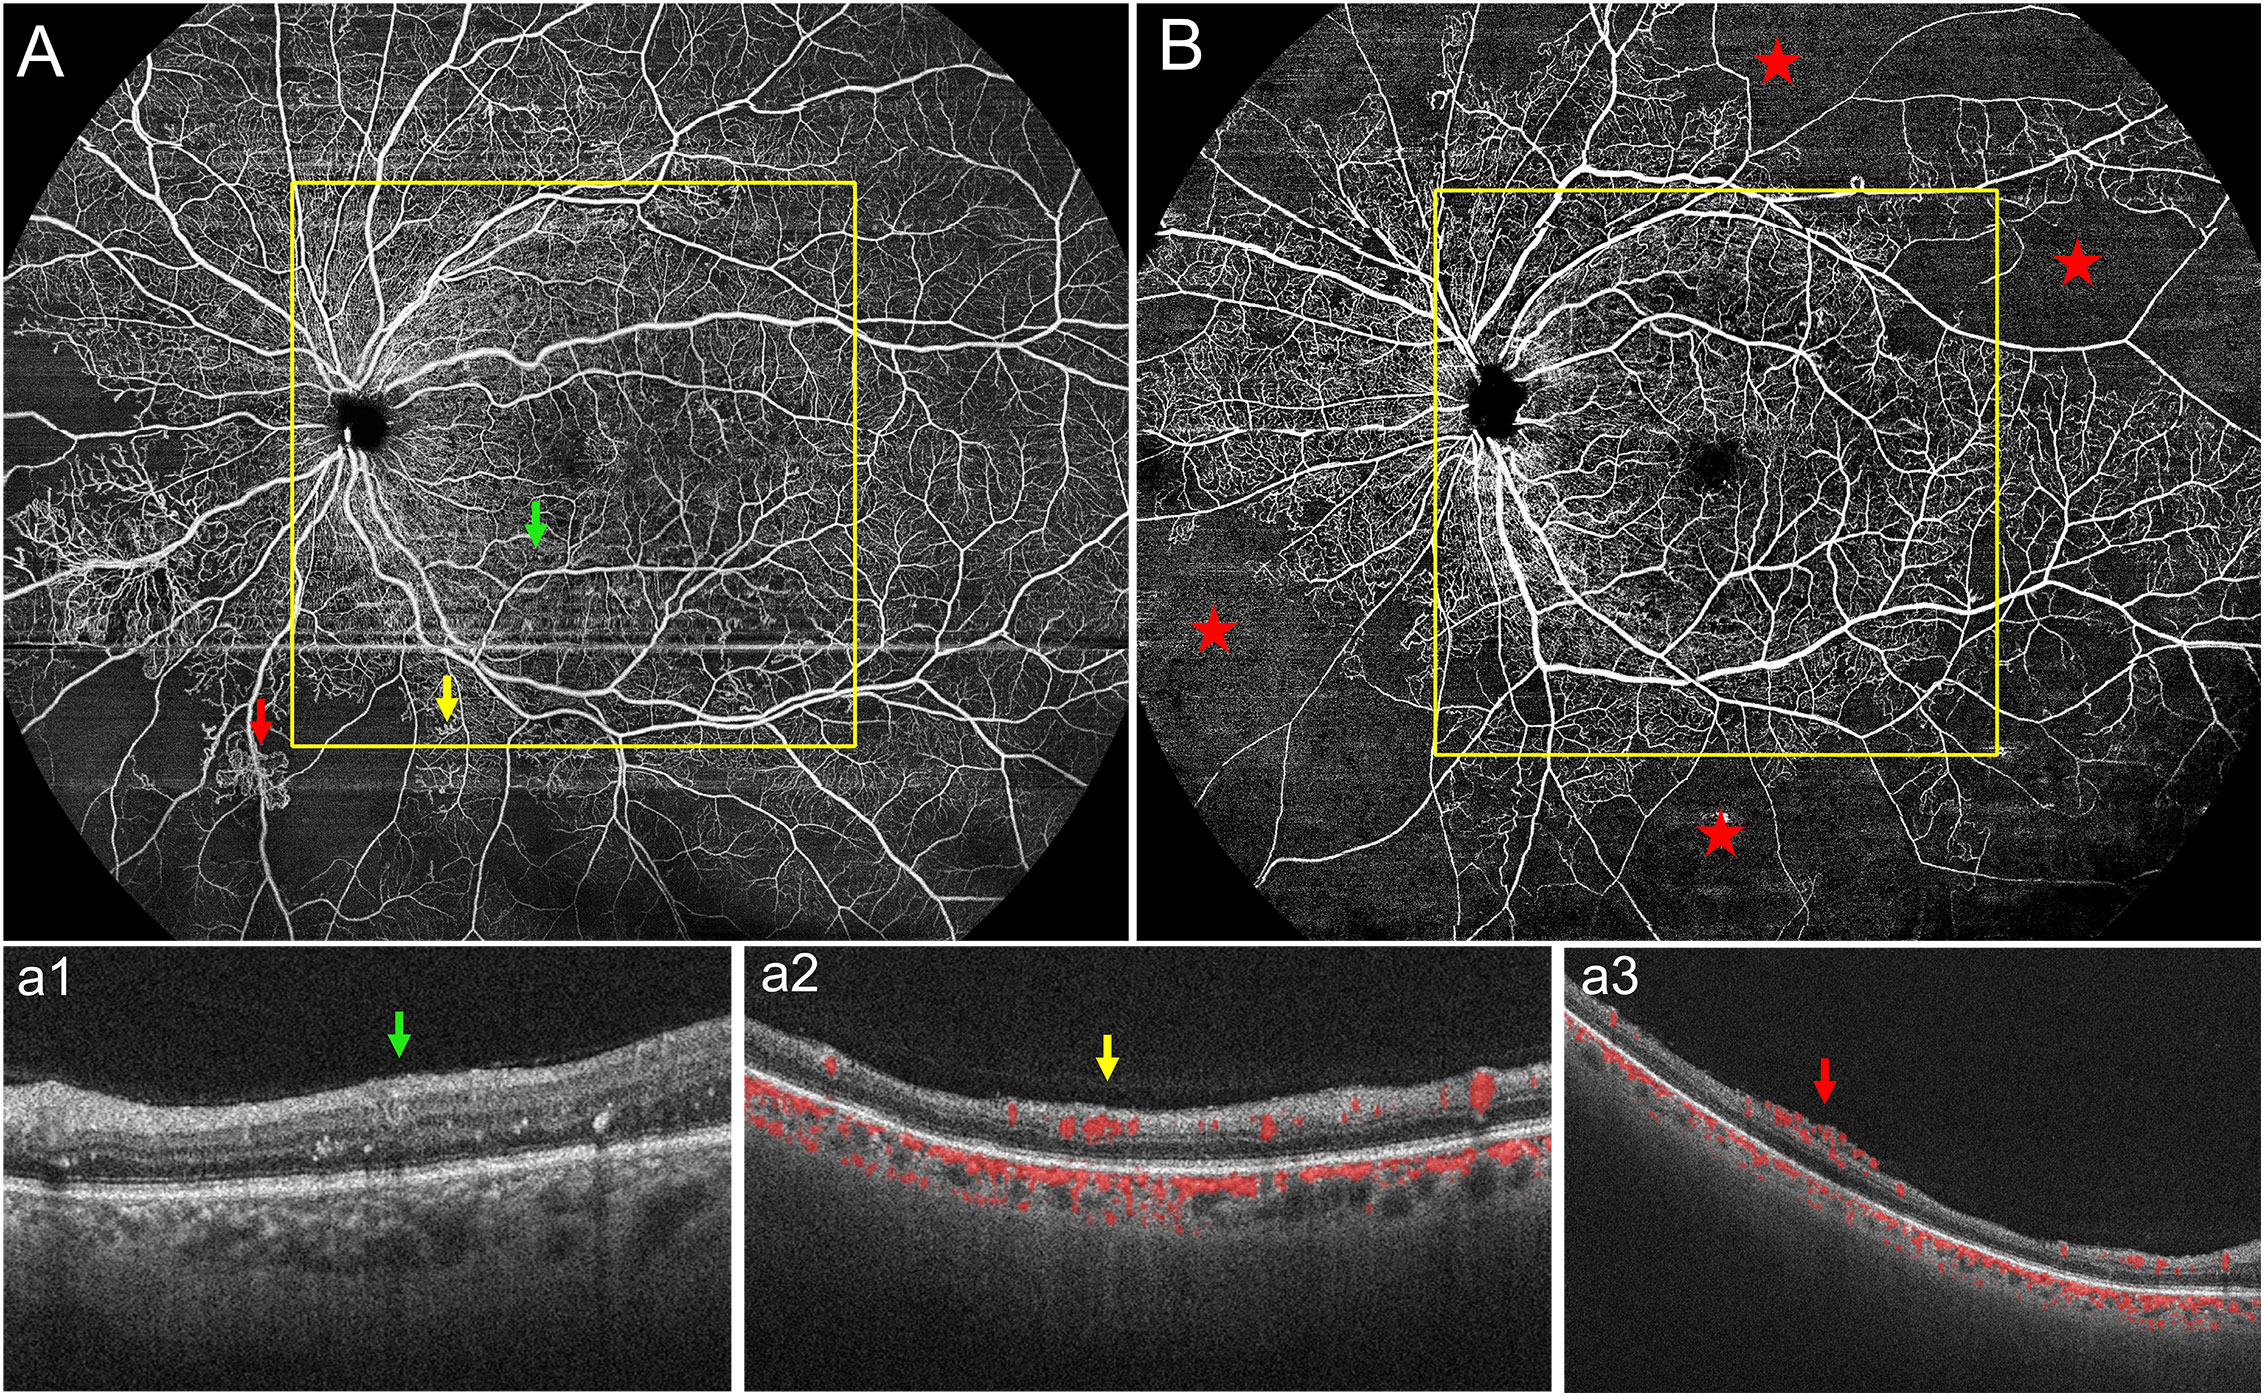
Figure 2 (A) Representative 24 mm × 20 mm OCTA image of one eye with PDR. Representative DR lesions are marked with green arrows for microaneurysms (MAs) with corresponding B-scans (a1); yellow arrows for intraretinal microvascular abnormalities (IRMAs) with corresponding B-scans (a2); and red arrows for neovascularization (NV) with corresponding B-scans (a3). (B) In another representative 24 mm × 20 mm OCTA image, the red stars represent non-perfusion areas (NPAs); most of the NPAs were seen in the 12 mm~24mm-annulus. PDR, proliferative diabetic retinopathy.
In this study, severity of DR was graded using the Optos ultra-widefield retinal image (Optos PLC; Scotland, United Kingdom) of all participants (18, 19), according to the International Clinical Diabetic Retinopathy Severity Scale (20). Based on the lesion characteristics, we classified DR into DM without DR, mild to moderate non-proliferative diabetic retinopathy (NPDR), severe NPDR, and proliferative diabetic retinopathy (PDR).
2.5 Data analysis
Statistical analysis was performed using SPSS version 26.0 (IBM, Armonk, New York). The data were expressed as mean ± standard deviation. The non-normally distributed data were analyzed using nonparametric tests. The chi-squared test was used to compare the rates of detection of the DR features in different modes. Two-tailed p-values of < 0.05 denoted statistical significance.
3 Results
3.1 Demographics
In total, 172 eyes (41 eyes with DM without DR, 40 eyes with mild to moderate NPDR, 51 eyes with severe NPDR, and 40 eyes with PDR) from 101 participants were included in the study. The average age of the participants was 56.50 ± 10.58 years, and the average duration since the diagnosis of diabetes was 9.66 ± 6.97 years. A total of 63 participants had DME (Table 1).
3.2 Detection rates of DR lesions in different areas of a 24 mm × 20 mm high-speed ultra-widefield SS-OCTA image
The detection rates (the number of eyes found divided by the total number of eyes examined) of MAs, IRMAs, and NV were 66.9%, 44.2%, and 19.2% for the 12 mm × 12 mm-central images and 74.4%, 51.2%, and 23.3% for the 24 mm × 20-mm images, respectively (p > 0.05). The detection rate of NPAs was 64.5% for the 24 mm × 20 mm image, which was higher than that for the 12 mm × 12 mm-central image (52.3%) (p < 0.05). The two scan protocols had identical detection rates for HE and DME (p = 1.00, Table 2).
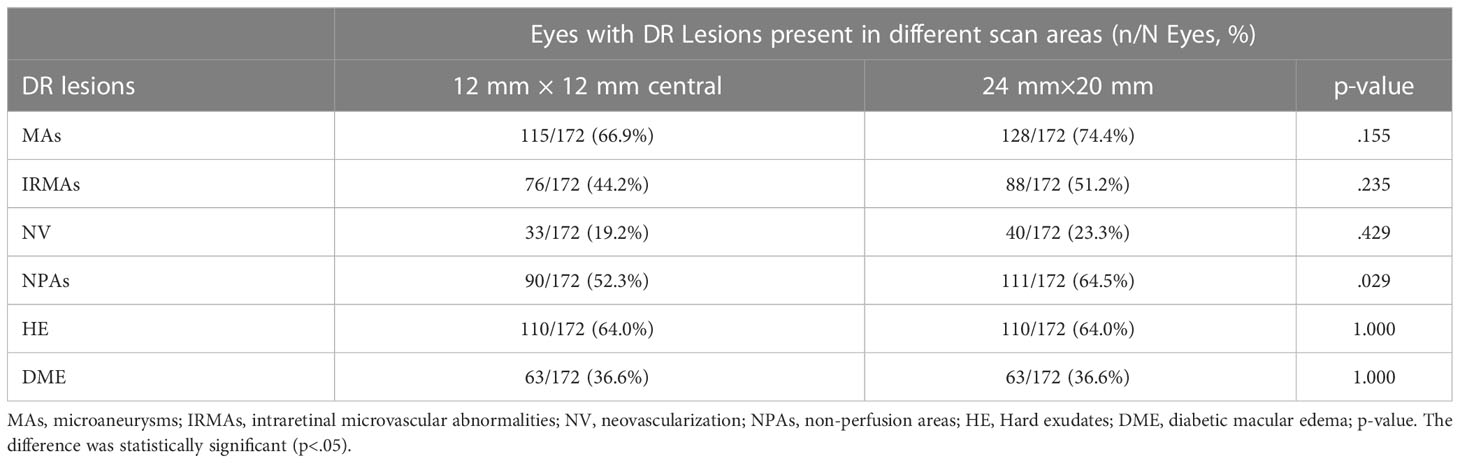
Table 2 DR lesion detection rates of 12 mm × 12 mm central and 24 mm × 20 mm OCTA images.
3.3 Distribution of nonperfusion areas and ischemic index in different retinal zones
NPAs were present in 111 eyes. The average dimension of the NPAs was 8.09 ± 13.58 mm2 in the 12 mm × 12 mm-central image, with an average ISI of 5.62 ± 9.43%. The average dimension of the NPAs was 45.86 ± 58.69 mm2 in a 12 mm~24mm-annulus image, with an average ISI of 15.26 ± 19.52% (p < 0.05, Table 3).

Table 3 ISIs for 12 mm × 12 mm central and 12 mm~24mm-annulus imaging.
4 Discussion
In our study, we compared the detection rates and distributions of DR lesions in SS-OCTA images with fields of 24 mm × 20 mm (FOV 120°) and 12 mm × 12 mm (FOV 50°). With the increase in FOV, more IRMAs and NV were detected by the ultra-widefield SS-OCTA. The retinal ischemia was more severe in the mid-peripheral retina than in the posterior area. In addition, there was no loss of details of the posterior DR lesions in the 24 mm × 20 mm scanning mode relative to the 12 mm × 12 mm scanning mode.
Within the last decade, SS-OCTA has been gradually used to detect and research vascular changes in DR. Most previous studies used SS-OCTA with a scanning area of 12 mm × 12 mm (FOV 50°) (21–24). Higher FOV (90°) can be achieved using the montage technique. The montage technique allows a higher FOV. However, it has certain limitations, such as misalignment, motion artifacts, and longer processing times (25). Another simple technique for increasing the scan length for OCTA is an extended field imaging technique. However, it leads to a decrease in image resolution and missing retinal vascular information (26). In this study, we used the newly developed and commercialized high-speed ultra-widefield SS-OCTA systems. Its 24 mm × 20 mm scanning mode (444.6 mm2) provides a 208.7% larger scanning area than the 12 mm × 12 mm scanning mode (144 mm2) and facilitated a wider retinal field (approximately 120° FOV). According to the recommendation of the International Widefield Imaging Study Group, the FOV of the OCTA system in our study can be categorized as ultra-widefield (approximately 110–220°, anterior edge of vortex vein ampulla, and beyond to pars plana) (27).
We evaluated the presence or absence of DR lesions including MAs, IRMAs, NV, NPAs, HE, and DME. The larger scanning area did not increase the detection rate of MAs, IRMAs, and NV (p > 0.05, Table 2). However, the detection rate of the NPAs, an indicator of retinal ischemia, increased with the expansion of the scanning area (p < 0.05, Table 2). We quantified the NPAs and evaluated the ISI for different areas. The average ISI for the 12 mm × 24 mm-annulus image was 15.26 ± 19.52%, which was significantly higher than that for the 12 mm × 12 mm-central image (5.62% ± 9.43%) (Table 3). These results suggested that ischemia was more severe in the peripheral region than in the posterior pole within the 24 mm × 20 mm area (Figure 2B). Fan et al. (17) proposed that ISI increases with an increase in the distance from the foveal center. Wang et al. (7) used an OCTA montage image composed of five 12 mm × 12 mm OCTA images for analysis and reported that the capillary non-perfusion of the 50–100° FOV sector in DR was more prominent in the peripheral regions of the retina compared to that of the central FOV sectors. These findings were similar to our results. However, the authors were aware of the several limitations of their study: the 12 mm × 12 mm scans only provide a lateral resolution of 24 μm; the automated montage feature failed at times due to the disparate overlap of the 12 mm × 12 mm scans requiring time-consuming manual correction; and the image distortion may have affected the measurements of peripheral capillary nonperfusion (7). In our study, a single scanning could provide a 24 mm × 20 mm image (FOV 120°) with a transverse resolution of 10 μm and an axial optical resolution of 3.8 μm, which enabled us to observe the capillary non-perfusion areas more accurately. The display of the ischemic area was more comprehensive and intuitive with a wider SS-OCTA image. Theoretically, these non-invasive wider SS-OCTA images could be quickly and repeatedly acquired from the patients for follow-up of the change in capillary drop-out in clinical practice.
Besides NPAs, IRMAs and NV were vital considerations for DR management. It is important to distinguish between IRMAs and retinal NV to determine disease severity and prognosis and make treatment decisions. SS-OCTA can show frontal and cross-sectional analyses, while B-scans help to differentiate IRMA from NV (28, 29). Similar to the methods used by Lee et al. (30) and Cho et al. (31), we differentiated IRMA from NV by analyzing B-scans (Figures 2: a2, a3). In this study, there were no statistically significant differences between the detection rates of IRMAs and NV in the 12 mm × 12 mm-central and 24 mm × 20 mm SS-OCTA images. These results were similar to the findings of previous studies. However, we observed more IRMAs and NV within the 24 mm × 20 mm area than within the 12 mm × 12 mm-central area. (Figure 3). Of the total of 40 eyes with PDR and 51 eyes with severe NPDR, 6 eyes had NV and 10 eyes had IRMAs that were only observed within the 12 mm~24mm-annulus area. Compared with the 12 mm × 12 mm-central area, more severe lesions were observed in 16 eyes within the 24 mm × 20 mm area due to an increase in the FOV. With the detection of more regions of NV, 6 eyes that were originally diagnosed with severe NPDR based on 12 mm × 12 mm-central images were diagnosed with PDR. Therefore, a wider scanning field for SS-OCTA can facilitate more accurate determination of DR progression and timely interventions and guide clinical diagnosis and treatment. However, prospective studies with larger sample sizes are needed to test this hypothesis.
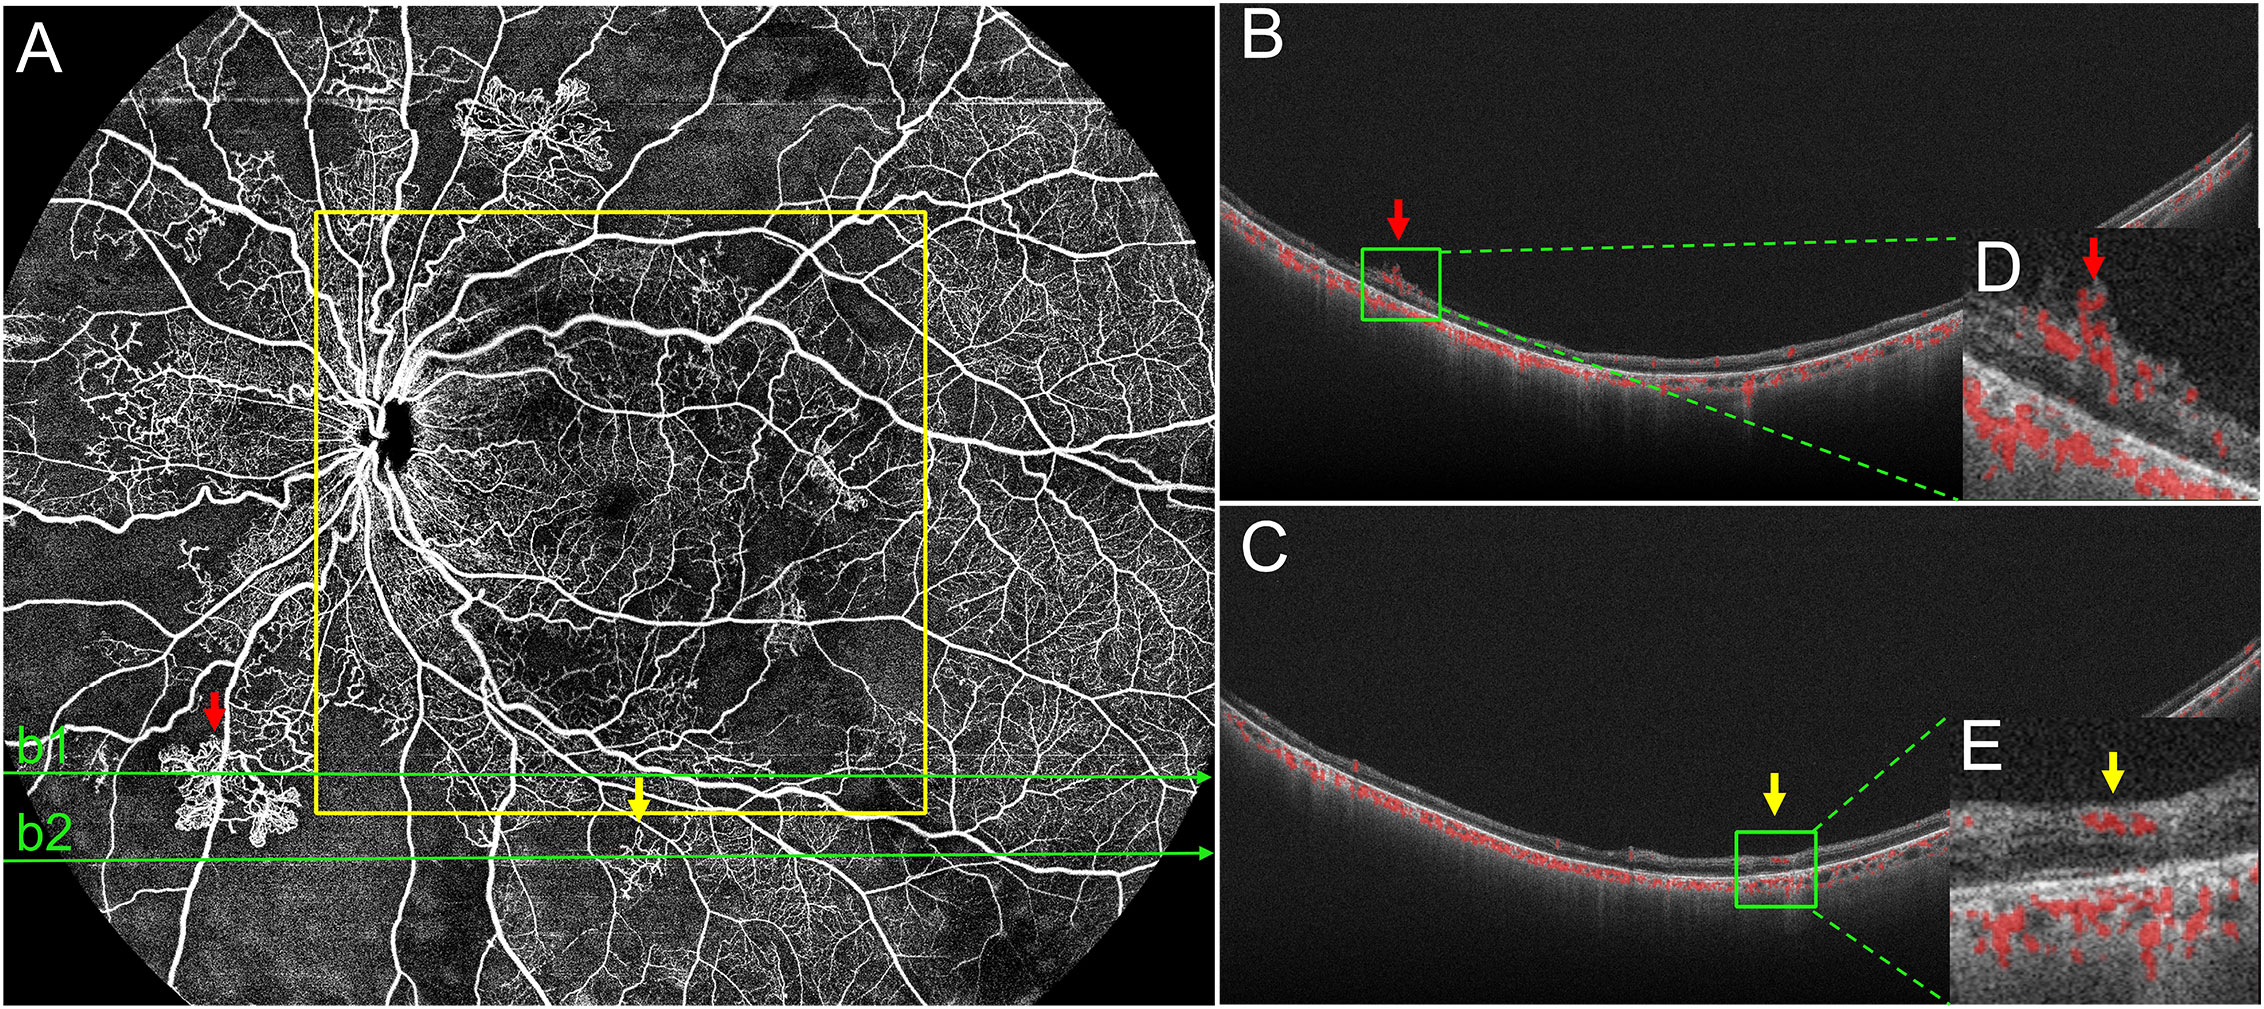
Figure 3 Representative OCTA image of PDR. (A) In the 24 mm ×20 mm image, the red arrows mark the neovascularization (NV), and a corresponding BScan image (b1) is provided (B, D). Yellow arrows mark intraretinal microvascular abnormalities (IRMAs) and a corresponding B-Scanimage (b2) is provided (C, E). Structurally, IRMAs were defined as new vessels formed within the retinal layers whereas, retinal NV breached the internal limiting membrane. In this eye, both NV and IRMAs were outside the 12 mm ×12 mm area (yellow outline), but they were accurately detected using the 24 mm ×20 mm scanning mode. PDR, proliferative diabetic retinopathy.
Additionally, since this is a newly developed SS-OCTA device, we also investigated differences in the lesion detection rate using the 24 mm× 20 mm and 12 mm × 12 mm scan modes. Seventy-six eyes from 38 patients were scanned using the two modes. We compared the 12 mm × 12 mm SS-OCTA images extracted from the 24 mm × 20 mm scanning mode with the image obtained by the 12 mm × 12 mm scanning mode. There were no statistical differences between the detection rates for all the lesions (Table 4), and we found that the 24 mm × 20 mm scanning mode did not lose the information within the 12 mm × 12 mm area during DR lesion detection (Figure 4); instead, it provided more information in the mid-peripheral retina. However, the 12 mm × 12 mm scan mode has an advantage of a relatively short scan time.
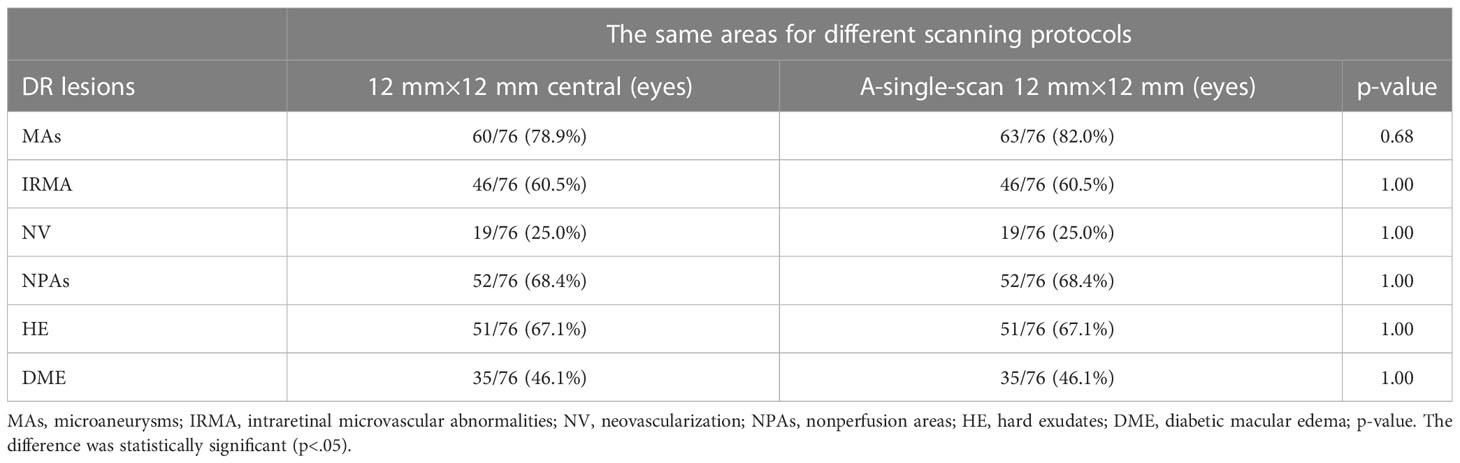
Table 4 Comparison of 12 mm×12 mm central and A-single-scan 12 mm×12 mm OCTA images.
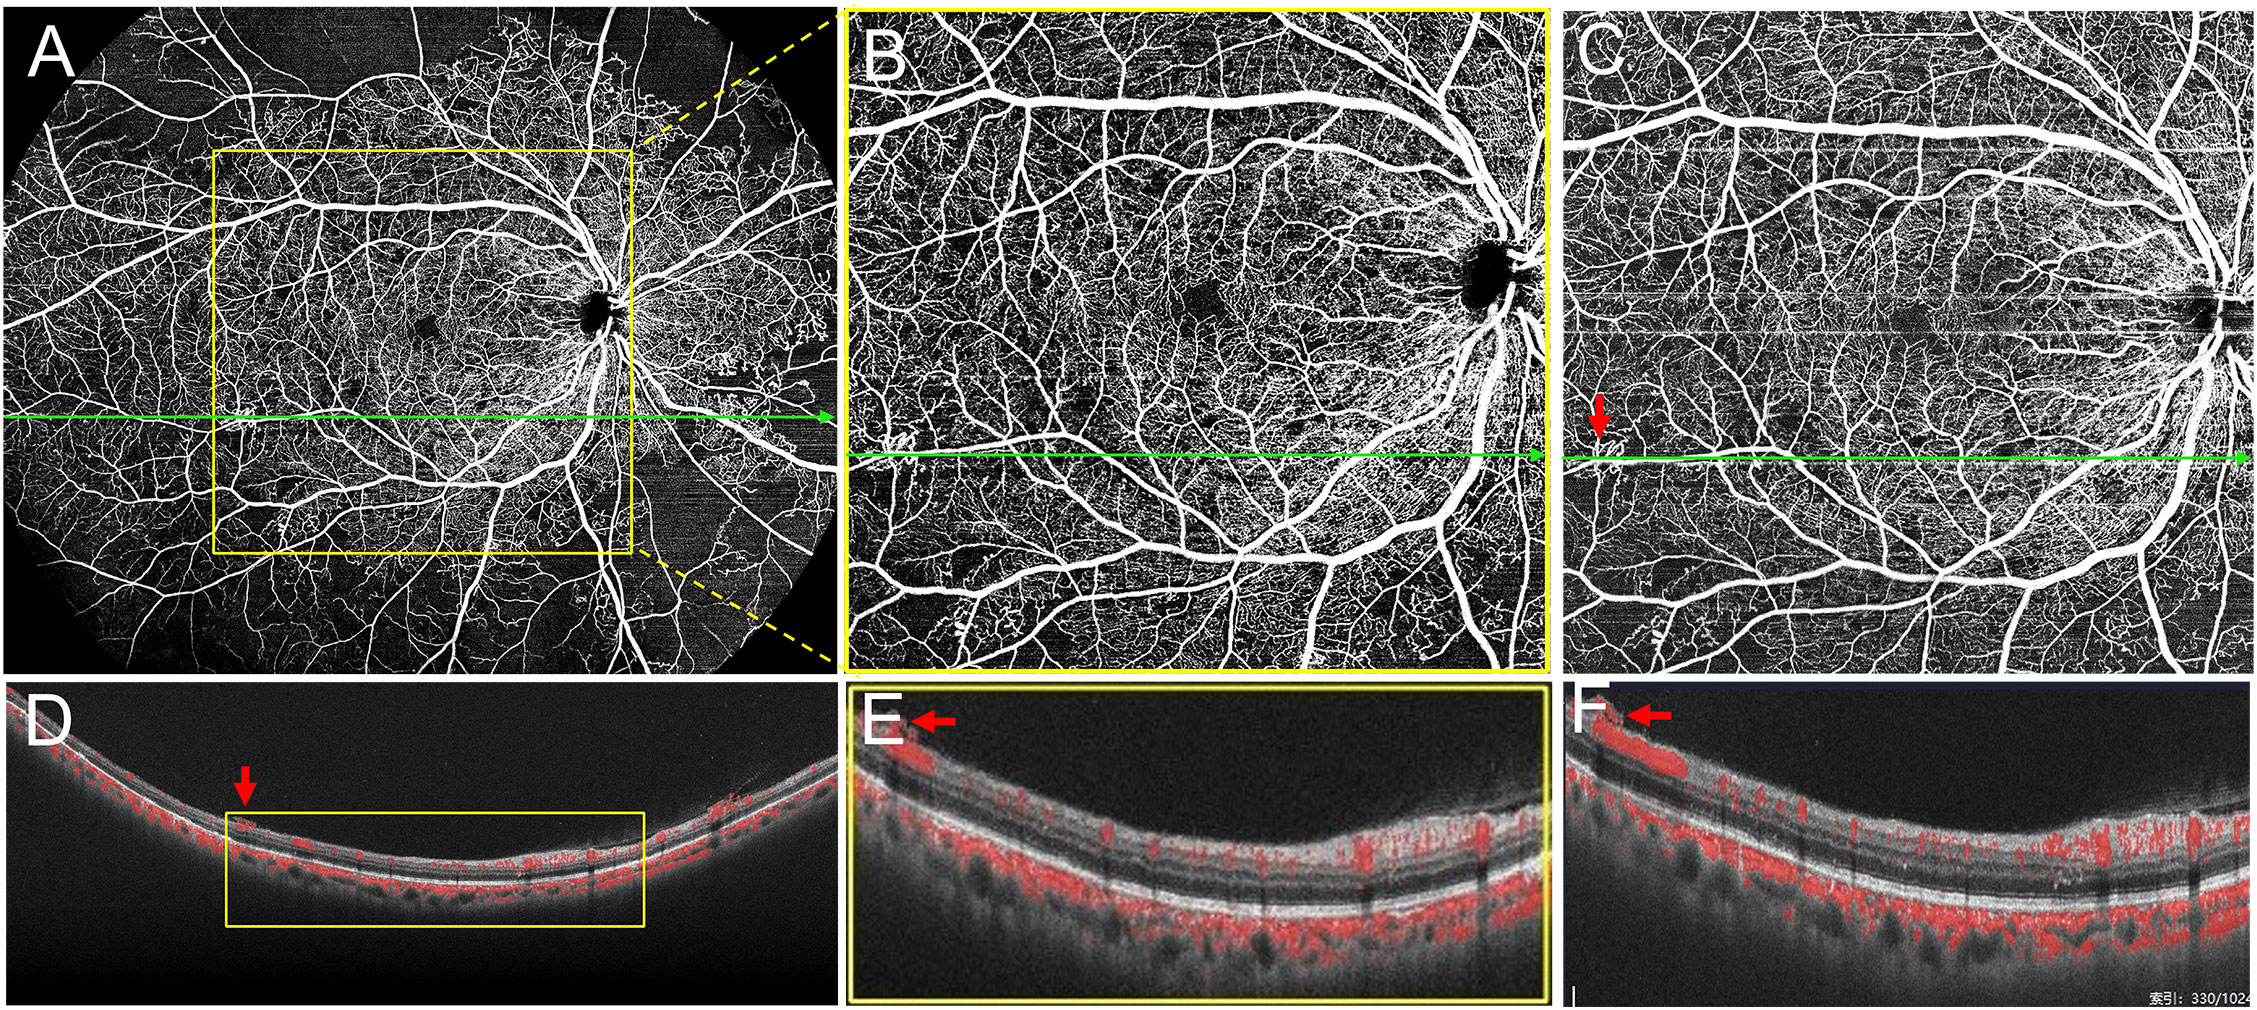
Figure 4 Scans of the same eye using two different protocols. (A) The 24 mm ×20 mm scanning mode. (B) The 12 mm ×12 mm image was extracted from the yellow outline area in (A). (C) Image obtained using the 12 mm × 12 mm scanning mode. (D–F) B-Scan images acquired with corresponding scan lines in (A), (B), and (C), respectively. As shown in (D–F), both 24 mm ×20 mm and 12 mm ×12 mm scanning modes show the neovascularization breaking through the internal limiting membrane (red arrows).
OCTA can non-invasively reveal the structures of multiple layers of the vascular plexus, including the superficial capillary plexus (SCP), intermediate capillary plexus, deep capillary plexus (DCP), and peripapillary radial plexus (PRP) (32, 33). Some previous studies reported that the DCP was more susceptible to ischemia and significantly related to the progression of DR than the SCP (34, 35). However, we did not analyze the distribution of the NPAs in each capillary plexus in this study, since the automatic stratification of the DCP and SCP in the peripheral retina is not as accurate as that in the macular area. Meanwhile, the manual correction of the entire B-scan images is very time-consuming. This limitation needs to be addressed in further studies.
Our study had several other limitations. This was a single-center study involving a relatively small sample. Similar to the previously reported SS-OCTA, TowardPi high-speed ultra-widefield SS-OCTA was influenced by the turbidity of the refractive medium and artifacts. For the 24 mm × 20 mm scanning mode, some optical occlusion or artifacts may be produced in patients with longer and thicker eyelashes, small eyelid fissures, and poor tear film function, which can affect the observation of DR lesions. In addition, patients with macular disease and DME have poor fixation, which may lead to more projection and motion artifacts and affect image quality. These issues need to be considered in future studies.
Despite our limitations, our data suggest the high-speed ultra-widefield SS-OCTA used in this study can obtain a 24 mm × 20 mm OCTA fundus image in a single scan. The high-speed ultra-widefield SS-OCTA can more accurately reveal the degree of retinal ischemia and also detect more NV and IRMAs lesions using the 24 mm × 20 mm compared with the 12 mm × 12 mm scanning area.
Data availability statement
The raw data supporting the conclusions of this article will be made available by the authors, without undue reservation.
Ethics statement
The studies involving human participants were reviewed and approved by Ethics Committee of Sichuan Provincial People’s Hospital. The patients/participants provided their written informed consent to participate in this study.
Author contributions
JZ, JL, MYL, and MM had full access to the data in the study and take responsibility for the integrity of the data and the accuracy of the data analysis. JZ and JL conceived and designed the research. MYL, MM, DW, ML, XL, HL, YW, SC, RZ, YZ, and MW acquired and analyzed the data. MM and MYL reviewed and graded the images. JL, JZ, MYL, and MM wrote the draft of the manuscript. JZ and JL critically reviewed and extensively revised the manuscript. MM and MYL performed the statistical analyses. JZ, JL, YZ, and RZ acquired funding. JZ and JL supervised the study. All authors contributed to the article and approved the submitted version.
Funding
This study was supported in part by the Sichuan Province Science and Technology Support Program (grant number 2021ZYD0108); Health and Family Planning Commission of Sichuan Province (grant number 19ZD012); Science and Technology Project of The Health Planning Committee of Sichuan (grant number 21PJ077); Clinical and Translational Research Fund of Sichuan Provincial People’s Hospital (General Project) (grant number 2020LY04); Sichuan Provincial People’s Hospital (grant number 2021QN13); The Science & Technology Department of Sichuan Province (grant numbers 2017YSKY0001 and 2021YJ0234); and Natural Science Foundation of Sichuan Province (grant number 2023NSFSC0592).
Acknowledgments
The authors thank Chen Bin, Xue Zhou, and Weilin Wang for technical assistance.
Conflict of interest
The authors declare that the research was conducted in the absence of any commercial or financial relationships that could be construed as a potential conflict of interest.
Publisher’s note
All claims expressed in this article are solely those of the authors and do not necessarily represent those of their affiliated organizations, or those of the publisher, the editors and the reviewers. Any product that may be evaluated in this article, or claim that may be made by its manufacturer, is not guaranteed or endorsed by the publisher.
Supplementary material
The Supplementary Material for this article can be found online at: https://www.frontiersin.org/articles/10.3389/fendo.2023.1111360/full#supplementary-material
References
1. Barth T, Helbig H. [Diabetic retinopathy]. Klinische Monatsblatter fur Augenheilkunde (2021) 238:1143–59. doi: 10.1055/a-1545-9927
2. Yau JW, Rogers SL, Kawasaki R, Lamoureux EL, Kowalski JW, Bek T, et al. Global prevalence and major risk factors of diabetic retinopathy. Diabetes Care (2012) 35:556–64. doi: 10.2337/dc11-1909
3. Safi H, Safi S, Hafezi-Moghadam A, Ahmadieh H. Early detection of diabetic retinopathy. Surv Ophthalmol (2018) 63(5):601–8. doi: 10.1016/j.survophthal.2018.04.003
4. Ra H, Park JH, Baek JU, Baek J. Relationships among retinal nonperfusion, neovascularization, and vascular endothelial growth factor levels in quiescent proliferative diabetic retinopathy. J Clin Med (2020) 9(5):1–11. doi: 10.3390/jcm9051462
5. Enders C, Baeuerle F, Lang GE, Dreyhaupt J, Lang GK, Loidl M, et al. Comparison between findings in optical coherence tomography angiography and in fluorescein angiography in patients with diabetic retinopathy. Ophthalmologica (2020) 243:21–6. doi: 10.1159/000499114
6. Cui Y, Zhu Y, Wang JC, Lu Y, Zeng R, Katz R, et al. Comparison of widefield swept-source optical coherence tomography angiography with ultra-widefield colour fundus photography and fluorescein angiography for detection of lesions in diabetic retinopathy. Br J Ophthalmol (2021) 105(4):577–81. doi: 10.1136/bjophthalmol-2020-316245
7. Wang F, Saraf SS, Zhang Q, Wang RK, Rezaei KA. Ultra-widefield protocol enhances automated classification of diabetic retinopathy severity with oct angiography. Ophthalmol Retina (2020) 4:415–24. doi: 10.1016/j.oret.2019.10.018
8. Mishra DK, Shanmugam MP, Ramanjulu R, Sagar P. Comparison of standard and "Innovative wide-field" optical coherence tomography images in assessment of vitreoretinal interface in proliferative diabetic retinopathy: A pilot study. Indian J Ophthalmol (2021) 69:99–102. doi: 10.4103/ijo.IJO_289_20
9. Sawada O, Ichiyama Y, Obata S, Ito Y, Kakinoki M, Sawada T, et al. Comparison between wide-angle oct angiography and ultra-wide field fluorescein angiography for detecting non-perfusion areas and retinal neovascularization in eyes with diabetic retinopathy. Graefe's Arch Clin Exp Ophthalmol = Albrecht von Graefes Archiv fur klinische und experimentelle Ophthalmol (2018) 256:1275–80. doi: 10.1007/s00417-018-3992-y
10. Zhu Y, Cui Y, Wang JC, Lu Y, Zeng R, Katz R, et al. Different scan protocols affect the detection rates of diabetic retinopathy lesions by wide-field swept-source optical coherence tomography angiography. Am J Ophthalmol (2020) 215:72–80. doi: 10.1016/j.ajo.2020.03.004
11. Tang FY, Chan EO, Sun Z, Wong R, Lok J, Szeto S, et al. Clinically relevant factors associated with quantitative optical coherence tomography angiography metrics in deep capillary plexus in patients with diabetes. Eye Vis (Lond) (2020) 7:7. doi: 10.1186/s40662-019-0173-y
12. Li J, Wei D, Mao M, Li M, Liu S, Li F, et al. Ultra-widefield color fundus photography combined with high-speed ultra-widefield swept-source optical coherence tomography angiography for non-invasive detection of lesions in diabetic retinopathy. Front Public Health (2022) 10:1047608. doi: 10.3389/fpubh.2022.1047608
13. Khalid H, Schwartz R, Nicholson L, Huemer J, El-Bradey MH, Sim DA, et al. Widefield optical coherence tomography angiography for early detection and objective evaluation of proliferative diabetic retinopathy. Br J Ophthalmol (2021) 105:118–23. doi: 10.1136/bjophthalmol-2019-315365
14. Schreur V, Domanian A, Liefers B, Venhuizen FG, Klevering BJ, Hoyng CB, et al. Morphological and topographical appearance of microaneurysms on optical coherence tomography angiography. Br J Ophthalmol (2018) 2018:1–6. doi: 10.1136/bjophthalmol-2018-312258
15. Couturier A, Rey PA, Erginay A, Lavia C, Bonnin S, Dupas B, et al. Widefield oct-angiography and fluorescein angiography assessments of nonperfusion in diabetic retinopathy and edema treated with anti-vascular endothelial growth factor. Ophthalmology (2019) 126:1685–94. doi: 10.1016/j.ophtha.2019.06.022
16. Wang K, Ghasemi Falavarjani K, Nittala MG, Sagong M, Wykoff CC, van Hemert J, et al. Ultra-Wide-Field fluorescein angiography-guided normalization of ischemic index calculation in eyes with retinal vein occlusion. Invest Ophthalmol Vis Sci (2018) 59(8):3278–85. doi: 10.1167/iovs.18-23796
17. Fan W, Nittala MG, Velaga SB, Hirano T, Wykoff CC, Ip M, et al. Distribution of nonperfusion and neovascularization on ultrawide-field fluorescein angiography in proliferative diabetic retinopathy (recovery study): Report 1. Am J Ophthalmol (2019) 206:154–60. doi: 10.1016/j.ajo.2019.04.023
18. Silva PS, Cavallerano JD, Sun JK, Noble J, Aiello LM, Aiello LP. Nonmydriatic ultrawide field retinal imaging compared with dilated standard 7-field 35-mm photography and retinal specialist examination for evaluation of diabetic retinopathy. Am J Ophthalmol (2012) 154(3):549–59.e2. doi: 10.1016/j.ajo.2012.03.019
19. Price LD, Au S, Chong NV. Optomap ultrawide field imaging identifies additional retinal abnormalities in patients with diabetic retinopathy. Clin Ophthalmol (2015) 9:527–31. doi: 10.2147/opth.S79448
20. Wilkinson CP, Ferris FL 3rd, Klein RE, Lee PP, Agardh CD, Davis M, et al. Proposed international clinical diabetic retinopathy and diabetic macular edema disease severity scales. Ophthalmology (2003) 110:1677–82. doi: 10.1016/s0161-6420(03)00475-5
21. Zhang Q, Rezaei KA, Saraf SS, Chu Z, Wang F, Wang RK. Ultra-wide optical coherence tomography angiography in diabetic retinopathy. Quant Imaging Med Surg (2018) 8:743–53. doi: 10.21037/qims.2018.09.02
22. Schaal KB, Munk MR, Wyssmueller I, Berger LE, Zinkernagel MS, Wolf S. Vascular abnormalities in diabetic retinopathy assessed with swept-source optical coherence tomography angiography widefield imaging. Retina (2019) 39:79–87. doi: 10.1097/iae.0000000000001938
23. Motulsky EH, Liu G, Shi Y, Zheng F, Flynn HW Jr., Gregori G, et al. Widefield swept-source optical coherence tomography angiography of proliferative diabetic retinopathy. Ophthalmic Surg Lasers Imaging Retina (2019) 50:474–84. doi: 10.3928/23258160-20190806-01
24. Russell JF, Al-Khersan H, Shi Y, Scott NL, Hinkle JW, Fan KC, et al. Retinal nonperfusion in proliferative diabetic retinopathy before and after panretinal photocoagulation assessed by widefield oct angiography. Am J Ophthalmol (2020) 213:177–85. doi: 10.1016/j.ajo.2020.01.024
25. Pichi F, Smith SD, Abboud EB, Neri P, Woodstock E, Hay S, et al. Wide-field optical coherence tomography angiography for the detection of proliferative diabetic retinopathy. Graefes Arch Clin Exp Ophthalmol (2020) 258:1901–9. doi: 10.1007/s00417-020-04773-x
26. Kimura M, Nozaki M, Yoshida M, Ogura Y. Wide-field optical coherence tomography angiography using extended field imaging technique to evaluate the nonperfusion area in retinal vein occlusion. Clin Ophthalmol (2016) 10:1291–5. doi: 10.2147/opth.S108630
27. Choudhry N, Duker JS, Freund KB, Kiss S, Querques G, Rosen R, et al. Classification and guidelines for widefield imaging: recommendations from the international widefield imaging study group. Ophthalmol Retina (2019) 3:843–9. doi: 10.1016/j.oret.2019.05.007
28. de Carlo TE, Bonini Filho MA, Baumal CR, Reichel E, Rogers A, Witkin AJ, et al. Evaluation of preretinal neovascularization in proliferative diabetic retinopathy using optical coherence tomography angiography. Ophthalmic Surg Lasers Imaging Retina (2016) 47:115–9. doi: 10.3928/23258160-20160126-03
29. Arya M, Sorour O, Chaudhri J, Alibhai Y, Waheed NK, Duker JS, et al. Distinguishing intraretinal microvascular abnormalities from retinal neovascularization using optical coherence tomography angiography. Retina (2020) 40:1686–95. doi: 10.1097/iae.0000000000002671
30. Lee CS, Lee AY, Sim DA, Keane PA, Mehta H, Zarranz-Ventura J, et al. Reevaluating the definition of intraretinal microvascular abnormalities and neovascularization elsewhere in diabetic retinopathy using optical coherence tomography and fluorescein angiography. Am J Ophthalmol (2015) 159(1):101–10 e1. doi: 10.1016/j.ajo.2014.09.041
31. Cho H, Alwassia AA, Regiatieri CV, Zhang JY, Baumal C, Waheed N, et al. Retinal neovascularization secondary to proliferative diabetic retinopathy characterized by spectral domain optical coherence tomography. Retina (2013) 33:542–7. doi: 10.1097/IAE.0b013e3182753b6f
32. Battista M, Borrelli E, Sacconi R, Bandello F, Querques G. Optical coherence tomography angiography in diabetes: a review. Eur J Ophthalmol (2020) 30:411–6. doi: 10.1177/1120672119899901
33. Millas SC, Di Lauro S, Mira DG, López Galvez MI. Optic coherence tomography angiography in diabetic retinopathy. In: Di Lauro S, Millas SC, Mira DJG, editors. Eye diseases - recent advances, new perspectives and therapeutic options. Rijeka: IntechOpen (2022). p. 1–11.
34. Sun Z, Tang F, Wong R, Lok J, Szeto SKH, Chan JCK, et al. Oct Angiography metrics predict progression of diabetic retinopathy and development of diabetic macular edema: a prospective study. Ophthalmology (2019) 126:1675–84. doi: 10.1016/j.ophtha.2019.06.016
Keywords: diabetic retinopathy, microaneurysms, intraretinal microvascular abnormalities, retinal neovascularization, swept-source optical coherence tomography angiography, capillary non-perfusion areas
Citation: Li M, Mao M, Wei D, Liu M, Liu X, Leng H, Wang Y, Chen S, Zhang R, Zeng Y, Wang M, Li J and Zhong J (2023) Different scan areas affect the detection rates of diabetic retinopathy lesions by high-speed ultra-widefield swept-source optical coherence tomography angiography. Front. Endocrinol. 14:1111360. doi: 10.3389/fendo.2023.1111360
Received: 29 November 2022; Accepted: 06 February 2023;
Published: 20 February 2023.
Edited by:
Mohd Imtiaz Nawaz, Department of Ophthalmology, King Saud University, Saudi ArabiaReviewed by:
Salvatore Di Lauro, Hospital Clínico Universitario de Valladolid, SpainKai Shi, First Affiliated Hospital of Chongqing Medical University, China
Li Kaiming, The Affiliated Hospital of Southwest Medical University, China
Copyright © 2023 Li, Mao, Wei, Liu, Liu, Leng, Wang, Chen, Zhang, Zeng, Wang, Li and Zhong. This is an open-access article distributed under the terms of the Creative Commons Attribution License (CC BY). The use, distribution or reproduction in other forums is permitted, provided the original author(s) and the copyright owner(s) are credited and that the original publication in this journal is cited, in accordance with accepted academic practice. No use, distribution or reproduction is permitted which does not comply with these terms.
*Correspondence: Jie Zhong, emhvbmdqaWVAbWVkLnVlc3RjLmVkdS5jbg==; Jie Li, bGlqaWV5a0BtZWQudWVzdGMuZWR1LmNu
†These authors have contributed equally to this work and share first authorship