 Xianjing Feng1
 Fang Yu1
 Minping Wei1
 Yunfang Luo1
 Tingting Zhao1
 Zeyu Liu1
 Qin Huang1
 Ruxin Tu1
 Jiaxin Li1
 Boxin Zhang1
 Liuyang Cheng1
 Jian Xia1,2,3*
- 1Department of Neurology, Xiangya Hospital, Central South University, Changsha, Hunan, China
- 2Clinical Research Center for Cerebrovascular Disease of Hunan Province, Central South University, Changsha, Hunan, China
- 3National Clinical Research Center for Geriatric Disorders, Xiangya Hospital, Central South University, Changsha, Hunan, China
Background and purpose: Stress hyperglycemia ratio (SHR), which is used to assess stress hyperglycemia, is associated with the functional outcome of ischemic stroke (IS). IS can induce the inflammatory response. Neutrophil counts and neutrophil-to-lymphocyte ratio (NLR) as good and easily available inflammatory biomarkers, the relationship between neutrophil counts and NLR and SHR were poorly explored in IS. We aimed to systemically and comprehensively explore the correlation between various blood inflammation markers (mainly neutrophil counts and NLR) and SHR.
Methods: Data from 487 patients with acute IS(AIS) in Xiangya Hospital were retrospectively reviewed. High/low SHR groups according to the median of SHR (≤1.02 versus >1.02). Binary logistic regression analysis was used to evaluate the correlation between neutrophil counts and NLR and high SHR group. Subgroup analyses were performed in the TOAST classification and functional prognosis.
Results: The neutrophil counts and NLR were all clearly associated with SHR levels in different logistic analysis models. In the subgroup analysis of TOAST classification, the higher neutrophil counts and NLR were the independent risk factors for high SHR patients with large-artery atherosclerosis (LAA) (neutrophil: adjusted OR:2.047, 95% CI: 1.355-3.093, P=0.001; NLR: adjusted OR:1.315, 95% CI: 1.129-1.530, P<0.001). The higher neutrophil counts were the independent risk factor for high SHR patients with cardioembolism (CE) (adjusted OR:2.413, 95% CI: 1.081-5.383, P=0.031). ROC analysis showed that neutrophil counts was helpful for differentiating high SHR group with CE and low SHR group with CE (neutrophil: AUC =0.776, P=0.002). However, there were no difference in levels of neutrophil counts and NLR between patients with SVO and without SVO. The higher neutrophil counts and NLR independently associated with high SHR patients with mRS ≤2 at 90 days from symptom onset, (neutrophil: adjusted OR:2.284, 95% CI: 1.525-3.420, P<0.001; NLR: adjusted OR:1.377, 95% CI: 1.164-1.629, P<0.001), but not in patients with mRS >2.
Conclusions: This study found that the neutrophil counts and NLR are positively associated with SHR levels in AIS patients. In addition, the correlation between neutrophil counts and NLR and different SHR levels are diverse according to TOAST classification and functional prognosis.
1 Introduction
In recent decades, stroke has been the first leading cause of mortality and disability in China and imposes a substantial burden on family, society, and economy (1). Ischemic stroke (IS) accounts for ~81.9% of hospitalizations in all strokes in China (2). With the acceleration of China’s life expectancy and aging process, incidence of IS shows an increasing trend. Accordingly, how to improve prevention and treatment of IS has been a great concern.
Numerous studies have demonstrated that the immunity and inflammation play key roles in stroke (3, 4). Not only immune cells, but also cytokines and biochemical blood markers are involved in the mechanisms of IS progression. However, in daily practice, the assays of cytokines and immune cells are expensive and not widely available in hospitals. In turn, the assays of whole blood counts, such as white blood cells (WBC), neutrophil counts, and lymphocyte counts, have the advantages of speed, simplicity, and lower cost. In addition, whole blood counts as systemic inflammatory markers, which can provide valuable assessment for inflammatory response. Current studies have shown the important significance of whole blood counts, such as WBC, neutrophil counts, lymphocyte counts, and their combination ratios (neutrophil-lymphocyte ratio [NLR]), as markers of inflammation in AIS (5–7). Moreover, recent evidence also showed higher NLR was a predictor of stroke-associated pneumonia (8).
To our knowledge, almost half of IS patients may have stress hyperglycemia (9). Previous study found that acute hyperglycemia is an independent risk factor for in-hospital mortality and poor functional outcome after IS (10), regardless of the type of stroke treatment (11, 12), but with significance difference among diabetic and non-diabetic patients (13). In addition, hyperglycemia promoted the release of proinflammatory factors such as tumor necrosis factor-α(TNF-α) and interleukin-6 (IL-6) in vitro (14). A number of studies used the stress hyperglycemia ratio (SHR) as a tool to evaluate stress hyperglycemia (15, 16). Moreover, many studies have been found that SHR is associated with poor prognosis in AIS patients (17–19). Recent evidence revealed that elevated SHR was a clinical predictor of stroke-associated pneumonia (9).
However, up to now, the relationship between SHR and blood routine inflammatory indicators were poorly explored in AIS. This research aimed to systemically and comprehensively explore the correlation between various blood inflammation markers (mainly neutrophil counts and NLR) and SHR.
2 Materials and methods
2.1 Study participants
This study included consecutive AIS patients seen between July 2020 and September 2022 in Changsha Xiangya Hospital. AIS was defined by diffusion-weighted imaging (DWI) images. Inclusion criteria: (1) age ≥18 years old, (2) disease onset ≤ 14 days. Exclusion criteria: (1) Patients who no fasting blood glucose (FBG) and glycated hemoglobin (HbA1c), (2) Patients who no WBC, neutrophil counts and lymphocyte counts at admission, (3) Patients with other neurological diseases, (4) liver or renal failure.
2.2 Clinical assessments
We collected demographic variables (including age and sex), and vascular risk factors, including systolic blood pressure (SBP), diastolic blood pressure (DBP), history of stroke, history of hypertension, history of diabetes mellitus (DM), history of coronary heart disease (CAD), history of Hyperlipidemia, history of smoking and drinking. The definition of vascular risk factors was the same as the previous studies (20). Laboratorial findings included WBC, neutrophil, lymphocyte, triglycerides (TG), total cholesterol (TC), low-density lipoprotein (LDL), high-density lipoprotein (HDL), FBG, HbA1c, and homocysteine (Hcy).
Stroke severity at admission was assessed with the National Institutes of Health Stroke Scale (NIHSS) score, mild stroke: NIHSS score <6, moderate to severe stroke: NIHSS score of ≥6 (21). Discharge functional outcome was assessed with a modified Rankin Scale (mRS) score, good functional outcome: mRS score ≤ 2, poor functional outcome: mRS score of >2 (22). Etiology of ischemic stroke was assessed with Trial of Org 10172 in Acute Stroke Treatment (TOAST) (23).
2.3 Definition of stress hyperglycemia ratio
Fasting venous blood samples were collected within 24 hours after admission, and SHR was calculated from the following formula: FBG (mmol/L)/HbA1c (%) (24).
2.4 Statistical methods
SPSS 26.0, GraphPad Prism 8 and R software version R 4.2.1 were used to analyze statistical data and plot of the data. Categorical and continuous data were showed as counts and percentage (%) and medians [interquartile range (IQR), respectively. The Mann-Whitney U test was used to analyze continuous variables, and chi-squared test was used to analyze for categorical variables.
high/low SHR groups according to the median of SHR (≤1.02 versus >1.02). Binary logistic regression models were used to evaluate the differences among WBC, neutrophil counts, lymphocyte counts and NLR with different SHR groups. Three models were used by logistic regression. Spearman rank correlation test was used for correlation analyses among WBC, neutrophil counts, lymphocyte counts, NLR, and SHR. We performed subgroup analysis according to function prognosis at discharge and TOAST classification. Receiver operating characteristic (ROC) curve analysis was used to evaluate the values of neutrophil counts for differentiating high SHR group with CE and low SHR group with CE. Statistical significance was set at a 2-tailed P value <0.05.
3 Results
3.1 Baseline characteristics
A total of 487 AIS patients (male=320(65.7%); female=167(34.3%); median age=61 years) were enrolled in this study. The median of SHR was 1.02. High SHR group was associated with high frequency of DM, Hyperlipidemia, and higher SBP and DBP values. Simultaneously, High SHR group had higher levels of blood WBC, neutrophil counts, NLR, TG, TC, HDL, LDL, FBG, HbA1c, and lower levels of lymphocyte counts and Hcy levels. High SHR group had higher mRS score (Table 1).
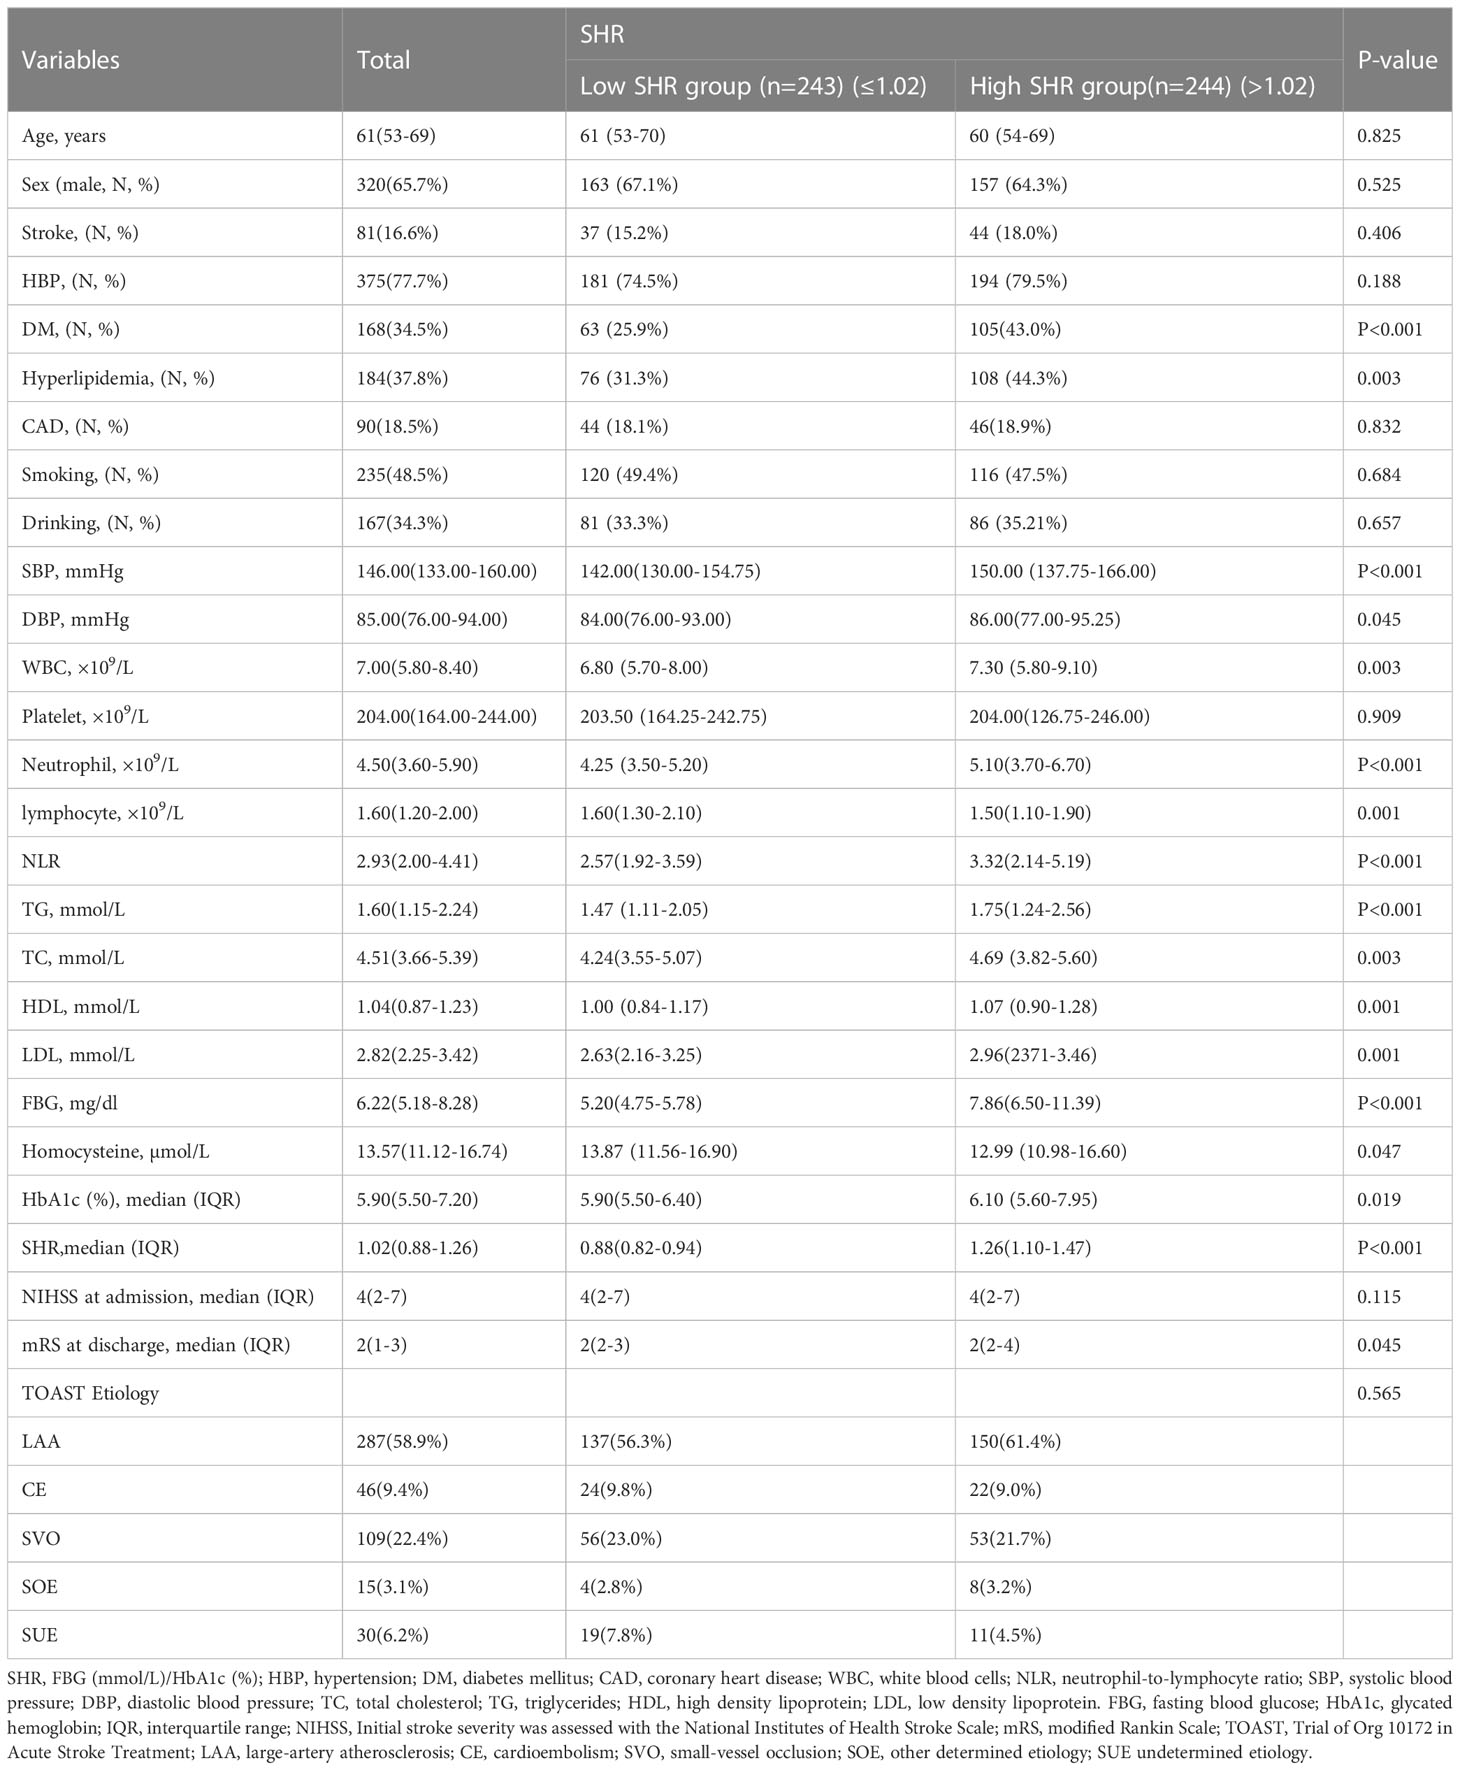
Table 1 Baseline characteristics of patients with ischemic stroke according to different SHR levels.
3.2 Differences of WBC, neutrophil counts, lymphocyte counts, and NLR between low SHR group and high SHR group
There were 243 AIS patients in low SHR group, and 244 AIS patients in high SHR group. WBC, neutrophil counts, lymphocyte counts, and NLR as continuous variables, all the four parameters were independently associated with high SHR group in different logistic analysis models. When the first quartile was regarded as reference, the fourth quartiles of WBC, neutrophil counts, lymphocyte counts, and NLR were significantly associated with high SHR group in different logistic analysis models. In addition, the second and third quartiles of lymphocyte levels were independently associated with high SHR group in different logistic analysis. The third quartiles of NLR independently associated with high SHR group in model1 (Table 2 and Figure 1).
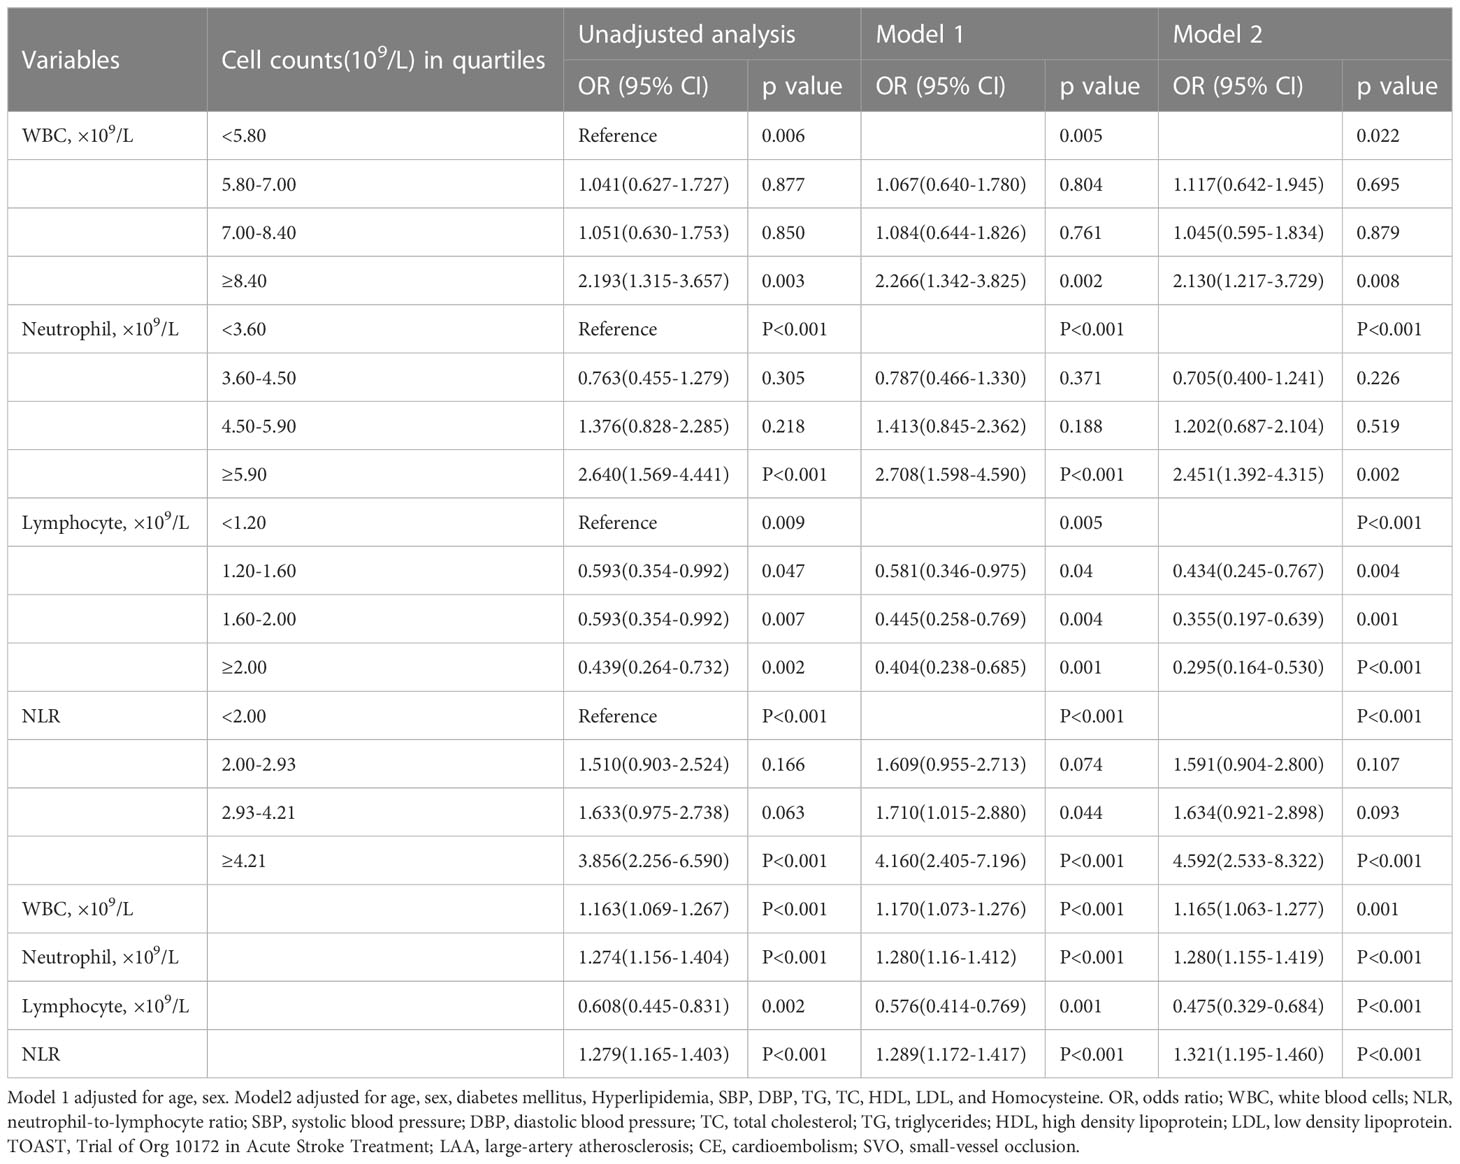
Table 2 Unadjusted and adjusted analyses of WBC, neutrophil counts, lymphocyte counts, and NLR with high SHR group.
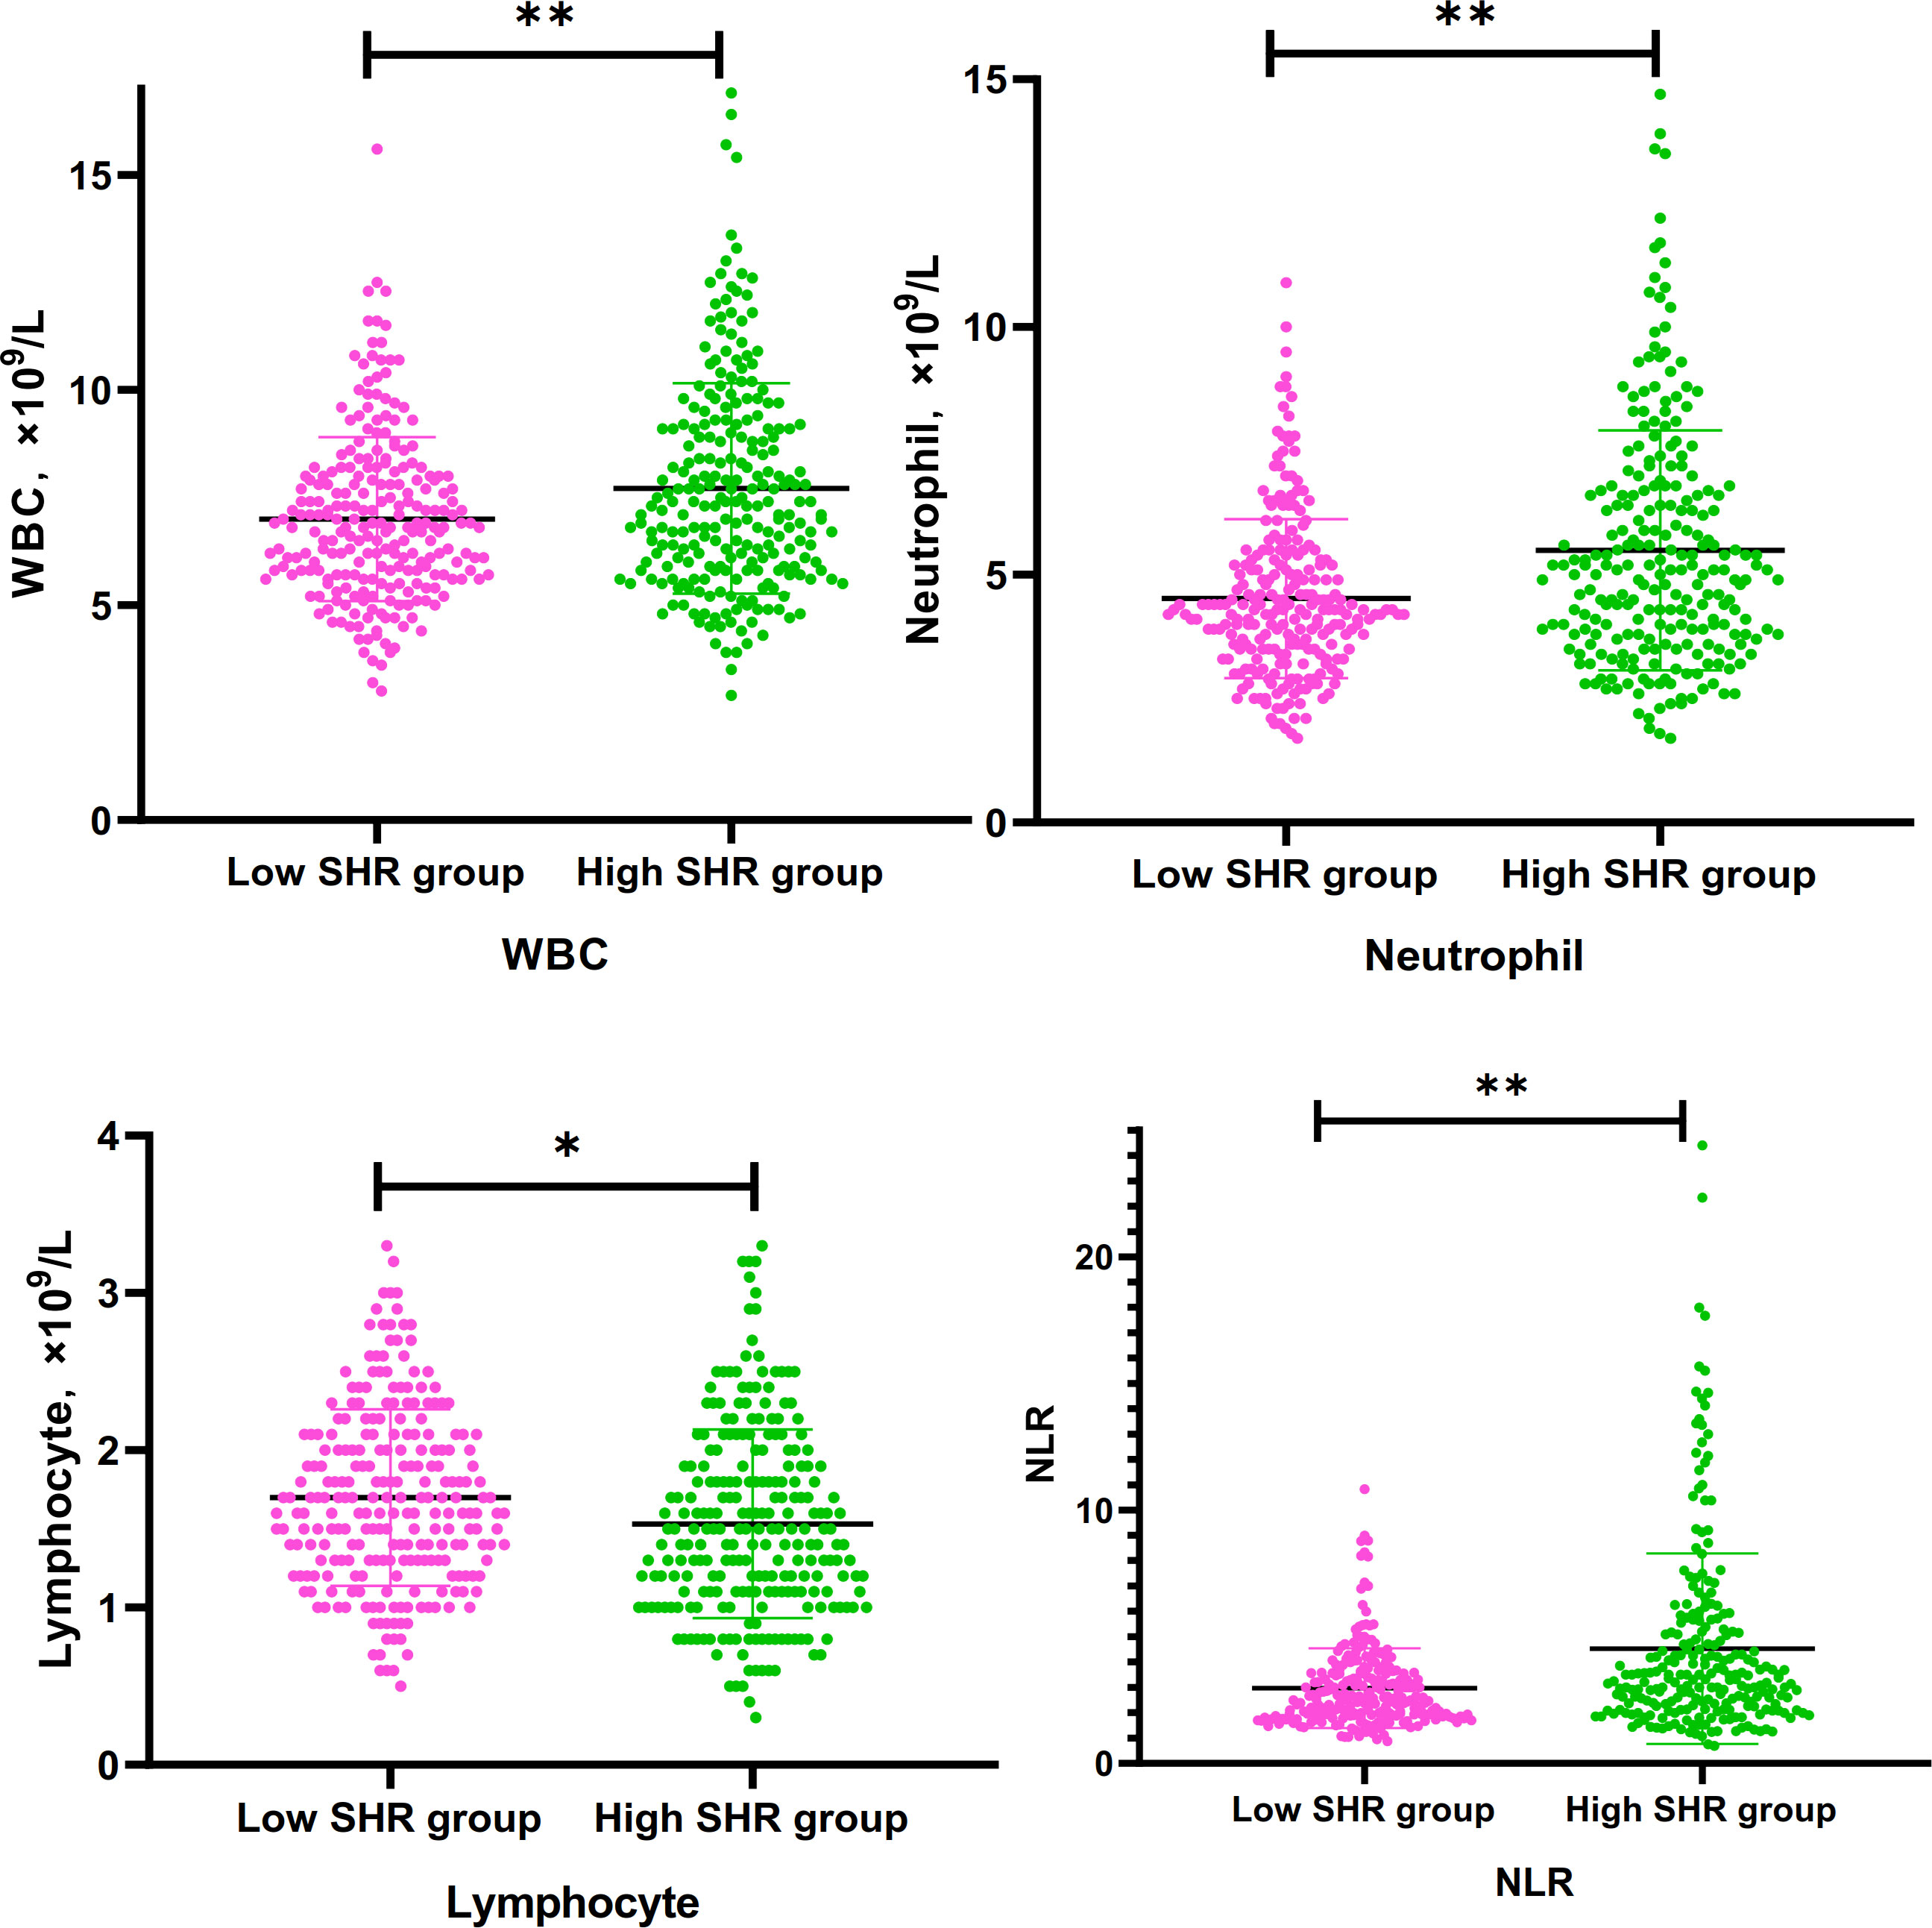
Figure 1 Differences of WBC, Neutrophil. lymphocyte, and NLR between low SHR group and hig SHR group. SHR-fasting blood glucose (mmol/L)/HbA1c (%); WBC, white blood cells; NLR, neutrophil-to-lymphocyte ratio. *P<095; **p<0.001.
To assess the linear association among the WBC, neutrophil counts, lymphocyte counts, and NLR with SHR, we constructed Spearman rank correlation analysis (Supplementary figure 1). Linear positive correlations among the WBC (r=0.18, p<0.001), neutrophil counts (r=0.230, p<0.001), and NLR (r=0.210, p<0.001) with SHR, respectively. The correlation between lymphocyte counts and SHR was not statistically significant (r=-0.087, p=0.056). The result suggested that the strongest association was observed between neutrophil counts and SHR.
3.3 Subgroup analyses were conducted between neutrophil counts and NLR with different SHR levels
Subgroup analyses were performed according to TOAST classification (LAA vs. SVO vs. CE) of ischemic stroke etiology and function prognosis at discharge and 90 days from stroke outset (mRS≤ 2 vs. mRS >2).
In the subgroup analysis of TOAST classification, high SHR patients with large-artery atherosclerosis (LAA) had clearly higher levels of neutrophil counts and NLR than low SHR patients with LAA; Multivariable logistic regression analysis showed the higher levels of neutrophil counts and NLR were the independent risk factors for high SHR patients with LAA (neutrophil:adjusted OR:2.047, 95% CI: 1.355-3.093, P=0.001; NLR: adjusted OR:1.315, 95% CI: 1.129-1.530, P<0.001) (Table 3 and Figures 2A, B). Multivariable logistic regression analysis also showed high SHR patients with cardioembolism (CE) had clearly higher neutrophil counts than low SHR patients with CE (adjusted OR:2.413, 95% CI: 1.081-5.383, P=0.031) (Table 3 and Figure 2C). However, there’s no difference in neutrophil counts and NLR between high SHR patients with small-vessel occlusion (SVO) than low SHR patients with SVO (Table 3). ROC analysis showed that neutrophil counts was helpful for differentiating high SHR group with CE and low SHR group with CE (neutrophil: AUC =0.776, 95%CI 0.633-0.919; P=0.002, specificity 0.750, sensitivity 0.857; optimal cut-off: 4.850, Figure 2D).
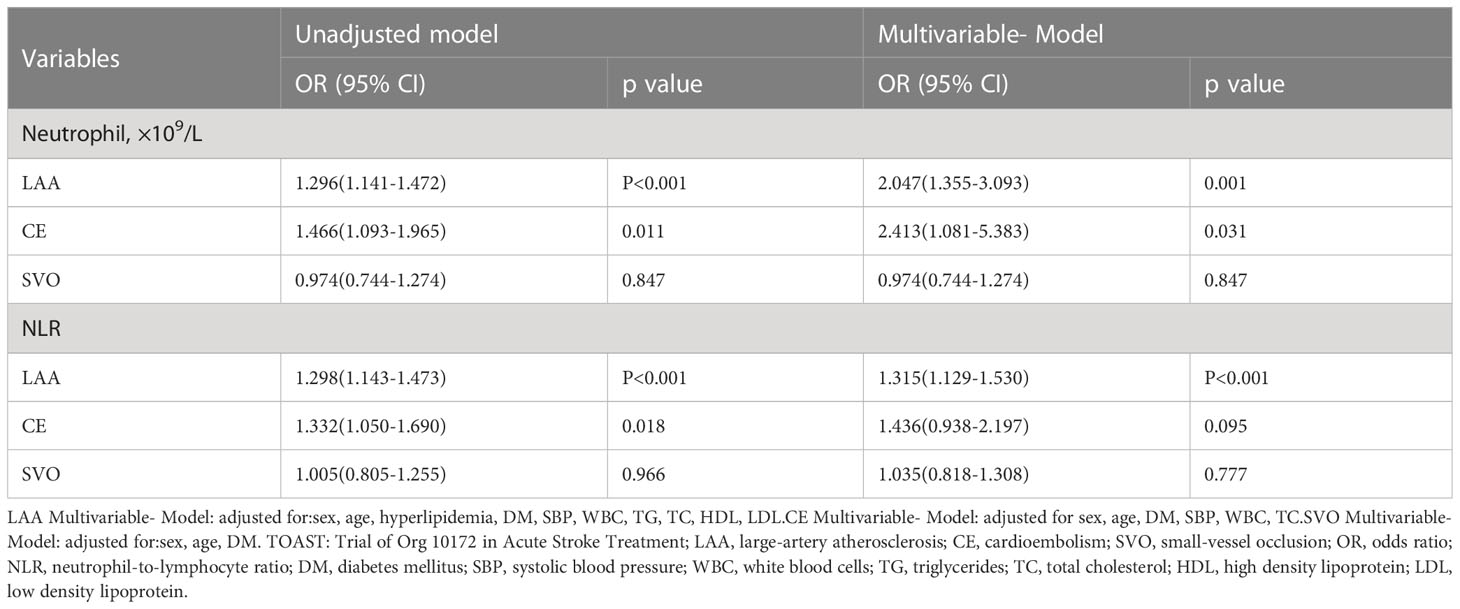
Table 3 Unadjusted and adjusted analyses of neutrophil counts and NLR with high SHR group according to TOAST classification of ischemic stroke etiology.
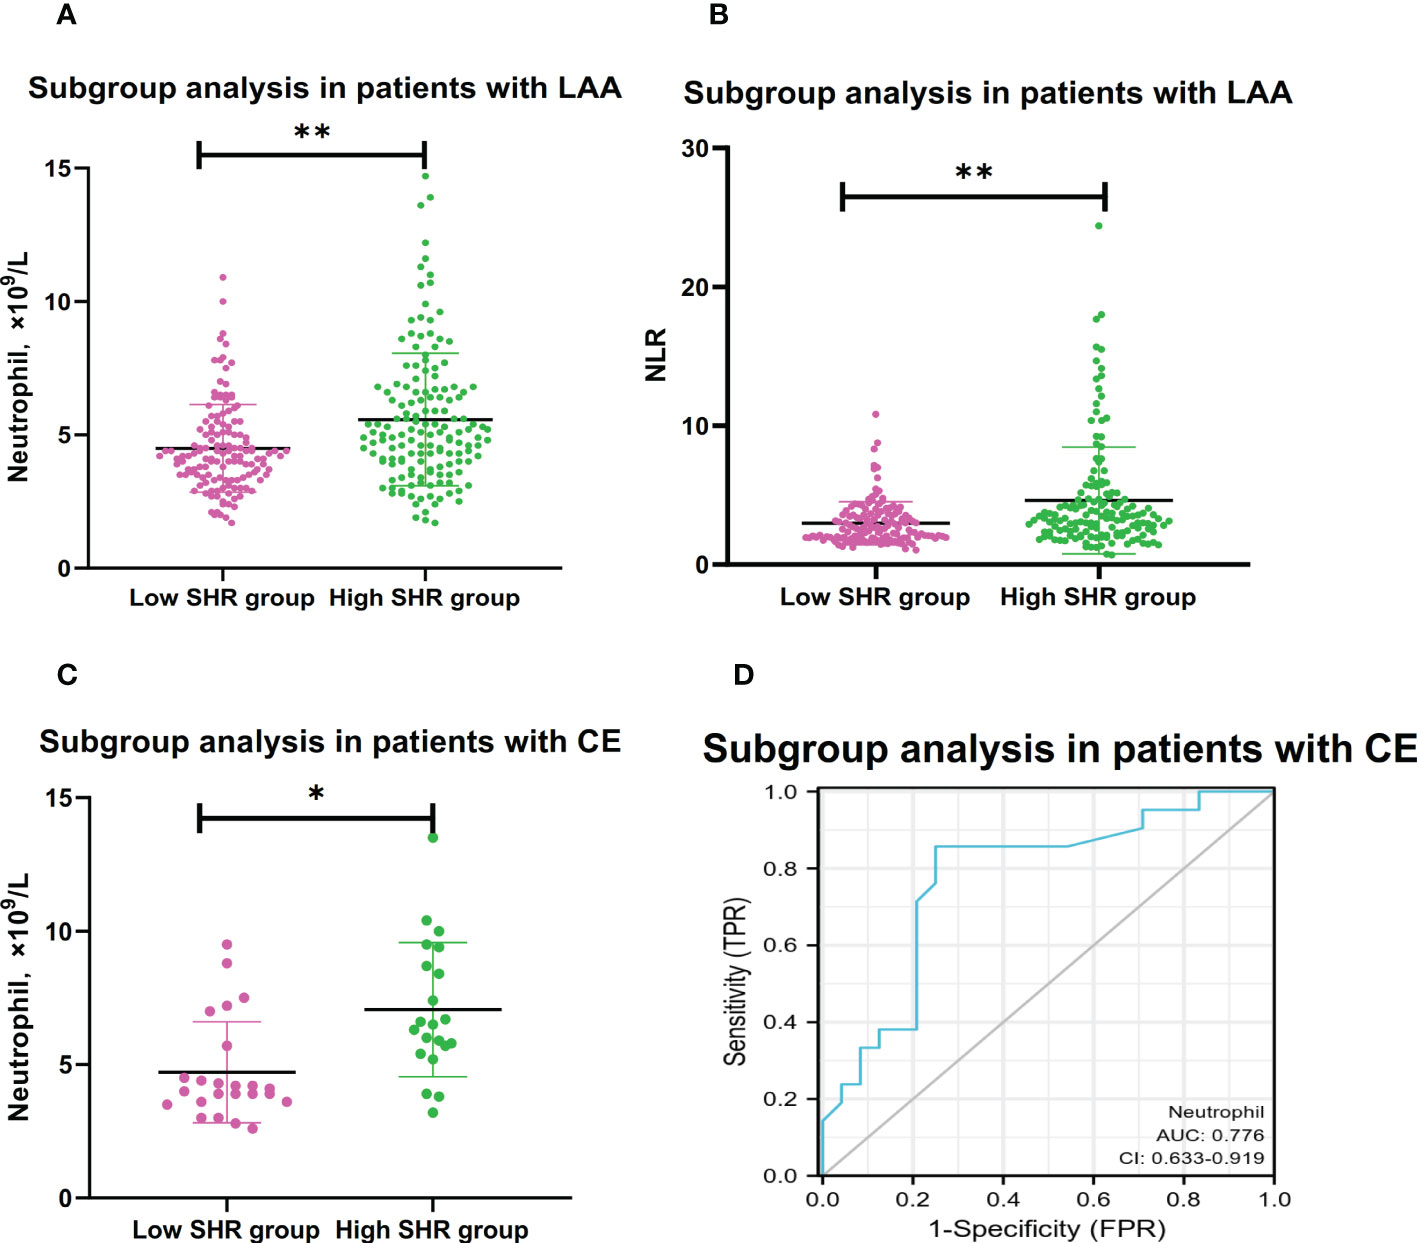
Figure 2 Subgroup analyses for association between neutrophil and NLR with high SHR group.(A) Comparison of neutrophil counts between low SHR group and high SHR group in patients with LAA. (B) Comparison of NLR between low SHR group and high SHR group in patients with LAA. (C) Comparison of neutrophil counts between low SHR group and high SHR group in patients with CE. (D) ROC analysis of predication performance of neutrophil for high SHR group in patients with CE. (Neutrophil: AUC 0.776, 95% CI 0.633-0.919; P=0.002, specificity 0.750, sensitivity 0.857; optimal cut-off: 4.850) (*P <0.05, **P <0.001). NLR, neutrophil-to-lymphocyter ratio: SHR-fasting blood glucose AUC: Areas under the receiver operating characteristics curve (ROC) curves.
In the subgroup analysis of discharge function prognosis, there’s no difference in the subgroup analysis of function prognosis. Independently of mRS status, high SHR correlates with higher neutrophil counts and higher NLR (Table 4).
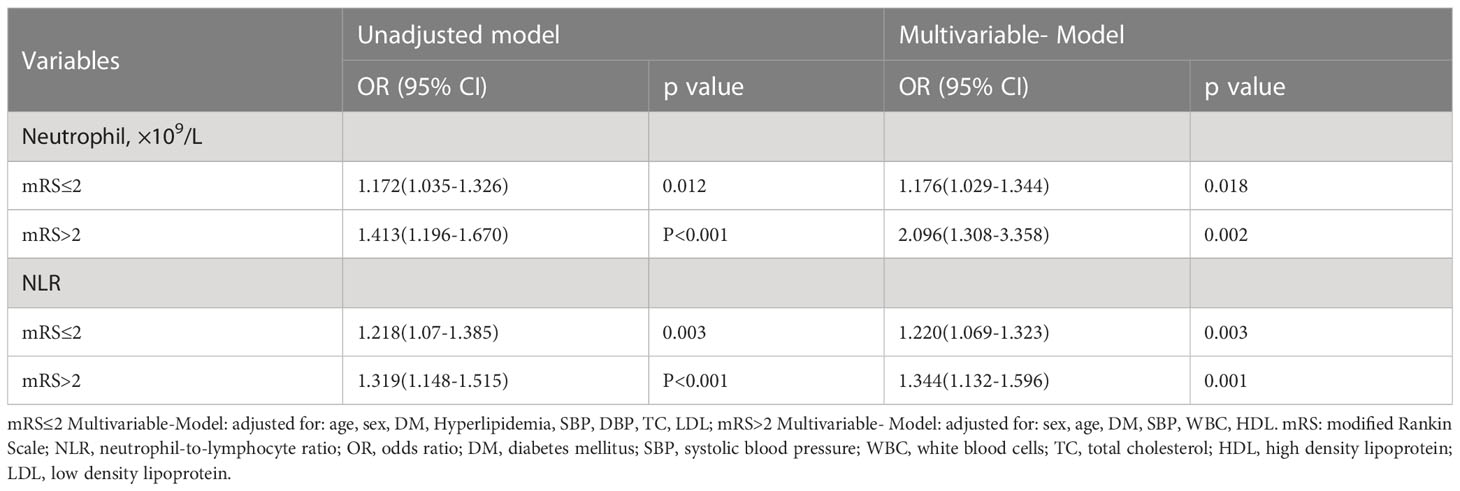
Table 4 Unadjusted and adjusted analyses of neutrophil and NLR with high SHR group according to discharge functional outcomes subgroup.
In the subgroup analysis of 90 days function prognosis, the correlation of the high SHR correlates with higher neutrophil counts and higher NLR were dependent on different prognosis. Multivariable logistic regression analysis showed the higher levels of neutrophil counts and NLR as the independent risk factors for High SHR patients with mRS ≤2, (neutrophil: adjusted OR:2.284, 95% CI: 1.525-3.420, P<0.001; NLR: adjusted OR:1.377, 95% CI: 1.164-1.629, P<0.001), but not in high SHR patients with mRS >2. (Table 5).
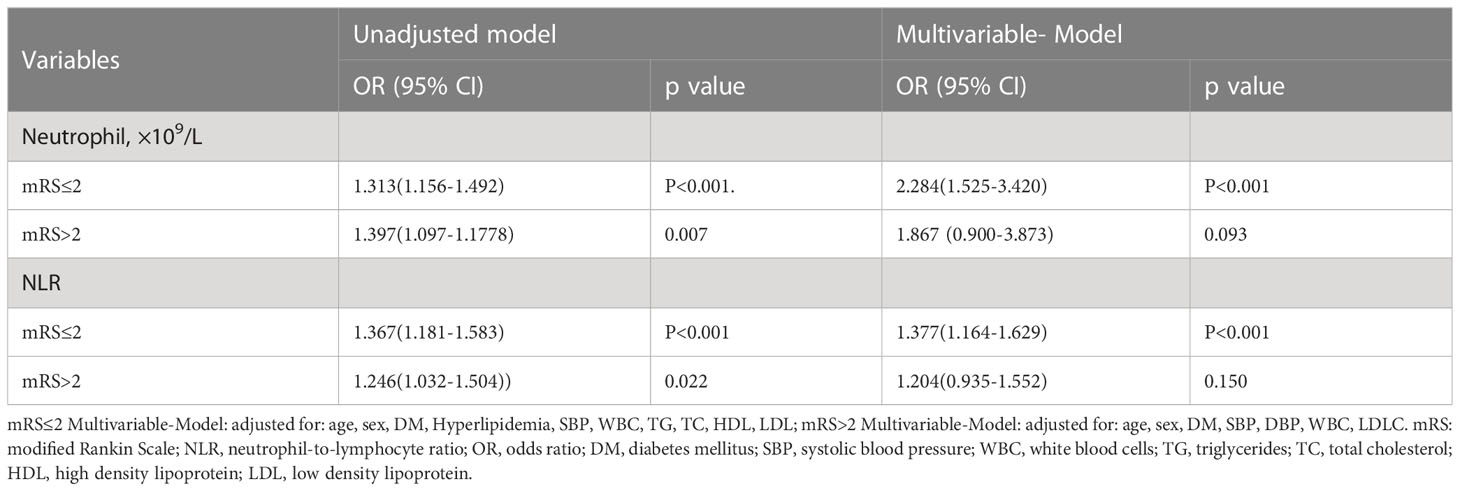
Table 5 Unadjusted and adjusted analyses of neutrophil and NLR with high SHR group according to 90 days functional outcomes subgroup.
4 Discussion
The current study is the first study that systemically and comprehensively investigated the correlation between various systemic blood inflammatory factors and stress hyperglycemia. First, our study found that all four parameters of WBC, neutrophil counts, lymphocyte counts, and NLR were independently associated with high SHR group; second, among different stroke etiology patients, in accordance with the TOAST classification, there’s not always a correlation between SHR levels, neutrophil counts and NLR, and neutrophil counts was helpful for differentiating high SHR group with CE and low SHR group with CE; last, the correlation of the high SHR correlates with higher neutrophil counts and higher NLR were dependent on different functional prognosis.
In patients with IS, elevated neutrophil counts and NLR predicted poor outcome and stroke recurrence (25). Consistent with previous studies, higher neutrophil counts and NLR were predictors for worse functional outcome in AIS patients in our study (Supplementary Figure 2). Acute cerebral ischemia triggers the rapid inflammatory reaction. After IS, the integrity of the blood-brain barrier (BBB) is disrupted. Destruction of the BBB promotes the migration of peripheral immune cells to the brain. Neutrophils are rapidly recruited into cerebral tissue. The study found neutrophil recruitment in leptomeninges from 6 h in an animal model of IS, in the cortical basal lamina from 15 h, and in the cerebral parenchyma at 24 h by confocal microscopy in mice and human IS (26). Neutrophil extracellular traps (NETs) were released by neutrophils, which can promote thrombus formation, exacerbate injury of neurons, foster inflammation, and impair vascular remodeling after IS (27–29). Low lymphocyte counts were demonstrated to have a neuroprotective effect in AIS (30, 31). NLR is defined by neutrophil counts divided by lymphocyte counts. Previous studies showed that NLR could predict the clinical prognosis, hemorrhagic transformation (HT), and stroke-associated pneumonia in IS patients (8, 32, 33).
The catecholamines, inflammatory cytokines, and IR act synergistically to promote stress hyperglycemia in different diseases (34, 35). SHR, defined as FBG/HbA1c ratio, was used to represent the state of stress hyperglycemia. SHR was associated with functional outcome, complications, HT, and stroke recurrence in AIS patients (9, 18, 36). Although the pathogenic mechanisms are not so clear, it was proposed that hyperactivated stress could trigger BBB breakdown, oxidative stress response, inflammation and cytokine release in stroke (19). Zhao et al. found that high glucose could promote inflammation of endothelial cell by hypoxia-inducible factor-1 alpha signaling pathway (37). Chronic hyperglycemia can promote oxidative stress and the chronic accumulation of advanced glycation end products (AGEs) (38). AGEs have been proved that could induce inflammatory activation in different diseases (39), such as AGEs increase interleukin (IL)-6 expression via NF-κB pathways (40). Although stress hyperglycemia has been shown to correlate with inflammatory cytokines, the assays of cytokines and immune cells are expensive and not widely available in hospitals. In turn, WBC, neutrophil counts, lymphocyte counts, and NLR are available and inexpensive biomarkers from routine laboratory data. Therefore, we explore the correlation between various blood inflammatory markers and different SHR levels. In our study, we found that high SHR levels (SHR>1.02) were clearly associated with higher levels of WBC, neutrophil counts, and NLR.
TOAST classification is the widest tool to determine IS etiology, which categorizes ischemic stroke into five etiological subtypes: LAA, CE, SVO, other determined etiology (SOE); and undetermined etiology (SUE), respectively (41). LAA, which is the most common subtype of IS, is primarily caused by atherosclerosis. Previous studies have found atherosclerosis is a chronic inflammatory disease, which can promote the formation, progression, and rupture of atherosclerotic plaque (42). Hyperglycemia promotes of formation AGEs, which could induce progression of atherosclerosis via inflammation and oxidative stress response (43). In our study, we found the higher levels of neutrophil counts and NLR were associated with high SHR levels in the IS patients with LAA. We speculated that stress hyperglycemia may promote the progression of atherosclerosis by activating peripheral blood lymphocytes and neutrophils and disrupting BBB in IS patients with LAA. Previous studies found that CE promoted more inflammatory cytokines release, is the most serious strokes, and has the worst prognosis compared to other IS etiologies (44, 45). Previous study indicated that inflammation might induce stress hyperglycemia by promoting hepatic gluconeogenesis (35). In our study, we found the higher levels of neutrophil counts were associated with high SHR levels in the IS patients with CE. We speculated that CE promoted more severe inflammation, and inflammation induced stress hyperglycemia. However, there were no difference in levels of neutrophil counts and NLR between patients with SVO and without SVO. The present study indicated that the association between neutrophil counts and NLR and stress hyperglycemia may be more likely to occur in IS patients with LAA and CE subtypes.
This study has several limitations. First, this study was performed in single time point, the association between dynamic changes of blood inflammatory factors and different SHR levels were expected in future. Second, the study was designed to collect clinical data only from Xiangya Hospital, which may result in the selection bias. Third, this study was observational, and the causal relationship cannot be clarified. Thus, prospective, multi-center studies were expected to clarify this relationship.
5 Conclusions
This study found that the high levels of neutrophil counts and NLR are positively associated with SHR levels in AIS patients. In addition, the correlation between neutrophil counts and NLR and different SHR levels are diverse according to TOAST classification of IS etiology and functional prognosis.
Data availability statement
The original contributions presented in the study are included in the article/Supplementary Material. Further inquiries can be directed to the corresponding author.
Ethics statement
The studies involving human participants were reviewed and approved by Xiangya Hospital Ethics Committee. The patients/participants provided their written informed consent to participate in this study.
Author contributions
Concept and design: XF. Clinical data: XF, FY, MW, YL, TZ, ZL, QH, RT, JL, BZ, LC. Statistical analyses: XF and FY. Draft manuscript: XF and FY. JX reviewed the manuscript, and contributed to discussions. All authors contributed to the article and approved the submitted version.
Funding
This study was supported by the Project Program of the National Clinical Research Center for Geriatric Disorders (Xiangya Hospital, Grant No. 2020LNJJ16), the Provincial Key Plan for Research and Development of Hunan (Grant No. 2020SK2067), National Key Research and Development Projects (Grant No 2022YFC3602400 and 2022YFC3602401), and the National Natural Science Foundation of China (Grant No. 82271369).
Acknowledgments
We kindly thank Xiantao platform (https://www.xiantao.love/products) for generating Figure 2D.
Conflict of interest
The authors declare that the research was conducted in the absence of any commercial or financial relationships that could be construed as a potential conflict of interest.
Publisher’s note
All claims expressed in this article are solely those of the authors and do not necessarily represent those of their affiliated organizations, or those of the publisher, the editors and the reviewers. Any product that may be evaluated in this article, or claim that may be made by its manufacturer, is not guaranteed or endorsed by the publisher.
Supplementary material
The Supplementary Material for this article can be found online at: https://www.frontiersin.org/articles/10.3389/fendo.2023.1117408/full#supplementary-material
References
1. Zhou M, Wang H, Zeng X, Yin P, Zhu J, Chen W, et al. Mortality, morbidity, and risk factors in China and its provinces, 1990-2017: a systematic analysis for the global burden of disease study 2017. Lancet (London England) (2019) 394(10204):1145–58. doi: 10.1016/S0140-6736(19)30427-1
2. Wang Y-J, Li Z-X, Gu H-Q, Zhai Y, Jiang Y, Zhao X-Q, et al. China Stroke statistics 2019: A report from the national center for healthcare quality management in neurological diseases, China national clinical research center for neurological diseases, the Chinese stroke association, national center for chronic and non-communicable disease control and prevention, Chinese center for disease control and prevention and institute for global neuroscience and stroke collaborations. Stroke Vasc Neurol (2020) 5(3):211–39. doi: 10.1136/svn-2021-001374
3. Henein MY, Vancheri S, Longo G, Vancheri F. The role of inflammation in cardiovascular disease. Int J Mol Sci (2022) 23(21):12906. doi: 10.3390/ijms232112906
4. Pawluk H, Kołodziejska R, Grześk G, Kozakiewicz M, Woźniak A, Pawluk M, et al. Selected mediators of inflammation in patients with acute ischemic stroke. Int J Mol Sci (2022) 23(18):10614. doi: 10.3390/ijms231810614
5. Shi J, Peng H, You S, Liu Y, Xu J, Xu Y, et al. Increase in neutrophils after recombinant tissue plasminogen activator thrombolysis predicts poor functional outcome of ischaemic stroke: a longitudinal study. Eur J Neurol (2018) 25(4):687–e45. doi: 10.1111/ene.13575
6. Herz J, Sabellek P, Lane TE, Gunzer M, Hermann DM, Doeppner TR. Role of neutrophils in exacerbation of brain injury after focal cerebral ischemia in hyperlipidemic mice. Stroke (2015) 46(10):2916–25. doi: 10.1161/STROKEAHA.115.010620
7. Maestrini I, Strbian D, Gautier S, Haapaniemi E, Moulin S, Sairanen T, et al. Higher neutrophil counts before thrombolysis for cerebral ischemia predict worse outcomes. Neurology (2015) 85(16):1408–16. doi: 10.1212/WNL.0000000000002029
8. Nam K-W, Kim TJ, Lee JS, Kwon H-M, Lee Y-S, Ko S-B, et al. High neutrophil-to-Lymphocyte ratio predicts stroke-associated pneumonia. Stroke (2018) 49(8):1886–92. doi: 10.1161/STROKEAHA.118.021228
9. Tao J, Hu Z, Lou F, Wu J, Wu Z, Yang S, et al. Higher stress hyperglycemia ratio is associated with a higher risk of stroke-associated pneumonia. Front In Nutr (2022) 9:784114. doi: 10.3389/fnut.2022.784114
10. Capes SE, Hunt D, Malmberg K, Pathak P, Gerstein HC. Stress hyperglycemia and prognosis of stroke in nondiabetic and diabetic patients: a systematic overview. Stroke (2001) 32(10):2426–32. doi: 10.1161/hs1001.096194
11. Merlino G, Smeralda C, Gigli GL, Lorenzut S, Pez S, Surcinelli A, et al. Stress hyperglycemia is predictive of worse outcome in patients with acute ischemic stroke undergoing intravenous thrombolysis. J Thromb Thrombolysis (2021) 51(3):789–97. doi: 10.1007/s11239-020-02252-y
12. Merlino G, Pez S, Gigli GL, Sponza M, Lorenzut S, Surcinelli A, et al. Stress hyperglycemia in patients with acute ischemic stroke due to Large vessel occlusion undergoing mechanical thrombectomy. Front In Neurol (2021) 12:725002. doi: 10.3389/fneur.2021.725002
13. Merlino G, Pez S, Tereshko Y, Gigli GL, Lorenzut S, Surcinelli A, et al. Stress hyperglycemia does not affect clinical outcome of diabetic patients receiving intravenous thrombolysis for acute ischemic stroke. Front In Neurol (2022) 13:903987. doi: 10.3389/fneur.2022.903987
14. Morohoshi M, Fujisawa K, Uchimura I, Numano F. Glucose-dependent interleukin 6 and tumor necrosis factor production by human peripheral blood monocytes vitro. Diabetes (1996) 45(7):954–9. doi: 10.2337/diab.45.7.954
15. Yang Y, Kim T-H, Yoon K-H, Chung WS, Ahn Y, Jeong M-H, et al. The stress hyperglycemia ratio, an index of relative hyperglycemia, as a predictor of clinical outcomes after percutaneous coronary intervention. Int J Cardiol (2017) 241:57–63. doi: 10.1016/j.ijcard.2017.02.065
16. Yang C-J, Liao W-I, Wang J-C, Tsai C-L, Lee J-T, Peng G-S, et al. Usefulness of glycated hemoglobin A1c-based adjusted glycemic variables in diabetic patients presenting with acute ischemic stroke. Am J Emergency Med (2017) 35(9):1240–6. doi: 10.1016/j.ajem.2017.03.049
17. Gu M, Fan J, Xu P, Xiao L, Wang J, Li M, et al. Effects of perioperative glycemic indicators on outcomes of endovascular treatment for vertebrobasilar artery occlusion. Front In Endocrinol (2022) 13:1000030. doi: 10.3389/fendo.2022.1000030
18. Huang Y-W, Yin X-S, Li Z-P. Association of the stress hyperglycemia ratio and clinical outcomes in patients with stroke: A systematic review and meta-analysis. Front In Neurol (2022) 13:999536. doi: 10.3389/fneur.2022.999536
19. Mi D, Li Z, Gu H, Jiang Y, Zhao X, Wang Y, et al. Stress hyperglycemia is associated with in-hospital mortality in patients with diabetes and acute ischemic stroke. CNS Neurosci Ther (2022) 28(3):372–81. doi: 10.1111/cns.13764
20. Feng X, Yu F, Zhou X, Liu Z, Liao D, Huang Q, et al. MMP9 rs17576 is simultaneously correlated with symptomatic intracranial atherosclerotic stenosis and white matter hyperintensities in Chinese population. Cerebrovascular Dis (Basel Switzerland) (2021) 50(1):4–11. doi: 10.1159/000511582
21. Wu C, Xue F, Lian Y, Zhang J, Wu D, Xie N, et al. Relationship between elevated plasma trimethylamine n-oxide levels and increased stroke injury. Neurology (2020) 94(7):e667–77. doi: 10.1212/WNL.0000000000008862
22. Schwedhelm E, Schwieren L, Tiedt S, von Lucadou M, Gloyer N-O, Böger R, et al. Serum sphingosine-1-Phosphate levels are associated with severity and outcome in patients with cerebral ischemia. Stroke (2021) 52(12):3901–7. doi: 10.1161/STROKEAHA.120.033414
23. Adams HP, Bendixen BH, Kappelle LJ, Biller J, Love BB, Gordon DL, et al. Classification of subtype of acute ischemic stroke. definitions for use in a multicenter clinical trial. TOAST. trial of org 10172 in acute stroke treatment. Stroke (1993) 24(1):35–41. doi: 10.1161/01.str.24.1.35
24. Deng Y, Wu S, Liu J, Liu M, Wang L, Wan J, et al. The stress hyperglycemia ratio is associated with the development of cerebral edema and poor functional outcome in patients with acute cerebral infarction. Front In Aging Neurosci (2022) 14:936862. doi: 10.3389/fnagi.2022.936862
25. Zhu B, Pan Y, Jing J, Meng X, Zhao X, Liu L, et al. Neutrophil counts, neutrophil ratio, and new stroke in minor ischemic stroke or TIA. Neurology (2018) 90(21):e1870–8. doi: 10.1212/WNL.0000000000005554
26. Perez-de-Puig I, Miró-Mur F, Ferrer-Ferrer M, Gelpi E, Pedragosa J, Justicia C, et al. Neutrophil recruitment to the brain in mouse and human ischemic stroke. Acta Neuropathologica (2015) 129(2):239–57. doi: 10.1007/s00401-014-1381-0
27. Kang L, Yu H, Yang X, Zhu Y, Bai X, Wang R, et al. Neutrophil extracellular traps released by neutrophils impair revascularization and vascular remodeling after stroke. Nat Commun (2020) 11(1):2488. doi: 10.1038/s41467-020-16191-y
28. Li C, Xing Y, Zhang Y, Hua Y, Hu J, Bai Y. Neutrophil extracellular traps exacerbate ischemic brain damage. Mol Neurobiol (2022) 59(1):643–56. doi: 10.1007/s12035-021-02635-z
29. Laridan E, Denorme F, Desender L, François O, Andersson T, Deckmyn H, et al. Neutrophil extracellular traps in ischemic stroke thrombi. Ann Neurol (2017) 82(2):223–32. doi: 10.1002/ana.24993
30. Macrez R, Ali C, Toutirais O, Le Mauff B, Defer G, Dirnagl U, et al. Stroke and the immune system: from pathophysiology to new therapeutic strategies. Lancet Neurol (2011) 10(5):471–80. doi: 10.1016/S1474-4422(11)70066-7
31. Xiao J, Qiu Q-W, Qin C, Tao R, Qiao S-Y, Chen M, et al. Dynamic changes of peripheral blood lymphocyte subsets in acute ischemic stroke and prognostic value. Brain Behav (2021) 11(1):e01919. doi: 10.1002/brb3.1919
32. Goyal N, Tsivgoulis G, Chang JJ, Malhotra K, Pandhi A, Ishfaq MF, et al. Admission neutrophil-to-Lymphocyte ratio as a prognostic biomarker of outcomes in Large vessel occlusion strokes. Stroke (2018) 49(8):1985–7. doi: 10.1161/STROKEAHA
33. Song Q, Pan R, Jin Y, Wang Y, Cheng Y, Liu J, et al. Lymphocyte-to-monocyte ratio and risk of hemorrhagic transformation in patients with acute ischemic stroke. Neurological Sciences: Off J Ital Neurological Soc Ital Soc Clin Neurophysiol (2020) 41(9):2511–20. doi: 10.1007/s10072-020-04355-z
34. Marik PE, Bellomo R. Stress hyperglycemia: an essential survival response! Crit Care (London England) (2013) 17(2):305. doi: 10.1097/CCM.0b013e318283d124
35. Dungan KM, Braithwaite SS, Preiser J-C. Stress hyperglycaemia. Lancet (London England) (2009) 373(9677):1798–807. doi: 10.1016/S0140-6736(09)60553-5
36. Yuan C, Chen S, Ruan Y, Liu Y, Cheng H, Zeng Y, et al. The stress hyperglycemia ratio is associated with hemorrhagic transformation in patients with acute ischemic stroke. Clin Interventions In Aging (2021) 16:431–42. doi: 10.2147/CIA.S280808
37. Zhao M, Wang S, Zuo A, Zhang J, Wen W, Jiang W, et al. HIF-1α/JMJD1A signaling regulates inflammation and oxidative stress following hyperglycemia and hypoxia-induced vascular cell injury. Cell Mol Biol Lett (2021) 26(1):40. doi: 10.1186/s11658-021-00283-8
38. Volpe CMO, Villar-Delfino PH, Dos Anjos PMF, Nogueira-Machado JA. Cellular death, reactive oxygen species (ROS) and diabetic complications. Cell Death Dis (2018) 9(2):119. doi: 10.1038/s41419-017-0135-z
39. Byun K, Yoo Y, Son M, Lee J, Jeong G-B, Park YM, et al. Advanced glycation end-products produced systemically and by macrophages: A common contributor to inflammation and degenerative diseases. Pharmacol Ther (2017) 177:44–55. doi: 10.1016/j.pharmthera.2017.02.030
40. Nonaka K, Kajiura Y, Bando M, Sakamoto E, Inagaki Y, Lew JH, et al. Advanced glycation end-products increase IL-6 and ICAM-1 expression via RAGE, MAPK and NF-κB pathways in human gingival fibroblasts. J Periodontal Res (2018) 53(3):334–44. doi: 10.1111/jre.12518
41. Zhang H, Li Z, Dai Y, Guo E, Zhang C, Wang Y. Ischaemic stroke etiological classification system: the agreement analysis of CISS, SPARKLE and TOAST. Stroke Vasc Neurol (2019) 4(3):123–8. doi: 10.1136/svn-2018-000226
42. Zhu Y, Xian X, Wang Z, Bi Y, Chen Q, Han X, et al. Research progress on the relationship between atherosclerosis and inflammation. Biomolecules (2018) 8(3):80. doi: 10.3390/biom8030080
43. Yuan T, Yang T, Chen H, Fu D, Hu Y, Wang J, et al. New insights into oxidative stress and inflammation during diabetes mellitus-accelerated atherosclerosis. Redox Biol (2019) 20:247–60. doi: 10.1016/j.redox.2018.09.025
44. Fuentes B, Ntaios G, Putaala J. Editorial: Current challenges in cardioembolic stroke. Front In Neurol (2021) 12:688371. doi: 10.3389/fneur.2021.688371
Keywords: ischemic stroke, stress hyperglycemia, neutrophil, lymphocyte-to-monocyte ratio, stroke etiology
Citation: Feng X, Yu F, Wei M, Luo Y, Zhao T, Liu Z, Huang Q, Tu R, Li J, Zhang B, Cheng L and Xia J (2023) The association between neutrophil counts and neutrophil-to-lymphocyte ratio and stress hyperglycemia in patients with acute ischemic stroke according to stroke etiology. Front. Endocrinol. 14:1117408. doi: 10.3389/fendo.2023.1117408
Received: 06 December 2022; Accepted: 01 March 2023;
Published: 16 March 2023.
Edited by:
Xuebin Fu, Ann & Robert H. Lurie Children’s Hospital of Chicago, United StatesReviewed by:
Andrea Surcinelli, Santa Maria delle Croci Hospital, ItalyGian Luigi Gigli, University of Udine, Italy
Copyright © 2023 Feng, Yu, Wei, Luo, Zhao, Liu, Huang, Tu, Li, Zhang, Cheng and Xia. This is an open-access article distributed under the terms of the Creative Commons Attribution License (CC BY). The use, distribution or reproduction in other forums is permitted, provided the original author(s) and the copyright owner(s) are credited and that the original publication in this journal is cited, in accordance with accepted academic practice. No use, distribution or reproduction is permitted which does not comply with these terms.
*Correspondence: Jian Xia, eGppYW4xMjE2QGNzdS5lZHUuY24=