 Yan Li
 Yiwen Wang1
- 1Reproductive Medicine Center, People’s Hospital of Zhengzhou University, Henan Provincial People’s Hospital, Zhengzhou, Henan, China
- 2Department of Gynaecology and Obstetrics, Xinjiang Production and Construction Corps 13 Division Red Star Hospital, Hami, Xinjiang, China
Introduction: Insulin resistance (IR) may play a central role in the pathophysiology of polycystic ovary syndrome (PCOS). Controlled ovarian stimulation (COS) in PCOS women in the setting of assisted reproductive technology (ART) is always a challenge for clinicians. However, it remains unclear whether IR in women with PCOS correlates with reduced ovarian sensitivity to exogenous gonadotropin (Gn). This study aimed to explore the association between homeostasis model assessment of insulin resistance (HOMA-IR) and ovarian sensitivity index (OSI).
Methods: In this retrospective cohort study, we explored the association between Ln HOMA-IR and Ln OSI based on smoothing splines generated by generalized additive model (GAM). Then the correlation between HOMA-IR and OSI was further tested with a multivariable linear regression model and subgroup analysis.
Results: 1508 women with PCOS aged 20-39 years undergoing their first oocyte retrieval cycle were included consecutively between 2018 until 2022. We observed a negative association between Ln HOMA-IR and Ln OSI by using smoothing splines. In multivariable linear regression analysis, the inverse association between Ln HOMA-IR and Ln OSI was still found in PCOS women after adjustment for potential confounders (β = -0.18, 95% CI -0.25, -0.11). Compared with patients with the lowest tertile of HOMA-IR, those who had the highest tertile of HOMA-IR had lower OSI values (β = -0.25, 95% CI -0.36, -0.15).
Discussion: Our study provided evidence for the inverse correlation between IR and the ovarian sensitivity during COS in PCOS women. Herein, we proposed new insights for individualized manipulation in PCOS patients with IR undergoing ART.
Introduction
Polycystic ovary syndrome (PCOS) is a highly prevalent endocrine disorder affecting 6–21% of women of reproductive age (1–3). Oligomenorrhea, obesity, infertility, hyperandrogenemia and insulin resistance (IR) constitute the common features of PCOS (4–6). In PCOS women, IR may play a central role in the pathophysiology, which occur with a prevalence of 77.5% in overweight and 93.9% in obese subjects (7). Homeostatic model assessment (HOMA-IR) is broadly used as a surrogate measure of IR in clinical research (7, 8).
In the setting of assisted reproductive technology (ART), controlled ovarian stimulation (COS) in PCOS women is a challenge for clinicians. The ovarian response to COS is reported to vary widely among PCOS patients. While some patients are more likely to show resistance to stimulation, other PCOS women may experience an exaggerated response (9, 10). Thus, the identification of heterogenous ovarian sensitivity in PCOS populations is the key to striking a balance between ovarian hyperstimulation syndrome (OHSS) and poor ovarian response (POR). Some clinical parameters, including age, body mass index (BMI), anti-mullerian hormone (AMH), and antral follicle count (AFC) have been widely used as predictive markers of ovarian response (11). However, these markers cannot properly reflect the dynamic process of follicular growth in response to exogenous gonadotropin (Gn) (12). Recently, ovarian sensitivity index (OSI) has been suggested as an evaluation of ovarian response to Gn stimulation in ART (12). Higher values of OSI were associated with better ovarian response and greater odds of pregnancy (12–14).
The association between IR and ovarian function in PCOS women has been a debating issue. Previous studies have shown that hyperinsulinemia could promote early folliculogenesis which may result in hyper-response to COS (15, 16). In contrast, researchers observed increased fasting insulin was associated with decreased numbers of large antral follicles in PCOS patients (17). Emerging evidence for the interplay between IR and atresia of antral follicles in PCOS has been described (18, 19). In addition, some researchers reported IR may have an adverse effect on the developmental potential of oocytes when considering the reduced maturation rate (20).
Therefore, it remains unclear whether IR in women with PCOS correlates with reduced ovarian sensitivity to Gn. To our knowledge, few studies have evaluated the association between HOMA-IR and OSI during ART procedures. The aim of this retrospective cohort study was to investigate the association between HOMA-IR and OSI in PCOS women scheduled for in vitro fertilization (IVF) or intracytoplasmic sperm injection (ICSI) cycles, which may offer useful guidance to clinicians for individualized infertility therapies.
Materials and methods
Patients
This study was a retrospective cohort analysis. Women who underwent a standard Gonadotropin releasing hormone (GnRH) agonist or GnRH antagonist protocol in their first IVF/ICSI treatment cycle at reproductive medicine center of Henan Provincial People’s Hospital between June 2018 and May 2022 were consecutively included. Diagnosis of PCOS was based on the Rotterdam criteria (21). Body mass index (BMI) of ≥ 24 kg/m2 was defined as overweight and BMI of ≥ 28 kg/m2 was defined as obesity according to Working Group on Obesity in China (22, 23).
We included individuals (BMI ≥ 18.5 kg/m2) aged between 20 and 39 years with complete data on IR, including fasting glucose (FG), fasting serum insulin (FINS). The exclusion criteria were as follows: FG > 7 mmol/l, untreated thyroid diseases, subjects had received anti-diabetic medications within 3 months prior to evaluation, preimplantation genetic testing (PGT), canceling oocyte retrieval and oocytes freezing.
FG and FINS measurement
Basal FSH, LH, estradiol, total testosterone, progesterone and prolactin were done during the 2-4 days of the menstrual cycle. Fasted blood samples were collected to measure biochemical markers, including insulin, glucose and thyroid-stimulating hormone (TSH). The inter-assay laboratory coefficient of variation (CV) of FG testing was lower than 3.5%, which was detected by ADVIA2400ChemistrySystem (ADVIA 2400, SIEMENS, Germany). FINS concentration was determined by the electro-chemiluminescence immunoassay method (CV < 3.2%) on the full-automatic chemiluminescence immunoassay analyzer (Cobas8000 e602; Roche Diagnostics GmbH, Mannheim, Germany) in the laboratory of the Department of Reproductive Endocrinology at Henan Provincial People’s Hospital. Our laboratory is checked for qualification by the External Quality Assessment of Clinical Laboratory Center annually (Ministry of Health of the People’s Republic of China, Beijing, China).
Indicator calculation
HOMA-IR and OSI were assessed by formula as follows: HOMA-IR = FBG (mmol/L) x FINS (μU/ml)/22.5 (24); OSI = [(Number of retrieved oocytes/Total gonadotropin dose) × 1,000] (12); BMI was calculated according to the formula, weight (kg)/height (m)2. Implantation rate was defined as the number of gestational sacs divided by the number of transferred embryos. Clinical pregnancy rate was calculated by the ratio of clinical pregnancy cycle to the total embryo transfer (ET) cycle. Early miscarriage was referred to intrauterine pregnancy loss before 12 weeks of pregnancy, while late miscarriage was defined as a pregnancy loss prior to 28 weeks of gestational age.
Controlled ovarian stimulation protocol
COS protocols consisted of GnRH agonist down regulation protocol and GnRH antagonist protocol. These dose step-up regimens were individualized according to women’s age, BMI and ovarian reserve. In GnRH agonist down regulation protocol, subcutaneously injected 0.1 mg triptorelin was scheduled for patients from the 6th-8th day after ovulation to the 18th-22th day until sufficient downregulation of the pituitary was achieved. After that, exogenous Gn and 0.05 mg triptorelin was administered simultaneously until the day of human chorionic gonadotropin (HCG) triggering. In the long-acting GnRH agonist down regulation protocol, patients received a single dose of triptorelin acetate (Diphereline; 3.75mg) on day 2-4 of the menstrual cycle. If downregulation of the pituitary was satisfactory after 30-35 days, exogenous Gn was injected to initiate the cycle. In the GnRH antagonist protocol, Gn was administrated on the 2-3 days of the menstrual cycle, and GnRH antagonist (Cetrotide; 0.25 mg) was added daily from day six to seven of stimulation until the day of HCG triggering. The hCG was administered when at least two follicles had reached a mean diameter of 17-18 mm and the serum estradiol (E2) levels were consistent with the ultrasound findings. Ultrasound-guided follicular aspiration was performed at 35-36 hours after the administration of the hCG injection. High-quality embryos meant day 3 embryos that reached 6 to 8 cell stages with cytoplasmic fragmentation less than 10% and equal size blastomeres.
Statistical analysis
Owing to skewed distribution, HOMA-IR and OSI values were log e transformed to Ln HOMA-IR and Ln OSI. Continuous variables with normal distribution were expressed as mean ± standard deviation (SD). Continuous variables with skewed distribution were presented median with interquartile range (IQR). Categorical variables were expressed as frequency (percentage). The differences between HOMA-IR tertiles were compared using the one-way analysis of variance (normal distribution), Kruskal-Wallis test (skewed distribution) for continuous variables and Pearson’s chi-squared test, or Fisher’s exact test for the categorical variables. Multiple comparison posttest was conducted by using the Bonferroni correction.
The association of Ln HOMA-IR with Ln OSI was fitted and presented as smoothing splines which was generated by a generalized additive model (GAM) after adjustments for age, BMI, AFC, AMH, the initial Gn dose, basal FSH and COS protocol.
To analyze whether Ln HOMA-IR was independently associated with Ln OSI, multivariable linear regression models were used. These models included crude model (not adjusted for covariates), model 1 (adjusted for age, BMI, AMH and AFC), model 2 (adjusted for age, BMI, AMH, basal FSH, initial Gn dose, AFC, and COS protocol). As sensitivity analysis, HOMA-IR was then divided into tertiles and treated as a categorical variable, with the lowest tertile used as the reference. In addition, we performed linear trend tests to obtain P for trend by entering the median value of each HOMA-IR category as a continuous variable in the models.
Subgroup analysis was performed for examination of the association of Ln HOMA-IR with Ln OSI in the strata of age, BMI, AMH, initial Gn dose, and COS protocol. Next, we use log likelihood ratio test to obtain a P-value for interaction for examining the statistical significance of the difference in each subgroup.
Statistical analysis was undertaken by using software packages R (http://www.R-project.org, The R Foundation) and Empower (R) (www.empowerstats.com; X&Y Solutions, Inc., Boston, MA). A two-tailed P value < 0.05 was considered statistically significant.
Results
Patient disposition
Data from women having PCOS undergoing their first oocyte retrieval cycles were analysed. A total of 2191 medical records between June 2018 and May 2022 were screened and 1508 IVF/ICSI cycles were finally included in the analysis (Figure 1).
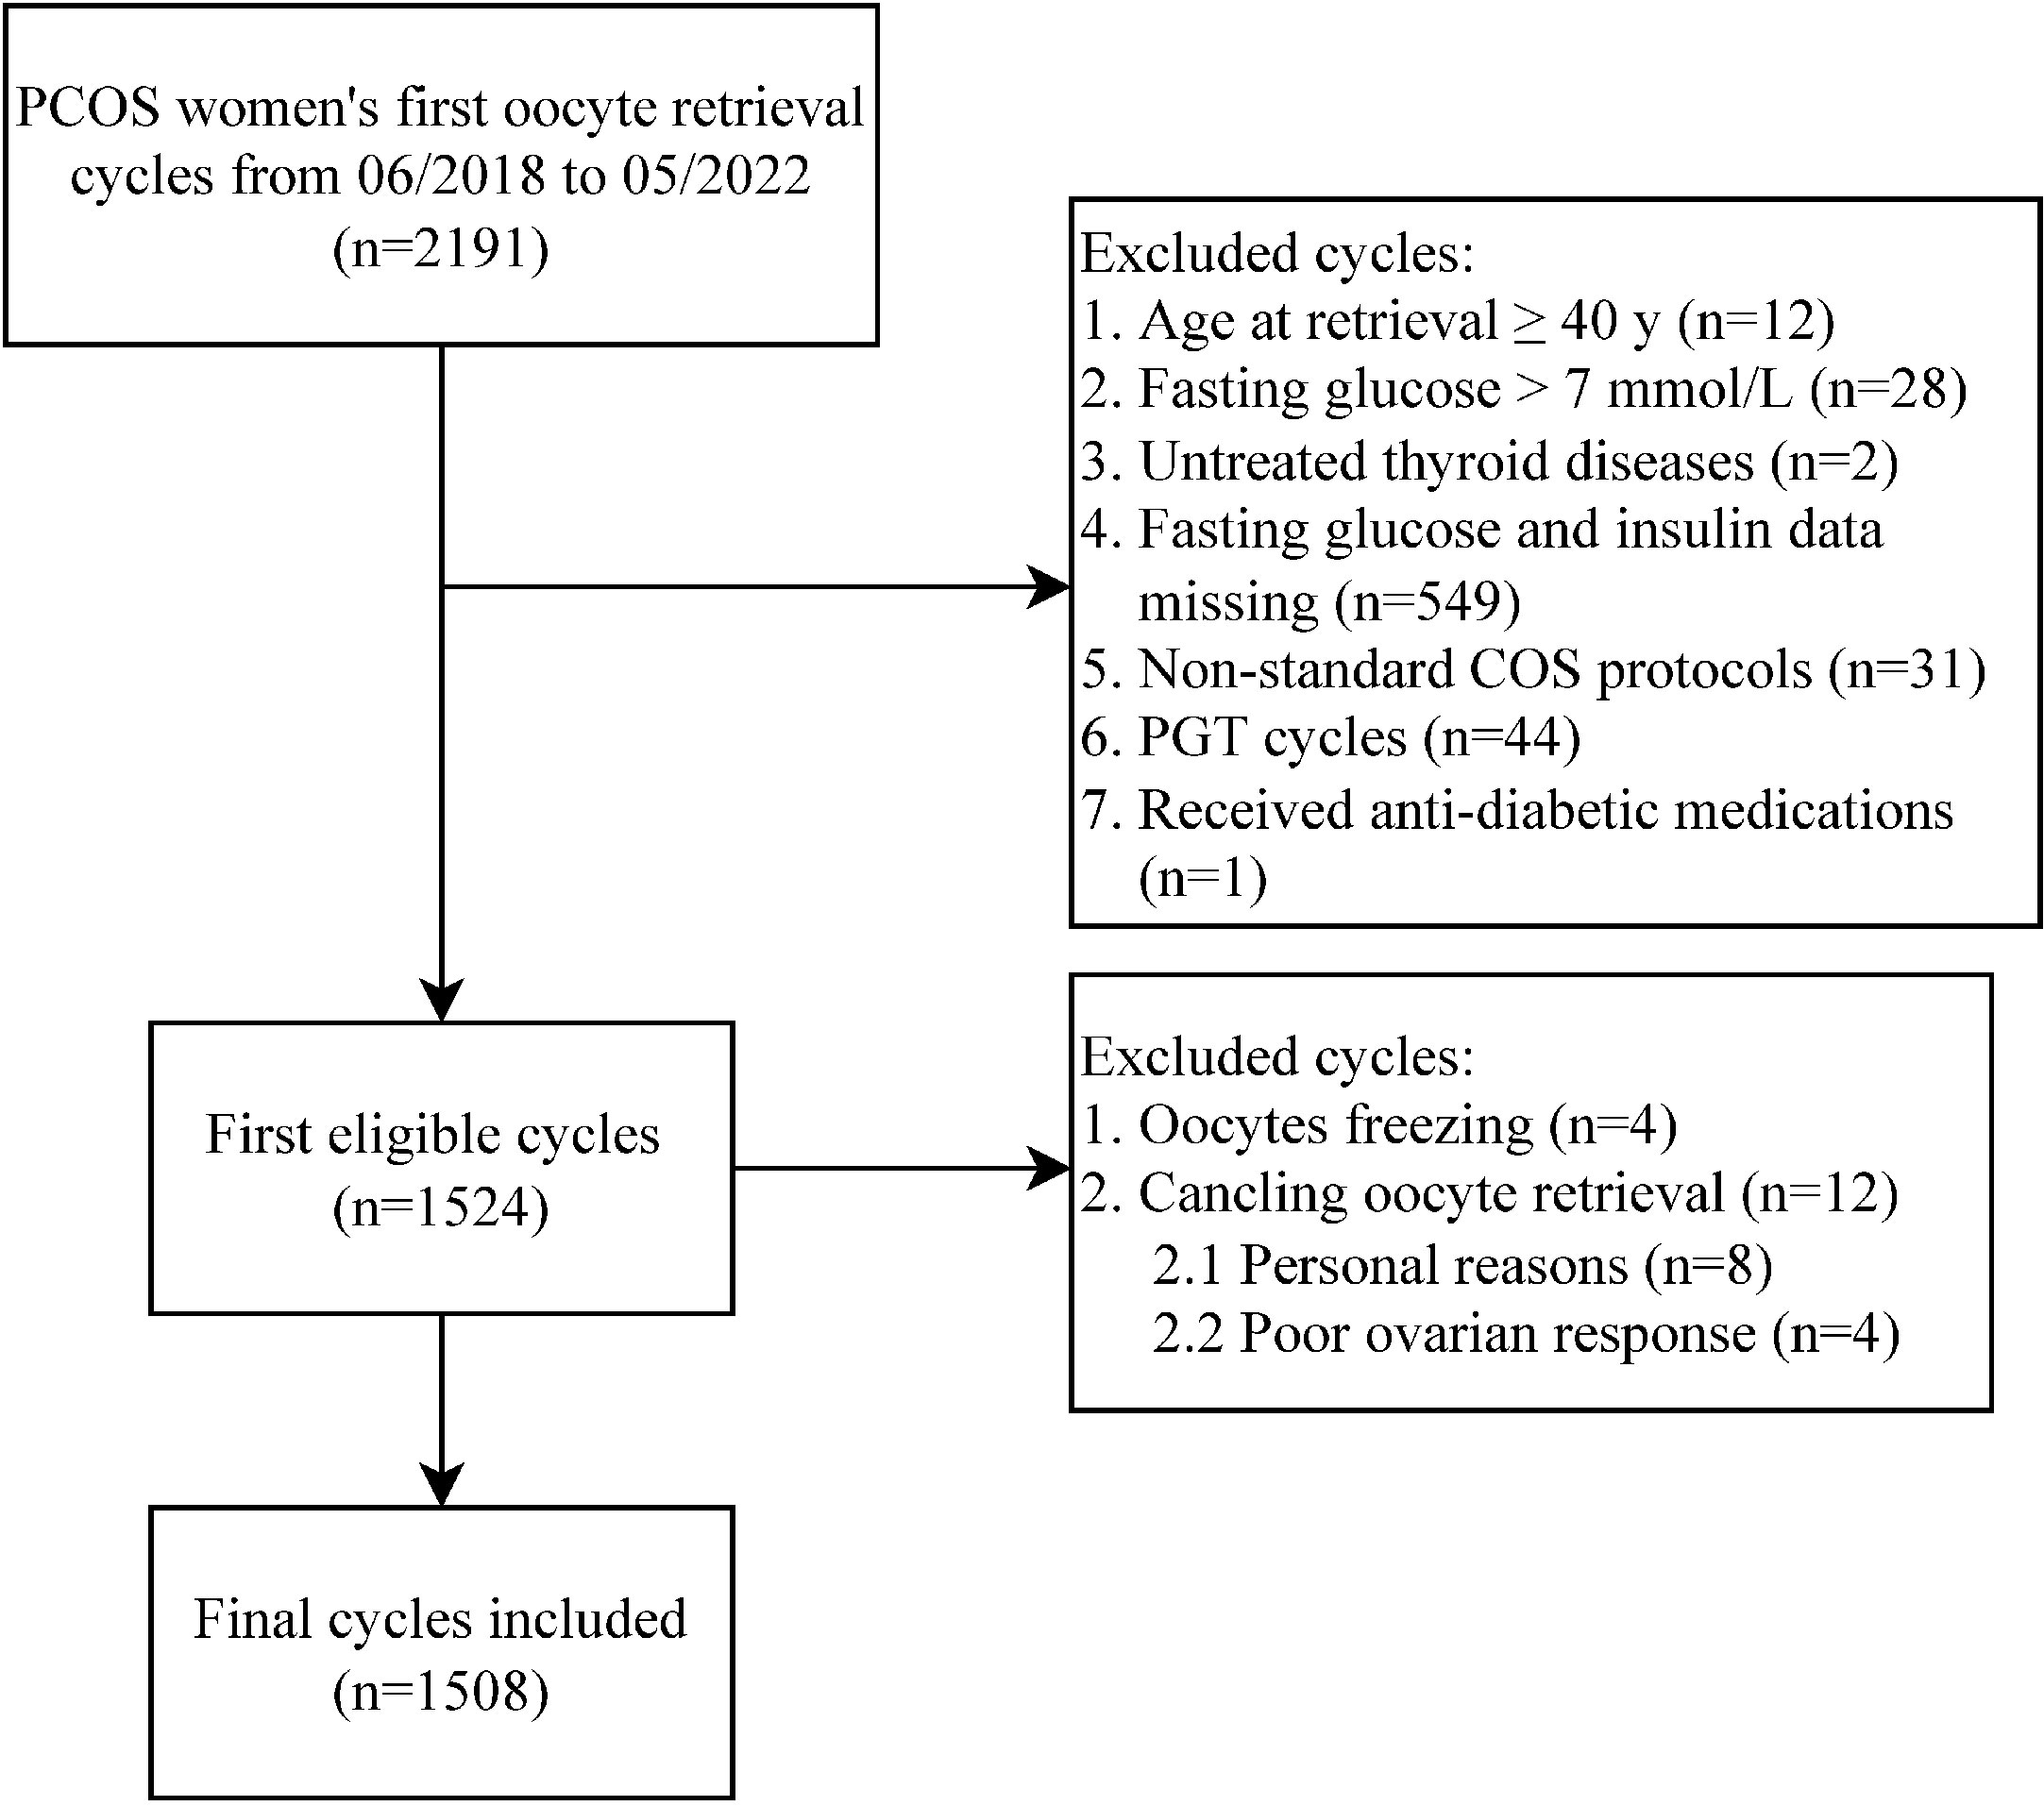
Figure 1 Flowchart of data collection process. PCOS, polycystic ovary syndrome; COS, controlled ovarian stimulation; PGT, preimplantation genetic testing.
The clinical parameters of patients
Patient characteristics were presented in Table 1. Subjects with higher HOMA-IR tended to be younger and had higher levels of BMI, AFC, FINS, FG, the initial Gn dose, total Gn dose and duration of Gn used. The levels of AMH, basal FSH, basal LH, dominant follicle count on trigger day, number of retrieved oocytes, metaphase II (MII) oocytes, embryos and OSI values were prone to be decreased across the HOMA-IR tertiles. With regards to the clinical outcomes, as shown in Supplementary Figure S1, the early miscarriage rate was significantly higher in T3 group when compared with that of T1 subjects (P < 0.05). No significant difference was detected for implantation rate, clinical pregnancy rate and late miscarriage rate (P > 0.05).
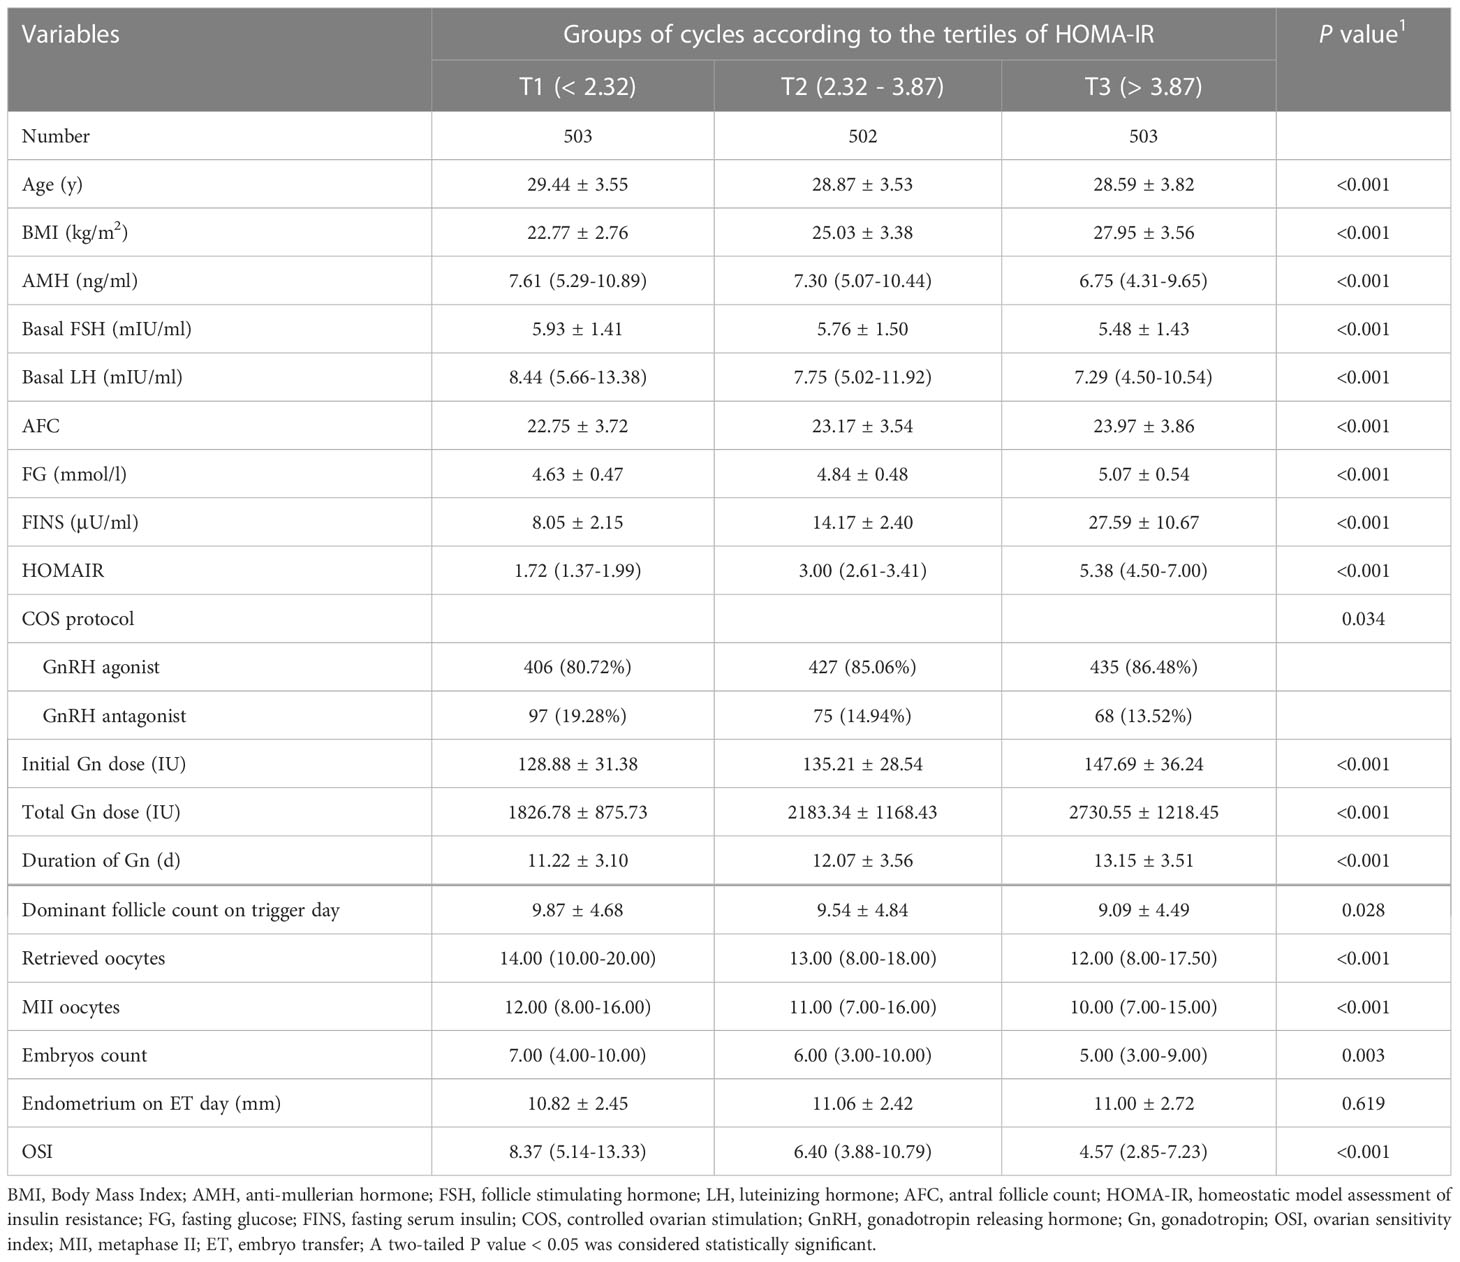
Table 1 The clinical parameters of the study population.
Associations between HOMA-IR and OSI
The data distribution of HOMA-IR and OSI was strongly skewed. Thus, we performed log e transformation (Ln HOMA-IR and Ln OSI) before analysis. First, we observed a negative association between Ln HOMA-IR and Ln OSI after adjustment for potential confounders by using smoothing spline fitting curves in GAM (Figure 2). Then, a multivariable linear regression model was performed to analyze the association of Ln HOMA-IR with Ln OSI levels. In addition, we performed sensitivity analysis where HOMA-IR was divided into three groups based on tertiles.
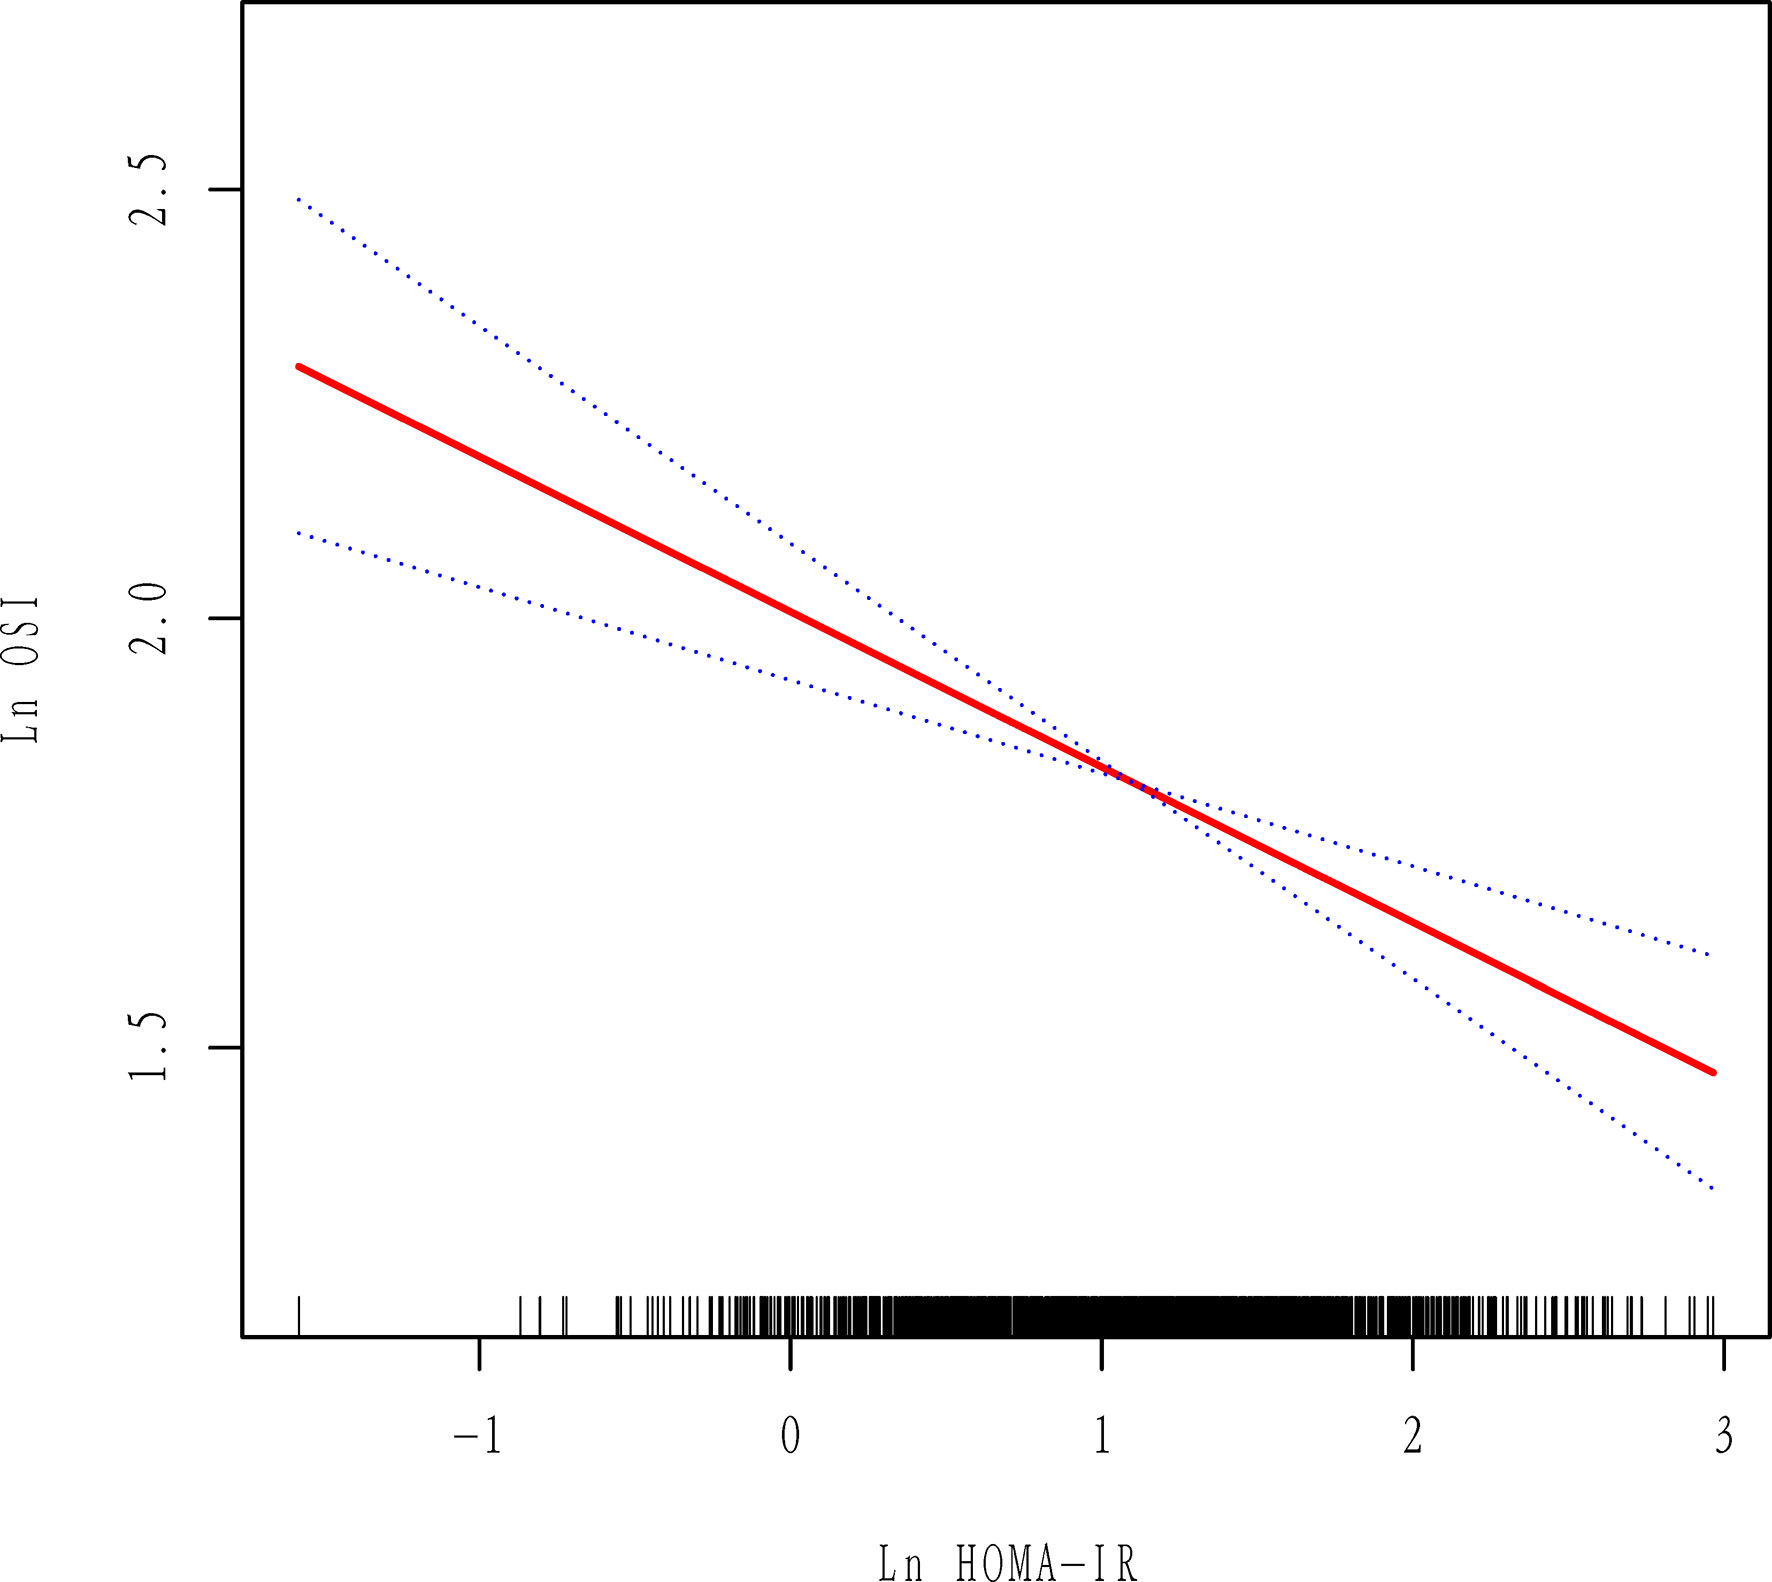
Figure 2 Association between Ln HOMA-IR and Ln OSI. All adjusted for age, BMI, AMH, AFC, initial Gn dose, basal FSH and COS protocol. Red line represents the smooth curve fit between variables and the blue dotted curves represents the 95% of confidence interval.
As displayed in Table 2, univariable linear regression analysis showed that, the level of Ln HOMA-IR was negatively associated with Ln OSI values (β = -0.39, 95% CI -0.45, -0.32). After adjustment for potential confounders, the negative association between Ln HOMA-IR and Ln OSI was still found, as shown in model 1 (β = -0.14, 95% CI -0.21, -0.07) and model 2 (β = -0.18, 95% CI -0.25, -0.11) by multivariable linear regression analysis. As sensitivity analysis, HOMA-IR was then divided into tertiles and treated as a categorical variable, with the lowest tertile used as the reference. A graded negative association was discovered across the groups (P for trend < 0.001). Compared with participants who had HOMA-IR in T1 (HOMA-IR < 2.32), those with HOMA-IR in T2 (HOMA-IR 2.32 - 3.87) and T3 (HOMA-IR > 3.87) had lower Ln OSI (β = -0.25, 95% CI -0.34, -0.15 and β = -0.57, 95% CI -0.67, -0.48, respectively). After adjusting for the potential confounders, the Ln OSI remained consistently lower in T3 compared with T1 in model 1 (β = -0.21, 95% CI -0.31, -0.10). In model 2, the Ln OSI remained significantly lower in T2 and T3 groups when compared with T1 group (β = -0.10, 95% CI -0.19, -0.00 and β = -0.25, 95% CI -0.36, -0.15, respectively).
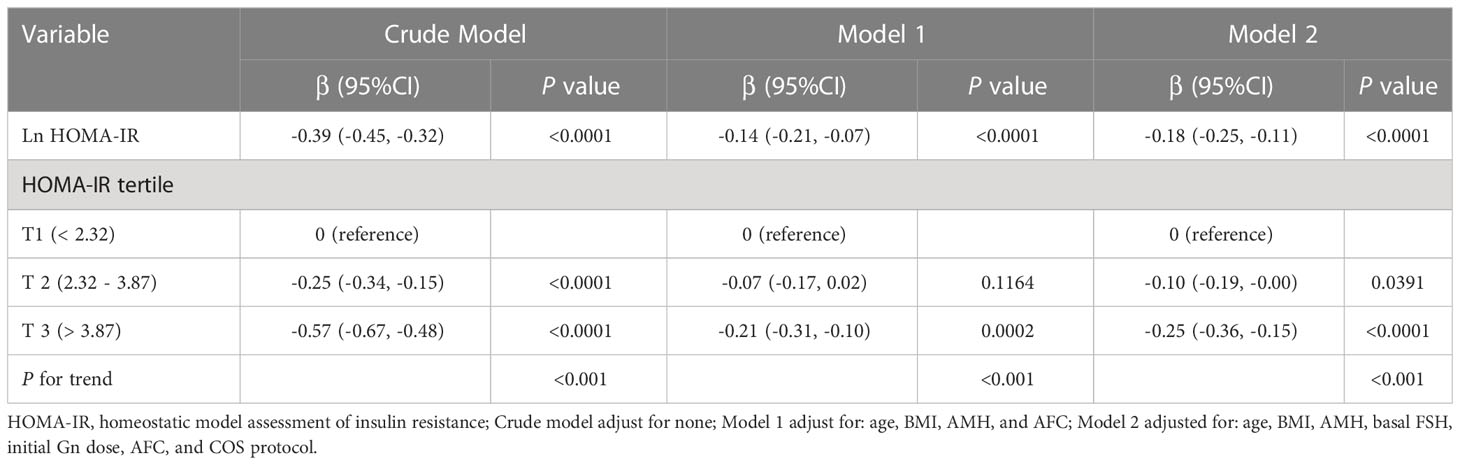
Table 2 Multivariate linear regression for association of Ln HOMA-IR with Ln OSI.
Subgroup analysis and effect modification
As presented in Table 3, subgroup analysis was performed to explore whether the other variables, including age, BMI, stratification of AMH, initial Gn dose and COH protocol, might influence the association between HOMA-IR and OSI. The subgroups of age, AMH and BMI were stratified according to the clinical cutoff point. The subgroup analysis revealed the inverse association between Ln HOMA-IR and Ln OSI was consistent and significant in the following subgroups: BMI, AMH and initial Gn dose. None of the abovementioned variables significantly modified the association between HOMA-IR and OSI (P for interaction > 0.05 for all covariates). In the subgroups of patients with age ≥ 35 y and using GnRH antagonist protocol, the inverse associations of Ln HOMA-IR with Ln OSI was not statistically significant although the regression coefficient (β) was negative.

Table 3 Subgroup analysis of the association between Ln HOMA-IR and Ln OSI.
Discussion
In this study, we explored the association of HOMA-IR with OSI in a relatively large cohort of women with PCOS. Few studies have been performed on the association between HOMA-IR and OSI. To our knowledge, only one research depicted a decreased OSI in 131 IR-PCOS women compared with 52 non-IR PCOS subjects (11). However, the sample size was small and the effect size of IR on OSI was unclear. The findings of this study showed that HOMA-IR inversely and consistently correlated with OSI in PCOS patients undergoing ART after adjusting for potential confounders. The present study indicated that IR may be associated with reduced ovarian sensitivity to exogenous Gn during COS.
PCOS has been suggested to possess heterogeneous subpopulations, including lean PCOS, overweight/obese PCOS and PCOS women with serum AMH > 5 ng/ml (25, 26). A high level of AMH (> 5 ng/ml) has been reported to be correlated with ovarian hyper-response (27, 28). Interestingly, our results indicated that the negative association of HOMA-IR with OSI remained consistent in BMI and AMH subgroups, suggesting the inverse association between HOMA-IR and OSI was independent. Thus, we assumed that the negative association between HOMA-IR and OSI may be intrinsic to PCOS, which should be managed early on.
Mechanisms underlying decreased ovarian sensitivity in PCOS women with IR have not yet been determined. Johnstone et al. proposed a role for insulin in suppressing growth of 5-10mm follicles in the follicular phase which may contribute to anovulation in PCOS (17). Women with PCOS exhibited diminished initial E2 responses to FSH compared with controls (29). Evidence from IR mouse models indicated that maternal IR contributed oxidative stress and defective mitochondrial function in germinal vesicle (GV) and metaphase II (MII) oocytes, which potentially impaired oocyte quality (30). Although it is thought that genetic variations of FSH receptors influence the degree of ovarian response to stimulation (31). However, studies performed on this subject showed contradictory results. A difference in response for specific FSH receptor subtypes may be very small, and not likely to be the basis for the wide variation in the number of oocytes retrieved in response to COS (32, 33). In light of these observations, IR may be linked to ovarian dysfunction in PCOS.
IR plays a key role in the multisystem pathophysiology of PCOS. The reported prevalence of IR in women with PCOS has ranged from about 12% to over 60% due to the use of different cutoffs, different tests, and different populations (34). HOMA-IR is a measurement frequently used in clinical studies, but no established cutoffs exist (34, 35). Researchers have used different methods to describe cutoff values such as the 66th percentile, the top quartile, and the 90th or 95th percentile (35–37). Till now, IR have been reported to occur at HOMA-IR levels that range from 2.1 to 3.8 (36, 38–40). Many studies also selected HOMA-IR of 2.5 as an indicator of IR based on the original study by Matthews et al. (24). In our study, similar to the measurements of IR abovementioned, our results indicated that PCOS women who had HOMA-IR values of tertile 2 (2.32 - 3.87) and tertile 3 (> 3.87) had significant decreases in OSI values. Besides, the negative association between HOMA-IR and OSI remained consistent in multivariable linear regression analysis, which suggested IR may be associated with decreased ovarian sensitivity.
ART for PCOS patients is always challenging due to the exaggerated or suboptimal ovarian response to Gn. The current results indicated that PCOS women with high HOMA-IR values entailed an extended stimulation phase and a higher number of Gn ampules, which could lead to a decreased OSI. OSI is a better representation of ovarian response rather than the number of oocytes retrieved and the total Gn dose (41). Moreover, the subgroup analysis showed the negative association of HOMA-IR with OSI remained consistent in stratification of initial Gn dose. A low-dose Gn stimulation strategy for PCOS patients was recommended (16). As previously reported, it was suggested that a low starting Gn dose of < 150 IU/day and 25-IU incremental doses every third day should be considered in a COS protocol for PCOS patients with a high HOMA-IR score (42). It is necessary to decide on both the initial Gn dose and the incremental dose when a low-dose step-up regimen is used. The initial Gn dose was usually calculated depending on age, BMI and ovarian reserve. In this regard, by taking into account these parameters as well as HOMA-IR score, and hence adjusting the starting and incremental Gn dose appropriately, the value of OSI may be increased and the ART outcome may be improved.
In addition, we found the early miscarriage rate was significantly increased in the group of patients with high HOMA-IR values. No significant differences were obtained in implantation rate, clinical pregnancy rate and late miscarriage rate. The findings were in line with the previous studies, which indicated the adverse effect of IR on reproduction (43, 44).
Some limitations existed in our study. First, it was not designed as a prospective study. Chinese ethnicity of our participants may limit generalization of the findings to different ethnic groups. Patient diagnosis, age, and COS protocols may vary from study to study. Moreover, the sample size in PCOS subgroups with age > 35y and using GnRH antagonist protocol was small. As reported, it is advantageous to consider ART outcomes from all cycles in order to draw clinically relevant inferences and to maximize study power (45). In this study, we restricted analysis to the first cycle because of the concern for potential bias, such as weight loss or anti-hyperinsulinemia medications.
Conclusion
In conclusion, this study, carried out in a cohort of PCOS women undergoing ART, demonstrated that HOMA-IR value was negatively associated with OSI. By taking into account the insulin resistant status, it may help clinicians for individualized ovarian stimulation in PCOS patients. Future research will be needed to validate our results and investigate the mechanistic links between IR and ovarian sensitivity.
Data availability statement
The original contributions presented in the study are included in the article/Supplementary Material, further inquiries can be directed to the corresponding author.
Ethics statement
The study was approved by the Ethics Committee of the Henan Provincial People’s Hospital (No. 2022139). The study was conducted in accordance with the Helsinki Declaration and patients’ records were anonymized prior to analysis. The need for individual consent was waived by the committee due to the retrospective character of the study.
Author contributions
YL and YW conceived the study. HL critically reviewed the study and helped to draft the manuscript; YL wrote the manuscript. SZ and CZ participated in its design and coordination. All authors contributed to the article and approved the submitted version.
Funding
This research was funded by the Science and Technology Program Beneficial to People of Zhengzhou (2021KJHM0021).
Acknowledgments
The authors thank all the patients who participated in this study.
Conflict of interest
The authors declare that the research was conducted in the absence of any commercial or financial relationships that could be construed as a potential conflict of interest.
Publisher’s note
All claims expressed in this article are solely those of the authors and do not necessarily represent those of their affiliated organizations, or those of the publisher, the editors and the reviewers. Any product that may be evaluated in this article, or claim that may be made by its manufacturer, is not guaranteed or endorsed by the publisher.
Supplementary material
The Supplementary Material for this article can be found online at: https://www.frontiersin.org/articles/10.3389/fendo.2023.1117996/full#supplementary-material
Supplementary Figure 1 | The clinical outcomes of patients with different HOMA-IR values. *P < 0.05).
References
1. March WA, Moore VM, Willson KJ, Phillips DI, Norman RJ, Davies MJ. The prevalence of polycystic ovary syndrome in a community sample assessed under contrasting diagnostic criteria. Hum Reprod (2010) 25(2):544–51. doi: 10.1093/humrep/dep399
2. Boyle JA, Cunningham J, O'Dea K, Dunbar T, Norman RJ. Prevalence of polycystic ovary syndrome in a sample of indigenous women in darwin, australia. Med J Aust (2012) 196(1):62–6. doi: 10.5694/mja11.10553
3. Yildiz BO, Bozdag G, Yapici Z, Esinler I, Yarali H. Prevalence, phenotype and cardiometabolic risk of polycystic ovary syndrome under different diagnostic criteria. Hum Reprod (2012) 27(10):3067–73. doi: 10.1093/humrep/des232
4. Azziz R. Introduction: determinants of polycystic ovary syndrome. Fertil Steril (2016) 106(1):4–5. doi: 10.1016/j.fertnstert.2016.05.009
5. Temur M, Yilmaz O, Aksun S, Calan M, Ozun OP, Kumbasar S, et al. The relationship of urocortin-2 with insulin resistance patients having pcos. Gynecol Endocrinol (2017) 33(2):124–7. doi: 10.1080/09513590.2016.1240772
6. Liu J, Wu Q, Hao Y, Jiao M, Wang X, Jiang S, et al. Measuring the global disease burden of polycystic ovary syndrome in 194 countries: global burden of disease study 2017. Hum Reprod (2021) 36(4):1108–19. doi: 10.1093/humrep/deaa371
7. Tosi F, Bonora E, Moghetti P. Insulin resistance in a large cohort of women with polycystic ovary syndrome: a comparison between euglycaemic-hyperinsulinaemic clamp and surrogate indexes. Hum Reprod (2017) 32(12):2515–21. doi: 10.1093/humrep/dex308
8. Sahmay S, Aydogan MB, Sofiyeva N, Atakul N, Azemi A, Erel T. Serum amh levels and insulin resistance in women with pcos. Eur J Obstet Gynecol Reprod Biol (2018) 224:159–64. doi: 10.1016/j.ejogrb.2018.03.007
9. Kollmann M, Martins WP, Lima ML, Craciunas L, Nastri CO, Richardson A, et al. Strategies for improving outcome of assisted reproduction in women with polycystic ovary syndrome: systematic review and meta-analysis. Ultrasound Obstet Gynecol (2016) 48(6):709–18. doi: 10.1002/uog.15898
10. Cela V, Obino M, Alberga Y, Pinelli S, Sergiampietri C, Casarosa E, et al. Ovarian response to controlled ovarian stimulation in women with different polycystic ovary syndrome phenotypes. Gynecol Endocrinol (2018) 34(6):518–23. doi: 10.1080/09513590.2017.1412429
11. Zheng Y, Pan Y, Li P, Wang Z, Wang Z, Shi Y. Ovarian sensitivity decreased significantly in patients with insulin resistance undergoing in vitro fertilization and embryo transfer. Front Physiol (2021) 12:809419. doi: 10.3389/fphys.2021.809419
12. Huber M, Hadziosmanovic N, Berglund L, Holte J. Using the ovarian sensitivity index to define poor, normal, and high response after controlled ovarian hyperstimulation in the long gonadotropin-releasing hormone-agonist protocol: suggestions for a new principle to solve an old problem. Fertil Steril (2013) 100(5):1270–6. doi: 10.1016/j.fertnstert.2013.06.049
13. Revelli A, Gennarelli G, Biasoni V, Chiado A, Carosso A, Evangelista F, et al. The ovarian sensitivity index (osi) significantly correlates with ovarian reserve biomarkers, is more predictive of clinical pregnancy than the total number of oocytes, and is consistent in consecutive ivf cycles. J Clin Med (2020) 9(6). doi: 10.3390/jcm9061914
14. Weghofer A, Barad DH, Darmon SK, Kushnir VA, Albertini DF, Gleicher N. The ovarian sensitivity index is predictive of live birth chances after ivf in infertile patients. Hum Reprod Open (2020) 2020(4):a49. doi: 10.1093/hropen/hoaa049
15. Delvigne A, Rozenberg S. Epidemiology and prevention of ovarian hyperstimulation syndrome (ohss): A review. Hum Reprod Update (2002) 8(6):559–77. doi: 10.1093/humupd/8.6.559
16. Fischer D, Reisenbuchler C, Rosner S, Haussmann J, Wimberger P, Goeckenjan M. Avoiding ohss: controlled ovarian low-dose stimulation in women with pcos. Geburtshilfe Frauenheilkd (2016) 76(6):718–26. doi: 10.1055/s-0042-100206
17. Johnstone EB, Addauan-Andersen C, Trevithick D, Sternfeld B, Rosen MP, Cedars M. Increased bmi and fasting insulin are associated with decreased numbers of large antral follicles. Ferti Steril (2009) 92(3-supp-S):S103. doi: 10.1016/j.fertnstert.2009.07.1067
18. Franks S, Stark J, Hardy K. Follicle dynamics and anovulation in polycystic ovary syndrome. Hum Reprod Update (2008) 14(4):367–78. doi: 10.1093/humupd/dmn015
19. Macut D, Bjekic-Macut J, Rahelic D, Doknic M. Insulin and the polycystic ovary syndrome. Diabetes Res Clin Pract (2017) 130:163–70. doi: 10.1016/j.diabres.2017.06.011
20. Vlaisavljevic V, Kovac V, Sajko MC. Impact of insulin resistance on the developmental potential of immature oocytes retrieved from human chorionic gonadotropin-primed women with polycystic ovary syndrome undergoing in vitro maturation. Fertil Steril (2009) 91(3):957–9. doi: 10.1016/j.fertnstert.2007.12.062
21. The Rotterdam ESHRE/ASRM-sponsored PCOS consensus workshop group. Revised 2003 consensus on diagnostic criteria and long-term health risks related to polycystic ovary syndrome. Fertil Steril (2004) 81(1):19–25. doi: 10.1016/j.fertnstert.2003.10.004
22. Zhou BF. Predictive values of body mass index and waist circumference for risk factors of certain related diseases in chinese adults–study on optimal cut-off points of body mass index and waist circumference in chinese adults. Biomed Environ Sci (2002) 15(1):83–96. doi: CNKI:SUN:SWYX.0.2002-01-010
23. Zeng Q, Li N, Pan XF, Chen L, Pan A. Clinical management and treatment of obesity in china. Lancet Diabetes Endocrinol (2021) 9(6):393–405. doi: 10.1016/S2213-8587(21)00047-4
24. Matthews DR, Hosker JP, Rudenski AS, Naylor BA, Treacher DF, Turner RC. Homeostasis model assessment: insulin resistance and beta-cell function from fasting plasma glucose and insulin concentrations in man. Diabetologia (1985) 28(7):412–9. doi: 10.1007/BF00280883
25. Vigil P, Contreras P, Alvarado JL, Godoy A, Salgado AM, Cortes ME. Evidence of subpopulations with different levels of insulin resistance in women with polycystic ovary syndrome. Hum Reprod (2007) 22(11):2974–80. doi: 10.1093/humrep/dem302
26. Toosy S, Sodi R, Pappachan JM. Lean polycystic ovary syndrome (pcos): an evidence-based practical approach. J Diabetes Metab Disord (2018) 17(2):277–85. doi: 10.1007/s40200-018-0371-5
27. Nakhuda GS, Chu MC, Wang JG, Sauer MV, Lobo RA. Elevated serum mullerian-inhibiting substance may be a marker for ovarian hyperstimulation syndrome in normal women undergoing in vitro fertilization. Fertil Steril (2006) 85(5):1541–3. doi: 10.1016/j.fertnstert.2005.10.052
28. Ran Y, Yi Q, Li C. The relationship of anti-mullerian hormone in polycystic ovary syndrome patients with different subgroups. Diabetes Metab Syndr Obes (2021) 14:1419–24. doi: 10.2147/DMSO.S299558
29. Harrison T, Chang RJ. Ovarian response to follicle-stimulating hormone in women with polycystic ovary syndrome is diminished compared to ovulatory controls. Clin Endocrinol (Oxf) (2022) 97(3):310–8. doi: 10.1111/cen.14708
30. Ou XH, Li S, Wang ZB, Li M, Quan S, Xing F, et al. Maternal insulin resistance causes oxidative stress and mitochondrial dysfunction in mouse oocytes. Hum Reprod (2012) 27(7):2130–45. doi: 10.1093/humrep/des137
31. Perez MM, Gromoll J, Behre HM, Gassner C, Nieschlag E, Simoni M. Ovarian response to follicle-stimulating hormone (fsh) stimulation depends on the fsh receptor genotype. J Clin Endocrinol Metab (2000) 85(9):3365–9. doi: 10.1210/jcem.85.9.6789
32. Simoni M, Casarini L. Mechanisms in endocrinology: Genetics of fsh action: a 2014-and-beyond view. Eur J Endocrinol (2014) 170(3):R91–R107. doi: 10.1530/EJE-13-0624
33. Oudshoorn SC, van Tilborg TC, Hamdine O, Torrance HL, Eijkemans M, Lentjes E, et al. Ovarian response to controlled ovarian hyperstimulation: What does serum fsh say? Hum Reprod (2017) 32(8):1701–9. doi: 10.1093/humrep/dex222
34. Greenwood EA, Huddleston HG. Insulin resistance in polycystic ovary syndrome: concept versus cutoff. Fertil Steril (2019) 112(5):827–8. doi: 10.1016/j.fertnstert.2019.08.100
35. Kim JJ, Hwang KR, Oh SH, Chae SJ, Yoon SH, Choi YM. Prevalence of insulin resistance in korean women with polycystic ovary syndrome according to various homeostasis model assessment for insulin resistance cutoff values. Fertil Steril (2019) 112(5):959–66. doi: 10.1016/j.fertnstert.2019.06.035
36. Sumner AE, Cowie CC. Ethnic differences in the ability of triglyceride levels to identify insulin resistance. Atherosclerosis (2008) 196(2):696–703. doi: 10.1016/j.atherosclerosis.2006.12.018
37. Timoteo AT, Miranda F, Carmo MM, Ferreira RC. Optimal cut-off value for homeostasis model assessment (homa) index of insulin-resistance in a population of patients admitted electively in a portuguese cardiology ward. Acta Med Port (2014) 27(4):473–9. doi: 10.20344/amp.5180
38. Monzillo LU, Hamdy O. Evaluation of insulin sensitivity in clinical practice and in research settings. Nutr Rev (2003) 61(12):397–412. doi: 10.1301/nr.2003.dec.397-412
39. Radikova Z, Koska J, Huckova M, Ksinantova L, Imrich R, Vigas M, et al. Insulin sensitivity indices: a proposal of cut-off points for simple identification of insulin-resistant subjects. Exp Clin Endocrinol Diabetes (2006) 114(5):249–56. doi: 10.1055/s-2006-924233
40. Gayoso-Diz P, Otero-Gonzalez A, Rodriguez-Alvarez MX, Gude F, Garcia F, De Francisco A, et al. Insulin resistance (homa-ir) cut-off values and the metabolic syndrome in a general adult population: effect of gender and age: Epirce cross-sectional study. BMC Endocr Disord (2013) 13:47. doi: 10.1186/1472-6823-13-47
41. Li HW, Lee VC, Ho PC, Ng EH. Ovarian sensitivity index is a better measure of ovarian responsiveness to gonadotrophin stimulation than the number of oocytes during in-vitro fertilization treatment. J Assist Reprod Genet (2014) 31(2):199–203. doi: 10.1007/s10815-013-0144-5
42. Yildizhan R, Adali E, Kolusari A, Kurdoglu M, Yildizhan B, Sahin HG, et al. Ovarian stimulation in obese and non-obese polycystic ovary syndrome using a low-dose step-up regimen with two different starting doses of recombinant follicle-stimulating hormone. J Int Med Res (2008) 36(6):1197–204. doi: 10.1177/147323000803600605
43. Sun YF, Zhang J, Xu YM, Cao ZY, Wang YZ, Hao GM, et al. High bmi and insulin resistance are risk factors for spontaneous abortion in patients with polycystic ovary syndrome undergoing assisted reproductive treatment: a systematic review and meta-analysis. Front Endocrinol (Lausanne) (2020) 11:592495. doi: 10.3389/fendo.2020.592495
44. Chen Y, Guo J, Zhang Q, Zhang C. Insulin resistance is a risk factor for early miscarriage and macrosomia in patients with polycystic ovary syndrome from the first embryo transfer cycle: a retrospective cohort study. Front Endocrinol (Lausanne) (2022) 13:853473. doi: 10.3389/fendo.2022.853473
Keywords: insulin resistance, ovarian sensitivity, OSI, HOMA-IR, ART
Citation: Li Y, Wang Y, Liu H, Zhang S and Zhang C (2023) Association between HOMA-IR and ovarian sensitivity index in women with PCOS undergoing ART: A retrospective cohort study. Front. Endocrinol. 14:1117996. doi: 10.3389/fendo.2023.1117996
Received: 08 December 2022; Accepted: 24 February 2023;
Published: 09 March 2023.
Edited by:
Katja Teerds, Wageningen University and Research, NetherlandsReviewed by:
Yuhua Shi, Guangdong Provincial People’s Hospital, ChinaBei Shi, China Medical University, China
Copyright © 2023 Li, Wang, Liu, Zhang and Zhang. This is an open-access article distributed under the terms of the Creative Commons Attribution License (CC BY). The use, distribution or reproduction in other forums is permitted, provided the original author(s) and the copyright owner(s) are credited and that the original publication in this journal is cited, in accordance with accepted academic practice. No use, distribution or reproduction is permitted which does not comply with these terms.
*Correspondence: Cuilian Zhang, eHV5aWZlbmRvdUAxNjMuY29t