 Peng Zeng
 Jia-qi Liang
 Yuan-yu Peng1†
 Jing Wang
 Peng Tian
 Mei Wang
- 1Department of Ophthalmology, Sun Yat-sen Memorial Hospital, Sun Yat-sen University, Guangzhou, China
- 2State Key Laboratory of Ophthalmology, Zhongshan Ophthalmic Center, Sun Yat-sen University, Guangzhou, China
- 3Department of Otolaryngology, Sun Yat-sen Memorial Hospital, Sun Yat-sen University, Guangzhou, China
Purpose: The aim of this study was to evaluate the vessel density (VD) of the macular choriocapillaris (CC) and retina in thyroid-associated ophthalmopathy (TAO) patients with chorioretinal folds (CRFs) with and without optic disc edema (ODE) and the correlations of these characteristics with visual function.
Method: This was a cross-sectional study. Twenty TAO patients with CRFs (35 eyes) and 20 normal subjects (normal group, 40 eyes) were recruited at the Ophthalmology Department of the Sun Yat-sen Memorial Hospital from March 2018 to October 2022. Then, CRF patients were divided into two groups, the ODE and non-ODE groups (NODE), based on the presence or absence of ODE. All the patients underwent optical coherence tomography angiography (OCTA) and the VD of the macular CC and retina was computed. The correlation of VD and visual function was analyzed.
Results: Compared with the normal group, the macular whole-image VD in the retinal superficial layer (SLR-mwiVD: 49.82 ± 3.38 in the normal group, 42.44 ± 5.40 in the NODE group, and 42.51 ± 5.37 in the ODE group), deep layer (DLR-mwiVD: 51.05 ± 6.23 in the normal group, 45.71 ± 6.66 in the NODE group, and 46.31 ± 5.48 in the ODE group), and CC (CC-mwiVD: 70.23 ± 2.47 in the normal group, 68.04 ± 3.73 in the NODE group, and 63.09 ± 6.51 in the ODE group) was decreased in the NODE (all p < 0.05) and ODE group (all p < 0.01). There was no difference in these parameters except CC-mwiVD between the ODE and NODE groups. The CC-mwiVD in the ODE group (63.09 ± 6.51) was significantly reduced compared with that in the NODE group (68.04 ± 3.73, p = 0.004). All these VD parameters were negatively correlated with BCVA, VF-PSD, and P100 latency and positively associated with VF-MD, P100 amplitude, and HRR scores (all p < 0.05).
Conclusions: There was a significant decrease in the VD of the macular CC and retina of patients with CRFs with or without ODE, which was correlated with visual dysfunction. The VD of the macular CC in CRF patients with ODE was significantly reduced compared with that in the NODE group, but similar results were not observed in the retina.
Introduction
Thyroid-associated ophthalmopathy (TAO) is an autoimmune disorder related to thyroid dysfunction that can threaten the vision in severe stages. Chorioretinal folds (CRFs), corrugations at the level of the choroid, Bruch’s membrane, retinal pigment epithelium, and the overlying neurosensory retina, have been described in a wide range of ophthalmic and systemic diseases, including age-related macular degeneration (1), posterior scleritis (2), orbital tumors (3), hypotony (4), hyperopia (5), central serous chorioretinopathy (6), and TAO (7). Previous studies have demonstrated that CRFs are often an indicator of conditions that threaten vision in patients with TAO (7–11). The mechanism underlying CRF formation in TAO is not clearly understood but is hypothesized to be related to orbital hypertension, which may place compressive stress on the choroid, Bruch’s membrane, and optic nerve; the latter results may be related to retinal and choroidal microvascular changes (1).
Optical coherence tomography angiography (OCTA), a noninvasive and quantitative technique, has been used to evaluate retinal and choroidal microvascular density (VD) in TAO patients (12–17) and has been used to diagnose and monitor the early stage of vision-threatening TAO (18–21). Our previous study on OCTA reported that the vessel density (VD) of the retinal macula and radial peripapillary capillaries (RPCs) was decreased in CRF patients compared with TAO patients without CRFs (11). However, these CRF patients were unselected in a previous study, including CRF patients with or without optic disc edema (ODE). As is known, ODE is a specific sign to diagnose dysthyroid optic neuropathy (DON) (22–24). A recent study has shown a reduction in VD of choroidal RPC in DON eyes, and this is correlated with visual field (VF) defects (18). Therefore, CRF patients with ODE should be diagnosed as DON and there is a logical reason to suggest that CRF patients with or without ODE may influence the retinal and choroidal VD changes in TAO patients. However, as far as we know, no report has described changes in the macular choroidal VD in TAO patients with CRFs with or without ODE. Therefore, OCTA was implemented to detect the changes in the VD of macular retina and choriocapillaris (CC) in TAO patients with CRFs with and without ODE and to analyze the relationship between these changes and visual function parameters in this study.
Patients and methods
The cross-sectional study was conducted at Sun Yat-sen Memorial Hospital, Sun Yat-sen University, from March 2018 to October 2022. This study was conducted in accordance with the tenets of the Declaration of Helsinki, and the protocol of this study was approved by the Sun Yat-sen University Sun Yat-sen Memorial Hospital Ethical Committee in the People’s Republic of China.
Twenty TAO patients with CRFs were diagnosed in the Department of Endocrinology and Ophthalmology at Sun Yat-sen Memorial Hospital, Sun Yat-sen University based on the European Group on Graves’ Orbitopathy (EUGOGO) criteria (22, 25). Twenty normal subjects (40 eyes) were enrolled as controls in this study. The inclusion criteria of CRF patients were as follows: (1) age >18 years; (2) refractive errors with spherical equivalent (SE) < −6 diopters; (3) clear refracting media; and (4) no history of treatment with large-dose systemic glucocorticoids, immunosuppressive agents, or ocular radiation therapy. The exclusion criteria were as follows: (1) any other systemic diseases except TAO, such as diabetes and systemic hypertension; and (2) any history of ocular diseases, prior ophthalmic surgery, or trauma.
The clinical data included age; sex; thyroid function, including free triiodothyronine (FT3), free thyroxine (FT4), thyroid-stimulating hormone (TSH), and thyrotrophin receptor antibody (TRab); signs, symptoms, and duration of TAO; history and duration of thyroid disease; and the presence of other systemic and eye diseases. Ophthalmic examinations included best-corrected visual acuity (BCVA) measured with a standardized logMAR visual acuity chart, slit lamp examination of the anterior segment, and fundus examination. Proptosis was measured with a Hertel exophthalmometer (Oculus, Germany), and intraocular pressure (IOP) measurements (Canon TX-20, YZB/JAP3501-2012, Tokyo, Japan) were obtained in the primary position. Standard automated VF and pattern visual evoked potential tests were performed using the Humphrey automated visual field analyzer (Program 30-2, Humphrey Field Analyzer II 750; Carl Zeiss Meditec, Inc., Dublin, CA, USA) and a pattern visual evoked potential analyzer (ESPION; Diagnosys LLC, Inc., Cambridge, UK), respectively. Color vision scores were tested by the Hardy-Rand-Rittler color plates (HRR, Richmond products, Inc. Albuquerque, NM, USA). Blood pressure and heart rate were measured after participants rested for at least 5 min. Mean arterial blood pressure (MABP) was computed as diastolic blood pressure (DBP) plus one-third of the patient’s pulse pressure.
OCTA images were obtained using prototype AngioVue software 2.0 of the RTVue XR Avanti spectral domain OCT device (Optovue, Inc., Fremont, CA, USA). The VD parameters of the macular retinal superficial layer (SLR), deep layer (DLR), and CC were obtained from the 6 mm × 6 mm area of scan centered on the fovea. The area of macular scanning was segmented by an annular grid into three fields: the foveal, parafoveal, and perifoveal zones. Representative partition images in the CC are shown in Figure 1. In addition, the nerve fiber thickness of the macula and optic disc were assessed using ganglion cell complex (GCC) mode and optic nerve head mode, respectively. All OCTA imaging was performed by a trained ophthalmic examiner. Low-quality OCTA images (SSI < 60 or scan quality < 6) were excluded.
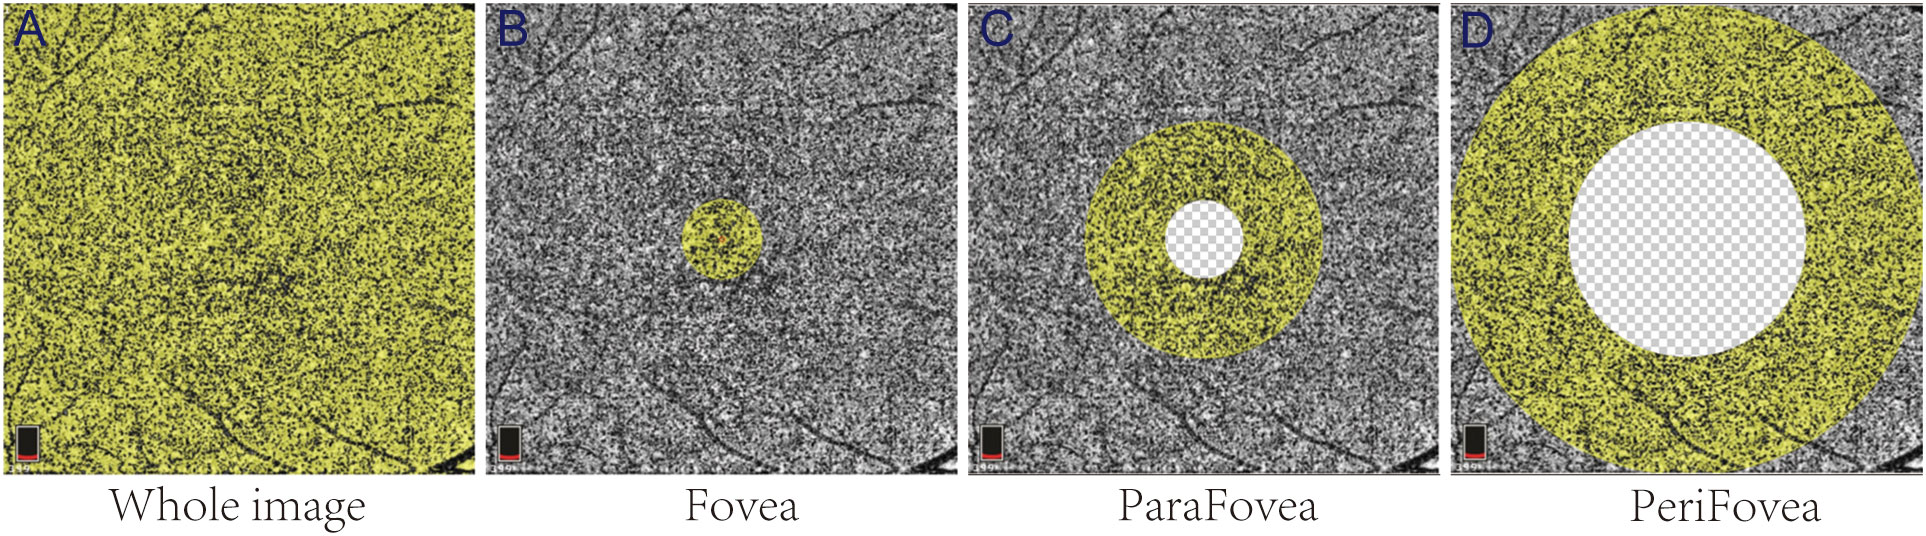
Figure 1 Representative partition images of the macular choriocapillaris. The yellow areas in (A–D) represent the whole-image, Fovea, ParaFovea, and PeriFovea regions, respectively.
Statistical analysis
Statistical analysis was performed using SPSS (Statistical Package for Social Sciences; SPSS Inc. IBM, Armonk, NY) version 26.0. The mean ± standard deviation was used for continuous variables and frequency (%) was used for classification variables. Data with a normal distribution were evaluated by independent sample t-tests, data with nonnormal distribution were evaluated by Mann–Whitney test, and categorical variables were evaluated by chi-square analysis. Clinical data were compared and each eye was included in the study as an independent sample. Considering the correlation between the eyes of individual patients, a generalized estimation equation (GEE) was used to increase the statistical power. Pearson correlation analysis was used to analyze the correlation between visual function and VD parameters. Differences were considered statistically significant at p ≤ 0.05.
Results
Demographic and clinical data
A total of 20 normal subjects (normal group) and 20 CRF patients (CRF group) were enrolled in the study, and their clinical data are listed in Table 1. More than two-thirds in CRF patients were male (17 patients, 85%), smoked (14 patients, 70%), and had onset in both eyes (15 patients, 75%). The most common primary thyroid disease of CRF patients was hyperthyroidism. The durations of autoimmune thyroid diseases and TAO were 12.65 ± 7.82 and 9.40 ± 4.68 months, respectively. CRF patients had significantly higher TSH and TRab level than the normal group (all p < 0.05). There was no significant difference in age, sex, systolic blood pressure (SBP), DBP, MABP, heart rate, FT3, or FT4 between the two groups.
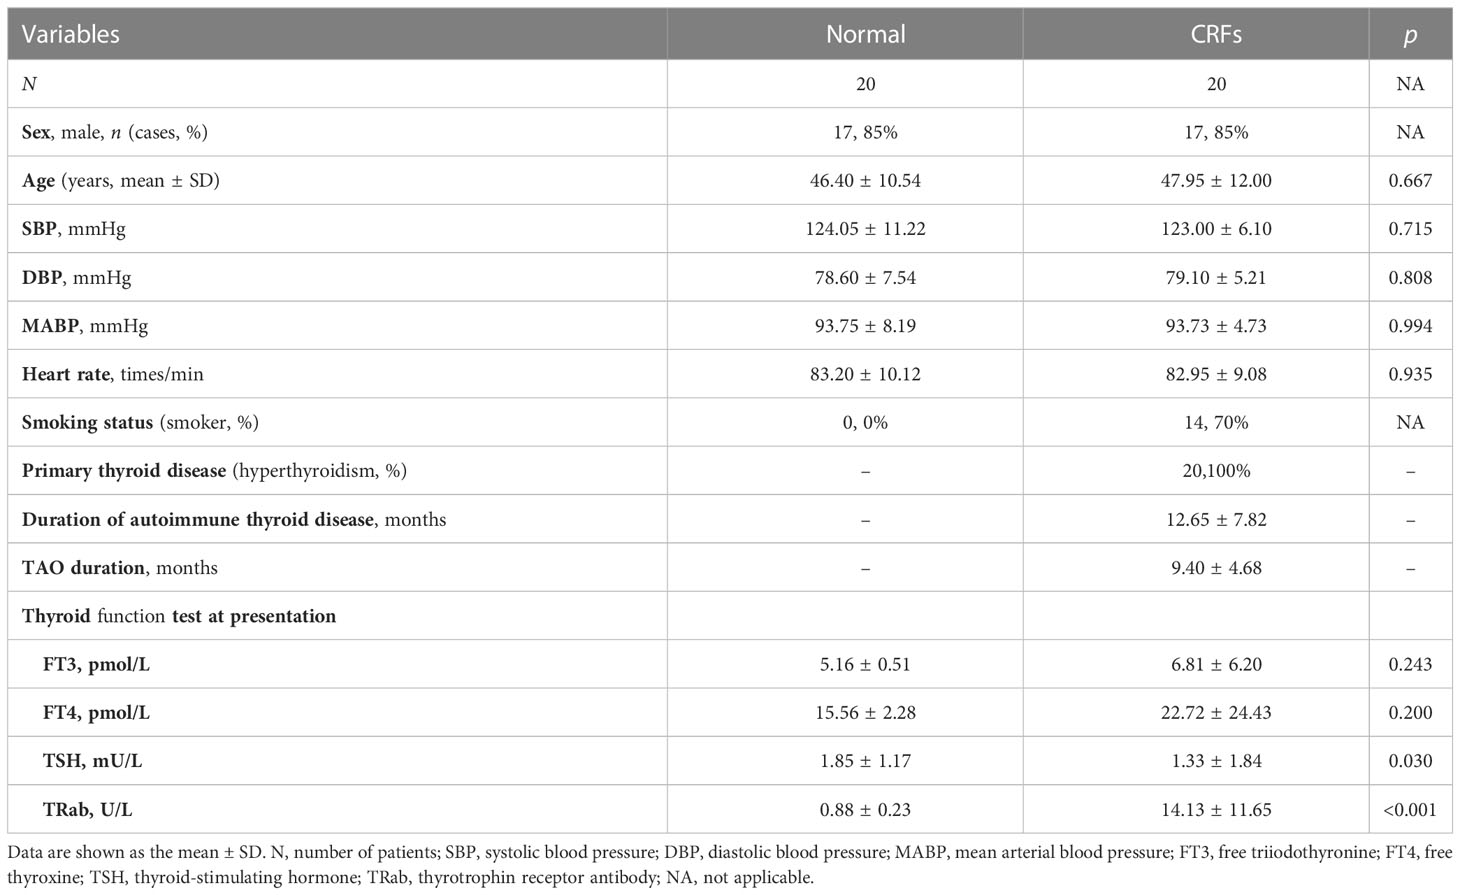
Table 1 Demographic and clinical data.
Comparisons of ophthalmic parameters
Twenty normal subjects (40 eyes) and 20 CRF patients (35 eyes) were divided into the normal group (40 eyes), CRFs with ODE group (ODE group, 18 eyes), and CRFs without ODE group (NODE group, 17 eyes), and the groups are described in Table 2. Regardless of ODE status, CRF patients had significant differences in BCVA, IOP, proptosis, VF-MD, P100 latency, P100 amplitude, and HRR scores compared with control group (all p < 0.05), and these parameters were not different between the ODE and NODE groups (all p > 0.05). The VF-PSD in the ODE group was significantly higher than that in the NODE (p = 0.037) and normal groups (p < 0.001). The thickness of the RNFL and GCCL in the ODE group was obviously thicker than that in the NODE and normal groups (all p < 0.05), and these parameters were not different between the ONDE and normal groups. There was no difference in CAS scores between the ODE and NODE groups.
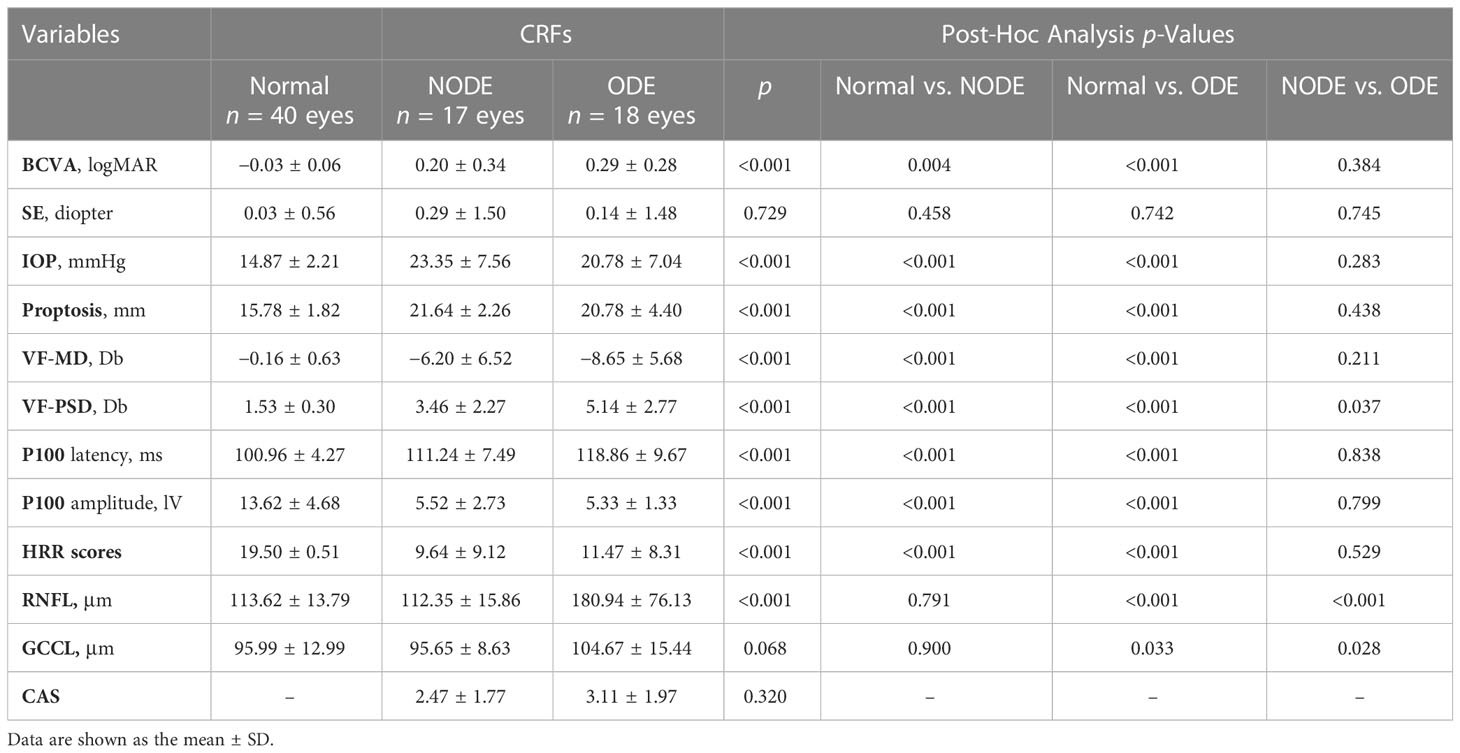
Table 2 The comparisons of ophthalmic parameters.
Comparisons of the VD in macular retina and choriocapillaris
Representative OCTA images of the three groups are shown in Figure 2. The VD parameters of the macular retina and CC in the normal, NODE, and ODE groups are shown in Table 3 and Figure 3. In the SLR, the VD of the whole image (both p < 0.001), ParaFovea (both p < 0.01), and PeriFovea (both p < 0.001) but not the Fovea (both p > 0.05) was significantly decreased in the ODE and NODE groups compared with the normal group. There was no difference in these parameters between the ODE and NODE groups (all p > 0.05). In the DLR, the whole image and PeriFovea VD were significantly decreased in the ODE (both p < 0.01) and NODE groups (both p < 0.01), compared with the normal group. There was no difference in the VD of the Fovea and ParaFovea among three groups (all p > 0.05). In the CC, compared to the normal group, the VD of the whole image (both p < 0.05), Fovea (both p < 0.01), and Perifovea (both p < 0.05) except the ParaFovea (both p > 0.05) was significantly reduced in the NODE and ODE groups, and the VD of the whole image, Fovea, and Perifovea was obviously decreased in the ODE group compared with the NODE group (all p < 0.05).
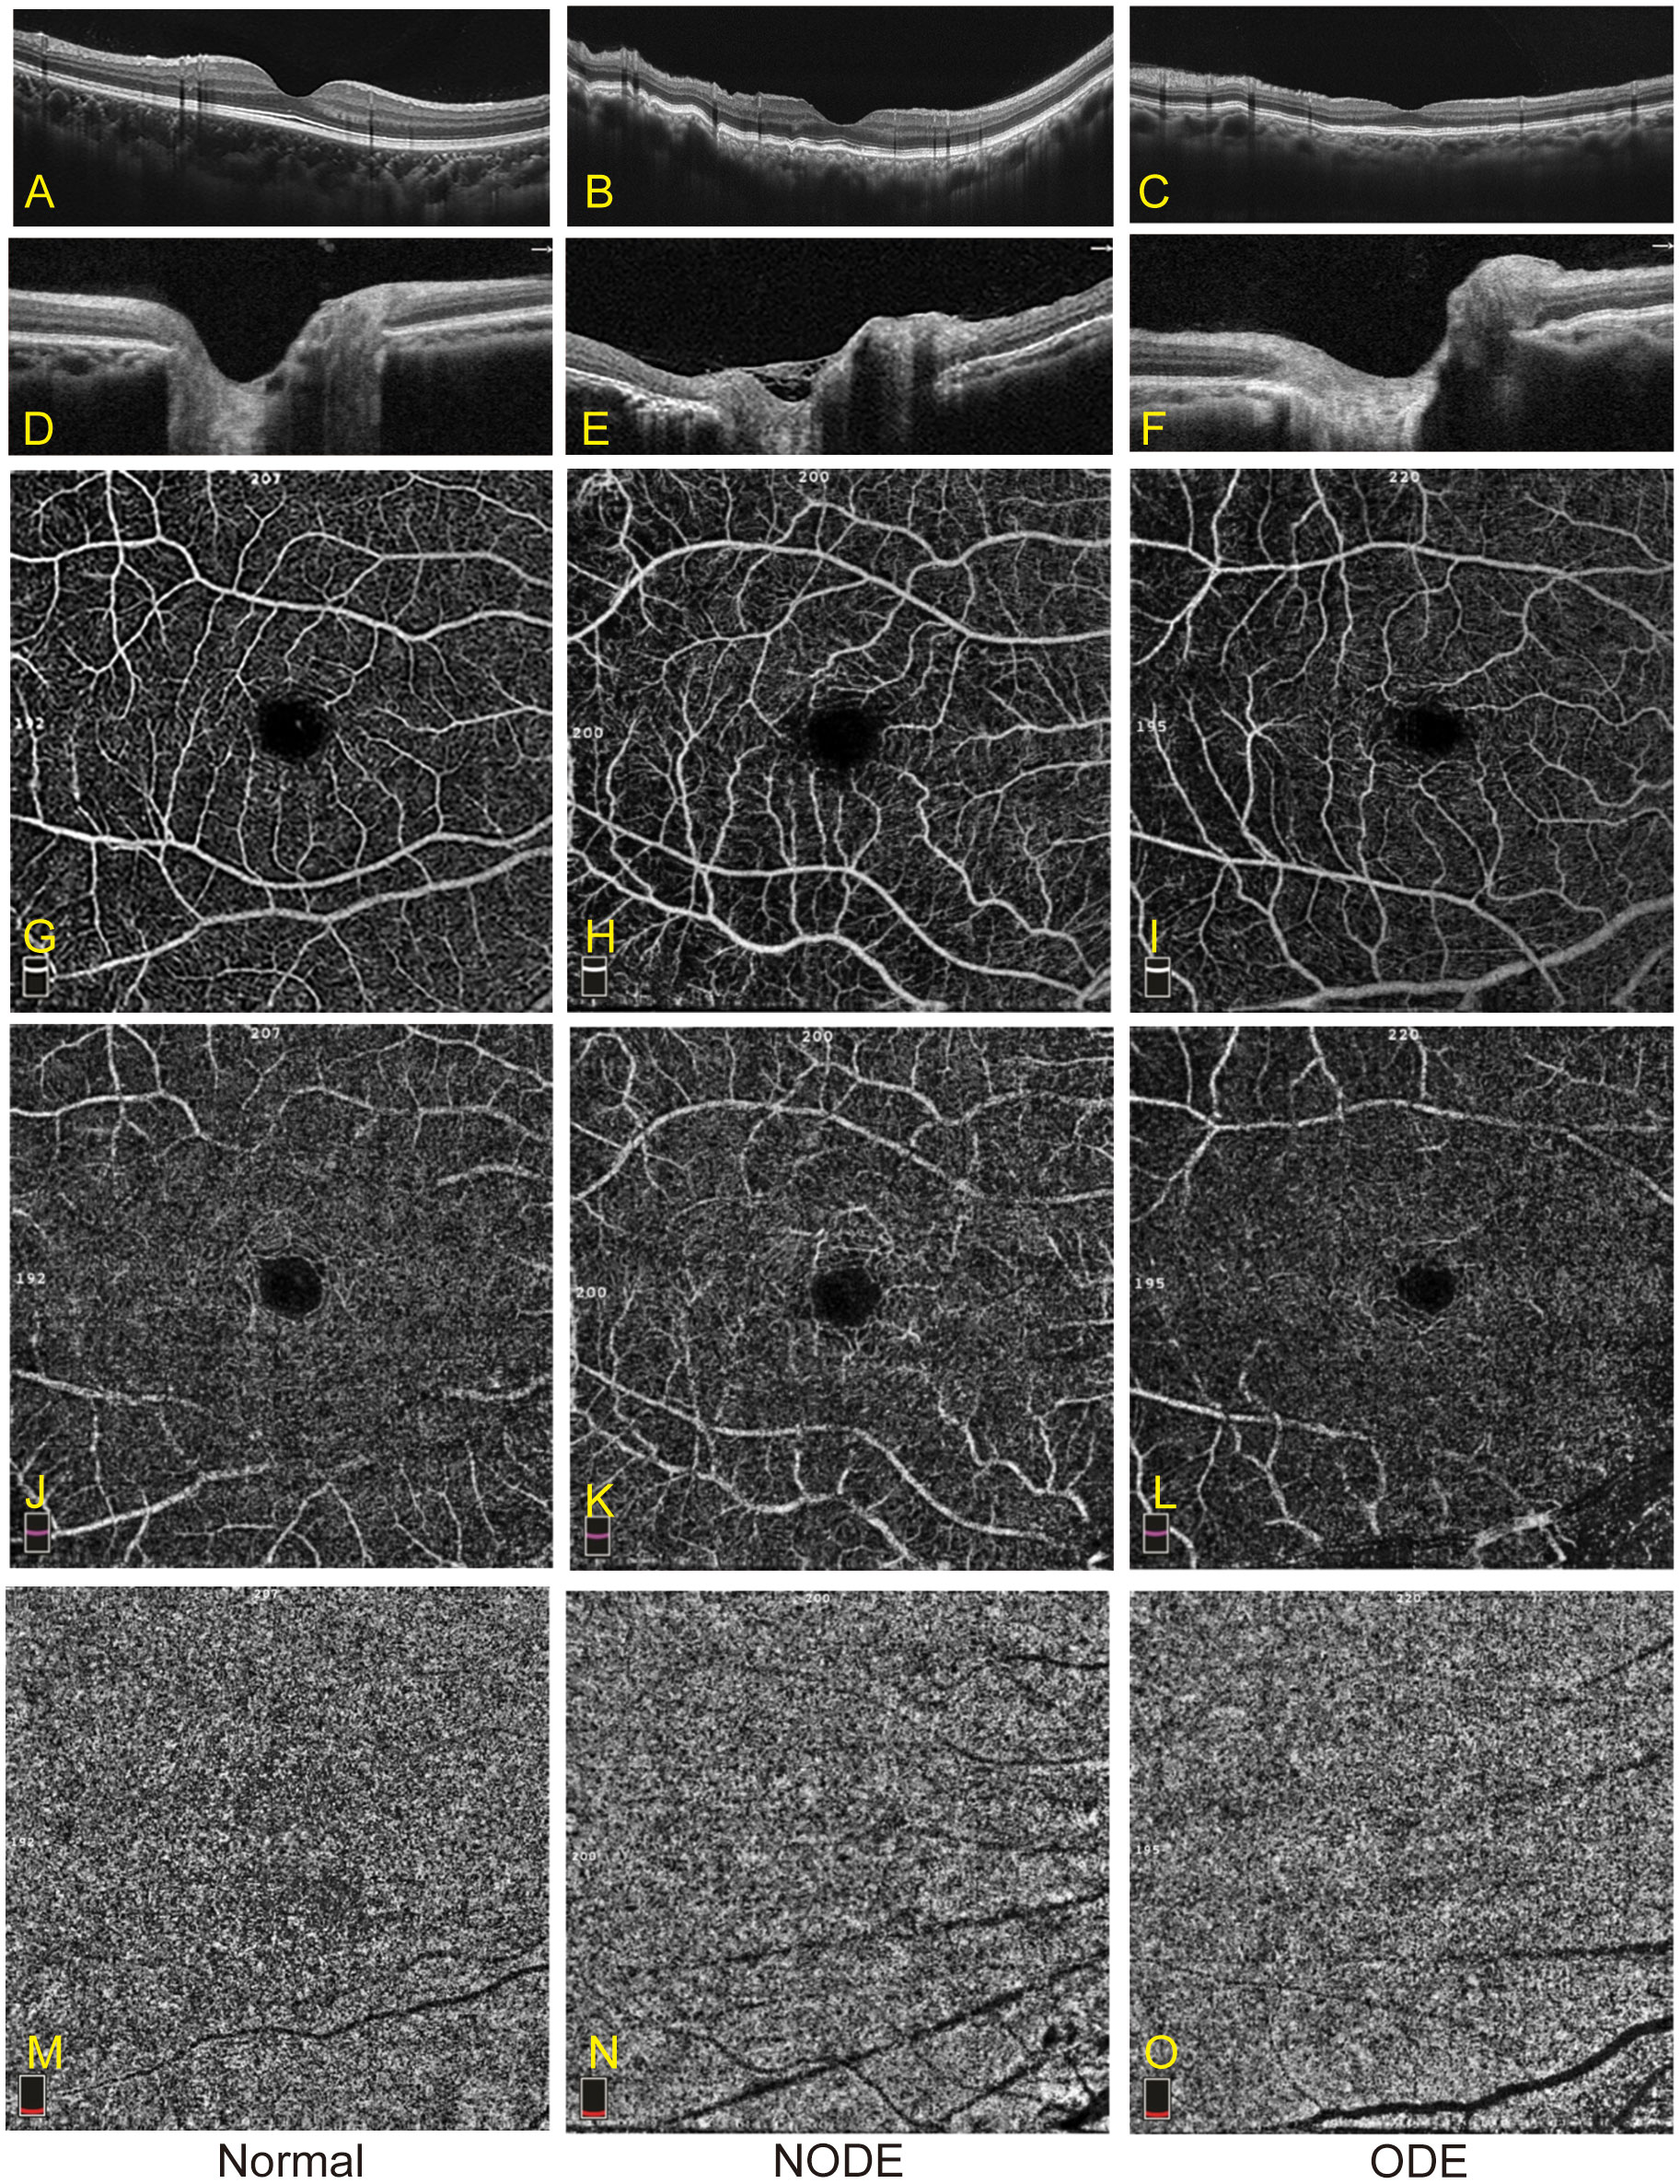
Figure 2 Representative images of OCTA in the normal, NODE, and ODE groups. (A–C) show optical coherence tomography (OCT) images of the macula in the normal, NODE, and ODE groups, respectively. The optical coherence tomography (OCT) images of the optic nerve head in the normal, NODE, and ODE groups are displayed in (D–F), respectively. Macular SLR vessel density map is displayed with the normal (G), NODE (H), and ODE (I) groups. (J–L) exhibit macular DLR vessel density map in the normal, NODE, and ODE groups, respectively. (M–O) show macular CC vessel density in the normal, NODE, and ODE groups, respectively. SLR, superficial layer; DLR, deep layer; CC, choriocapillaris.
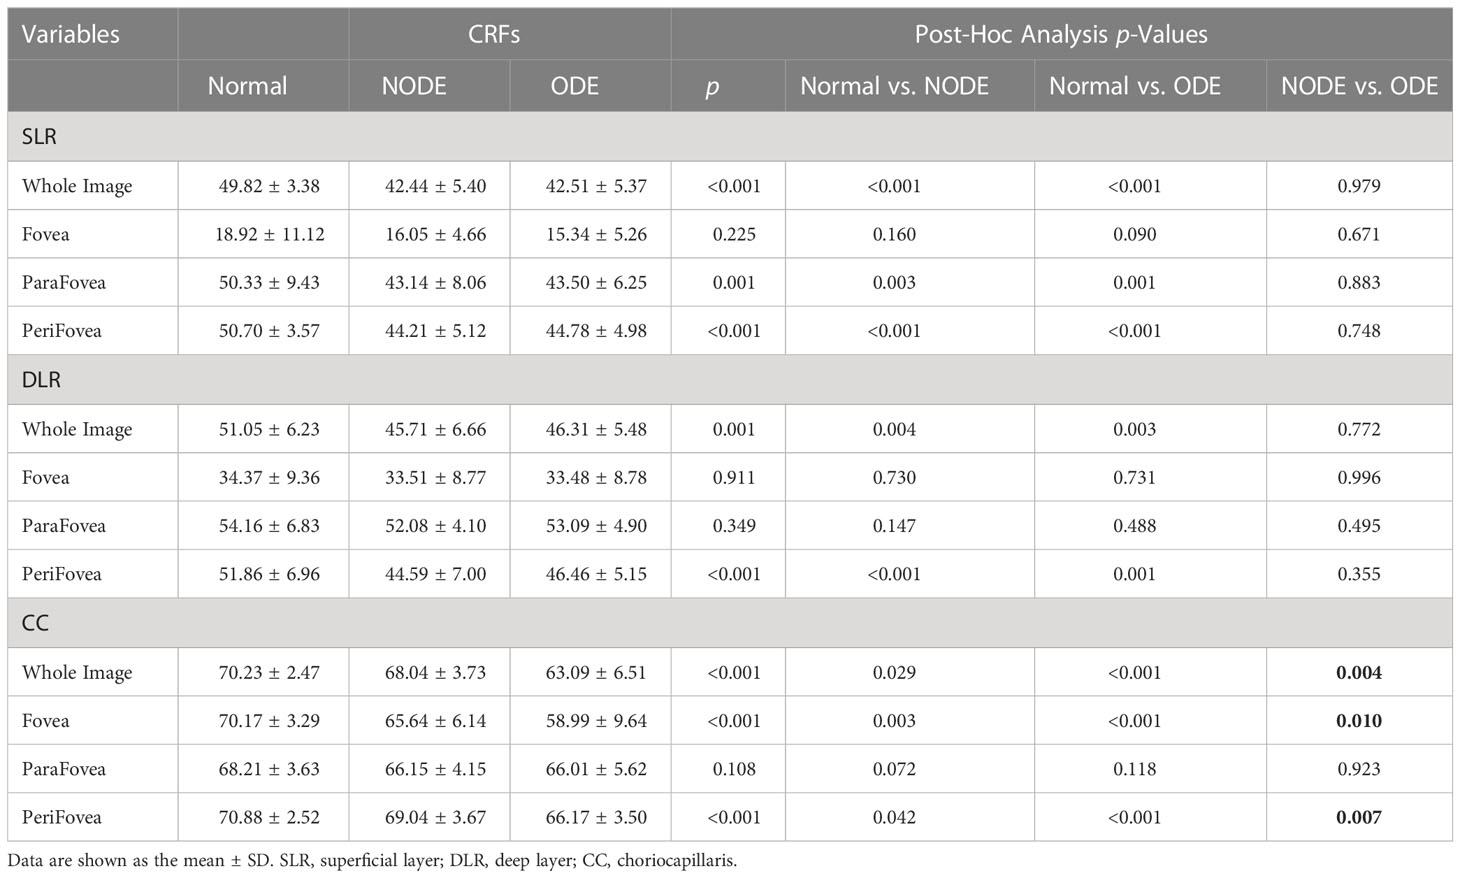
Table 3 The comparisons of macular retinal and choroidal microvascular density.

Figure 3 Macular VD of SLR, DLR and CC in different groups were listed in (A), (B) and (C) respectively. Compared with normal group, there is a significant decreased in VD of macular CC and retina in NODE and ODE group. The VD of macular CC in ODE group was significantly reduced than that of NODE group, while not in macular retina. SLR, superficial layer; DLR, deep layer; CC, choriocapillaris. (* indicates p<0.05, ** indicates p<0.01 and ***indicates p<0.001).
The correlation between vessel densities and visual functional parameters
The correlation of macular whole-image VD in the SLR (SLR-mwiVD), DLR (DLR-mwiVD), and CC (CC-mwiVD) with visual functional parameters is shown in Table 4. The BCVA, VF-PSD, and P100 latency were negatively correlated with all parameters of VD (all p < 0.01). The VF-MD, P100 amplitude, and HRR scores were positively associated with all parameters of VD (all p < 0.05)
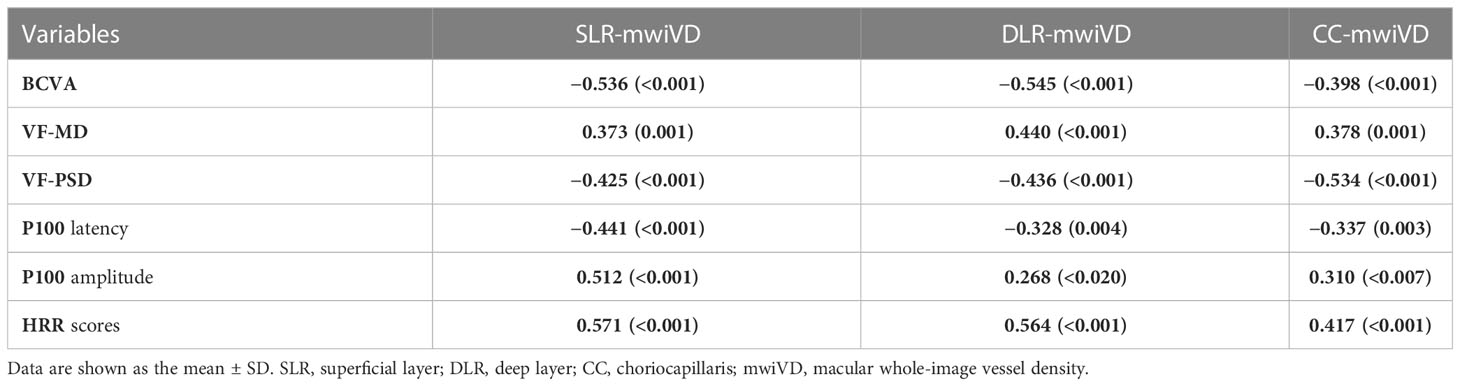
Table 4 The correlation between microvascular density and visual function parameters.
Discussion
Our study demonstrated that SLR-mwiVD, DLR-mwiVD, and CC-mwiVD were decreased in CRF patients with or without ODE compared with normal, and there was no difference in these parameters, except CC-mwiVD between the ODE and NODE groups. The CC-mwiVD in the ODE group was significantly reduced compared with that in the NODE group. All these VD parameters were negatively correlated with BCVA, VF-PSD, and P100 latency and positively associated with VF-MD, P100 amplitude, and HRR scores.
CRFs were first described in 1884 by Nettleship and associated with a wide variety of pathological conditions, such as tumors, central serous retinopathy, choroidal naevi, and papilloedema (26). CRFs have rarely been reported in TAO patients and are often considered as an indicator of conditions that threaten vision in TAO patients, such as DON, which is the most common vision-threatening condition of TAO (7). ODE, a specific sign of DON, was reported in 56% of eyes affected by DON, and the possible mechanism was the inflammation and edema that coexist in the orbit (23, 24). Therefore, there is a logical reason to speculate that CRFs with ODE may be more serious manifestations than CRFs alone. Although many visual functional parameters in the ODE group were indeed worse than those in the NODE group, there was no significant difference in the visual functional parameters, including BCVA, VF-MD, P100 latency, and HRR scores between two groups, with the exception of VF-PSD. Considering the effect of some systemic or ophthalmic diseases on OCTA parameters, such as hypertension and high myopia, these patients were not included in this study due to the inclusion and exclusion criteria, although these diseases may have a low impact on vision. Therefore, a possible explanation is that not all patients could be included due to the inclusion and exclusion criteria in this study.
OCTA, a novel noninvasive technique, was recently adopted to quantitatively measure retinal and choroidal microvasculature in different ocular and systemic diseases, such as glaucoma (27, 28), age-related macular degeneration (29–31), optic neuropathies (32–35), leukemia (36), diabetic retinopathy (37–40), and TAO (14, 19, 20, 41, 42), and to evaluate the severity and prognosis of these diseases. Our study showed that the macular retinal VD was significantly decreased in the ODE and NODE groups compared with the normal group. Moreover, macular retinal VD was correlated with visual dysfunction in this study. Similar results have been reported in DON patients in previous studies (18, 20, 21). Not all CRF patients have DON symptoms, which are present in 47%–50% of eyes with CRFs (7) and ODE is a specific diagnostic marker of DON and could be used to diagnose as DON in this study. Our study showed no difference in the VD of the macular retina between the ODE and NODE groups. Therefore, these studies may suggest that decreased macular retinal VD in CRF patients may be valid evidence to diagnose vision-threatening TAO.
A recent study showed that choroidal RPC was significantly reduced in DON, which is correlated with VF defects (18). However, to the best of our knowledge, no study on macular choroidal changes has been reported in TAO patients with CRFs. In this study, the VD of the macular CC was significantly reduced in CRF patients with or without ODE and correlated with visual dysfunction. Therefore, decreased choroidal VD in CRF patients may be valid evidence to diagnose vision-threatening TAO. In addition, our study showed that compared with the NODE group, the macular choroidal VD was significantly reduced in the ODE group, while the retinal VD was not different. It is powerful evidence to suggest that CRFs with ODE may be more serious than CRFs alone.
The current study has some limitations. First, this was a cross-sectional study, which makes it difficult to evaluate dynamic changes in VD over the course of the disease and understand its role in the development of disease. Second, the macular choroidal VD with OCTA is determined by projection artifacts, which may interfere with the results of the study. Third, the sample size of CRF-affected eyes was also small because CRFs were rare in TAO patients, and more samples would make the results stronger.
Conclusion
In summary, our results demonstrated a notable decrease in choroidal and retinal macular VD in patients with CRFs with or without ODE, which is correlated with visual dysfunction. The macular choroidal VD in CRF patients with ODE was significantly reduced compared with that in NODE patients and may be an alternative index to diagnose vision-threatening TAO.
Data availability statement
The original contributions presented in the study are included in the article/supplementary material. Further inquiries can be directed to the corresponding authors.
Ethics statement
The protocol of this study was approved by the Sun Yat-sen University Sun Yat-sen Memorial Hospital Ethical Committee in the People’s Republic of China. The patients/participants provided their written informed consent to participate in this study.
Author contributions
PZ, J-QL and Y-YP have contributed equally to the work. All authors contributed to the article and approved the submitted version.
Funding
This research was supported by the Guangzhou Science and Technology project (NO.2021-02-04-0203) and Sun Yat-Sen Clinical Research Cultivating Program.
Conflict of interest
The authors declare that the research was conducted in the absence of any commercial or financial relationships that could be construed as a potential conflict of interest.
The reviewer RC declared a shared affiliation with the authors to the handling editor at the time of review.
Publisher’s note
All claims expressed in this article are solely those of the authors and do not necessarily represent those of their affiliated organizations, or those of the publisher, the editors and the reviewers. Any product that may be evaluated in this article, or claim that may be made by its manufacturer, is not guaranteed or endorsed by the publisher.
References
1. Olsen TW, Palejwala NV, Lee LB, Bergstrom CS, Yeh S. Chorioretinal folds: associated disorders and a related maculopathy. Am J Ophthalmol (2014) 157(5):1038–47. doi: 10.1016/j.ajo.2014.02.021
2. Haruyama M, Yuzawa M, Kawamura A, Yamazaki C, Matsumoto Y. Indocyanine green angiographic findings of chorioretinal folds. Japanese J Ophthalmol (2001) 45(3):293–300. doi: 10.1016/S0021-5155(01)00323-9
3. Khairallah M, Ladjimi A, Messaoud R, Gharsallah R, Ben Yahia S. Sectorial choroidal ischemia associated with ipsilateral lacrimal gland tumor. Am J Ophthalmol (1997) 124(2):263–5. doi: 10.1016/S0002-9394(14)70803-7
4. Fannin LA, Schiffman JC, Budenz DL. Risk factors for hypotony maculopathy. Ophthalmology (2003) 110(6):1185–91. doi: 10.1016/S0161-6420(03)00227-6
5. Leahey AB, Brucker AJ, Wyszynski RE, Shaman P. Chorioretinal folds. a comparison of unilateral and bilateral cases. Arch Ophthalmol (Chicago Ill 1960) (1993) 111(3):357–9. doi: 10.1001/archopht.1993.01090030075042
6. Cohen SY, Ducos de Lahitte G, Gaudric A, Mrejen S. CHORIORETINAL FOLDS IN PATIENTS WITH CENTRAL SEROUS CHORIORETINOPATHY. Retinal cases Brief Rep (2022) 16(2):242–5. doi: 10.1097/ICB.0000000000000944
7. Tran AQ, Zhang-Nunes SX, Cahill K, Alabiad CR, Shriver EM, Ho T, et al. Thyroid eye disease with choroidal folds. Orbit (Amsterdam Netherlands) (2021) 40(3):206–14. doi: 10.1080/01676830.2020.1756347
8. DeMaria LN, Tran AQ, Tooley AA, Elmalem VI, Belinsky I. Partial vision loss after orbital decompression in a patient with thyroid eye disease, chorioretinal folds, and disc edema. J Neuroophthalmol (2021) 41(3):e366–8. doi: 10.1097/WNO.0000000000001174
9. Vahdani K, Rose GE. Chorioretinal folds in thyroid eye disease. Ophthalmology (2019) 126(8):1106. doi: 10.1016/j.ophtha.2019.04.045
10. Jorge R, Scott IU, Akaishi PM, Velasco Cruz AA, Flynn HW Jr. Resolution of choroidal folds and improvement in visual acuity after orbital decompression for graves orbitopathy. Retina (Philadelphia Pa) (2003) 23(4):563–5. doi: 10.1097/00006982-200308000-00025
11. Zeng P, Wang J, Tian P, Peng YY, Liang JQ, Wang M, et al. Macular and peripapillary optical coherence tomography angiography metrics in thyroid-associated ophthalmopathy with chorioretinal folds. Photodiagnosis Photodyn Ther (2022), 42:103146. doi: 10.1016/j.pdpdt.2022.103146
12. Ye L, Zhou SS, Yang WL, Bao J, Jiang N, Min YL, et al. RETINAL MICROVASCULATURE ALTERATION IN ACTIVE THYROID-ASSOCIATED OPHTHALMOPATHY. Endocrine Pract (2018) 24(7):658–67. doi: 10.4158/EP-2017-0229
13. Yu L, Jiao Q, Cheng Y, Zhu Y, Lin Z, Shen X. Evaluation of retinal and choroidal variations in thyroid-associated ophthalmopathy using optical coherence tomography angiography. BMC Ophthalmol (2020) 20:421. doi: 10.1186/s12886-020-01692-7
14. Del Noce C, Roda M, Valsecchi N, Guandalini S, Di Geronimo N, Schiavi C, et al. Evaluation of peripapillary vascular flow in patients with thyroid-associated ophthalmopathy (TAO) by OCT angiography. Graefe's Arch Clin Exp Ophthalmol (2022) 260(8):2711–6. doi: 10.1007/s00417-022-05551-7
15. Jian H, Wang Y, Ou L, He W. Altered peripapillary vessel density and nerve fiber layer thickness in thyroid-associated ophthalmopathy using optical coherence tomography angiography. Int Ophthalmol (2022) 42(3):855–62. doi: 10.1007/s10792-021-02051-1
16. Ye J, Liu W, Hu X, Jiang H, Xu M, Jin H, et al. Elevated pulse pressure correlated with reduced retinal peripapillary capillary in thyroid-associated ophthalmology with visual field defect. Front Endocrinol (2022) 13:941051. doi: 10.3389/fendo.2022.941051
17. Del Noce C, Roda M, Ferro Desideri L, Traverso CE, Vagge A. Evaluation of macular blood flow after intermittent intravenous infusion of high-dose corticosteroids (pulse therapy) in patients with thyroid-associated orbitopathy (TAO) using angio-OCT. Graefe's Arch Clin Exp Ophthalmol (2022) 260(2):571–6. doi: 10.1007/s00417-021-05336-4
18. Wu JH, Luo LY, Zhou H, Wu Y, Zhang J, Cheng JW. Reduced choroidal peripapillary capillaries in thyroid-associated ophthalmopathy with early stage of dysthyroid optic neuropathy. Int J Ophthalmol (2022) 15(7):1135–41. doi: 10.18240/ijo.2022.07.14
19. Wu Y, Tu Y, Wu C, Bao L, Wang J, Lu F, et al. Reduced macular inner retinal thickness and microvascular density in the early stage of patients with dysthyroid optic neuropathy. Eye Vision (2020) 7:16. doi: 10.1186/s40662-020-00180-9
20. Zhang T, Xiao W, Ye H, Chen R, Mao Y, Yang H. Peripapillary and macular vessel density in dysthyroid optic neuropathy: an optical coherence tomography angiography study. Invest Ophthalmol Visual Sci (2019) 60(6):1863–9. doi: 10.1167/iovs.18-25941
21. Wu Y, Yang Q, Ding L, Tu Y, Deng X, Yang Y, et al. Peripapillary structural and microvascular alterations in early dysthyroid optic neuropathy. Eye Vision (2022) 9(1):30. doi: 10.1186/s40662-022-00301-6
22. Bartalena L, Kahaly GJ, Baldeschi L, Dayan CM, Eckstein A, Marcocci C, et al. The 2021 European group on graves' orbitopathy (EUGOGO) clinical practice guidelines for the medical management of graves' orbitopathy. Eur J Endocrinol (2021) 185(4):G43–g67. doi: 10.1530/EJE-21-0479
23. Blum Meirovitch S, Leibovitch I, Kesler A, Varssano D, Rosenblatt A, Neudorfer M. Retina and nerve fiber layer thickness in eyes with thyroid-associated ophthalmopathy. Israel Med Assoc J IMAJ (2017) 19(5):277–81.
24. McKeag D, Lane C, Lazarus JH, Baldeschi L, Boboridis K, Dickinson AJ, et al. Clinical features of dysthyroid optic neuropathy: a European group on graves' orbitopathy (EUGOGO) survey. Br J Ophthalmol (2007) 91(4):455–8. doi: 10.1136/bjo.2006.094607
25. Bartalena L, Baldeschi L, Boboridis K, Eckstein A, Kahaly GJ, Marcocci C, et al. The 2016 European thyroid Association/European group on graves' orbitopathy guidelines for the management of graves' orbitopathy. Eur Thyroid J (2016) 5(1):9–26. doi: 10.1159/000443828
26. Jaworski A, Wolffsohn JS, Napper GA. Aetiology and management of choroidal folds. Clin Exp optometry (1999) 82(5):169–76. doi: 10.1111/j.1444-0938.1999.tb06638.x
27. Rao HL, Pradhan ZS, Suh MH, Moghimi S, Mansouri K, Weinreb RN. Optical coherence tomography angiography in glaucoma. J glaucoma (2020) 29(4):312–21. doi: 10.1097/IJG.0000000000001463
28. Takusagawa H, Liu L, Ma KN, Jia Y, Gao S, Zhang M, et al. Projection-resolved optical coherence tomography angiography of macular retinal circulation in glaucoma. Ophthalmology (2017) 124(11):1589–99. doi: 10.1016/j.ophtha.2017.06.002
29. Braun PX, Mehta N, Gendelman I, Alibhai AY, Baumal CR, Duker JS, et al. Using the pathophysiology of dry AMD to guide binarization of the choriocapillaris on OCTA: a model. Trans Vision Sci Technol (2020) 9(8):44. doi: 10.1167/tvst.9.8.44
30. Yuan MZ, Chen LL, Yang JY, Luo MY, Chen YX. Comparison of OCT and OCTA manifestations among untreated PCV, neovascular AMD, and CSC in Chinese population. Int J Ophthalmol (2020) 13(1):93–103. doi: 10.18240/ijo.2020.01.14
31. Levine ES, Custo Greig E, Mendonça LSM, Gulati S, Despotovic IN, Alibhai AY, et al. The long-term effects of anti-vascular endothelial growth factor therapy on the optical coherence tomography angiographic appearance of neovascularization in age-related macular degeneration. Int J Retina Vitreous (2020) 6:39. doi: 10.1186/s40942-020-00242-z
32. Micieli JA, Newman NJ, Biousse V. The role of optical coherence tomography in the evaluation of compressive optic neuropathies. Curr Opin Neurol (2019) 32(1):115–23. doi: 10.1097/WCO.0000000000000636
33. Moon Y, Song MK, Shin JW, Lim HT. Optical coherence tomography angiography characteristics and predictors of visual outcomes in patients with acute and chronic nonarteritic anterior ischemic optic neuropathy. J Neuroophthalmol (2021) 41(4):e440–50. doi: 10.1097/WNO.0000000000001102
34. Augstburger E, Zéboulon P, Keilani C, Baudouin C, Labbé A. Retinal and choroidal microvasculature in nonarteritic anterior ischemic optic neuropathy: an optical coherence tomography angiography study. Invest Ophthalmol Visual Sci (2018) 59(2):870–7. doi: 10.1167/iovs.17-22996
35. Aghsaei Fard M, Salabati M, Mahmoudzadeh R, Kafieh R, Hojati S, Safizadeh M, et al. Automated evaluation of parapapillary choroidal microvasculature in ischemic optic neuropathy and open angle glaucoma. Invest Ophthalmol Visual Sci (2020) 61(3):35. doi: 10.1167/iovs.61.3.35
36. Cicinelli MV, Mastaglio S, Menean M, Marchese A, Miserocchi E, Modorati G, et al. RETINAL MICROVASCULAR CHANGES IN PATIENTS WITH ACUTE LEUKEMIA. Retina (Philadelphia Pa) (2022) 42(9):1762–71. doi: 10.1097/IAE.0000000000003504
37. Auvazian SL, Cano J, Leahy S, Karamian P, Kashani A, Moshfeghi A, et al. Relating retinal vascular oxygen saturation and microvasculature morphology at progressive stages of diabetic retinopathy. Trans Vision Sci Technol (2021) 10(6):4. doi: 10.1167/tvst.10.6.4
38. Kaoual H, Zhioua Braham I, Boukari M, Zhioua R. Evaluation of the effect of the severity of diabetic retinopathy on microvascular abnormalities and vascular density using optical coherence tomography angiography. Acta diabetologica (2021) 58(12):1683–8. doi: 10.1007/s00592-021-01774-y
39. Ashraf M, Sampani K, Clermont A, Abu-Qamar O, Rhee J, Silva PS, et al. Vascular density of deep, intermediate and superficial vascular plexuses are differentially affected by diabetic retinopathy severity. Invest Ophthalmol Visual Sci (2020) 61(10):53. doi: 10.1167/iovs.61.10.53
40. Suciu CI, Suciu VI, Nicoara SD. Optical coherence tomography (Angiography) biomarkers in the assessment and monitoring of diabetic macular edema. J Diabetes Res (2020) 2020:6655021. doi: 10.1155/2020/6655021
41. Wang YH, Ma J, Li H, Xu HY, Gan LY, Zhang X, et al. [Peripapillary and macular vessel density in eyes with different phases of thyroid-associated ophthalmopathy]. [Zhonghua yan ke za zhi] Chin J Ophthalmol (2020) 56(11):824–31. doi: 10.3760/cma.j.cn112142-20191115-00574
42. Del Noce C, Roda M, Ferro Desideri L, Traverso CE, Vagge A. Evaluation of macular blood flow after intermittent intravenous infusion of high-dose corticosteroids (pulse therapy) in patients with thyroid-associated orbitopathy (TAO) using angio-OCT. Graefe's Arch Clin Exp Ophthalmol (2021) 260(2):571–576. doi: 10.1007/s00417-021-05336-4
Keywords: thyroid-associated ophthalmopathy, chorioretinal folds, optic disc edema, choriocapillaris, vessel density
Citation: Zeng P, Liang J-q, Peng Y-y, Fan S-x, Wang J, Zhou S-y, Tian P and Wang M (2023) Decreased macular choriocapillaris in thyroid-associated ophthalmopathy: focusing on chorioretinal folds with and without optic disc edema. Front. Endocrinol. 14:1123820. doi: 10.3389/fendo.2023.1123820
Received: 14 December 2022; Accepted: 07 April 2023;
Published: 21 April 2023.
Edited by:
Giulia Lanzolla, University of Pennsylvania, United StatesReviewed by:
Rongxin Chen, Zhongshan Ophthalmic Center, Sun Yat-sen University, ChinaZongyi Zhan, Shenzhen Eye Hospital, China
Jianmin Ma, Beijing Tongren Hospital, Capital Medical University, China
Copyright © 2023 Zeng, Liang, Peng, Fan, Wang, Zhou, Tian and Wang. This is an open-access article distributed under the terms of the Creative Commons Attribution License (CC BY). The use, distribution or reproduction in other forums is permitted, provided the original author(s) and the copyright owner(s) are credited and that the original publication in this journal is cited, in accordance with accepted academic practice. No use, distribution or reproduction is permitted which does not comply with these terms.
*Correspondence: Mei Wang, d2FuZ21laTJAbWFpbC5zeXN1LmVkdS5jbg==; Peng Tian, dGlhbnBlbmczQG1haWwuc3lzdS5lZHUuY24=; Shi-you Zhou, emhvdXNoaXlAbWFpbC5zeXN1LmVkdS5jbg==
†These authors have contributed equally to the work