 Yao Qin1†
 Yuxiao Li
 Lu Qin
 Mei Zhang
- 1Department of Endocrinology, the First Affiliated Hospital of Nanjing Medical University, Nanjing, China
- 2Department of Clinical Nutrition, the Second Affiliated Hospital of Soochow University, Suzhou, China
- 3Department of Endocrinology, the First People’s Hospital of Lianyungang, Lianyungang, China
Objective: Abnormal iron metabolism is related to the risk of diabetes, but the underlying mechanism of this association remains uncertain. This study was conducted to evaluate the contributions of systemic iron status to β-cell function and insulin sensitivity of patients with newly diagnosed T2DM.
Methods: A total of 162 patients with newly diagnosed T2DM and 162 healthy controls were enrolled in the study. Basic characteristics, biochemical indicators, and iron metabolism biomarkers, including serum iron (SI), ferritin (SF), transferrin (Trf), and transferrin saturation (TS), were collected. All patients underwent a 75 g oral glucose tolerance test. A series of parameters for assessing β-cell function and insulin sensitivity were calculated. The multivariate stepwise linear regression model was used to investigate the contributions of iron metabolism to β-cell function and insulin sensitivity.
Results: Compared with healthy controls, patients with newly diagnosed T2DM had significantly higher levels of SF. Among the diabetic patients, the SI and TS levels were higher, and the percentage of Trf levels below normal values was lower in men than in women. In all diabetic patients, SF was the independent risk factor associated with impaired β-cell function. Further stratification analysis showed that Trf was an independent protective factor for β-cell function in male patients, while SF was an independent risk factor for impaired β-cell function in female patients. However, systemic iron status did not affect insulin sensitivity.
Conclusion: Elevated SF levels and decreased Trf levels had a profound effect on impaired β-cell function in Chinese patients with newly diagnosed T2DM.
1 Introduction
Type 2 diabetes mellitus (T2DM) is a metabolic disease characterized by insulin resistance and relative insulin deficiency (1). There is a quantitative interaction between insulin action and insulin release. When insulin sensitivity decreases, changes in insulin sensitivity are compensated by an increase in insulin secretion to balance the blood glucose level (2). As the disease progresses, the number of β cells progressively decreases, and β-cell function deteriorates further, eventually resulting in insulin deficiency and obvious diabetes. However, the mechanisms that mediate insulin secretion defect and insulin resistance have not yet been fully elucidated.
The initial observation of an increased incidence of T2DM in patients with hereditary hemochromatosis and the similar discovery subsequently in secondary iron overload diseases (such as thalassemia) sparked interest in the relationship between iron metabolism and T2DM (3, 4). There is increasing evidence that iron overload is an important determinant of insulitis and a biological marker of the increased risk and mortality of diabetes (5). In type 1 and type 2 diabetes, and even among diabetic complications, most patients have abnormal iron metabolism, manifested by serum iron (SI), ferritin (SF), and transferrin saturation (TS) levels that are significantly higher than in the general population (6–8). Recently, Wang et al. used Mendelian randomization to analyze the causal relationship between systematic iron increase and the risk of T2DM from a genetic perspective. The results showed that genetically instrumented SI, SF, and TS were positively related to the risk of T2DM, while transferrin (Trf) was negatively correlated with the risk of T2DM (9). Interventions to reduce iron have been reported to delay the onset of T2DM, including the use of chelators (10, 11), blood-letting (12), and an iron restriction diet (13).
Studies in non-diabetic individuals showed that SF levels were positively correlated with homeostasis model assessment of insulin resistance (HOMA-IR) (14, 15). In a large study of 6,392 individuals in the Danish general population, elevated SF levels were related to impaired β-cell function, and an association with decreased insulin sensitivity was observed among men and older women but not among younger women (16). On the other hand, a cohort study of T2DM cases suggested that higher levels of SF and Trf were associated with a higher risk of T2DM and that elevated TS was associated with a lower risk of T2DM in women (17). Other studies also demonstrated that elevated SF was one of the risk factors for T2DM, and the soluble transferrin receptor-to-ferritin ratio was inversely related to the risk of T2DM (18, 19). Although abnormal iron metabolism is linked to an increased risk of T2DM, the exact role of iron metabolism in diabetes remains uncertain, which may be associated with pancreatic β-cell damage, insulin resistance, and liver dysfunction (20). At present, only one small sample study of adult men indicated that elevated levels of SF were positively associated with insulin resistance in newly diagnosed diabetics (21). The existing studies on the correlation between iron metabolism (mainly SF) and islet β-cell function mostly focused on non-diabetic individuals. The contribution weights of different iron metabolism indicators (including SI, SF, TS, and Trf) in decreased insulin secretion and impaired insulin sensitivity are still unclear, especially in patients with newly diagnosed T2DM. Therefore, this study aimed to assess the relative contributions of various iron status biomarkers to β-cell function and insulin sensitivity in patients with newly diagnosed T2DM.
2 Subjects and methods
2.1 Subjects
A total of 162 patients (90 men and 72 women) with newly diagnosed T2DM who were hospitalized in the Endocrinology Department of the First Affiliated Hospital of Nanjing Medical University from June 2017 to April 2020 were selected as the research subjects. All patients met the criteria for the diagnosis and classification of diabetes established by the WHO in 1999, and all patients did not receive any treatment. A total of 162 healthy controls (90 men and 72 women) from the same geographic area were selected. The inclusion criteria for the healthy controls were as follows: (1) no family history of diabetes and (2) fasting blood glucose <5.6 mmol/l and 2-h postprandial blood glucose <7.8 mmol/l on the oral glucose tolerance test. The exclusion criteria for all subjects in both groups were as follows: (1) those with severe heart, liver, or renal disease; (2) those with malignant tumors, hematologic disorders, autoimmune diseases, infectious diseases, or psychiatric disease; (3) those with chronic or acute inflammation; and (4) those who had recently received blood transfusion, iron, or hormone therapy. Written informed consent was obtained from all participants. The study was approved by the Ethics Committee of the First Affiliated Hospital of Nanjing Medical University and was conducted in accordance with the principles of the Declaration of Helsinki II.
2.2 Anthropometric and biochemical measurements
Anthropometric and biochemical measures were obtained after overnight fasting. Weight (kg) and height (cm) were measured with the participants in light indoor clothes and without shoes. Resting blood pressure was measured using a manual sphygmomanometer. Glucose levels, total cholesterol (TC), triglycerides (TG), HDL-C (high-density lipoprotein cholesterol), LDL-C (low-density lipoprotein cholesterol), and uric acid (UA) were measured with an automatic biochemical analysis system (Control AU5800, Beckman Coulter, Japan). HbA1c concentration was tested using high-performance liquid chromatography models (Bio-Rad Laboratories, USA). 25-hydroxyvitamin D (25(OH)D) concentration was measured using an electrochemiluminescence immunoassay on Cobas e411 Elecsys 2010 (Roche Diagnostics GmbH, Mannheim, Germany). SI and total iron-binding capacity (TIBC) were detected with a Ferrozine colorimetric assay (AU5821, Beckman Coulter, Japan). TS was calculated and expressed as a percentage (SI/TIBC × 100%). SF was measured with a chemiluminescent microparticle immunoassay (DXI800, Beckman Coulter, USA), and Trf was determined using immunoturbidimetry (IMAGE800, Beckman Coulter, USA). All diabetic patients underwent a 75 g OGTT with plasma glucose, serum insulin, and C-peptide measured at fasting and at 30, 60, 120, and 180 min after the oral glucose load. Insulin and C-peptide levels were measured with electrochemiluminescence (Cobas e602, Roche Inc., Germany). The reference range for the SI levels was between 10.7 and 32.2 μmol/l, for SF between 23.9 and 336.2 ng/ml, for Trf between 2.0 and 3.6 g/l, for TS between 20% and 55%, for TC between 3.00 and 5.70 mmol/l, for TG between 0.00 and 2.25 mmol/l, for HDL-C between 1.03 and 1.55 mmol/l, for LDL-C between 2.60 and 4.10 mmol/l, for UA between 155 and 357 μmol/l, and for 25(OH)D between 52.5 and 117.5 mmol/l.
2.3 Assays and calculations
Estimates of β-cell function were calculated with homeostasis model assessment of β-cell function (HOMA-β), corrected insulin response (CIR), the insulinogenic index (IGI), and the ratio of the area under the insulin curve to the area under the glucose curve (AUCIns/AUCGlu). HOMA-β was calculated as (20 × fasting insulin (μU/ml))/(fasting glucose (mmol/l) - 3.5) (22). CIR was calculated as (100 × 30 min insulin (pmol/l))/(30 min glucose (mmol/l) × (30 min glucose (mmol/l) - 3.89)). The IGI was calculated as (30 min insulin - fasting insulin)/(30 min glucose - fasting glucose) (pmol/mmol), reflecting the early and midsecretion of insulin. AUCIns/AUCGlu was calculated as AUC3-h insulin/AUC3-h glucose (pmol/mmol). Insulin sensitivity was estimated using the HOMA-IR and the Matsuda index of insulin sensitivity (ISIMatsuda). The HOMA-IR was calculated as (fasting insulin (μU/ml) × fasting glucose (mmol/l))/22.5 (22). The ISIMatsuda was calculated as 10000/(fasting glucose (mg/dl) × fasting insulin (μU/ml) × mean OGTT glucose concentration × mean OGTT insulin concentration)1/2 (23).
2.4 Statistical analysis
SPSS version 24.0 was used for the data analysis. The normality of the quantitative variables was evaluated using the Shapiro-Wilk test. Normally distributed continuous variables were presented as mean ± S.D., and the groups were compared with the independent sample t test. Non-normally distributed continuous variables were presented as median (first quartile, third quartile), and the groups were compared with the Mann-Whitney U test. The proportions were calculated for the categorical data, and the Chi-square test was used for the categorical variables. Spearman correlation analysis was used to evaluate the correlation between pancreatic β-cell function or insulin sensitivity and iron metabolism indicators and the associated factors, and multivariate stepwise linear regression analysis was used to investigate the independent effect of iron metabolism on β-cell function or insulin sensitivity (after logarithmic transformation). P < 0.05 was considered statistically significant.
3 Results
3.1 Patients with newly diagnosed T2DM had higher SF levels than healthy controls
The characteristics and clinical laboratory data of 162 patients with newly diagnosed T2DM and 162 healthy controls were presented in Table 1. The patients with T2DM had a mean age of 52.88 ± 13.63 years and a median body mass index (BMI) of 25.38 (23.44, 27.91) kg/m2, which were higher than in the healthy controls (P = 0.001, P = 0.000, respectively). Compared with the healthy controls, the levels of TG and HbA1c in the patients with T2DM were higher (P = 0.002, P = 0.000, respectively), while the HDL-C levels were lower (P = 0.000). More importantly, the SF levels were significantly higher in the patients with T2DM than in the healthy controls (P = 0.003). There were no significant differences in the RBC, Hb, TC, and LDL-C levels between the two groups (all P > 0.05).
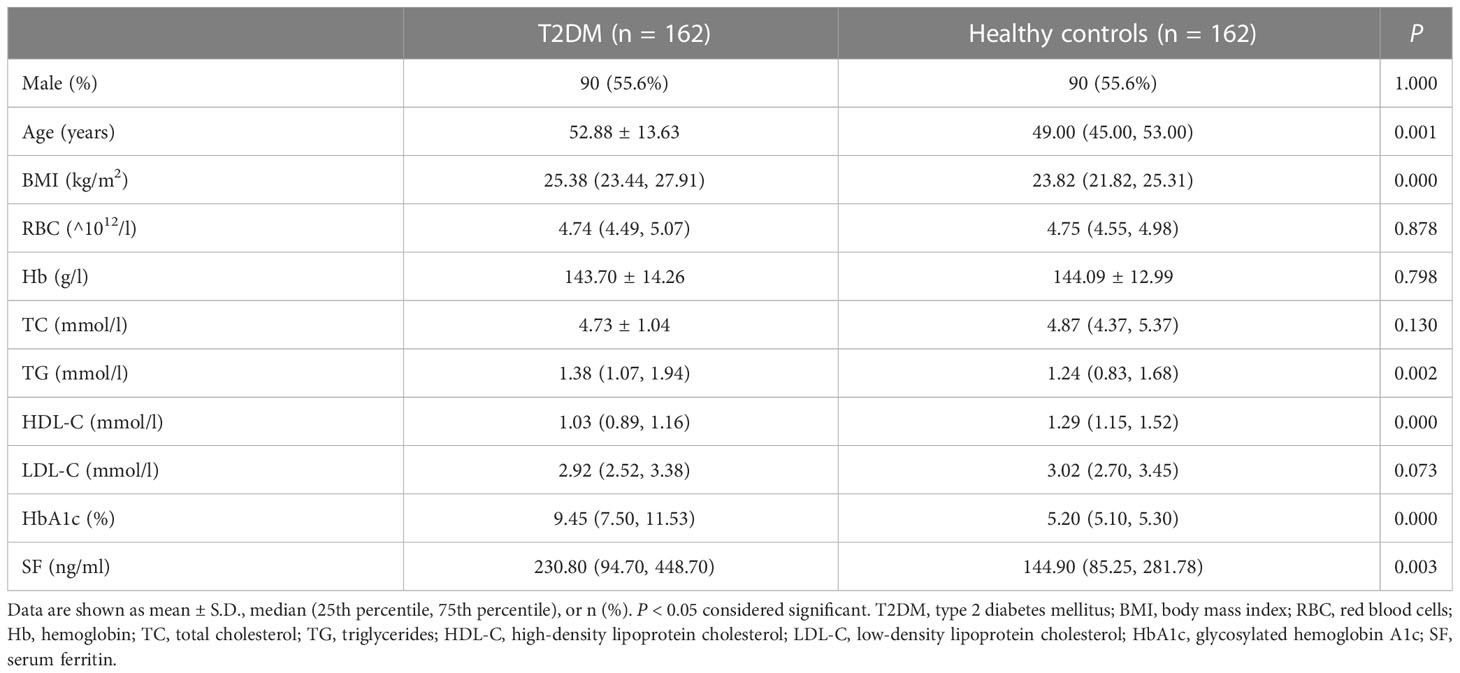
Table 1 Characteristics of patients with newly diagnosed T2DM and healthy controls.
3.2 Iron metabolism, β-cell function, and insulin sensitivity in patients with newly diagnosed T2DM
A total of 162 patients with newly diagnosed T2DM underwent a 75 g OGTT and iron metabolism assessment. As shown in Table 2, the median BMI for all patients was 25.38 (23.44, 27.91) kg/m2 and was higher in men than in women (P = 0.013). The median HDL-C for all patients was 1.03 (0.89, 1.16) mmol/l and was higher in women than in men (P = 0.007). The median UA and 25(OH)D for all patients were 323.00 (267.00, 391.25) μmol/l and 41.20 (32.71, 55.55) mmol/; both were higher in men than in women (P = 0.000, P = 0.000, respectively). In terms of iron metabolism, the median SI for all patients was 16.10 (12.10, 20.88) μmol/l, and the median TS was 32.48 (21.16, 44.84) %; both were higher in men than in women (P = 0.019, P = 0.024, respectively). The percentage of Trf levels found to be below normal values was lower in male than in female patients (14.44% vs. 29.17%, P = 0.022). However, the percentages of elevated SI, SF, and TS levels were not statistically different between male and female patients. Regarding β-cell function and insulin sensitivity, the median ISIMatsuda for all patients was 0.11 (0.05, 0.21) and was significantly lower in women than in men (P = 0.039). The average age for all patients was 52.88 ± 13.63 years, and the median HbA1c was 9.45 (7.50, 11.53) %. The mean TC for all patients was 4.73 ± 1.04 mmol/l, the median TG was 1.38 (1.07, 1.94) mmol/l, and the median LDL-C was 2.92 (2.52, 3.38) mmol/l. The median SF for all patients was 230.80 (94.70, 448.70) ng/ml, and the mean Trf was 2.38 ± 0.54 g/l. The median HOMA-β for all patients was 43.93 (22.36, 78.94), the median CIR was 179.05 (90.84, 412.69), the median IGI was 17.49 (8.50, 37.70), and the median AUCIns/AUCGlu was 12.39 (6.58, 24.82). The median HOMA-IR for all patients was 1.49 (0.70, 2.68). There were no significant differences in age, SBP, DBP, HbA1c, TC, TG, LDL-C, SF, or Trf levels between the two groups, or in β-cell function and HOMA-IR (all P > 0.05).
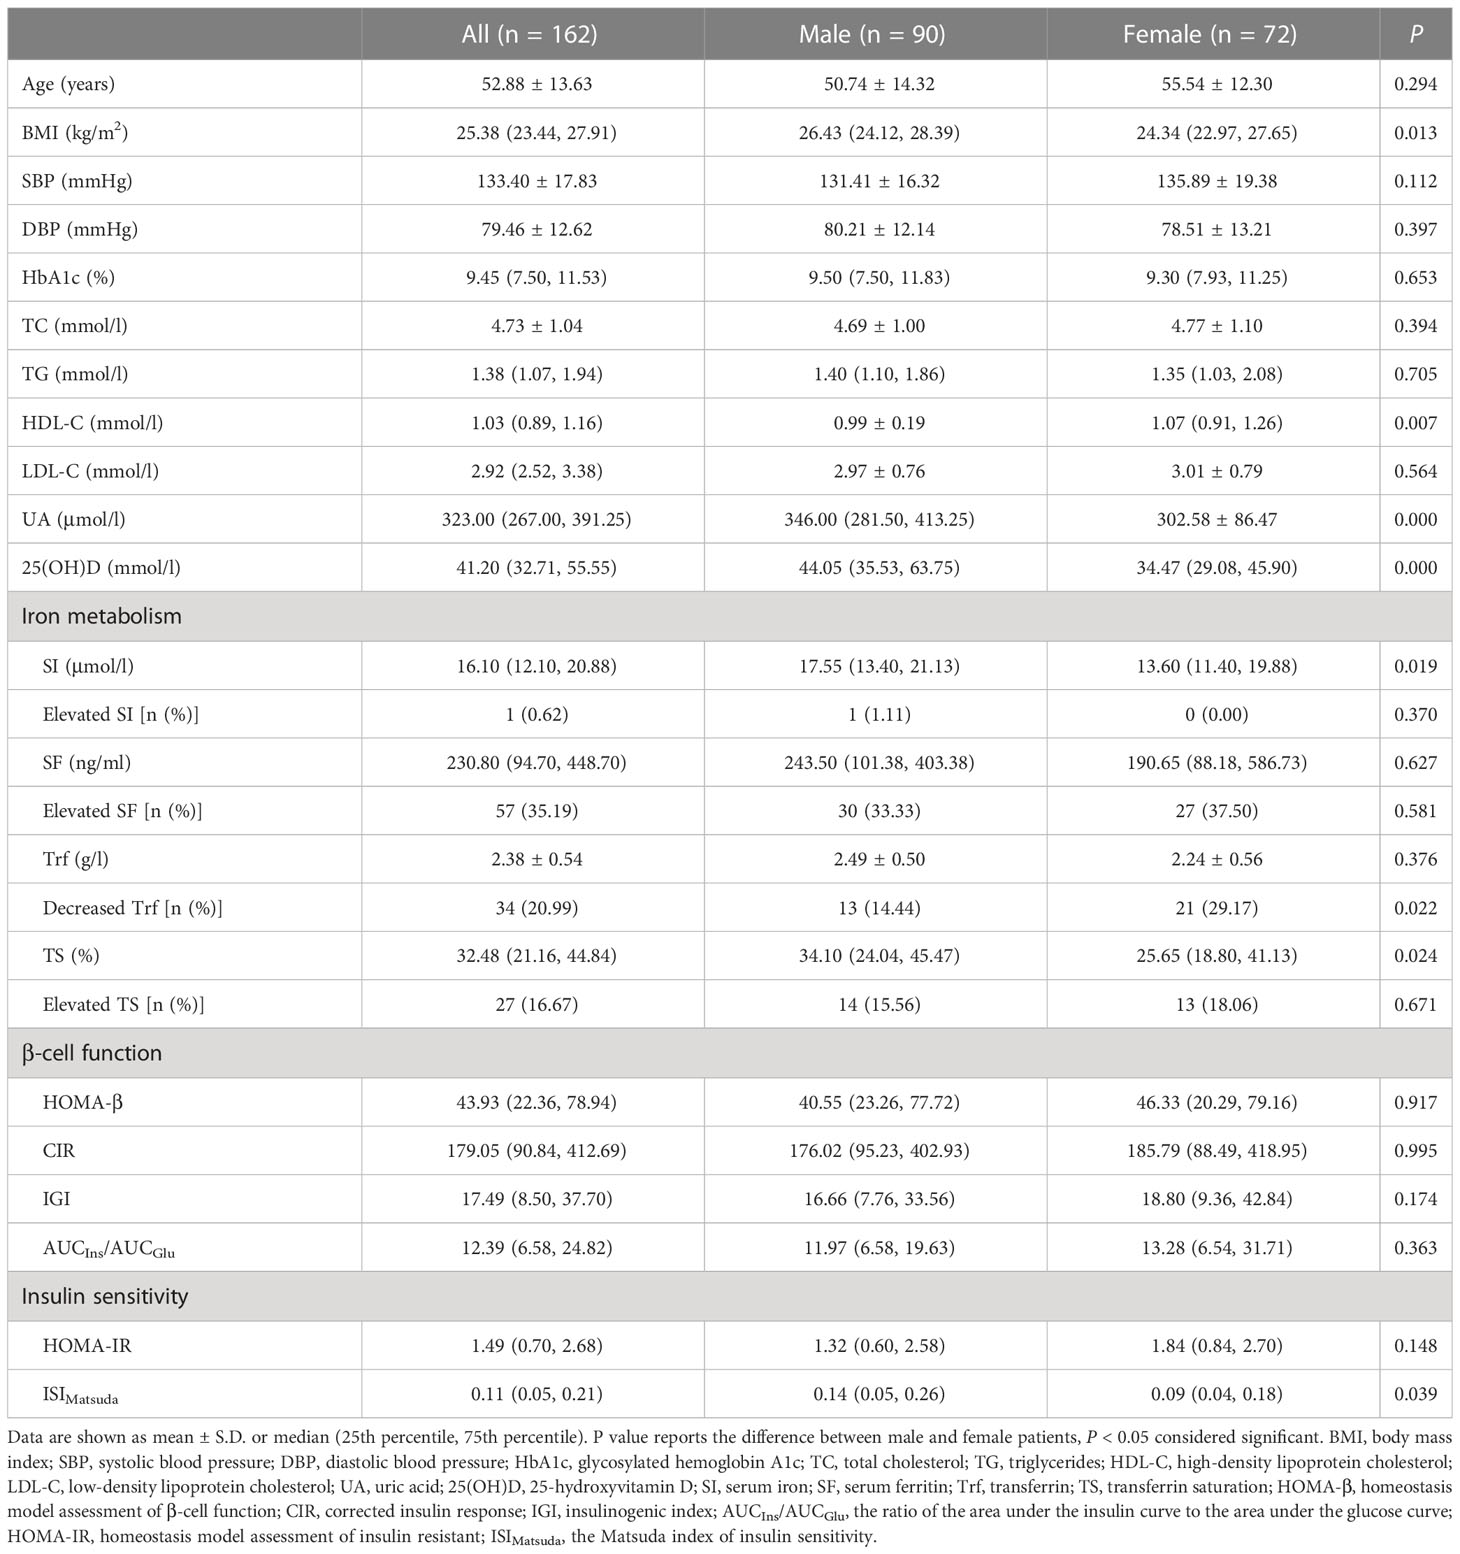
Table 2 Clinical characteristics, β-cell function and insulin sensitivity of patients with newly diagnosed T2DM.
3.3 Correlation between β-cell function or insulin sensitivity and systemic iron status and the associated factors in patients with newly diagnosed T2DM
We further analyzed the correlation between β-cell function or insulin sensitivity and systemic iron status and the related factors in the patients with newly diagnosed T2DM. A heat map of the Spearman correlation showed a significant correlation between β-cell function or insulin sensitivity and iron status parameters and other associated factors (Figure 1). In all patients (Figure 1A), β-cell function was negatively associated with SI, SF, TS, age, and HbA1c, and positively associated with Trf, BMI, SBP, TG, and UA (all P < 0.05). Insulin sensitivity was positively related to SF, TS, age, and HbA1c, and negatively related to Trf, gender, BMI, SBP, DBP, TG, and UA (all P < 0.05). Next, we performed a stratified analysis according to sex. In male patients (Figure 1B), β-cell function was negatively correlated with TS, age, and HbA1c, and positively correlated with Trf, BMI, and UA (all P < 0.05). Insulin sensitivity was positively related to TS and HbA1c, and negatively related to Trf, BMI, SBP, TG, and UA (all P < 0.05). However, SI and SF were not significantly associated with β-cell function or insulin sensitivity. On the other hand, in female patients (Figure 1C), β-cell function was negatively associated with SI, SF, TS, and HbA1c, and positively associated with Trf, BMI, TG, and UA (all P < 0.05). Insulin sensitivity was positively related to SF, TS, and HbA1c, and negatively related to Trf, BMI, SBP, DBP, TG, and UA (all P < 0.05). Overall, the associations of all four iron biomarkers with β-cell function or insulin sensitivity were stronger among women than among men.
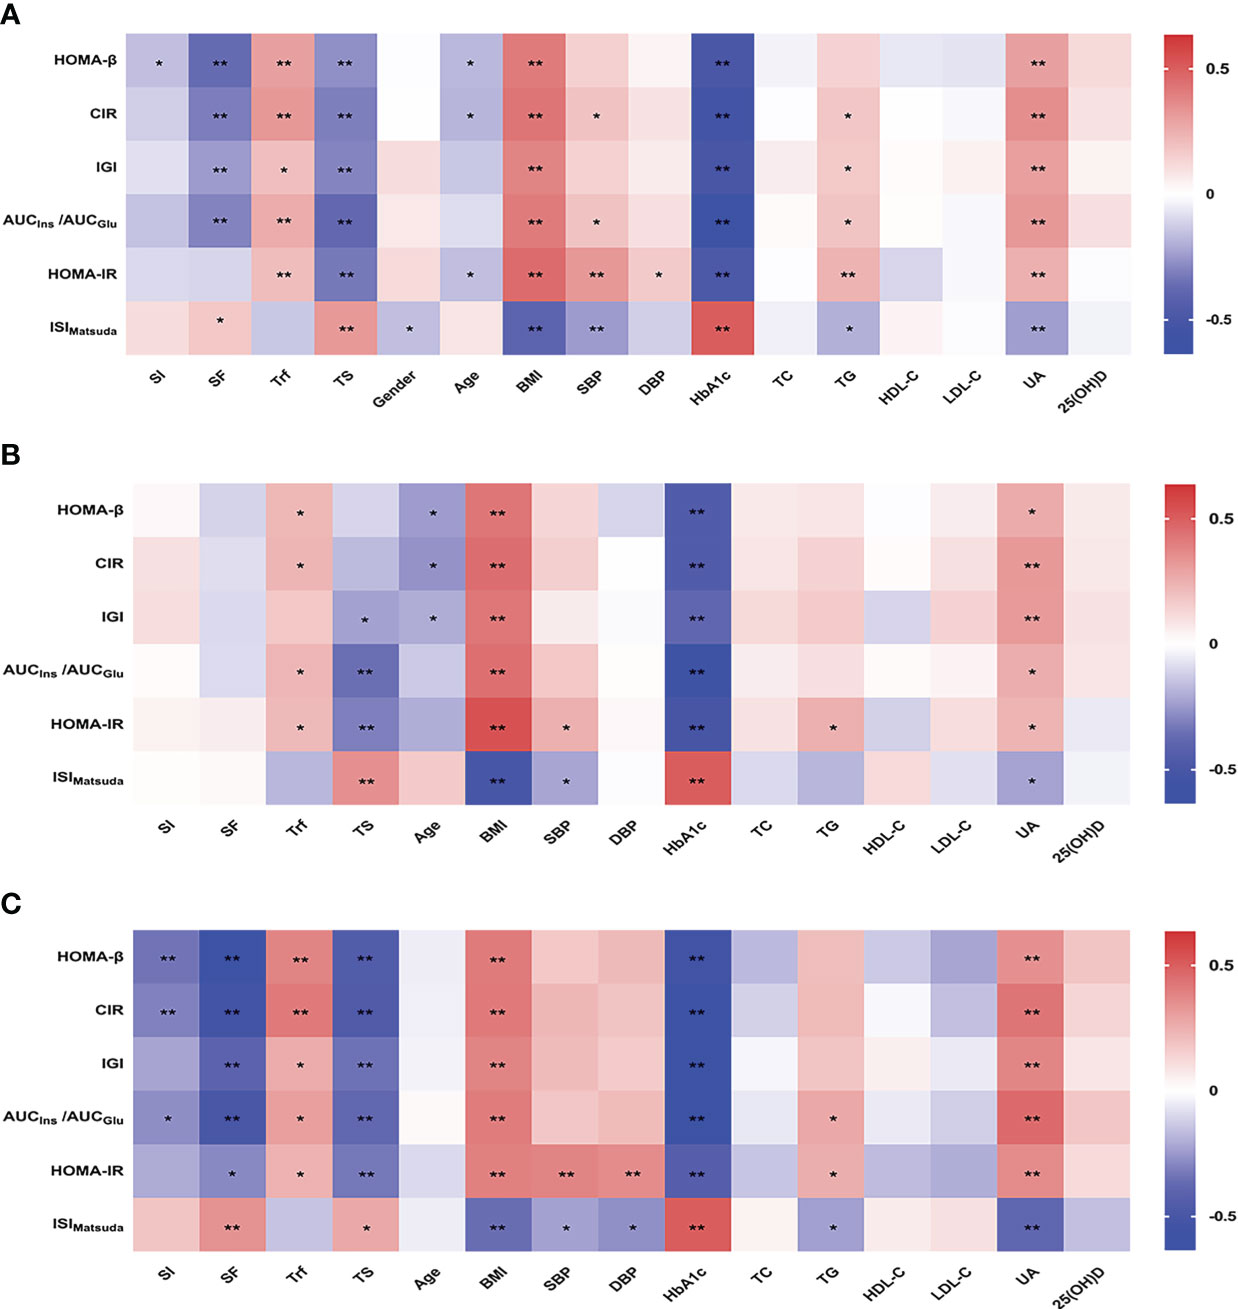
Figure 1 Heatmap showing Spearman correlation between β-cell function or insulin sensitivity and systemic iron status and the associated factors in all (A), male (B) and female (C) patients with newly diagnosed T2DM. Red indicates positive correlations and blue negative. *P<0.05; **P<0.01. SI, serum iron; SF, serum ferritin; Trf, transferrin; TS, transferrin saturation; BMI, body mass index; SBP, systolic blood pressure; DBP, diastolic blood pressure; HbA1c, glycosylated hemoglobin A1c; TC, total cholesterol; TG, triglycerides; HDL-C, high-density lipoprotein cholesterol; LDL-C, low-density lipoprotein cholesterol; UA, uric acid; 25(OH)D, 25-hydroxyvitamin D; HOMA-β, homeostasis model assessment of β-cell function; CIR, corrected insulin response; IGI, insulinogenic index; AUCIns/AUCGlu, the ratio of the area under the insulin curve to the area under the glucose curve; HOMA-IR, homeostasis model assessment of insulin resistant; ISIMatsuda, the Matsuda index of insulin sensitivity.
3.4 Multivariate stepwise regression analysis for islet β-cell function or insulin sensitivity and systemic iron status
We next conducted multivariate stepwise regression analysis to determine the independent factors affecting pancreatic β-cell function or insulin sensitivity in patients with newly diagnosed diabetes. We examined the relationship between the natural log (Ln)-transformed β-cell function or insulin sensitivity and several statistically significant variables, including gender, age, BMI, SBP, DBP, HbA1c, TG, UA, SI, SF, Trf, and TS. In all patients (Table 3), SF was an independent risk factor associated with impaired β-cell function. Expressed per unit change, an increase of 1 ng/ml in SF was associated with a decrease of 1 in HOMA-β (B = -0.001, P = 0.000), a decrease of 1 in CIR (B = -0.001, P = 0.001), and a decrease of 1 in AUCIns/AUCGlu (B = -0.001, P = 0.005). Subsequently, stratified analyses were performed by gender. In male patients (Table 4), an increase of 1 g/l in Trf was associated with an increase of 1.52 in HOMA-β (B = 0.416, P = 0.018) and an increase of 1.56 in CIR (B = 0.447, P = 0.013). However, in female patients (Table 5), an increase of 1 ng/ml in SF was associated with a decrease of 1 in HOMA-β (B = -0.001, P = 0.000), a decrease of 1 in CIR (B = -0.001, P = 0.002), and a decrease of 1 in AUCIns/AUCGlu (B = -0.001, P = 0.002). However, no correlation was found between insulin sensitivity and iron metabolism indicators in male and female patients.
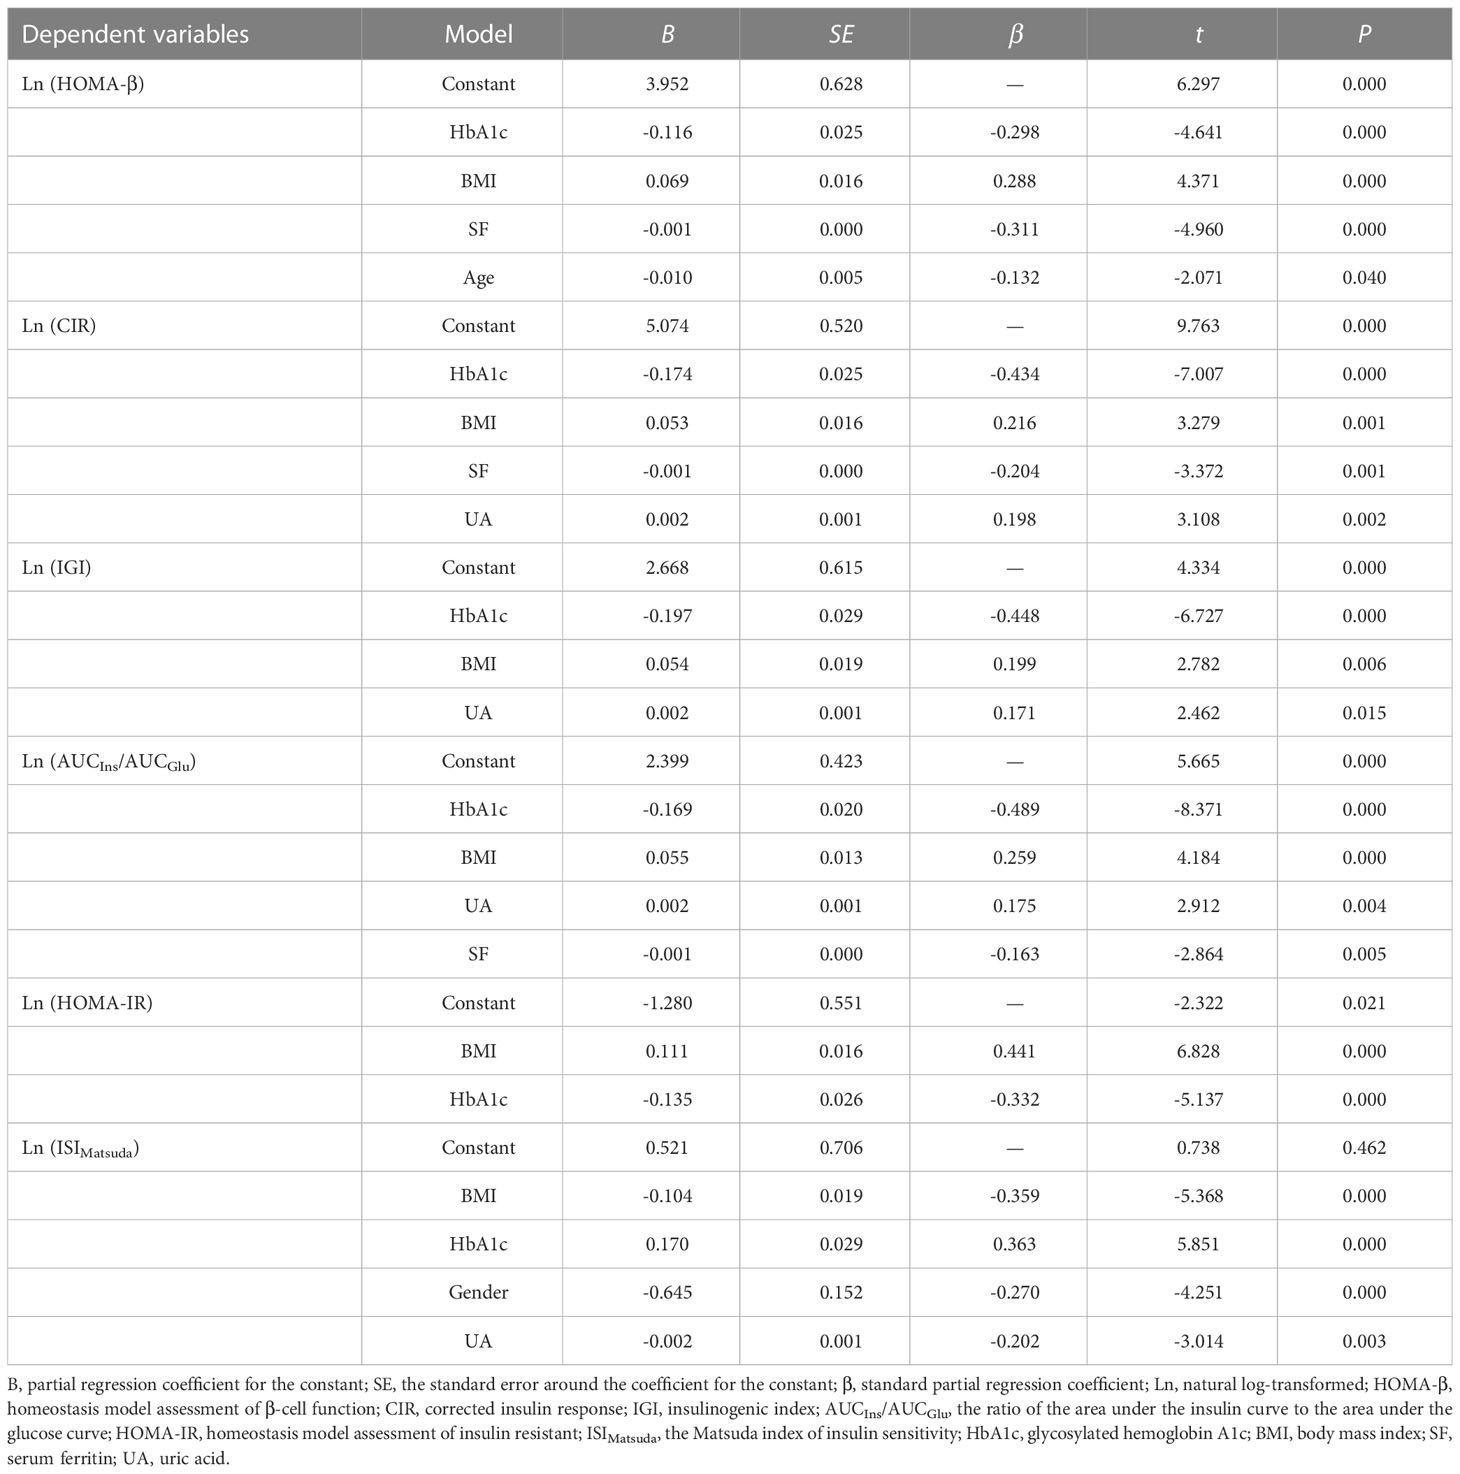
Table 3 Multivariate stepwise regression analysis for β-cell function or insulin sensitivity and related factors in all diabetic patients.
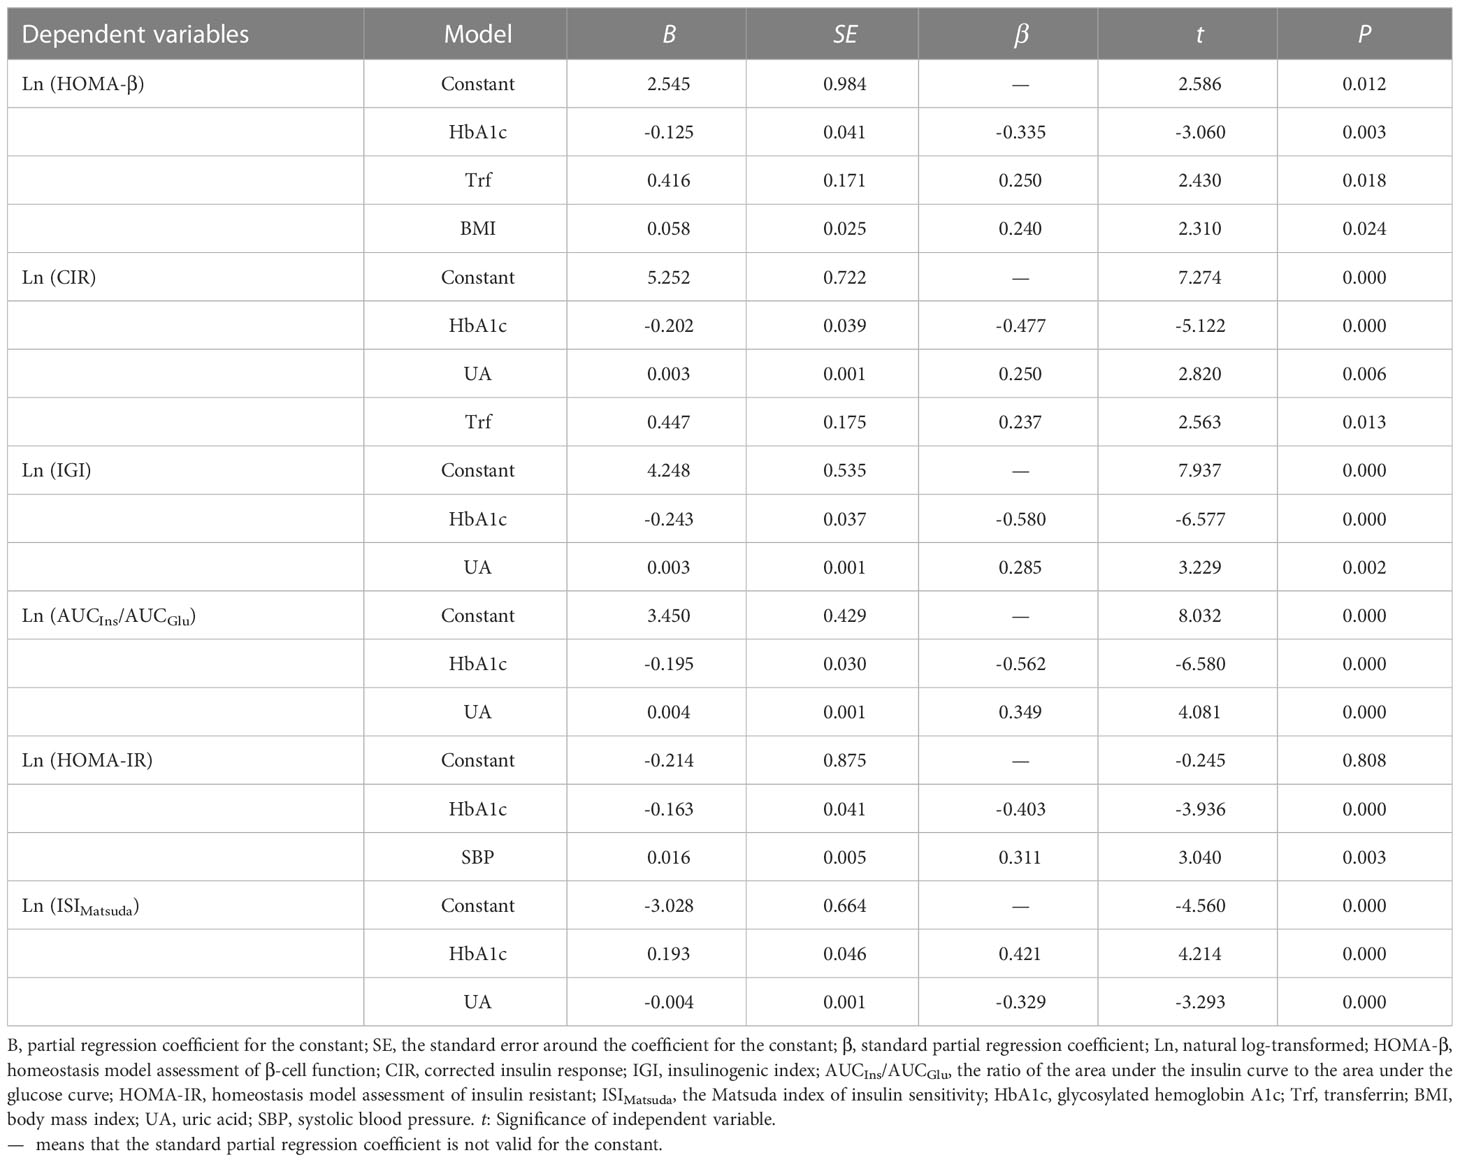
Table 4 Multivariate stepwise regression analysis for β-cell function or insulin sensitivity and related factors in men.
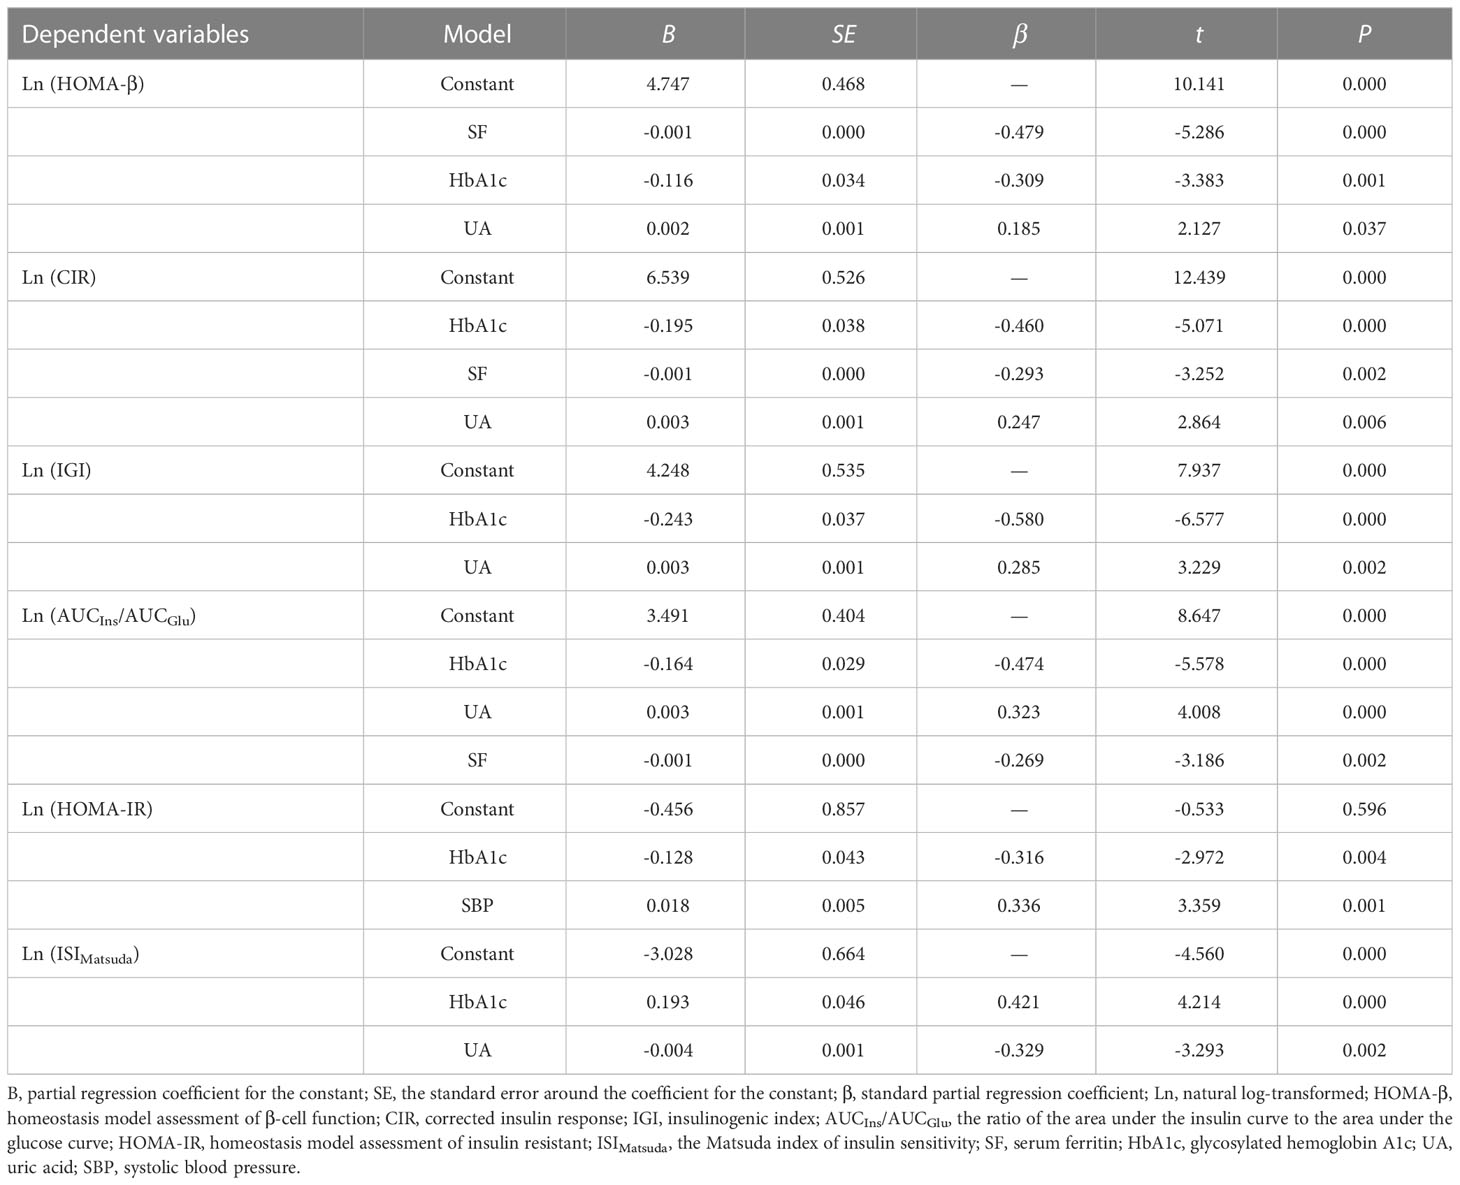
Table 5 Multivariate stepwise regression analysis for β-cell function or insulin sensitivity and related factors in women.
4 Discussion
In this study, we analyzed the SF levels of patients with newly diagnosed T2DM and healthy controls, and the correlation between pancreatic β-cell function or insulin sensitivity and systemic iron status (reflected by the four iron biomarkers) in patients with newly diagnosed T2DM. The study provides evidence that SF levels (a marker of iron stores) in patients with newly diagnosed T2DM were significantly higher than in healthy controls, and the SI and TS levels were higher in male than in female diabetic patients. Multiple stepwise regression analysis suggested that Trf was an independent protective factor against β-cell functional impairment in male patients with newly diagnosed T2DM, while SF was an independent risk factor in female patients. Systemic iron status did not independently affect insulin sensitivity.
T2DM is a progressive metabolic disorder characterized by insulin resistance and β-cell dysfunction. The onset of β-cell dysfunction has been considered a late event in the pathogenesis of diabetes. In a previous study, we showed that the median level of HOMA-β was 103.56 in Chinese healthy controls (24). In this study, HOMA-β was found to be significantly decreased in patients with newly diagnosed T2DM, suggesting that the decline in β-cell function may be an early event. Whether impaired β-cell function at an early stage is associated with abnormal iron metabolism is unknown. Other studies describing the correlation between iron metabolism and T2DM were inconsistent among genders and races. SF concentrations were significantly higher in women with diabetes than in women without diabetes in all racial/ethnic groups, but the concentrations were significantly lower in Asian men with diabetes than in those without diabetes (25). In this study, the SF concentrations were significantly higher in the patients with newly diagnosed T2DM than in the healthy controls, but there was no difference in SF levels between men and women. In addition, the median levels of SI, Trf, and TS in patients with newly diagnosed T2DM were in the normal range, but the levels of SI and TS were higher in men than in women, and the percentage of Trf levels below normal values was lower in male than in female patients. Therefore, abnormal iron metabolism in patients with newly diagnosed T2DM is characterized by increased SF levels, suggesting that iron storage is increased at the early stage of T2DM.
SF levels were elevated in patients with T2DM, and increased SF levels were associated with an increased risk of diabetes (18). However, whether this association can be explained by impaired β-cell function, reduced insulin sensitivity, or both has not been fully confirmed. Recently, a small sample study of adult men showed that SF and hepcidin (the central regulator of iron homeostasis, which can regulate plasma iron concentrations) levels were significantly increased in patients with newly diagnosed T2DM, and there was a positive correlation between SF levels and HOMA-IR (21). Consistent with the previous study, we also observed that the SF levels in patients with newly diagnosed T2DM were significantly higher than in healthy controls, suggesting that patients with T2DM may have iron overload. Further multivariate stepwise regression analysis showed that SF was an independent risk factor for impaired β-cell function in female patients with newly diagnosed T2DM, indicating that increased iron storage might interact with other genetic and environmental factors, thus impairing β-cell function and affecting insulin secretion. However, the SF levels were not related to insulin sensitivity. There are several possible reasons for the discrepancy between the results of this study and the previous publication, including differences in the ethnicity of the present study’s population, sample size, and functional features of β-cell at the time of diabetes diagnosis.
Trf, another marker of iron status, is the major serum iron-binding and -transport protein (26). Increased systemic iron status has been associated with increased levels of SI, SF, and TS, as well as decreased levels of Trf (27). It has been proposed that Trf is an antioxidant, as it binds and prevents free iron from participating in the Fenton reaction (28). Genetically instrumented Trf was inversely associated with T2DM in the Chinese population (9), and a low serum Trf concentration was associated with diabetic end-stage renal disease in Chinese patients with T2DM (29). However, an increase in SF and Trf predicted insulin resistance and new onset T2DM in non-T2DM subjects in a European population (17, 30, 31), and Trf was positively associated with incident T2DM in Koreans (32). Thus, the results of previous studies were contradictory. In this study, we analyzed the correlation between Trf and β-cell function or insulin sensitivity, and demonstrated that Trf exerted an independent protective effect on β-cell function in male patients with newly diagnosed T2DM.
TS levels reflect the levels of non-transferrin-bound iron, which is considered an important source of iron deposition and toxicity in organs (33, 34). However, the results from existing perspective studies on the relationship between TS and T2DM are contradictory. A study that used data from the National Health and Nutrition Examination Survey did not find any association between TS and T2DM (35). A study performed in men showed that TS levels were similar in diabetics, prediabetics, and control subjects (21). In contrast, a meta-analysis of three Danish studies found that TS ≥50% was associated with a higher risk of T2DM (36). However, a prospective study showed that elevated TS levels are associated with a lower risk of T2DM, which was statistically significant only in women (17). In the present study, bivariate correlational analysis revealed a negative correlation of TS with β-cell function and a positive association with insulin sensitivity, but these correlations were not observed in multiple stepwise regression analysis. The results suggest that the association between increased iron absorption or higher non-transferrin-bound iron and T2DM is complex. Therefore, large-scale population-based prospective studies are needed to elucidate this issue.
Free iron has the ability to generate reactive oxygen species, which may lead to increased oxidative stress and cell damage. Therefore, excessive free iron may be potentially hazardous (37). Pancreatic β cells are vulnerable to oxidative stress because their antioxidant defense mechanisms are particularly weak (38). Although adequate iron is critical to normal β-cell function and glucose homeostasis, studies have suggested that excessive iron may disrupt glucose homeostasis through several potential mechanisms. For example, oxidative stress caused by excessive iron accumulation leads to β-cell damage and apoptosis, resulting in reduced insulin secretion (39). However, high iron storage in the liver may induce insulin resistance by impairing insulin signal transduction and attenuating the liver’s ability to extract insulin (40). In the present study, we found that iron overload had a more profound effect on β-cell function, rather than insulin sensitivity. We speculated that the precise effect of iron overload on pancreatic β cells may depend largely on the main site of iron accumulation, which needs to be verified in animal models in the future.
The molecular mechanisms underlying the observed associations of impaired β-cell function with iron status are now being elucidated. The direct consequence of intracellular iron overload is that its entry into mitochondria can depolarize the organelle membrane potential, which affects the electron transport chain and the energy supply of insulin release (41, 42). In addition, iron and the iron-sulfur (Fe-S) cluster influence each other, causing mitochondrial iron accumulation, more reactive oxygen species (ROS) production, endoplasmic reticulum (ER) stress, failure in biosynthesis of insulin, and ferroptosis in β-cells (43). In addition, ROS directly impair insulin synthesis and secretion during the development of T2DM (44). Another mechanism by which iron overload may affect β-cell function and survival is through amylin. Heme can bind to amylin to form a complex, which leads to the formation of H2O2 via oxidative stress (45, 46), thus promoting ROS-mediated β-cell failure. Recently, Stancic et al. also demonstrated that high glucose, H2O2, and streptozotocin (STZ) caused the accumulation of lipofuscin, which is formed due to iron-catalyzed oxidative processes, and serves as a reservoir of metal ions (including iron), releases in its reactive form and thus promotes ROS generation and consequently β-cell ferroptosis (47). Taken together, iron accumulation is associated with insulin secretion dysfunction in pancreatic β cells.
The strength of this study is that we focused on patients with newly diagnosed T2DM and evaluated the relative contributions of systemic iron status (including SI, SF, Trf, and TS) to pancreatic β-cell function and insulin sensitivity. However, several limitations must be acknowledged. First, this was a single-center, retrospective study, in which we were unable to establish a definitive causal connection between increased SF levels and impaired β-cell function. Second, the relatively small sample size might not provide sufficient statistical power to determine small-scale associations and potential interactions; thus, a population-based prospective cohort study with a large sample size is needed. Finally, the study was conducted among Chinese populations, and future studies in more racially or ethnically diverse populations are warranted.
5 Conclusions
In summary, this is the first study on the relationship between systemic iron metabolism and β-cell function and insulin sensitivity in Chinese patients with newly diagnosed T2DM. We observed that SF levels in patients with newly diagnosed T2DM were significantly increased, and the SI and TS levels were higher in male patients than in female patients, although the median concentrations of SI and TS were in the normal range. We then demonstrated that Trf was an independent protective factor against β-cell functional impairment in male patients with newly diagnosed T2DM, while SF was an independent risk factor in women. Future studies should focus on demonstrating this relationship in various populations with different ethnic backgrounds, as well as the possible potential mechanisms, thus providing new insights into underlying strategies for the prevention and treatment of T2DM.
Data availability statement
The raw data supporting the conclusions of this article will be made available by the authors, without undue reservation.
Ethics statement
The studies involving human participants were reviewed and approved by the First Affiliated Hospital of Nanjing Medical University. The patients/participants provided their written informed consent to participate in this study.
Author contributions
Conceptualization, MZ; methodology, LQ, QW, XC and CY; formal analysis and data curation, YQ and YH; Writing - original draft preparation, YQ and YL; Writing - review & editing, MZ; funding acquisition, YQ and MZ. All authors contributed to the article and approved the submitted version.
Funding
This study was supported by the National Natural Science Foundation of China (81974103, 82000747) and Jiangsu Provincial Medical Key Discipline (Laboratory) (ZDXK202202). The funders had no role in the study design, the data collection and analysis, the decision to publish, or the manuscript preparation.
Conflict of interest
The authors declare that the research was conducted in the absence of any commercial or financial relationships that could be construed as a potential conflict of interest.
Publisher’s note
All claims expressed in this article are solely those of the authors and do not necessarily represent those of their affiliated organizations, or those of the publisher, the editors and the reviewers. Any product that may be evaluated in this article, or claim that may be made by its manufacturer, is not guaranteed or endorsed by the publisher.
References
1. Zheng Y, Ley SH, Hu FB. Global aetiology and epidemiology of type 2 diabetes mellitus and its complications. Nat Rev Endocrinol (2018) 14:88–98. doi: 10.1038/nrendo.2017.151
2. Guillausseau PJ, Meas T, Virally M, Laloi-Michelin M, Médeau V, Kevorkian JP. Abnormalities in insulin secretion in type 2 diabetes mellitus. Diabetes Metab (2008) 34 Suppl 2:S43–8. doi: 10.1016/S1262-3636(08)73394-9
3. Dymock IW, Cassar J, Pyke DA, Oakley WG, Williams R. Observations on the pathogenesis, complications and treatment of diabetes in 115 cases of haemochromatosis. Am J Med (1972) 52:203–10. doi: 10.1016/0002-9343(72)90070-8
4. Bannerman RM, Keusch G, Kreimer-Birnbaum M, Vance VK, Vaughan S. Thalassemia intermedia, with iron overload, cardiac failure, diabetes mellitus, hypopituitarism and porphyrinuria. Am J Med (1967) 42:476–86. doi: 10.1016/0002-9343(67)90276-8
5. Simcox JA, McClain DA. Iron and diabetes risk. Cell Metab (2013) 17:329–41. doi: 10.1016/j.cmet.2013.02.007
6. Aregbesola A, de Mello VDF, Lindstrom J, Voutilainen S, Virtanen JK, Keinanen-Kiukaanniemi S, et al. Serum adiponectin/Ferritin ratio in relation to the risk of type 2 diabetes and insulin sensitivity. Diabetes Res Clin Pract (2018) 141:264–74. doi: 10.1016/j.diabres.2018.05.012
7. Stordal K, McArdle HJ, Hayes H, Tapia G, Viken MK, Lund-Blix NA, et al. Prenatal iron exposure and childhood type 1 diabetes. Sci Rep (2018) 8:9067. doi: 10.1038/s41598-018-27391-4
8. Chaudhary K, Promsote W, Ananth S, Veeranan-Karmegam R, Tawfik A, Arjunan P, et al. Iron overload accelerates the progression of diabetic retinopathy in association with increased retinal renin expression. Sci Rep (2018) 8:3025. doi: 10.1038/s41598-018-21276-2
9. Wang X, Fang X, Zheng W, Zhou J, Song Z, Xu M, et al. Genetic support of a causal relationship between iron status and type 2 diabetes: A mendelian randomization study. J Clin Endocrinol Metab (2021) 106:e4641–e51. doi: 10.1210/clinem/dgab454
10. Wongjaikam S, Kumfu S, Chattipakorn SC, Fucharoen S, Chattipakorn N. Current and future treatment strategies for iron overload cardiomyopathy. Eur J Pharmacol (2015) 765:86–93. doi: 10.1016/j.ejphar.2015.08.017
11. Datz C, Felder TK, Niederseer D, Aigner E. Iron homeostasis in the metabolic syndrome. Eur J Clin Invest (2013) 43:215–24. doi: 10.1111/eci.12032
12. Abraham D, Rogers J, Gault P, Kushner JP, McClain DA. Increased insulin secretory capacity but decreased insulin sensitivity after correction of iron overload by phlebotomy in hereditary haemochromatosis. Diabetologia (2006) 49:2546–51. doi: 10.1007/s00125-006-0445-7
13. Cooksey RC, Jones D, Gabrielsen S, Huang J, Simcox JA, Luo B, et al. Dietary iron restriction or iron chelation protects from diabetes and loss of beta-cell function in the obese (ob/ob lep-/-) mouse. Am J Physiol Endocrinol Metab (2010) 298:E1236–43. doi: 10.1152/ajpendo.00022.2010
14. Chen L, Li Y, Zhang F, Zhang S, Zhou X, Ji L. Association of serum ferritin levels with metabolic syndrome and insulin resistance in a Chinese population. J Diabetes Complications (2017) 31:364–68. doi: 10.1016/j.jdiacomp.2016.06.018
15. Nakamura K, Sakurai M, Morikawa Y, Nagasawa SY, Miura K, Ishizaki M, et al. Serum ferritin, insulin resistance, and beta-cell dysfunction: A prospective study in normoglycemic Japanese men. Exp Clin Endocrinol Diabetes (2017) 125:12–20. doi: 10.1055/s-0042-118175
16. Bonfils L, Ellervik C, Friedrich N, Linneberg A, Sandholt CH, Jorgensen ME, et al. Fasting serum levels of ferritin are associated with impaired pancreatic beta cell function and decreased insulin sensitivity: a population-based study. Diabetologia (2015) 58:523–33. doi: 10.1007/s00125-014-3469-4
17. Podmore C, Meidtner K, Schulze MB, Scott RA, Ramond A, Butterworth AS, et al. Association of multiple biomarkers of iron metabolism and type 2 diabetes: The EPIC-InterAct study. Diabetes Care (2016) 39:572–81. doi: 10.2337/dc15-0257
18. Liu J, Li Q, Yang Y, Ma L. Iron metabolism and type 2 diabetes mellitus: A meta-analysis and systematic review. J Diabetes Investig (2020) 11:946–55. doi: 10.1111/jdi.13216
19. Diaz-Lopez A, Iglesias-Vazquez L, Palleja-Millan M, Rey Renones C, Flores Mateo G, Arija V. Association between iron status and incident type 2 diabetes: A population-based cohort study. Nutrients (2020) 12:3249. doi: 10.3390/nu12113249
20. Swaminathan S, Fonseca VA, Alam MG, Shah SV. The role of iron in diabetes and its complications. Diabetes Care (2007) 30:1926–33. doi: 10.2337/dc06-2625
21. Venkatesan P, Varghese J, Arthi TS, James JV, Anura A, Prasad J, et al. Evidence of dysregulated iron homeostasis in newly diagnosed diabetics, but not in pre-diabetics. J Diabetes Complications (2021) 35:107977. doi: 10.1016/j.jdiacomp.2021.107977
22. Haffner SM, Miettinen H, Stern MP. The homeostasis model in the San Antonio heart study. Diabetes Care (1997) 20:1087–92. doi: 10.2337/diacare.20.7.1087
23. Matsuda M, DeFronzo RA. Insulin sensitivity indices obtained from oral glucose tolerance testing: comparison with the euglycemic insulin clamp. Diabetes Care (1999) 22:1462–70. doi: 10.2337/diacare.22.9.1462
24. Gong Z, Qin Y, Wang Y, Liu X, Jiang L, Cui D, et al. Beta-cell function and insulin sensitivity contributions on incident diabetes in patients with endogenous cushing's syndrome. Diabetes Res Clin Pract (2022) 190:109994. doi: 10.1016/j.diabres.2022.109994
25. Acton RT, Barton JC, Passmore LV, Adams PC, Speechley MR, Dawkins FW, et al. Relationships of serum ferritin, transferrin saturation, and HFE mutations and self-reported diabetes in the hemochromatosis and iron overload screening (HEIRS) study. Diabetes Care (2006) 29:2084–9. doi: 10.2337/dc05-1592
26. Gkouvatsos K, Papanikolaou G, Pantopoulos K. Regulation of iron transport and the role of transferrin. Biochim Biophys Acta (2012) 1820:188–202. doi: 10.1016/j.bbagen.2011.10.013
27. Wish JB. Assessing iron status: beyond serum ferritin and transferrin saturation. Clin J Am Soc Nephrol (2006) 1(Suppl 1):S4–8. doi: 10.2215/CJN.01490506
28. Elsayed ME, Sharif MU, Stack AG. Transferrin saturation: A body iron biomarker. Adv Clin Chem (2016) 75:71–97. doi: 10.1016/bs.acc.2016.03.002
29. Zhao L, Zou Y, Zhang J, Zhang R, Ren H, Li L, et al. Serum transferrin predicts end-stage renal disease in type 2 diabetes mellitus patients. Int J Med Sci (2020) 17:2113–24. doi: 10.7150/ijms.46259
30. Wlazlo N, van Greevenbroek MM, Ferreira I, Jansen EH, Feskens EJ, van der Kallen CJ, et al. Iron metabolism is prospectively associated with insulin resistance and glucose intolerance over a 7-year follow-up period: The CODAM study. Acta Diabetol (2015) 52:337–48. doi: 10.1007/s00592-014-0646-3
31. Huth C, Beuerle S, Zierer A, Heier M, Herder C, Kaiser T, et al. Biomarkers of iron metabolism are independently associated with impaired glucose metabolism and type 2 diabetes: the KORA F4 study. Eur J Endocrinol (2015) 173:643–53. doi: 10.1530/EJE-15-0631
32. Kim JD, Lim DM, Park KY, Park SE, Rhee EJ, Park CY, et al. Serum transferrin predicts new-onset type 2 diabetes in koreans: A 4-year retrospective longitudinal study. Endocrinol Metab (Seoul) (2020) 35:610–17. doi: 10.3803/EnM.2020.721
33. Fleming RE, Ponka P. Iron overload in human disease. N Engl J Med (2012) 366:348–59. doi: 10.1056/NEJMra1004967
34. Brissot P, Ropert M, Le Lan C, Loreal O. Non-transferrin bound iron: a key role in iron overload and iron toxicity. Biochim Biophys Acta (2012) 1820:403–10. doi: 10.1016/j.bbagen.2011.07.014
35. Mainous AG 3rd, King DE, Pearson WS, Garr DR. Is an elevated serum transferrin saturation associated with the development of diabetes? J Fam Pract (2002) 51:933–6.
36. Ellervik C, Mandrup-Poulsen T, Andersen HU, Tybjaerg-Hansen A, Frandsen M, Birgens H, et al. Elevated transferrin saturation and risk of diabetes: three population-based studies. Diabetes Care (2011) 34:2256–8. doi: 10.2337/dc11-0416
37. Hansen JB, Moen IW, Mandrup-Poulsen T. Iron: the hard player in diabetes pathophysiology. Acta Physiol (Oxf) (2014) 210:717–32. doi: 10.1111/apha.12256
38. Lenzen S. Oxidative stress: The vulnerable beta-cell. Biochem Soc Trans (2008) 36:343–7. doi: 10.1042/BST0360343
39. Cooksey RC, Jouihan HA, Ajioka RS, Hazel MW, Jones DL, Kushner JP, et al. Oxidative stress, beta-cell apoptosis, and decreased insulin secretory capacity in mouse models of hemochromatosis. Endocrinology (2004) 145:5305–12. doi: 10.1210/en.2004-0392
40. Fernandez-Real JM, McClain D, Manco M. Mechanisms linking glucose homeostasis and iron metabolism toward the onset and progression of type 2 diabetes. Diabetes Care (2015) 38:2169–76. doi: 10.2337/dc14-3082
41. Nam E, Han J, Suh JM, Yi Y, Lim MH. Link of impaired metal ion homeostasis to mitochondrial dysfunction in neurons. Curr Opin Chem Biol (2018) 43:8–14. doi: 10.1016/j.cbpa.2017.09.009
42. Gerencser AA. Metabolic activation-driven mitochondrial hyperpolarization predicts insulin secretion in human pancreatic beta-cells. Biochim Biophys Acta Bioenerg (2018) 1859:817–28. doi: 10.1016/j.bbabio.2018.06.006
43. Sha W, Hu F, Xi Y, Chu Y, Bu S. Mechanism of ferroptosis and its role in type 2 diabetes mellitus. J Diabetes Res (2021) 2021:9999612. doi: 10.1155/2021/9999612
44. Rehman K, Akash MSH. Mechanism of generation of oxidative stress and pathophysiology of type 2 diabetes mellitus: How are they interlinked? J Cell Biochem (2017) 118:3577–85. doi: 10.1002/jcb.26097
45. Seal M, Mukherjee S, Dey SG. Fe-oxy adducts of heme-abeta and heme-hIAPP complexes: intermediates in ROS generation. Metallomics (2016) 8:1266–72. doi: 10.1039/c6mt00214e
46. Mukherjee S, Dey SG. Heme bound amylin: spectroscopic characterization, reactivity, and relevance to type 2 diabetes. Inorg Chem (2013) 52:5226–35. doi: 10.1021/ic4001413
Keywords: type 2 diabetes, β-cell function, serum ferritin, transferrin, iron
Citation: Qin Y, Huang Y, Li Y, Qin L, Wei Q, Chen X, Yang C and Zhang M (2023) Association between systemic iron status and β-cell function and insulin sensitivity in patients with newly diagnosed type 2 diabetes. Front. Endocrinol. 14:1143919. doi: 10.3389/fendo.2023.1143919
Received: 13 January 2023; Accepted: 14 March 2023;
Published: 03 April 2023.
Edited by:
Xiaopei Cao, First Affiliated Hospital, ChinaReviewed by:
Milica B. Markelic, Faculty of Biology, University of Belgrade, SerbiaYifan Bu, Beth Israel Deaconess Medical Center and Harvard Medical School, United States
Muhammad Sajid Hamid Akash, Government College University, Faisalabad, Pakistan
Copyright © 2023 Qin, Huang, Li, Qin, Wei, Chen, Yang and Zhang. This is an open-access article distributed under the terms of the Creative Commons Attribution License (CC BY). The use, distribution or reproduction in other forums is permitted, provided the original author(s) and the copyright owner(s) are credited and that the original publication in this journal is cited, in accordance with accepted academic practice. No use, distribution or reproduction is permitted which does not comply with these terms.
*Correspondence: Mei Zhang, emhhbmdtZWlAbmptdS5lZHUuY24=
†These authors have contributed equally to this work