 Máté Hajdu1
 Konstandia Garmpis1Vivien Vértes1Noémi Vorobcsuk-Varga2
 Gergő Attila Molnár3László Hejjel1István Wittmann3
 Réka Faludi1*
- 1Heart Institute, Medical School, University of Pécs, Pécs, Hungary
- 2Medicover Clinic, Pécs, Hungary
- 32nd Department of Internal Medicine and Nephrological Center, Medical School, University of Pécs, Pécs, Hungary
Background: Evaluation of heart rate variability (HRV) detects the early subclinical alterations of the autonomic nervous system. Thus, impaired HRV is the earliest subclinical marker of cardiac autonomic neuropathy (CAN) in type 1 diabetes mellitus (T1DM).
Objectives: We aimed to explore the HRV parameters in asymptomatic T1DM patients and compare them with the results obtained in healthy subjects. Potential associations between HRV parameters and the established risk factors for CAN and cardiovascular diseases were also investigated.
Methods: Seventy T1DM patients (38 ± 12 years, 46 females) and 30 healthy subjects were enrolled into the study. For HRV analysis, beat-to-beat heart rate was recorded for 30 min. The less noisy 5-min segment of the recording was analyzed by Bittium Cardiac Navigator HRV analysis software. Time domain, frequency domain, and nonlinear indices were calculated.
Results: Regarding ratio of low to high frequency component (LF/HF), no differences were found between the two populations (p = 0.227). All the further, time domain, frequency domain, and nonlinear HRV indices were significantly lower in T1DM patients (each p < 0.001). In multiple linear models, disease duration remained the only independent predictor of LF/HF ratio (p = 0.019). HbA1c was found to be significant independent predictor of all further time domain (SDNN, p < 0.001; rMSSD, p < 0.001), frequency domain (VLF, p < 0.001; LF, p = 0.002; HF, p = 0.006; Total Power, p = 0.002), and nonlinear indices (SD1, p = 0.006; SD2, p = 0.007), alone, or in combination with other factors, such as age or body mass index.
Conclusion: Asymptomatic T1DM patients have significantly reduced overall HRV as compared with healthy subjects, indicating subclinical CAN. Quality of the glycemic control is important determinant of HRV among T1DM patients. This relationship is independent of other risk factors for CAN or cardiovascular diseases.
Introduction
Type 1 diabetes mellitus (T1DM) is one of the most common chronic conditions, which affect the young adult population. Various micro- and macrovascular complications are frequent in this disease, resulting in at least 10-fold increase in cardiovascular morbidities as compared with age-matched healthy persons (1, 2). Cardiac autonomic neuropathy (CAN) is a consequence of the diabetes and is defined as the impairment of the cardiovascular autonomic control (3). It is one of the most neglected long-term complications of diabetes, remaining subclinical until late stages of the disease (4). Diabetic patients with CAN have a 3.4 times higher risk of mortality than patients without CAN (5). It has been proved that, in T1DM, major risk factors for CAN are age, duration of diabetes, glycemic control, systemic hypertension, dyslipidemia, obesity, smoking habits, and the existence of diabetic microvascular complications (nephropathy or microalbuminuria and retinopathy) (6–9).
Evaluation of heart rate variability (HRV) detects the early subclinical alterations of the autonomic nervous system. Thus, impaired HRV is the earliest subclinical marker of CAN in asymptomatic patients with T1DM (3, 4, 10, 11). Reduced HRV has already been reported in T1DM patients (12–15). In addition, it has been proved that major risk factors for CAN are significant determinants of the reduced HRV in this disease (16–19). These data, however, are limited and controversial.
Thus, we aimed to explore the HRV parameters in asymptomatic T1DM patients and compare them with the results obtained in healthy subjects. Potential correlations between HRV indices and the established risk factors for CAN and cardiovascular diseases were also investigated.
Materials and methods
Study population
Seventy-five asymptomatic T1DM patients without known cardiovascular disease were enrolled into our prospective investigation. Blood sampling for serum glycated hemoglobin (HbA1c%) and for other laboratory markers was performed within a 30-day period before enrollment. Thorough medical history was collected. Echocardiographic data were obtained by Philips Epiq 7 ultrasound system (Philips Healthcare, Best, the Netherlands). Treadmill stress test was performed using Bruce protocol. The exclusion criteria were as follows: atrial fibrillation, known diseases of the coronary— Coronary artery disease (CAD), or peripheral arteries, clinical diabetic nephropathy [macroalbuminuria (≥ 300 mg/day) and/or eGFR (estimated glomerular filtration rate) < 60 ml/min/1.73 m2] or retinopathy, impaired left ventricular systolic function (ejection fraction < 55%), significant valvular heart disease, echocardiographic suspicion of primary cardiomyopathies, abnormal treadmill stress test result indicative of CAD. Smokers, patients treated with angiotensin-converting enzyme (ACE) inhibitors/angiotensin receptor blockers (ARBs) as part of the standard care of diabetic nephropathy, or patients with well-controlled hypertension were not excluded.
Thirty age- and gender-matched healthy individuals without diabetes and any signs or symptoms of cardiovascular diseases were recruited as control population. Echocardiography and treadmill stress test were performed accordingly. The exclusion criteria were as follows: atrial fibrillation, impaired left ventricular systolic function (ejection fraction < 55%), significant valvular heart disease, echocardiographic suspicion of hypertension or primary cardiomyopathies, and abnormal treadmill stress test result indicative of CAD. Former or current smokers and volunteers with known dyslipidemia were not excluded from the study.
Subjects who have never smoked or who have smoked less than 100 cigarettes during their life were interpreted as non-smokers. Former smokers: subjects who have smoked at least 100 cigarettes in their lifetime but who had quit smoking at the time of the inclusion (quitted > 30 days ago). Current smokers were defined as having smoked at least 100 cigarettes during their life and still smoke cigarettes (20).
The study complied with the Declaration of Helsinki. The protocol was approved by the institutional ethics committee. Written informed consent was given by all participants before study inclusion.
Assessment of HRV
Participants were asked to abstain from heavy exercise, alcohol, or caffeinated drinks within a day prior to the visit. Data were collected on standard room temperature, in the early afternoon period, minimizing the impact of the circadian rhythm. Participants were placed on a table in supine position, and requested to breathe at a normal pace, remain at rest, but awake and avoid conversation. Following a 15-min orthostatic adaptation period, beat-to-beat electrocardiogram (ECG) was recorded by Bittium Faros 360 ECG sensor (Bittium Corporation, Oulu, Finland) for 30 min. Records were visually inspected to avoid premature beats and artifacts. HRV parameters were obtained from the less noisy 5-min segment of the ECG recording by Bittium Cardiac Navigator HRV analysis software (Bittium Corporation, Oulu, Finland). Only samples with more than 95% of sinus beats were evaluated.
Time-domain indices were calculated including SDNN (standard deviation of the normal–normal intervals) and rMSSD (root mean square differences of successive normal–normal intervals).
Standard frequency-domain indices were computed by fast Fourier transformation: very low-frequency component or VLF (< 0.04 Hz), low-frequency component or LF (0.04 Hz–0.15 Hz), and high-frequency component or HF (0.15 Hz–0.4 Hz). In addition, the Total Power of the spectrum and the ratio of low to high frequency component (LF/HF) were calculated.
Nonlinear indices were provided by Poincaré plot analysis. Poincaré plot represents the RRi+1 interval as a function of the previous RRi interval. SD1 and SD2 reflect the dispersion along minor and major axis of the fitted ellipse, respectively (21, 22).
Statistical analysis
Categorical data were expressed as n (%). The frequencies of categorical parameters were compared by chi-square test. Normality of data was tested using Shapiro–Wilk test. Continuous variables with Gaussian distribution were reported as mean ± standard deviation (SD), whereas data whose normality was not confirmed were presented as median [interquartile range (IQR)]. Between-group comparisons were performed by independent samples Student’s t-test for normally distributed variables or by Mann-Whitney U test for variables not normally distributed.
Since HRV parameters did not display normal distribution, logarithmic transformation (ln) was implemented before applying linear regression analysis. Univariate predictors of the HRV parameters were determined by linear regression analysis. In a second step, multiple stepwise linear regression analysis was used. Variables with p < 0.1 on univariate analysis were incorporated into the multiple models. Variance inflation factor values > 2.5 were recognized indicative of collinearity. Partial regression plots (which displays the residuals of each variable after adjusting for the other variables in the multiple model) were used to visualize the correlations between risk factors and HRV indices. Partial correlation coefficients were reported on the plots.
p < 0.05 was considered significant. Statistical analysis was completed using IBM SPSS Statistics 27 software (IBM Corporation, Armonk, NY, USA).
Results
Of a total of 75 patients, 70 (38 ± 12 years, 46 females) were eligible for the study. In four individuals, echocardiography was not feasible, due to poor acoustic windows. In one patient, significant ST segment changes detected during stress test were indicative of CAD. Subsequently, this diagnosis was verified by coronary angiography. HRV analysis was feasible in all patients.
Echocardiographic data of the study population have already been reported (23). Detailed clinical and laboratory characteristics of the T1DM patients are exhibited in Table 1. Altogether, 20 subjects were treated with antihypertensive drugs.
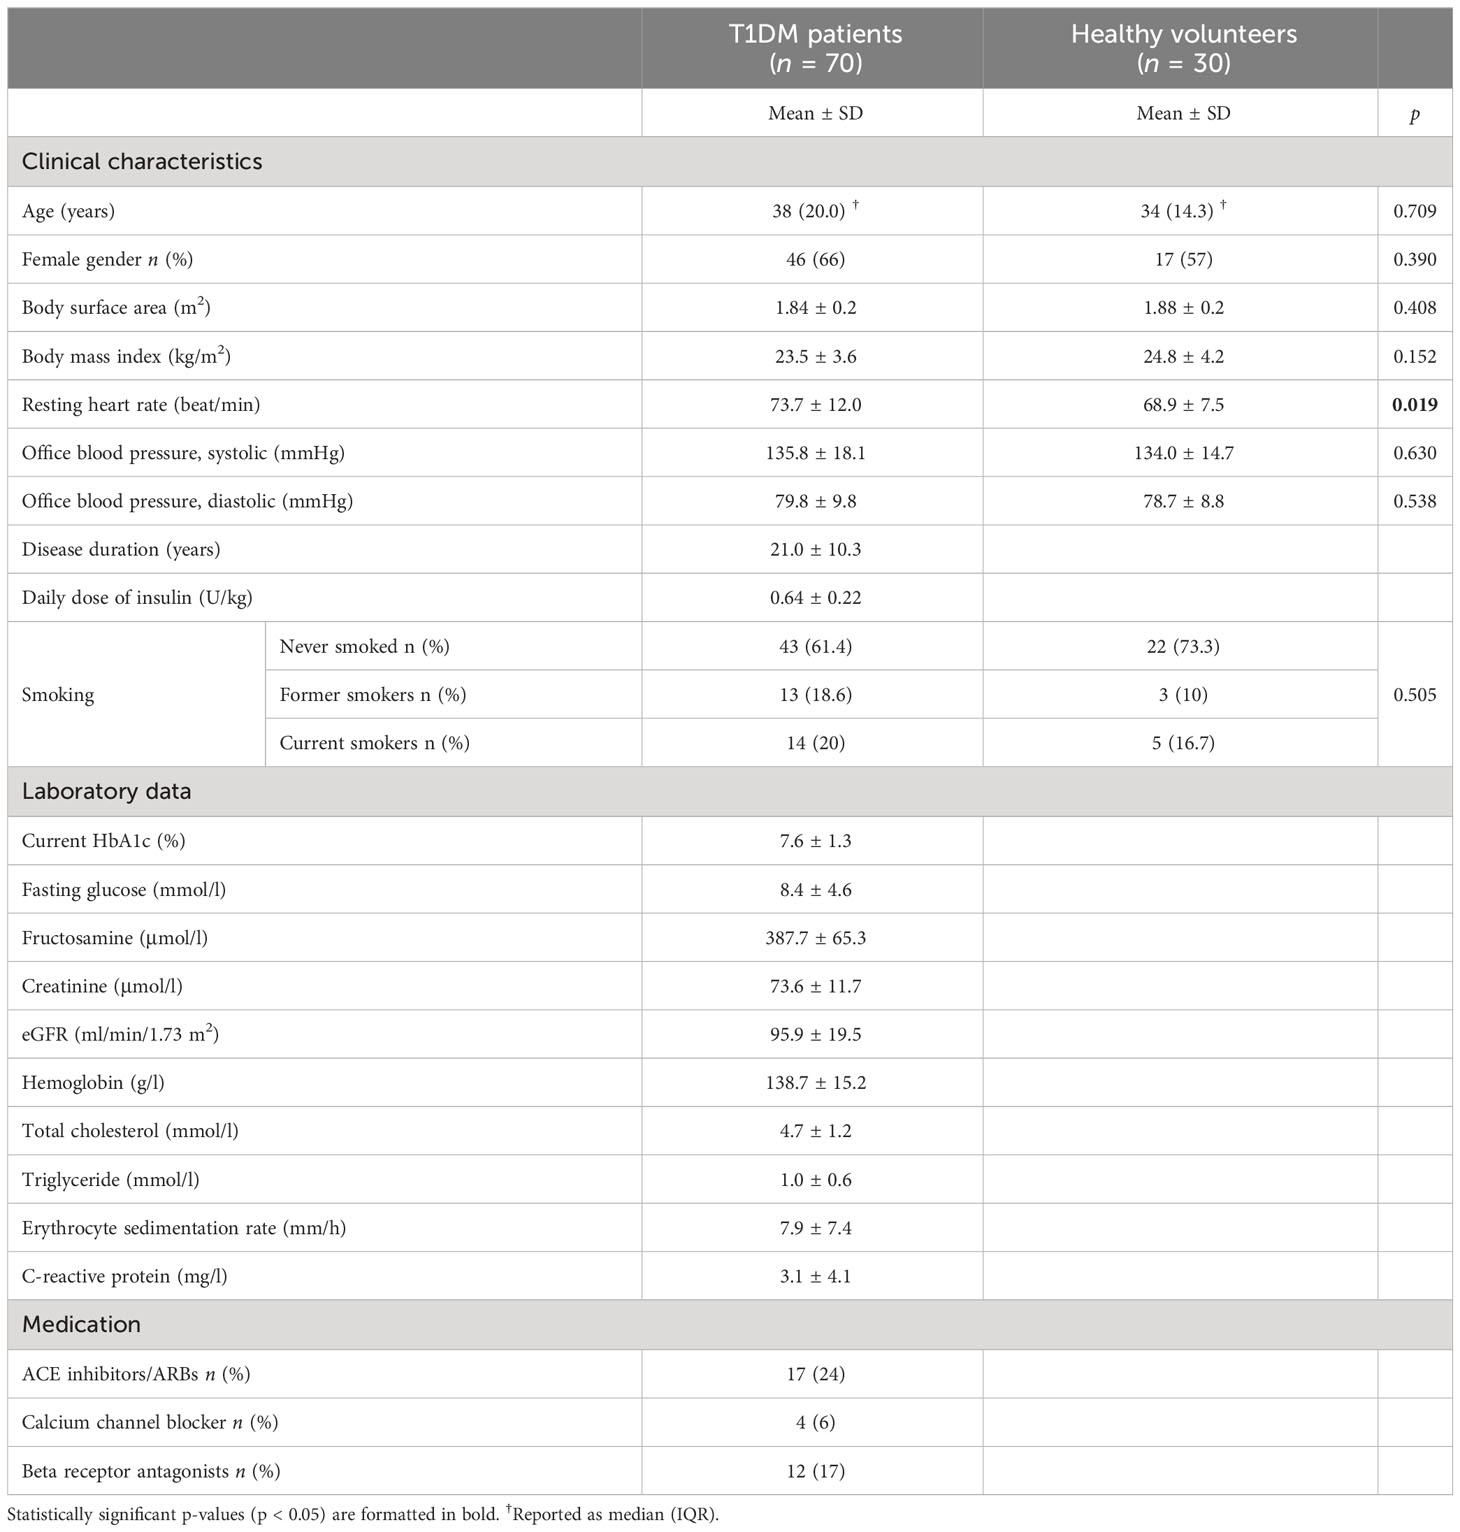
Table 1 Clinical data of the T1DM population and comparison with healthy subjects.
Comparison with healthy subjects
Patients and volunteers were matched for age, gender, body surface area, body mass index (BMI), office blood pressure, and smoking habits. Resting heart rate was significantly higher in T1DM patients compared to healthy individuals. This discrepancy, however, was clinically not remarkable.
HRV parameters of the T1DM patients and their comparison with those in healthy persons are displayed in Figure 1. Regarding LF/HF ratio, no differences were found between the two populations. Further time domain, frequency-domain, and nonlinear parameters of the HRV, however, were significantly lower in T1DM patients.
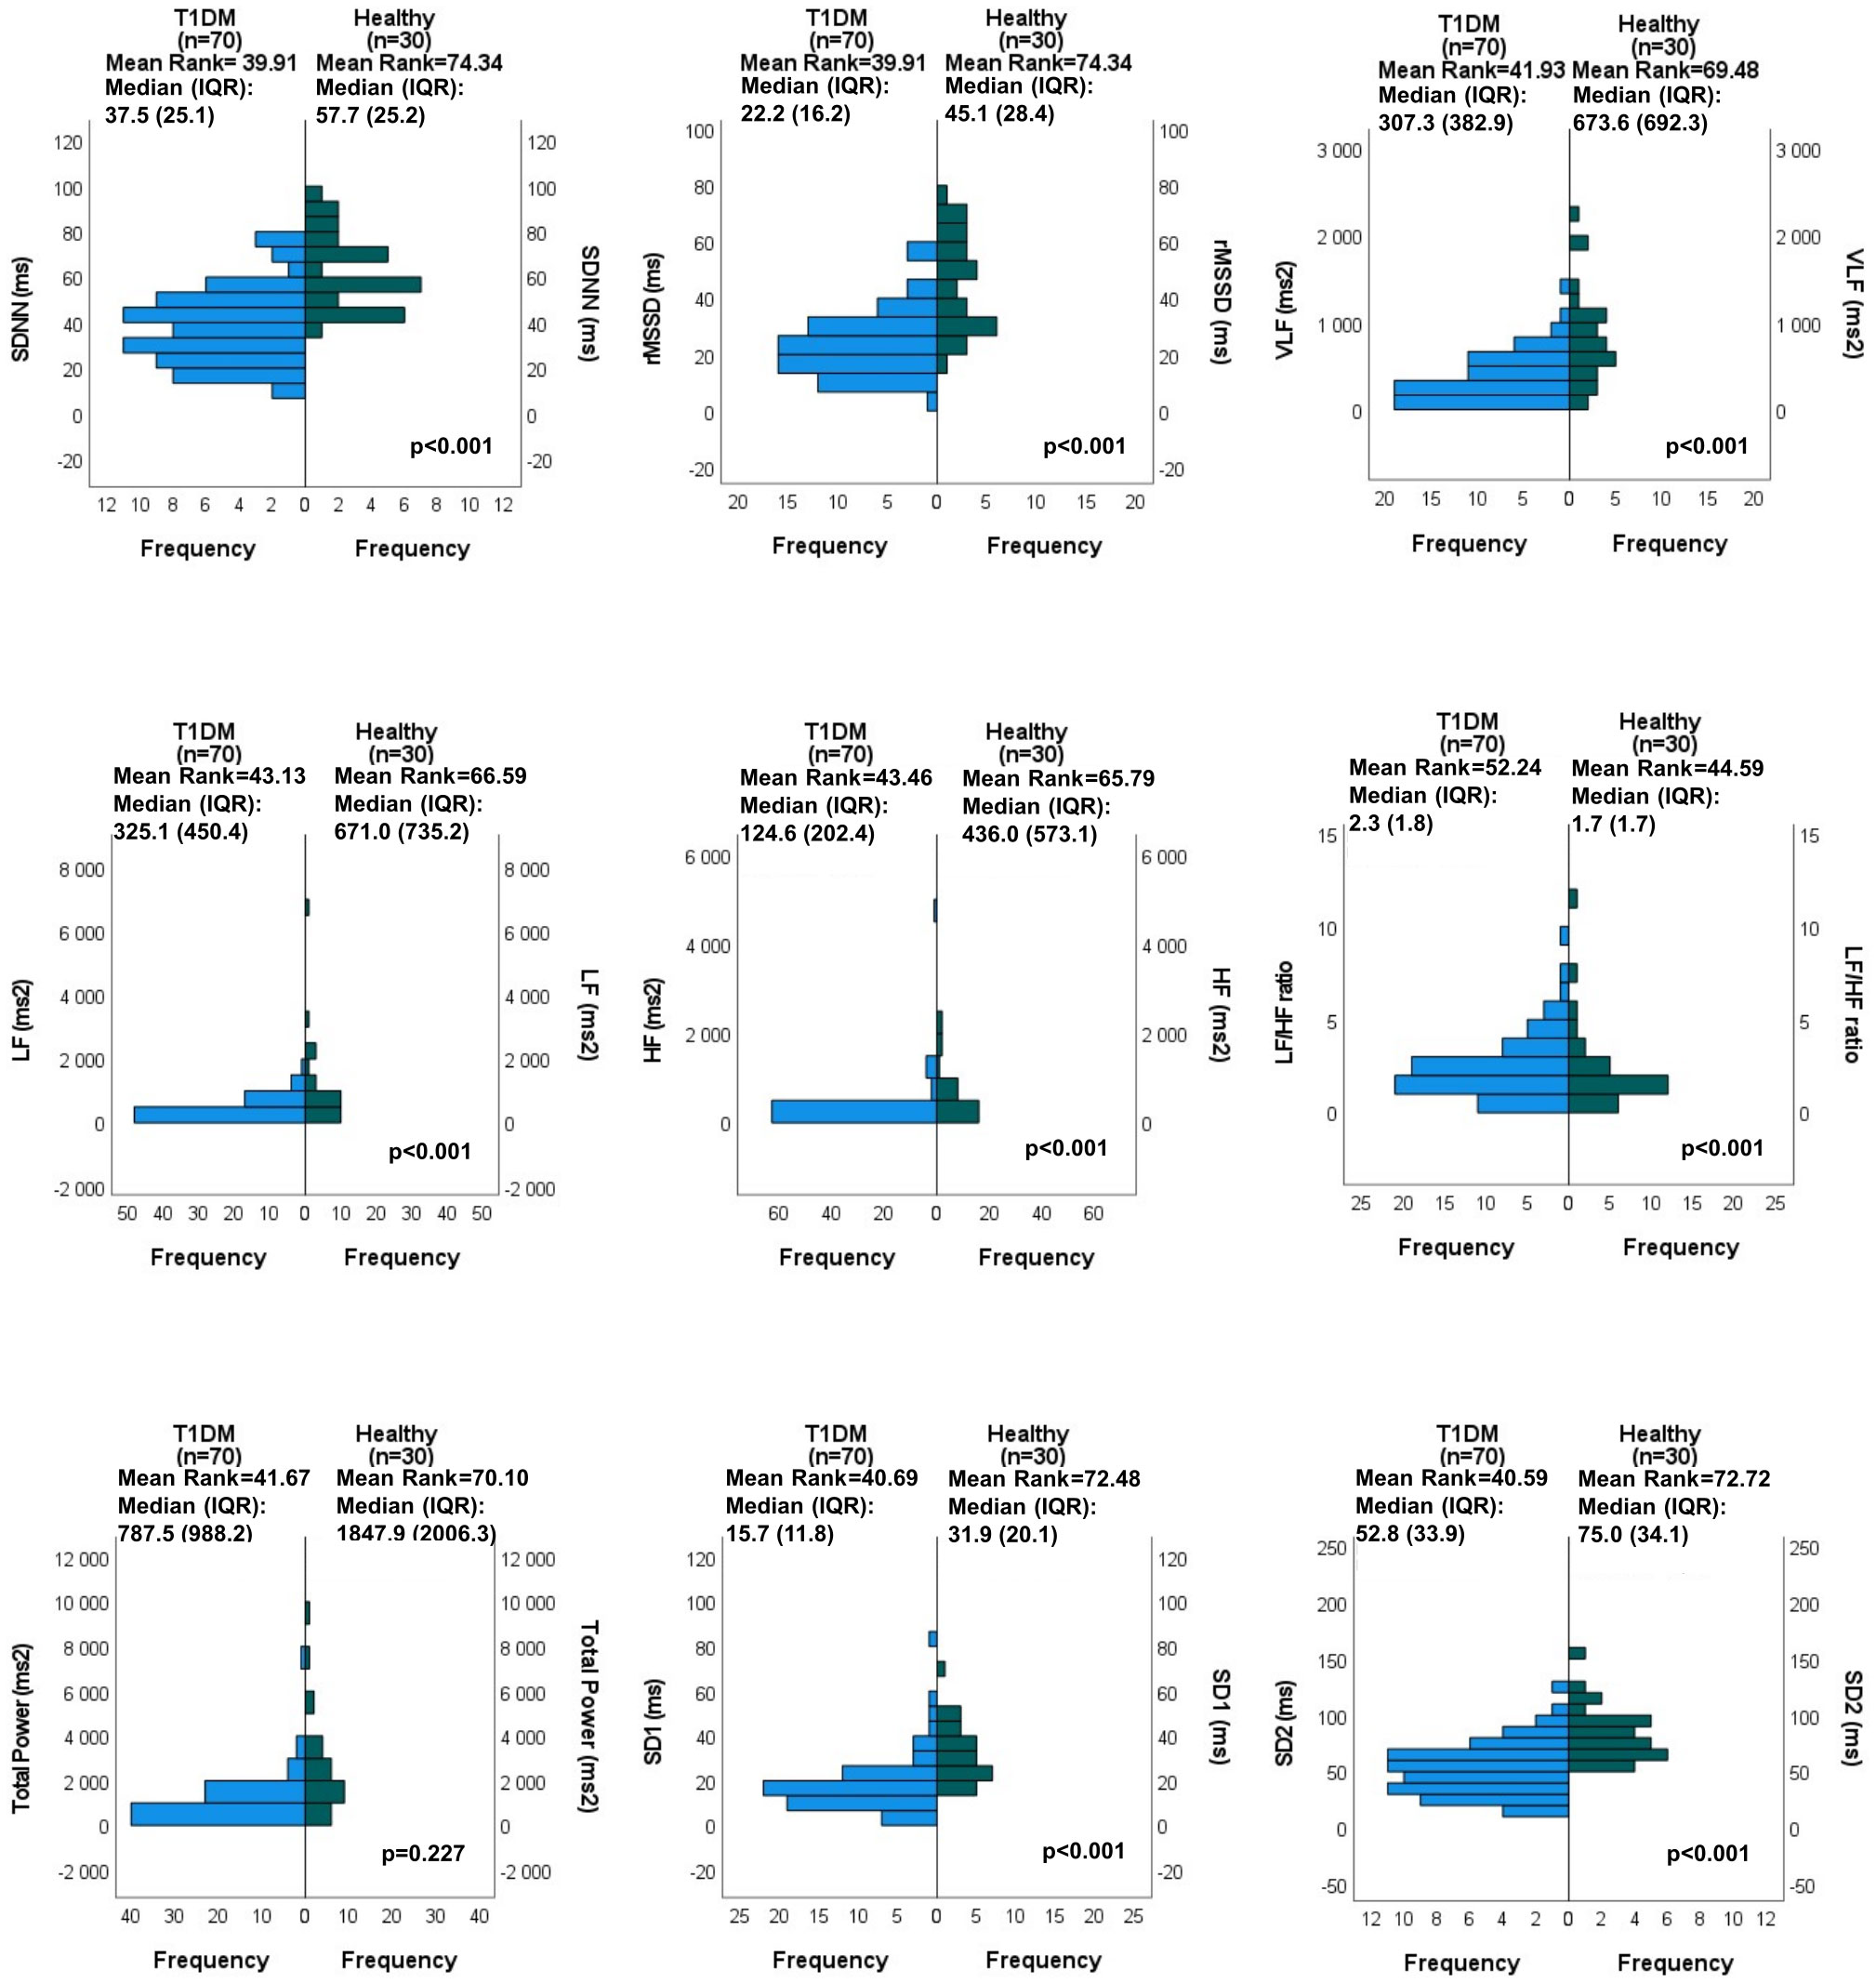
Figure 1 HRV parameters in the T1DM population and comparison with healthy subjects: Independent samples Mann-Whitney U test results.
Correlations between HRV parameters and the major risk factors for CAN
In univariate analyses, age, BMI, disease duration, systolic blood pressure, smoking, current HbA1c, eGFR, use of ACE inhibitors/ARBs, and use of beta receptor antagonists showed significant correlations with various HRV parameters. Correlations with borderline significance were found between gender and HRV parameters, whereas diastolic blood pressure, total cholesterol or triglyceride levels and use of calcium channel blockers did not show any significant correlation with them (Table 2).
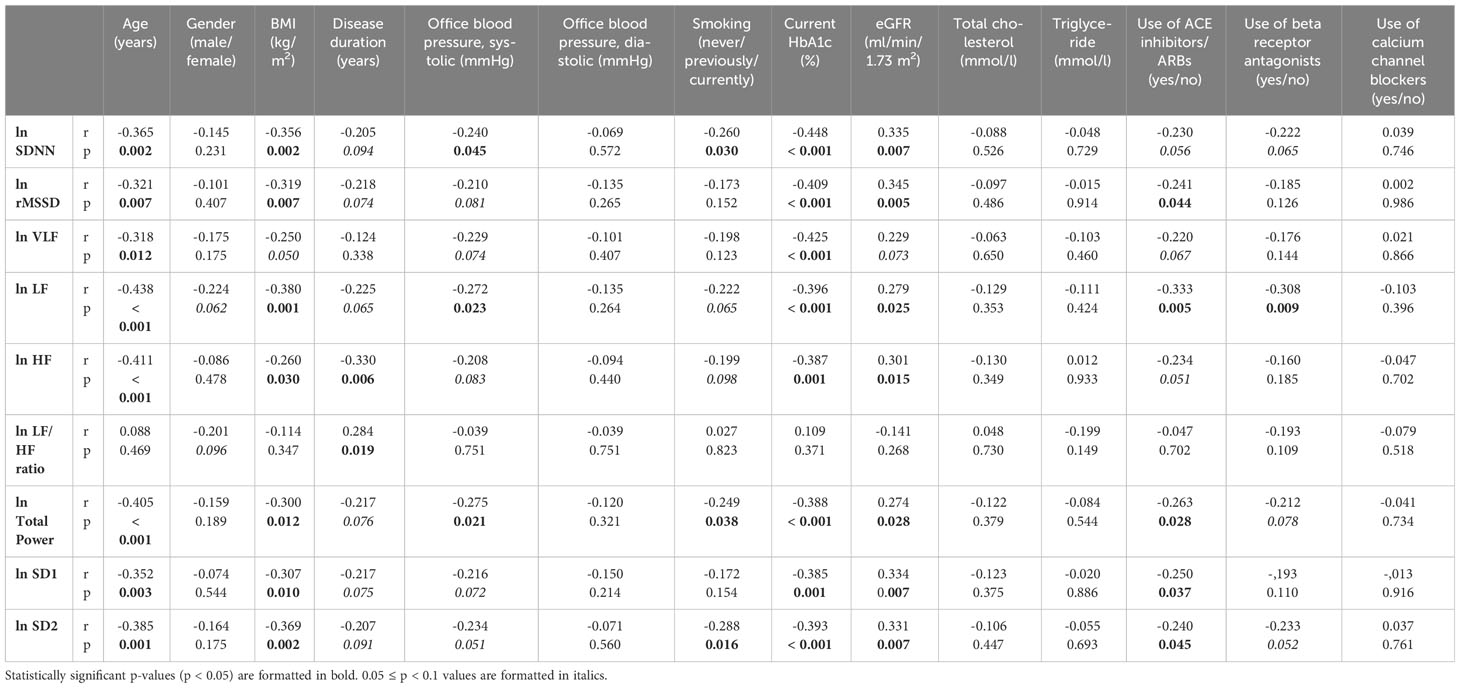
Table 2 Univariate predictors of the HRV parameters in the T1DM population.
In multiple linear model, disease duration remained the only independent predictor of LF/HF ratio (Figure 2). HbA1c, on the other hand, was proved to be the significant independent predictor of all the further time domain, frequency domain, and nonlinear indices, alone, or in combination with other factors, such as age or BMI (Table 3). Partial regression plots indicate that HbA1c level correlates significantly with various HRV parameters in multiple models (Figure 3).
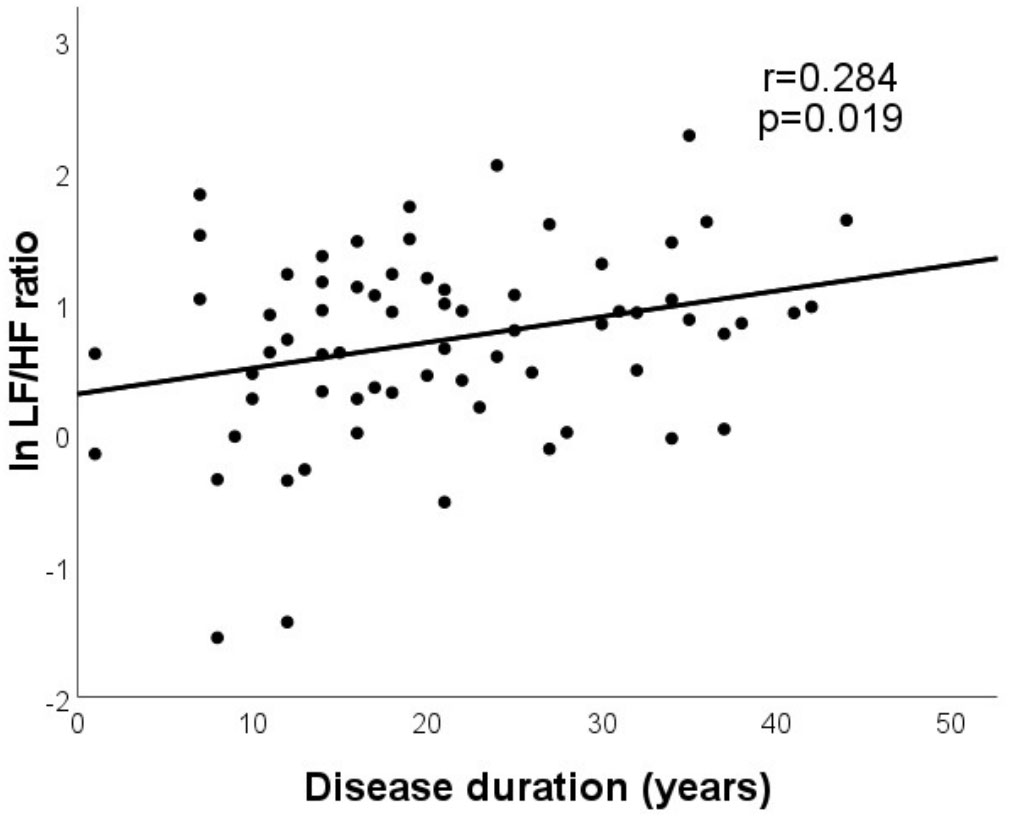
Figure 2 Disease duration was found to be the only independent predictor of LF/HF ratio in multiple model.
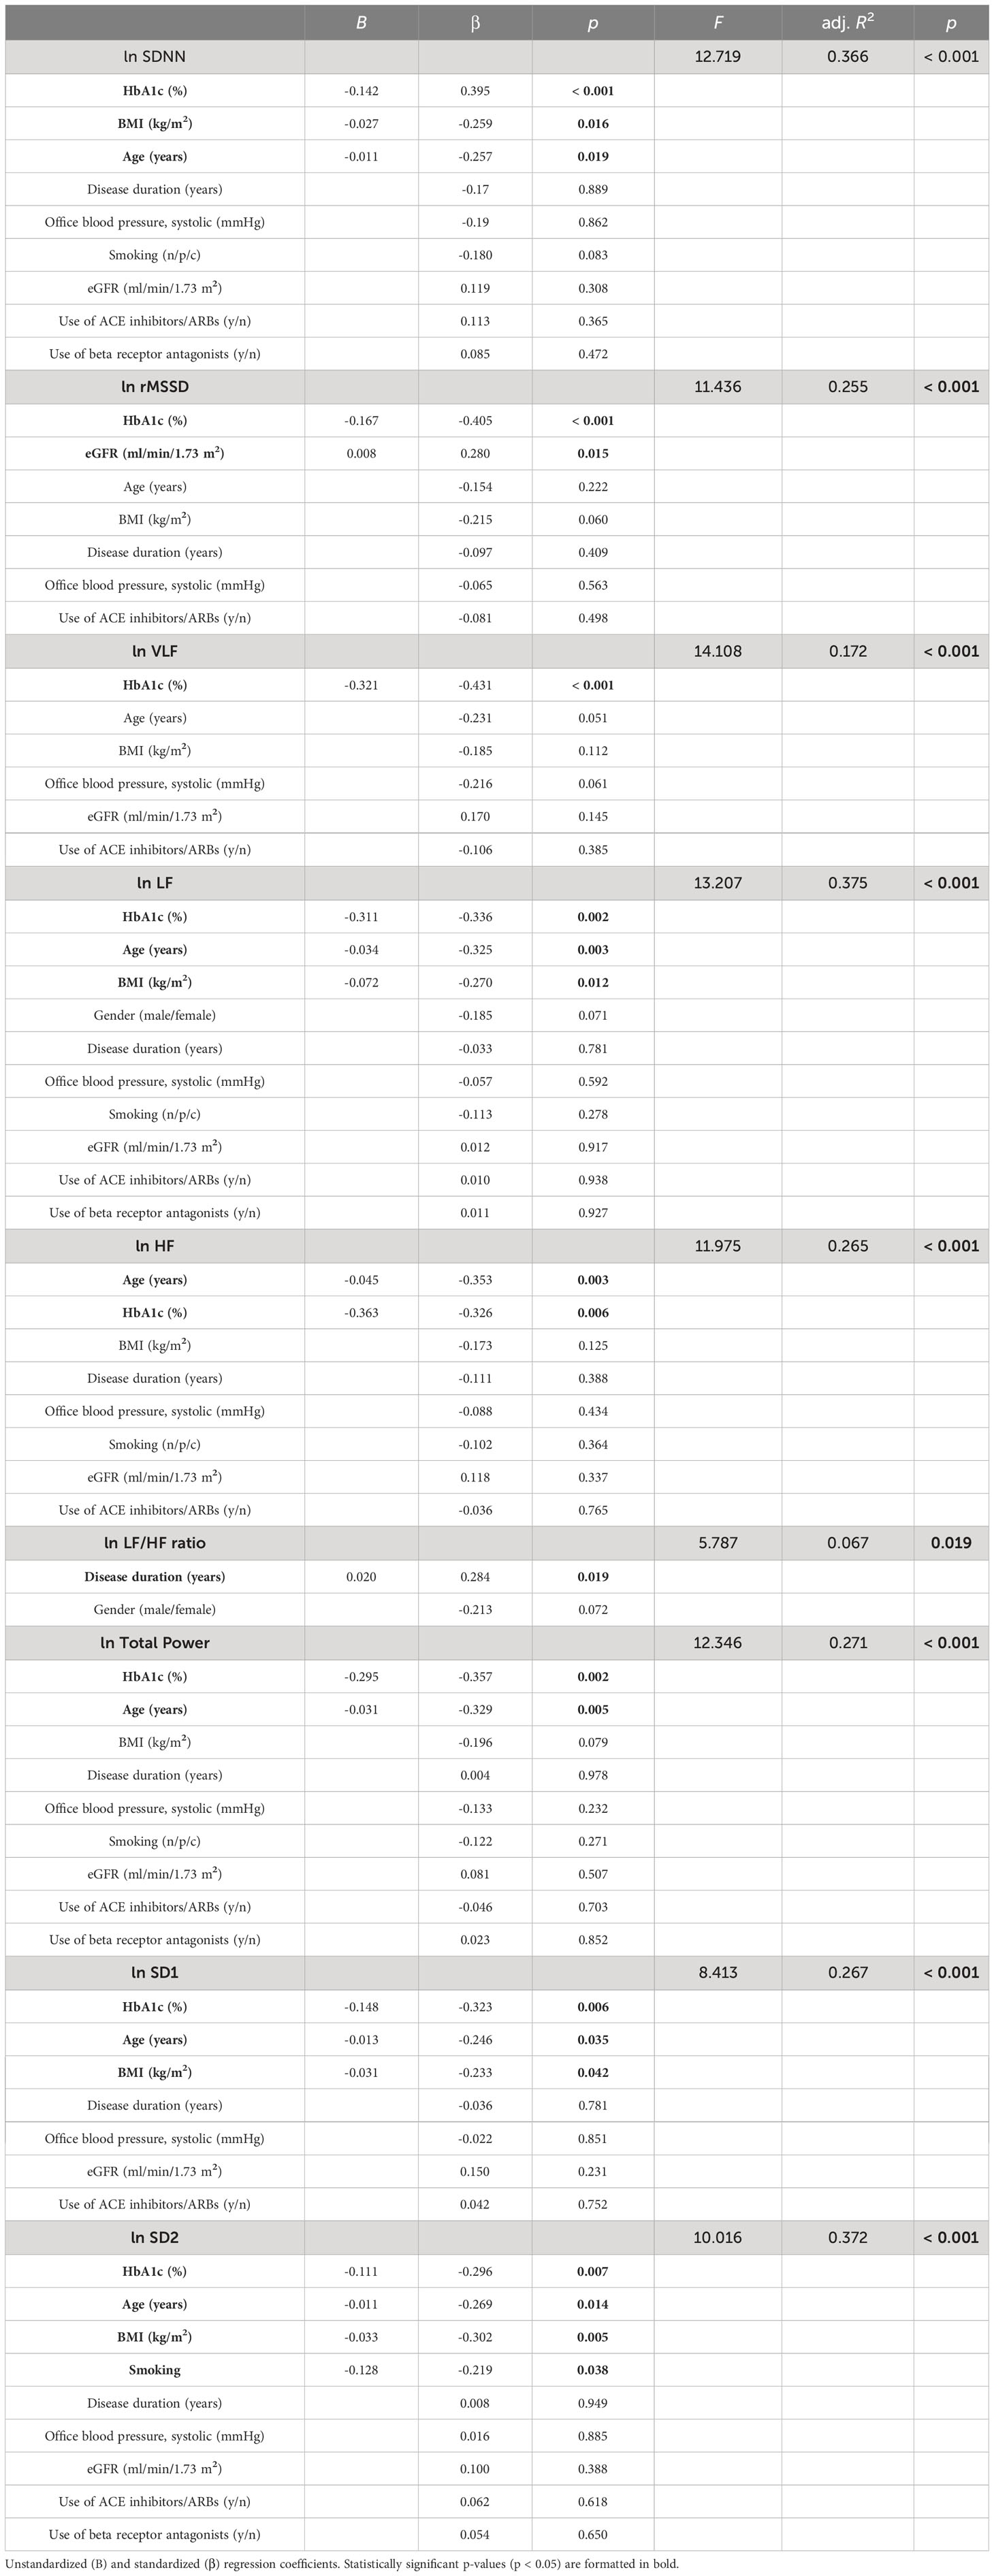
Table 3 Significant independent predictors of the HRV parameters in T1DM population: multivariate regression analyses.
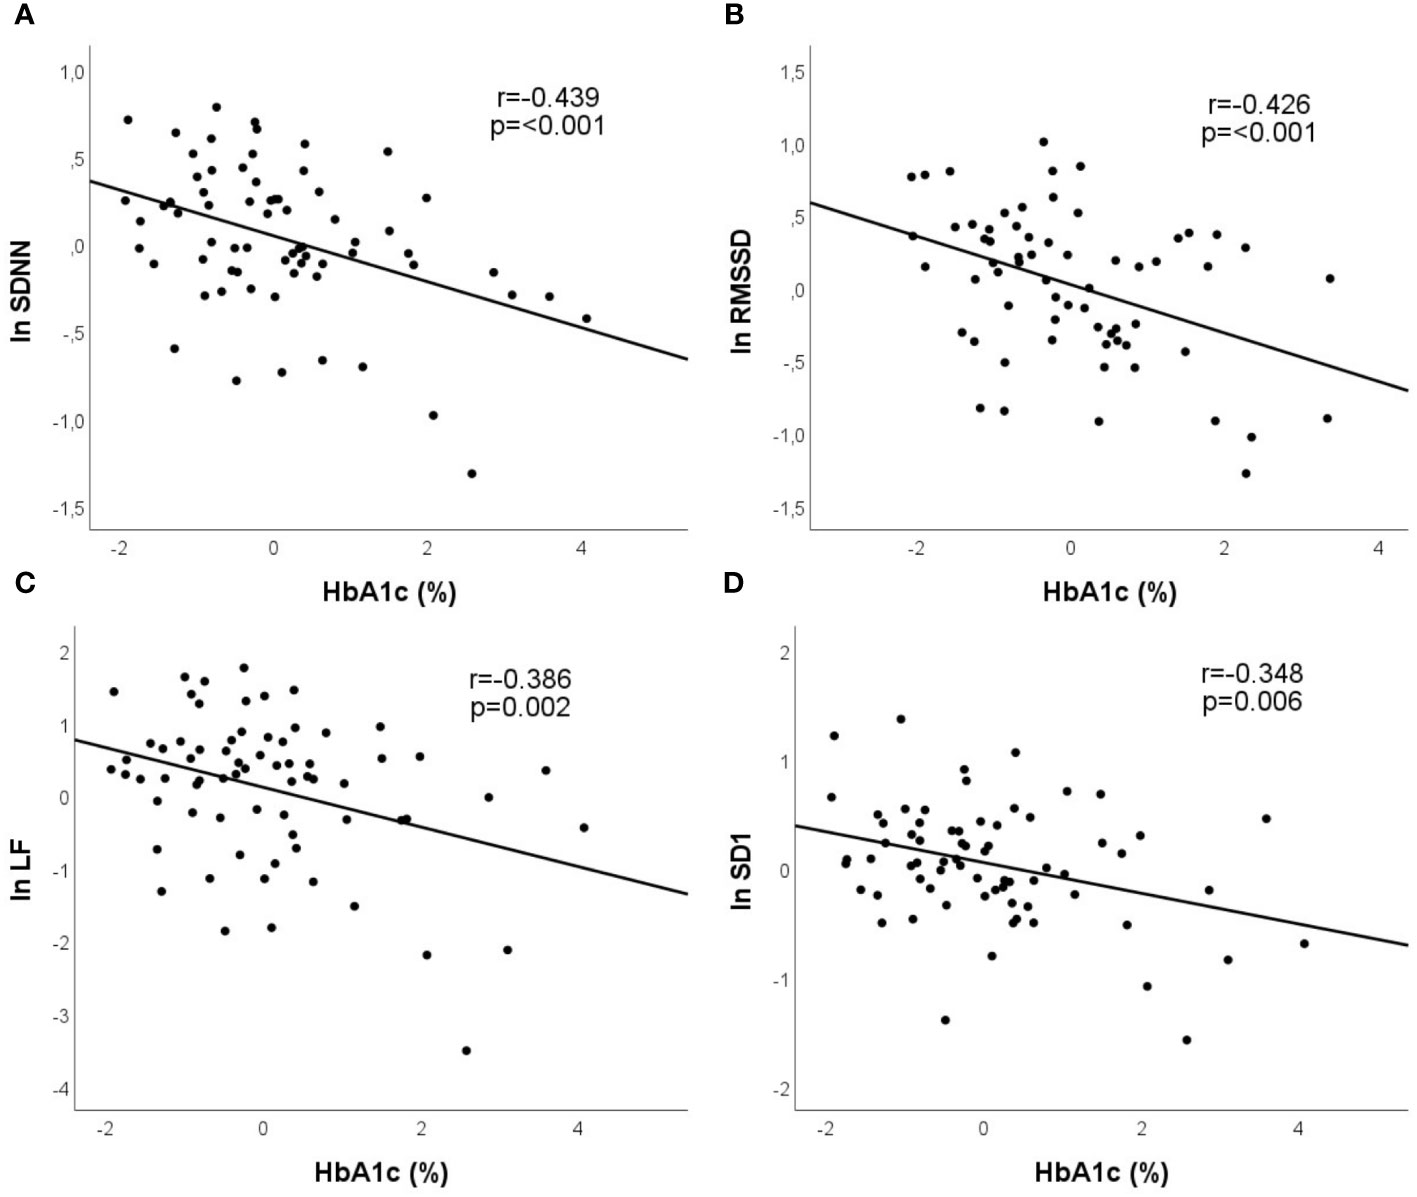
Figure 3 Partial regression plots demonstrate that in multiple models HbA1c (%) shows significant correlation with SDNN (A), rMSSD (B), LF (C), and with SD1 (D). Partial correlation coefficients are reported.
Discussion
Serious microvascular and macrovascular complications are frequent in patients with advanced T1DM. Imbalance of the autonomic nervous system is one of the most overlooked of all main complications in this disease (4). Most common symptoms of CAN include resting tachycardia, orthostatic hypotension, poor exercise tolerance, dizziness, lightheadedness, and fragility. These all are consequences of the injury to the autonomic nerve fibers that innervate the heart and blood vessels, resulting in anomalies in heart rate control and vascular tone (4). Various studies have proved that CAN is a risk factor for cardiovascular morbidity and mortality (5, 9, 24, 25).
The DCCT (Diabetes Control and Complications Trial)/EDIC (Epidemiology of Diabetes Interventions and Complications) and further investigations suggested that disease duration and quality of the glycemic control are the main risk factors for CAN (6–9, 26). Nevertheless, major cardiovascular risk factors, such as age, blood pressure, obesity, dyslipidemia, and smoking may also play essential role in the evolution of CAN. In addition, the existence of the diabetic microvascular complications (nephropathy or microalbuminuria and retinopathy) shows strong association with CAN (6–9, 26).
Typical symptoms of CAN present at late stage, whereas early autonomic dysfunction may exhibit no symptoms. HRV, however, is a sensitive biomarker of the autonomic control of the heart. Thus, diminished HRV is considered as the earliest indicator of CAN in T1DM population (3, 4, 10, 11), which has been reported even in young, asymptomatic patients, compared with those in healthy individuals (12–15).
Major risk factors for CAN, especially disease duration and glycemic control, have also been verified as significant determinants of reduced HRV in this disease (13, 16–19). Literature data, however, are inconsistent regarding these questions.
Thus, our work targeted to produce a comprehensive analysis of the HRV in asymptomatic T1DM patients by evaluating time domain, frequency domain, and nonlinear indices. Results were compared with those in healthy subjects. The potential impact of the established CAN risk factors and common cardiovascular risk factors on the HRV parameters was also investigated.
Variability of the consecutive RR intervals reflects the capability of the cardiovascular system to adapt to extrinsic and intrinsic factors. This variability is normally regulated on a beat-to-beat basis by the balance of the sympathetic and parasympathetic nervous systems at the sinus node level (27). SDNN is a measure of overall HRV, reflecting both sympathetic and parasympathetic activation, whereas rMSSD represents the parasympathetic component (13, 28). Total Power represents the overall modulation of the heart rate, whereas HF reflects respiratory-mediated modulation of the heart rate by the parasympathetic system. LF is attributed to the baroreflex-mediated regulation of the heart rate, reflecting both sympathetic and parasympathetic inputs to the sinus node (28, 29). Others view it as a parameter of the sympathetic modulation (28). Thus, LF/HF ratio is considered as an index of sympathovagal balance (13, 29), although this concept has already been challenged (30). VLF is attributed to the modulatory action of the renin-angiotensin system, thermoregulation, and peripheral vasomotor tone (28). SD1 reflects the short-term variability of RR interval variation and is primarily influenced by parasympathetic modulation. SD2, on the other hand, is a parameter of the long-term variability and represents sympathetic activation (31, 32).
In a small group of young T1DM patients, Javorka et al. reported significant reduction in HF band, whereas no significant difference between T1DM group and control population was observed in LF band (14). In the study population of Rosengård-Bärlund et al., T1DM patients showed reduced SDNN, rMSSD, and HF values. LF values remained preserved, resulting in a higher LF/HF ratio (15). In a study on 354 young T1DM individuals, Jaiswal et al. observed significantly lower SDNN and rMSSD values compared with healthy controls. Normalized HF was impaired, but normalized LF was significantly elevated compared with healthy subjects; thus, LF/HF ratio was also elevated (13). Da Silva et al. observed reduction both in sympathetic and parasympathetic activities and in overall variability as matched with the healthy population: SDNN, rMSSD, HF, LF, SD1, and SD2 values were all significantly reduced in their study accompanied by a preserved LF/HF ratio (12). Our findings are in line with the results of da Silva et al. In addition, significantly reduced VLF and Total Power values were found in our population. Regarding the latter two parameters, no previous reports are available in T1DM patients, in comparison with healthy subjects.
Literature data suggest that diminished parasympathetic autonomic tone is detected first in early CAN. As a result, there is a sympathetic predominance, represented by an elevated resting heart rate (25). HF is impaired, but LF power, the surrogate for sympathetic dysfunction, is preserved or even higher in this phase, resulting in a higher LF/HF ratio (13), as it was found in many previous studies (13–15). In more advanced CAN, on the other hand, both the parasympathetic and sympathetic nerves become affected (25), as it is reflected by a balanced LF/HF ratio. This situation was depicted by da Silva et al. (12) and by our study.
In the study of Jaiswal et al., HbA1c remained the independent predictor of SDNN and rMSSD in a young T1DM population in multiple linear regression analysis. The association between HbA1c and LF/HF ratio was not significant. More advanced age and higher triglyceride levels were reported as further independent correlates of lower SDNN and rMSSD. Duration of diabetes, however, was not independently related to any of their HRV indices (16). In another work of Jaiswal et al., older age, female gender, elevated LDL cholesterol and triglyceride levels, and microalbuminuria were all associated with reduced SDNN, rMSSD, HF, and LF but did not account for the observed differences between patients with and without diabetes (13). In addition to SDNN and rMSSD, the standard frequency-domain indices of HRV, including VLF, were also investigated in the work of Pertseva et al, and the diurnal rhythm of the HRV parameters was also taken into consideration (18). In univariable analysis, higher HbA1c had negative effect on HRV, reducing the value of both time domain and frequency domain parameters, except LF/HF ratio. eGFR also showed significant correlation with the same parameters, including LF/HF ratio (18). Logistic regression models, adjusted for gender and age, were used by Pop-Busui et al. to assess the associations between SDNN and HbA1c, diabetes duration, systolic blood pressure, as well as any sustained albumin excretion rate (AER) ≥ 30 mg/day in T1DM patients. HbA1c and presence of any sustained AER ≥ 30 mg/day were independently associated with SDNN but only in patients with known CAN (19).
In our study, similarly to the previous findings, no significant correlation was revealed between HbA1c and LF/HF ratio. HbA1c, however, was proved to be significant independent predictor of all further time domain, frequency domain, and nonlinear indices, alone, or in combination with common adjustment factors, such as age and BMI. In univariable analysis, eGFR showed significant correlations with various HRV parameters in our study but lost its significance in multiple models, except regarding rMSSD. Serum cholesterol and triglyceride levels did not show any correlation with HRV parameters in our study. In the general population, smoking appeared detrimental on time domain and frequency domain indices of HRV but did not affect LF/HF balance (33). In univariable analysis, smoking showed significant correlation with various HRV parameters in our study but lost its significance in multiple models, except regarding SD2. In hypertensive subjects with or without metabolic syndrome, a complex relationship was reported between HRV, blood pressure, antihypertensive treatment, and the metabolic profile of the patients (34). In our T1DM population, about one-third of the patients were treated with antihypertensive drugs. Office systolic blood pressure and the use of ACE inhibitors/ARBs/beta receptor antagonists showed various correlations with the HRV parameters, except with LF/HF ratio. These correlations, however, lost their significance in multiple models.
Although, in T2DM patients, female gender seems to be a risk factor for CAN (25), in T1DM population, EURODIAB IDDM Complications Study found no significant difference in the prevalence of CAN between male (35%) and female (37%) patients (7). Similarly, gender did not influence the HRV parameters in our study.
Duration of diabetes remained the only independent predictor of LF/HF ratio in our study: Longer disease duration is associated with the increase of LF/HF ratio. This may represent the progression of the sympathetic predominance (vagal withdrawal) during the course of the disease (11). In addition, recent literature suggests that higher LF/HF ratio is more common in T1DM patients with frequent hypoglycemic episodes (17, 35) and the frequency of hypoglycemic episodes increasing with longer disease duration (17).
Our results suggest that HRV parameters calculated from a 5-min segment of the ECG recording are reliable and allow early detection of the first, subclinical stage of CAN in asymptomatic T1DM population. This may provide more time to vigorously manage diabetes and may increase the efficacy of interventions in order to prevent manifest CAN.
We are aware of many limitations of our study. First, the size of our study population was limited by reason of the demanding selection of asymptomatic patients without cardiovascular comorbidities. Treadmill stress test was used for screening subjects suspicious for CAD. Due to ethical reasons, the use of coronary angiography was avoided in the asymptomatic patients and volunteers. The data about the hypoglycemic episodes of our T1DM patients are not available. Non-pharmacological treatment options—dietary intervention, regular exercise (aerobic and/or resistance training), weight loss and psychological counseling—have been reported to be useful in preventing CAN or mitigating its symptoms (36). Data about these factors, however, were not recorded in our study. Usual cardiovascular medication of the patients was not withdrawn before testing. Nevertheless, correlations between HRV parameters and the use of ACE inhibitors/ARBs/beta receptor antagonists lost their significance in multiple models. Lipid-lowering medication use of the patients was not considered. Healthy subjects with positive smoking history or with known dyslipidemia were not excluded from the study. Smoking habits did not differ between the two populations. Lipid levels of the healthy population, however, were neglected.
Conclusion
Our data confirm that asymptomatic T1DM patients have significantly reduced overall HRV as compared with healthy subjects, indicating early, subclinical CAN.
Quality of the glycemic control is an important determinant of HRV among T1DM patients. This relationship is independent of other risk factors for CAN or traditional cardiovascular risk factors and underlines the central role of tight glycemic control in the modulation of cardiac autonomic function in T1DM population.
Data availability statement
The raw data supporting the conclusions of this article will be made available by the authors, without undue reservation.
Ethics statement
The studies involving humans were approved by Regional Research Ethics Committee, Clinical Centre, University of Pécs. The studies were conducted in accordance with the local legislation and institutional requirements. The participants provided their written informed consent to participate in this study.
Author contributions
RF, NV-V, LH, and IW designed the study. MH, VV, and GM carried out subject recruitment. RF performed echocardiography. MH and KG collected ECG data and performed HRV analysis. MH and RF analyzed and interpreted the data and drafted the manuscript. KG, VV, and NV-V helped in literature analysis, contributed to discussion of the results. GM, IW, and LH reviewed the manuscript. All authors contributed to the article and approved the submitted version.
Conflict of interest
The authors declare that the research was conducted in the absence of any commercial or financial relationships that could be construed as a potential conflict of interest.
Publisher’s note
All claims expressed in this article are solely those of the authors and do not necessarily represent those of their affiliated organizations, or those of the publisher, the editors and the reviewers. Any product that may be evaluated in this article, or claim that may be made by its manufacturer, is not guaranteed or endorsed by the publisher.
References
1. Laing SP, Swerdlow AJ, Slater SD, Burden AC, Morris A, Waugh NR, et al. Mortality from heart disease in a cohort of 23,000 patients with insulin-treated diabetes. Diabetologia (2003) 46(6):760–5. doi: 10.1007/s00125-003-1116-6
2. Dorman JS, Laporte RE, Kuller LH, Cruickshanks KJ, Orchard TJ, Wagener DK, et al. The Pittsburgh insulin-dependent diabetes mellitus (IDDM) morbidity and mortality study. Mortality results. Diabetes (1984) 33(3):271–6. doi: 10.2337/diab.33.3.271
3. Pop-Busui R, Boulton AJ, Feldman EL, Bril V, Freeman R, Malik RA, et al. Diabetic neuropathy: A position statement by the american diabetes association. Diabetes Care (2017) 40(1):136–54. doi: 10.2337/dc16-2042
4. Vinik AI, Maser RE, Mitchell BD, Freeman R. Diabetic autonomic neuropathy. Diabetes Care (2003) 26(5):1553–79. doi: 10.2337/diacare.26.5.1553
5. Maser RE, Mitchell BD, Vinik AI, Freeman R. The association between cardiovascular autonomic neuropathy and mortality in individuals with diabetes: a meta-analysis. Diabetes Care (2003) 26(6):1895–901. doi: 10.2337/diacare.26.6.1895
6. Dafaalla MD, Nimir MN, Mohammed MI, Ali OA, Hussein A. Risk factors of diabetic cardiac autonomic neuropathy in patients with type 1 diabetes mellitus: a meta-analysis. Open Heart (2016) 3(2):e000336. doi: 10.1136/openhrt-2015-000336
7. Kempler P, Tesfaye S, Chaturvedi N, Stevens LK, Webb DJ, Eaton S, et al. Autonomic neuropathy is associated with increased cardiovascular risk factors: the EURODIAB IDDM Complications Study. Diabetes Med (2002) 19(11):900–9. doi: 10.1046/j.1464-5491.2002.00821.x
8. Braffett BH, Gubitosi-Klug RA, Albers JW, Feldman EL, Martin CL, White NH, et al. Risk factors for diabetic peripheral neuropathy and cardiovascular autonomic neuropathy in the diabetes control and complications trial/epidemiology of diabetes interventions and complications (DCCT/EDIC) study. Diabetes (2020) 69(5):1000–10. doi: 10.2337/db19-1046
9. Pop-Busui R, Braffett BH, Zinman B, Martin C, White NH, Herman WH, et al. Cardiovascular autonomic neuropathy and cardiovascular outcomes in the diabetes control and complications trial/epidemiology of diabetes interventions and complications (DCCT/EDIC) study. Diabetes Care (2017) 40(1):94–100. doi: 10.2337/dc16-1397
10. Wawryk AM, Bates DJ, Couper JJ. Power spectral analysis of heart rate variability in children and adolescents with IDDM. Diabetes Care (1997) 20(9):1416–21. doi: 10.2337/diacare.20.9.1416
11. Chessa M, Butera G, Lanza GA, Bossone E, Delogu A, De Rosa G, et al. Role of heart rate variability in the early diagnosis of diabetic autonomic neuropathy in children. Herz (2002) 27(8):785–90. doi: 10.1007/s00059-002-2340-4
12. da Silva A, Christofaro DGD, Bernardo AFB, Vanderlei FM, Vanderlei LCM. Sensitivity, specificity and predictive value of heart rate variability indices in type 1 diabetes mellitus. Arq Bras Cardiol (2017) 108(3):255–62. doi: 10.5935/abc.20170024
13. Jaiswal M, Urbina EM, Wadwa RP, Talton JW, D'Agostino RB Jr, Hamman RF, et al. Reduced heart rate variability among youth with type 1 diabetes: the SEARCH CVD study. Diabetes Care (2013) 36(1):157–62. doi: 10.2337/dc12-0463
14. Javorka M, Javorkova J, Tonhajzerova I, Javorka K. Parasympathetic versus sympathetic control of the cardiovascular system in young patients with type 1 diabetes mellitus. Clin Physiol Funct Imag (2005) 25(5):270–4. doi: 10.1111/j.1475-097X.2005.00623.x
15. Rosengård-Bärlund M, Bernardi L, Fagerudd J, Mäntysaari M, Af Björkesten CG, Lindholm H, et al. Early autonomic dysfunction in type 1 diabetes: a reversible disorder? Diabetologia (2009) 52(6):1164–72. doi: 10.1007/s00125-009-1340-9
16. Jaiswal M, Fingerlin TE, Urbina EM, Wadwa RP, Talton JW, D'Agostino RB Jr, et al. Impact of glycemic control on heart rate variability in youth with type 1 diabetes: the SEARCH CVD study. Diabetes Technol Ther (2013) 15(12):977–83. doi: 10.1089/dia.2013.0147
17. Pertseva N, Tyshchenko I, Moshenets K. The influence of glycemic control on heart rate variability and blood pressure in adult patients with the type 1 diabetes. Rom J Diabetes Nutr Metab Di (2018) 25(1):67–75. doi: 10.2478/rjdnmd-2018-0007
18. Pertseva NO, Gurzhiy OV, Moshenets KI. Dependence of heart rate variability on indicators of type 1 diabetes mellitus control. Med Perspektivi (Medical Perspectives) (2020) 25(1):88–95. doi: 10.26641/2307-0404.2020.1.200406
19. Pop-Busui R, Backlund JC, Bebu I, Braffett BH, Lorenzi G, White NH, et al. Utility of using electrocardiogram measures of heart rate variability as a measure of cardiovascular autonomic neuropathy in type 1 diabetes patients. J Diabetes Investig (2022) 13(1):125–33. doi: 10.1111/jdi.13635
20. Ryan H, Trosclair A, Gfroerer J. Adult current smoking: differences in definitions and prevalence estimates–NHIS and NSDUH, 2008. J Environ Public Health (2012) 2012:918368. doi: 10.1155/2012/918368
21. Brennan M, Palaniswami M, Kamen P. Do existing measures of Poincaré plot geometry reflect nonlinear features of heart rate variability? IEEE Trans BioMed Eng (2001) 48(11):1342–7. doi: 10.1109/10.959330
22. Karmakar CK, Khandoker AH, Gubbi J, Palaniswami M. Complex correlation measure: a novel descriptor for Poincaré plot. BioMed Eng Online (2009) 8:17. doi: 10.1186/1475-925x-8-17
23. Hajdu M, Knutsen MO, Vértes V, Vorobcsuk-Varga N, Molnár G, Wittmann I, et al. Quality of glycemic control has significant impact on myocardial mechanics in type 1 diabetes mellitus. Sci Rep (2022) 12(1):20180. doi: 10.1038/s41598-022-24619-2
24. Soedamah-Muthu SS, Chaturvedi N, Witte DR, Stevens LK, Porta M, Fuller JH. Relationship between risk factors and mortality in type 1 diabetic patients in Europe: the EURODIAB Prospective Complications Study (PCS). Diabetes Care (2008) 31(7):1360–6. doi: 10.2337/dc08-0107
25. Williams S, Raheim SA, Khan MI, Rubab U, Kanagala P, Zhao SS, et al. Cardiac autonomic neuropathy in type 1 and 2 diabetes: epidemiology, pathophysiology, and management. Clin Ther (2022) 44(10):1394–416. doi: 10.1016/j.clinthera.2022.09.002
26. Rolim LC, Sá JR, Chacra AR, Dib SA. Diabetic cardiovascular autonomic neuropathy: risk factors, clinical impact and early diagnosis. Arq Bras Cardiol (2008) 90(4):e24–31. doi: 10.1590/s0066-782x2008000400014
27. Heart rate variability: standards of measurement, physiological interpretation and clinical use. Task Force of the European Society of Cardiology and the North American Society of Pacing and Electrophysiology. Circulation (1996) 93(5):1043–65. doi: 10.1161/01.CIR.93.5.1043
28. Nicolini P, Ciulla MM, De Asmundis C, Magrini F, Brugada P. The prognostic value of heart rate variability in the elderly, changing the perspective: from sympathovagal balance to chaos theory. Pacing Clin Electrophysiol (2012) 35(5):622–38. doi: 10.1111/j.1540-8159.2012.03335.x
29. Jarczok MN, Li J, Mauss D, Fischer JE, Thayer JF. Heart rate variability is associated with glycemic status after controlling for components of the metabolic syndrome. Int J Cardiol (2013) 167(3):855–61. doi: 10.1016/j.ijcard.2012.02.002
30. Billman GE. The LF/HF ratio does not accurately measure cardiac sympatho-vagal balance. Front Physiol (2013) 4:26. doi: 10.3389/fphys.2013.00026
31. Brennan M, Palaniswami M, Kamen P. Poincaré plot interpretation using a physiological model of HRV based on a network of oscillators. Am J Physiol Heart Circ Physiol (2002) 283(5):H1873–1886. doi: 10.1152/ajpheart.00405.2000
32. Pizzo E, Berrettoni S, Kaul R, Cervantes DO, Di Stefano V, Jain S, et al. Heart rate variability reveals altered autonomic regulation in response to myocardial infarction in experimental animals. Front Cardiovasc Med (2022) 9:843144. doi: 10.3389/fcvm.2022.843144
33. Murgia F, Melotti R, Foco L, Gögele M, Meraviglia V, Motta B, et al. Effects of smoking status, history and intensity on heart rate variability in the general population: The CHRIS study. PloS One (2019) 14(4):e0215053. doi: 10.1371/journal.pone.0215053
34. Maciorowska M, Krzesiński P, Wierzbowski R, Gielerak G. Heart rate variability in patients with hypertension: the effect of metabolic syndrome and antihypertensive treatment. Cardiovasc Ther (2020) 2020:8563135. doi: 10.1155/2020/8563135
35. Silva TP, Rolim LC, Sallum Filho C, Zimmermann LM, Malerbi F, Dib SA. Association between severity of hypoglycemia and loss of heart rate variability in patients with type 1 diabetes mellitus. Diabetes Metab Res Rev (2017) 33(2):e2830. doi: 10.1002/dmrr.2830
Keywords: type 1 diabetes mellitus, heart rate variability, cardiac autonomic neuropathy, glycemic control, cardiovascular risk factor
Citation: Hajdu M, Garmpis K, Vértes V, Vorobcsuk-Varga N, Molnár GA, Hejjel L, Wittmann I and Faludi R (2023) Determinants of the heart rate variability in type 1 diabetes mellitus. Front. Endocrinol. 14:1247054. doi: 10.3389/fendo.2023.1247054
Received: 27 June 2023; Accepted: 04 September 2023;
Published: 03 October 2023.
Edited by:
David Wagner, University of Colorado Anschutz Medical Campus, United StatesReviewed by:
Alessandro Pingitore, National Research Council, United StatesMassimo Tusconi, University of Cagliari, Italy
Copyright © 2023 Hajdu, Garmpis, Vértes, Vorobcsuk-Varga, Molnár, Hejjel, Wittmann and Faludi. This is an open-access article distributed under the terms of the Creative Commons Attribution License (CC BY). The use, distribution or reproduction in other forums is permitted, provided the original author(s) and the copyright owner(s) are credited and that the original publication in this journal is cited, in accordance with accepted academic practice. No use, distribution or reproduction is permitted which does not comply with these terms.
*Correspondence: Réka Faludi, ZmFsdWRpLnJla2FAcHRlLmh1