 Iwona Gregorczyk-Maga1††‡
 Michał Kania2,3*††‡
 Michalina Dąbrowska4‡Emilia Samborowska5‡
 Natalia Żeber-Lubecka4,6‡
 Maria Kulecka4,6‡
 Tomasz Klupa7‡
- 1Institute of Dentistry, Faculty of Medicine, Jagiellonian University Medical College, Krakow, Poland
- 2Chair of Metabolic Diseases and Diabetology, Faculty of Medicine, Jagiellonian University Medical College, Krakow, Poland
- 3Doctoral School of Medicine and Health Sciences, Jagiellonian University Medical College, Krakow, Poland
- 4Department of Genetics, Maria Sklodowska-Curie National Research Institute of Oncology, Warsaw, Poland
- 5Mass Spectrometry Laboratory, Institute of Biochemistry and Biophysics, Polish Academy of Sciences, Warsaw, Poland
- 6Department of Gastroenterology, Hepatology and Clinical Oncology, Center of Postgraduate Medical Education, Warsaw, Poland
- 7Center of Advanced Technologies in Diabetes, Chair of Metabolic Diseases, Faculty of Medicine, Jagiellonian University Medical College, Krakow, Poland
Aims: This study aimed to assess the gingival crevicular fluid (GCF) microbiome and metabolome of adults with type 1 diabetes (T1D) treated with continuous subcutaneous insulin infusion (CSII).
Methods: In this cross-sectional study, the GCF of adults with T1D treated with CSII and non-diabetic controls were sampled, and metagenomic/metabolomic analyses were performed.
Results: In total, 65 participants with T1D and 45 healthy controls with a mean age of 27.05 ± 5.95 years were investigated. There were 22 cases of mild gingivitis (G) in the T1D group. There were no differences considering the Shannon and Chao indices and β-diversity between people with T1D and G, with T1D without G, and healthy controls. Differential taxa were identified, which were mainly enriched in people with T1D and G. Acetic acid concentration was higher in people with T1D, regardless of the presence of G, than in healthy controls. Propionic acid was higher in people with T1D and G than in healthy controls. Isobutyric and isovaleric acid levels were higher in individuals with T1D and G than in the other two subgroups. The concentration of valeric acid was lower and that of caproic acid was higher in people with T1D (regardless of gingival status) than in healthy controls.
Conclusions: The identification of early changes in periodontal tissues by targeting the microbiome and metabolome could potentially enable effective prevention and initial treatment of periodontal disease in people with T1D.
Highlights
● To our knowledge, this is the first study to investigate the GCF microbiome in people with T1D. The study population was treated with modern technologies, such as CSII, demonstrating good glycemic control.
● Intensively treated people with T1D with satisfactory glycemic control and non-diabetic individuals generally showed good oral and periodontal health.
● With relatively well-controlled diabetes, slight differences in glycemic control did not significantly affect the oral microbiome, which was comparable to that observed in people without diabetes.
● Despite good metabolic control of diabetes, people with T1D in our study had a higher prevalence of mild gingivitis than healthy controls. This subpopulation exhibited shifts in the GCF microbiome and metabolome, resembling those in periodontitis.
1 Introduction
The oral cavity, also known as the mouth or buccal cavity, is the first section of the digestive system (1–3). It consists of several distinct microbial niches, such as tooth surfaces, gingiva, gingival sulci, and mucosal surfaces of the tongue, cheeks, lips, and palate (4). Species residing in the oral cavity are regarded as part of the oral microbiome (5), which is one of the most important microbial complexes in humans (6). It has been reported to include over 1000 species of bacteria, with a few lesser-known taxa emerging from the most recent studies, archaea, which are less abundant and diverse than bacteria, approximately 100 species of fungi, and a rich virome (7). Although the oral microbiome is defined as all microorganisms residing in the human oral cavity and its extensions (reaching the distal part of the esophagus), most studies have focused on samples obtained from the oral cavity itself (4). They can have both positive and detrimental effects on general health and the local state of the oral cavity (5, 6). The link between the oral microbiome and organisms is bidirectional. Diseases affect microbial composition and function, and microorganisms modify their susceptibility to disease states, course, and prognosis. One such condition is diabetes (8–10).
Type 1 diabetes (T1D) is a chronic autoimmune disease in which pancreatic beta cells responsible for insulin production are destroyed. People with T1D account for 5–10% of the population with diabetes (11). Continuous subcutaneous insulin infusion (CSII) using an insulin pump is one of the most notable advancements in diabetes technology. Insulin pump therapy has become the preferred treatment for T1D, as it mimics the physiological secretion of insulin better than multiple daily injections. People with T1D treated with CSII therapy compared to traditional multiple daily insulin injections achieve improved glycemic control (12).
Diabetes not only affects the oral microbiome but also increases the risk of multiple local oral abnormalities in the oral cavity, affecting the quality of life of people with diabetes (13). People with diabetes are highly susceptible to dental caries, tooth loss, and periodontal disease (PD) (14, 15). The mechanisms responsible include quantitative and qualitative salivary changes, formation of advanced glycosylation end products, and their deposition in tissues, leading to vascular dysfunction due to hyperglycemia and accompanying atherosclerosis (13, 16).
Alterations in the oral microbiome of people with diabetes have been extensively investigated; however, most studies have focused on type 2 diabetes. The oral microbiome of individuals with T1D has rarely been the subject of extensive research. Interestingly, the results often contrast and cannot be generalized. Microbiome shifts have been reported to affect the immune function and metabolic control in this population (17, 18). Moreover, reports tend to focus on those with poor oral health, caries, or PD (19, 20).
Subgingival plaque accumulation is associated with the supragingival environment (21). Caries and PDs, which are common oral biofilm-related diseases, are caused by resident microorganisms in the oral cavity (22). The red complex is a specific group of bacteria considered to play a major role in the development of adult PD. These bacteria include Porphyromonas gingivalis, Treponema denticola, and Tannerella forsythia (23). People with T1D and good metabolic control of diabetes without a history of oral pathologies, are still underreached, showing alterations in the oral microbiome, such as a greater abundance of Streptococcus spp., Actinomyces spp., and Rothia spp., than healthy controls (17). Additionally, some studies have implemented traditional bacterial identification methods (24, 25). Therefore, the oral microbiome signature in T1D has not yet been established.
Novel approaches to the holistic investigation of phenomena include metagenomics, transcriptomics, proteomics, and metabolomics to identify the differences between healthy and diseased participants and their underlying mechanisms (26–28). Metabolomics can target various environments, such as stools, saliva, and gingival crevicular fluid (GCF), metabolites and metabolomics which can be associated with several diseases, including diabetes and PD (29–32). The roles of various metabolites in the human body, such as in the gut, respiratory tract, genitourinary tract, and oral cavity, are complicated and not well understood. In some cases, different concentrations of the same metabolite can have opposite effects depending on its location. Moreover, metabolites delivered in nutrients can influence microbiome composition, but these substances are also produced by bacteria, implicating complex bidirectional relationships (33).
Usually, saliva has been investigated, with only a few studies assessing the GCF microbiome or its metabolome. The GCF, which is derived from periodontal tissues, plays an important role in preserving the junctional epithelium and other periodontal structures (34, 35). It may play a dual role – either maintaining periodontal health and assuring the antimicrobial defense of the periodontium, as it contains immune cells, antibodies, and cytokines, or, when altered by acute or chronic immune processes, is responsible for the emergence of PD (36, 37). GCF contains multiple proteolytic and hydrolytic enzymes, bone-related biomarkers, cell death, and tissue breakdown products. Oral bacteria and products of their metabolism can also be identified in the GCF and add to the complexity of this oral niche (35). Thus, GCF analysis has the potential to become a predictive, preventive, and personalized medical approach for the diagnosis of PDs. Although GCF is inherently associated with PD, its metabolomics have rarely been investigated (29).
The present study aimed to assess the oral GCF microbiome and metabolome status in the group of adult people with T1D, homogenous with respect to the mode of diabetes management (CSII) and glycemic control.
2 Methods
2.1 Study design and participants
This was a cross-sectional study consecutively that recruited 110 adult participants. Sixty-five people with T1D were treated with continuous subcutaneous insulin infusion (CSII) in the Outpatient Clinic of the Department of Metabolic Diseases and Diabetology of the University Hospital in Krakow, an academic referral center for diabetes in southeastern Poland. Patients were matched with 45 non-diabetic controls.
Between October 1 and December 31, 2022, patients attending the clinic who met the inclusion criteria were offered the opportunity to participate in the study. After obtaining written consent, the sampling date was set and participants were instructed on how to prepare for the study procedures. The inclusion criteria were age 18–35 years, T1D diagnosed at least 1 year before recruitment, treatment with CSII for at least 6 months, and informed consent to participate. The exclusion criteria were pregnancy or breastfeeding and comorbidities, such as metabolic syndrome, cardiovascular disease, cancer, severe liver failure, or kidney failure. Diagnosis of T1D was confirmed based on the Diabetes Poland criteria. Data on age, sex, comorbidities, diabetes duration (on the day of sampling), glycated hemoglobin (HbA1c), and T1D treatment were extracted from the medical records. HbA1c levels were measured using high-performance liquid chromatography. Individuals with diabetes were matched with non-diabetic controls. The ratio of controls per case was set at 0.7:1.
Information on daily oral hygiene routines, frequency of dental appointments, and history of dental procedures were recorded. Examination of the oral cavity was performed by a trained dentist in a specially prepared room equipped with a dental chair and shadowless lamp to ensure maximal privacy for the participants. During periodontal examination, a WHO 621 periodontal probe was used to assess the Gingival Index (38), Gingival Sulcus Bleeding Index (39), and Plaque Index (39). PerioCP probe-15 was utilized to assess the Clinical Attachment Level (CAL) and Pocket Probing Depth. The oral health status was assessed using the Oral Hygiene Index (40), Community Periodontal Index, and Treatment Needs (41).
Microbiological samples were collected from the oral cavity by refraining from brushing the teeth with any kind of toothpaste or rinsing the oral cavity with any kind of mouthwash for 12 h prior to the visit. Additionally, information on the previous use of selected types of oral health products (i.e., toothpaste containing triclosan, mouthwash containing chlorhexidine, or any oral topical agent) was recorded. On the day of the examination, the participants refrained from brushing their teeth and drinking, eating, or smoking for 1 h before the microbiological samples were collected. To prevent salivary contamination of GCF, pieces of sterile gauze were used to remove excess saliva from the mucosal and dental surfaces. PerioPaper Strips were used to collect GCF samples. The strips were placed in the gingival pocket for 30–45 s until the surface was soaked. After the collection, strips were placed in 1 mL of Liquid Amies in a plastic screw cap tube (COPAN ESwab™).
2.2 DNA extraction and 16S rRNA sequencing
Genomic DNA was extracted and purified from PerioPaper Strips using the QIAamp DNA Mini Kit (QIAGEN, Hilden, Germany) with modifications to the bacterial protocols. DNA purity was measured on a NanoDrop™ 2000 Spectrophotometer (Thermo Fisher Scientific, Waltham, MA, USA) and quantified using fluorimetry with the Qubit dsDNA High Sensitivity Assay (Thermo Fisher Scientific, Carlsbad, CA, USA). Bacterial 16S rRNA libraries were prepared using an Ion 16S™ Metagenomics Kit and an Ion Plus Fragment Library Kit as previously described (42). Next, constructed libraries were sequenced on an Ion Torrent Personal Genome Machine (PGM) platform (Thermo Fisher Scientific, Waltham, MA, USA) using Ion PGM™ Hi-Q™ View Kit (Thermo Fisher Scientific, Waltham, MA, USA).
2.3 GCF microbiome metabolite quantification
The concentrations of short-chain fatty acids (SCFAs) and trimethylamine derivatives were determined using liquid chromatography coupled with mass spectrometry (Waters Acquity Ultra Performance Liquid Chromatograph, Waters TQ-S triple-quadrupole mass spectrometer, Waters). Waters MassLynx software was used for instrument control and data acquisition. Waters TargetLynx was used to process the data. To evaluate metabolites’ concentrations, one strip with gingival crevicular fluid (PerioPaper Strip) was incubated with 50 µL PBS for 30 min to extract all analytes. SCFAs and lactic acid analysis were based on derivatization using 3-nitrophenylhydrazine and N-(3-dimethylaminopropyl)-N′-ethylcarbodiimide-pyridine solution. LC-MS/MS analysis was performed in the negative electrospray ionization multiple-reaction monitoring mode. The SCFAs were separated using a Waters BEH C18 column (1.7 µm, 2.1 mm x 50 mm) and a Waters BEH C18 guard column (1.7 µm, 2.1 mm x 5 mm). A 1 mL of formic acid in 1 L of water was used as mobile phase A, and 1 mL of formic acid in acetonitrile was used as mobile phase B. The flow rate of the mobile phase was set at 0.6 mL/min. To determine trimethylamine (TMA), choline, carnitine, betaine and glycerophosphorylcholine, only 20 µL of a sample was used. TMA was performed using a butyl bromoacetate solution as the derivative reagent. The LC-MS/MS method has been previously described (43).
2.3 Statistical analysis
The null hypothesis used in the study was that there are significant differences in the alpha and beta diversity of the oral GCF microbiome between people with T1D treated with CSII and healthy non-diabetic controls.
Metagenomic analyses included comparisons between healthy controls and people with T1D and gingivitis (G) vs. those with T1D without G. Individuals with T1D were additionally divided into quartiles based on HbA1c and the first and fourth quartiles were compared. Metabolomic analyses included a comparison between healthy controls and people with T1D and G vs. those T1D without G. Additionally, we analyzed the correlation between metabolite concentrations and HbA1c%. In the metagenomic-metabolomic analysis, correlations between the identified bacterial taxa and selected metabolite concentrations were compared.
The PS Imago Pro ver. 8.0 and Statistical ver. (13) were used for all the statistical analyses. When data were missing, a complete case selection approach was used. Normality of the continuous variable distribution was assessed using the Shapiro–Wilk test. Differences between groups were analyzed using Student’s t-test or nonparametric tests (Mann–Whitney U test, Kruskal–Wallis ANOVA), when appropriate. Continuous variables were presented as arithmetic means () ± standard deviations (SD) or as the median with interquartile range (IQR) when the data were not normally distributed. The distribution of categorical variables was described as counts and percentages. Statistical testing was performed to compare categorical variables using an independent sample chi-square test or Fisher’s exact test, when appropriate. Statistical significance was set at p <0.05. The Bonferroni method was used to correct multiple comparisons. Power calculations using the RNASeqPower package estimated a power of 90% for a coverage depth of 10x, sample size of 45 (each group), coefficient of variation of 0.5, and effect size (fold-change) of 1.5.
The unmapped BAM files were converted into FASTQ files using Picard SamToFastq (44). Additional steps of the analysis were performed using the Mothur version 1.47 software (45). FASTQ files were converted to FASTA format. For the analyses, only sequences 200–300 bp in length with an average base quality of 20 in a sliding window of 50 bases and a maximum homopolymer length of 10 were used. Chimeric sequences were identified using the VSEARCH chimera detection algorithm with default parameters (46)and the internal sequence collection as the reference database. Chimeric sequences were removed and the remaining 16S rRNA sequences were classified using the Wang method and the SILVA bacterial 16S rRNA database (47) for reference (release 138) with an 80% bootstrap cut-off.
Differential taxon abundances were assessed using a mixed-effects model implemented in LinDA (48). The nonparametric Shannon diversity index and Chao1 richness index were determined using Mothur, with differences in the values of the indices assessed using the Mann–Whitney U-test. Bray–Curtis indices and principal coordinate analysis (PCoA) were performed using the vegan package (49). FDR-adjusted (50) P-values ≤ 0.05 were considered statistically significant. For SCFAs and amino acids, correlations with bacteria were determined using the Spearman’s coefficient.
2.4 Ethics and reporting guidelines
This study involving humans was approved by the Jagiellonian University Bioethics Committee (Komisja Bioetyczna Uniwersytetu Jagiellońskiego). The study was conducted in accordance with local legislation and institutional requirements. All the participants provided written informed consent to participate in this study.
This study was conducted in accordance with the Strengthening the Reporting of Observational Studies in Epidemiology guidelines. This checklist has been added to the Supplementary File.
3 Results
A total of 110 participants were included in the study: 65 people with type 1 diabetes and 45 matched healthy controls. The mean age of the sampled population was 27.05 ± 5.95 years. Sixty percent of participants were male. The mean duration of diabetes was 15.5 ± 8.4 years. All people with T1D were treated with continuous subcutaneous insulin infusion. The mean Hba1c% was 6.97 ± 0.95% (53 ± 2.2 mmol/mmol). No baseline differences were observed between the groups (Supplementary Table 1).
None of the participants had dental implants or prostheses. There were no cases of periodontitis in the study population, and 22 cases of mild G were observed in the T1D group. The selected dental indices and the prevalence of edentulism are summarized in Supplementary Table 1.
3.1 GCF microbiome analysis
Taxonomic profiling revealed that Firmicutes was the most abundant phylum (mean: 34%), followed by Proteobacteria (mean: 27%), Bacteroidota (mean: 16%), Actinobacteriota (mean: 12%), and Fusobacteriota (mean: 7%) (Figure 1). At the genus level Pasteurellaceae_unclassified, Haemophilus, Actinomyces, Veillonella, and Fusobacterium were the most abundant genera (Figure 1).
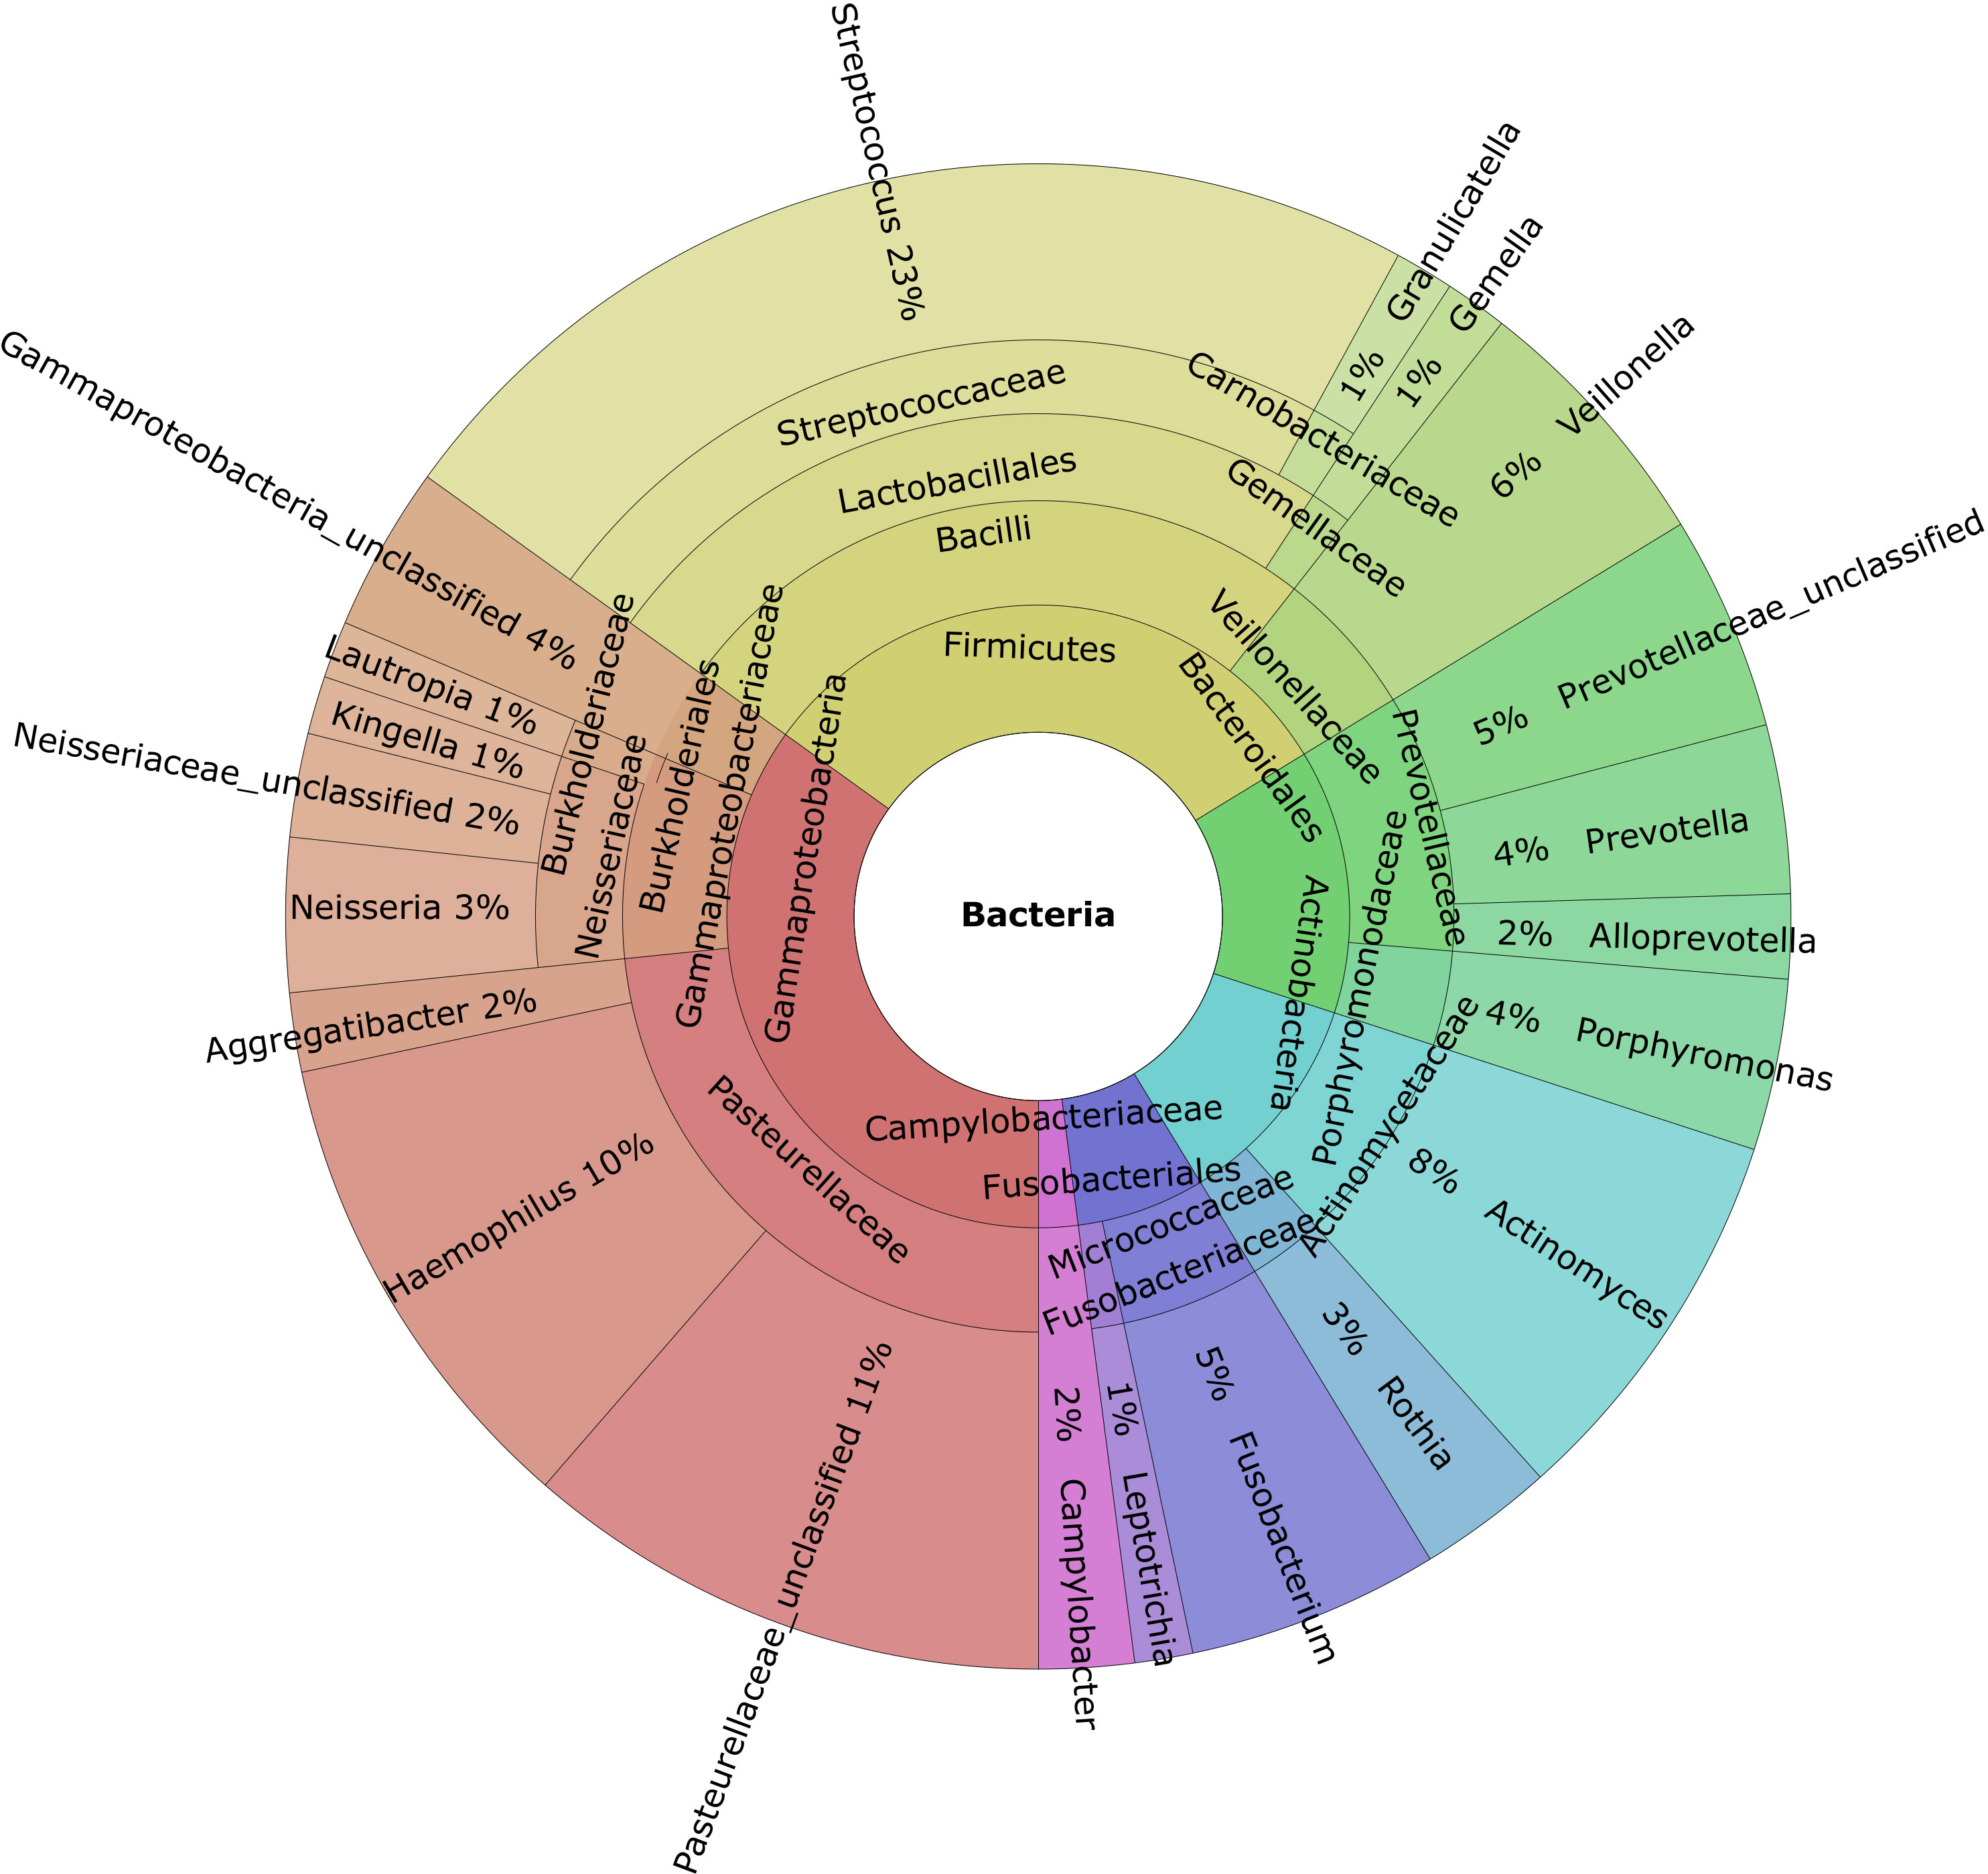
Figure 1 Krona charts of the genera with a mean abundance greater than 1% of the total found in the gingival crevicular fluid samples.
To identify the potential differences in the structure of the GCF microbiome, we first evaluated the α- and β-diversity in subgroups of T1D cases and controls divided according to clinical status. The α-diversity was analyzed using the Shannon index, a marker of bacterial richness and evenness, and the Chao index, a marker of richness. The β-diversity was analyzed using PCoA of Bray-Curtis distances.
GCF community composition did not differ between T1D cases and controls considering insignificant differences in the Shannon and Chao indices (Figure 2A, B), whereas there were borderline significant differences in the β-diversity (p =0.058, Figure 2C). In the first comparison between people with T1D without G and healthy controls, after adjusting for multiple comparisons, no differentiating taxa were identified. Next, we compared the GCF microbiomes of people with T1D and G to those with T1D and no gingival pathology. We found as many as 31 differential taxa at the adjusted p-value significance level when comparing people with T1D and G to those without G. All but one taxon, Cutibacterium spp. (p adjusted 0.04; FC -0.88), were overrepresented in participants with G (Supplementary Table 2). Third, people with T1D and G were compared with healthy controls. There were 38 differentially expressed taxa at the adjusted p-value significance level. All but one taxon, Hemophilus spp. (adjusted 0.026; FC 1-.79), were overrepresented in T1D participants with G (Supplementary Table 3).
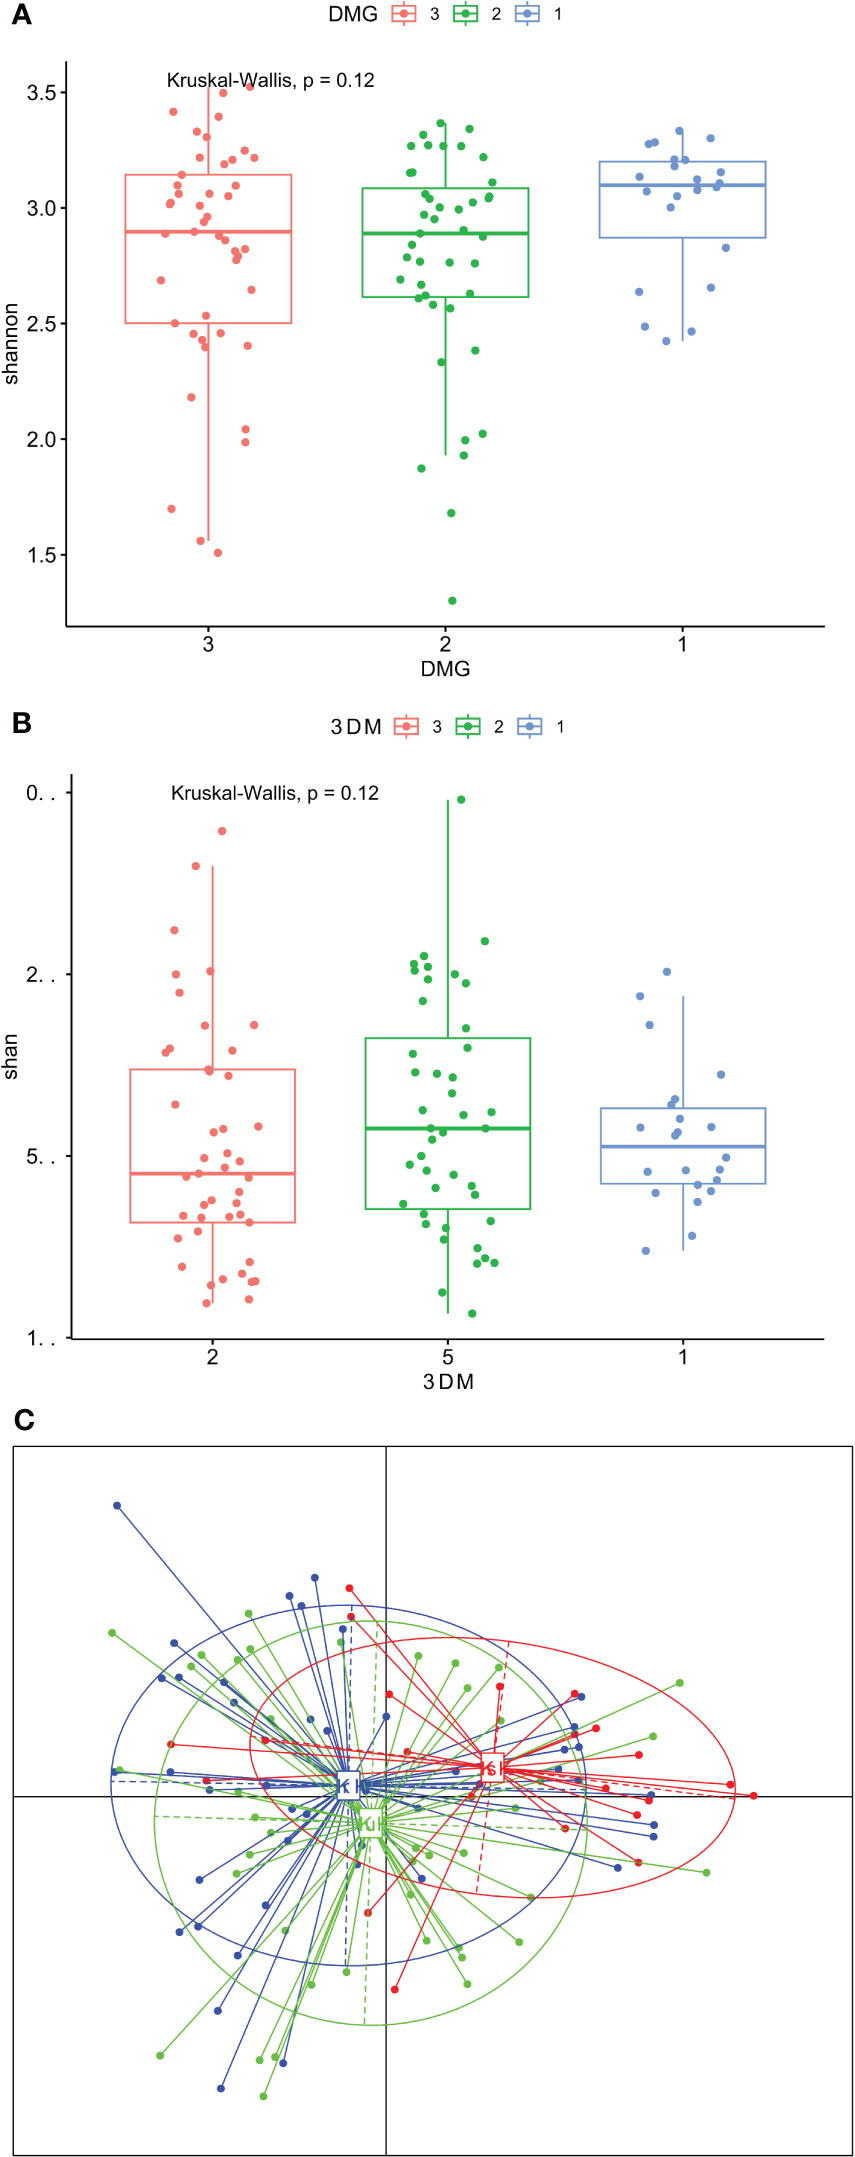
Figure 2 (A–C). Gingival crevicular fluid microbiome composition of people with type 1 diabetes and healthy controls. (A) – Shannon diversity; (B) – Chao diversity; (C) - PCoA (beta diversity); group 1 – people with type 1 diabetes and gingivitis (G), group 2 – people with type 1 diabetes without gingivitis, group 3 – healthy controls.
A side-by-side comparison of the differential taxa between people with T1D and G and those with T1D without G vs. those with T1D and G and healthy controls is presented in Table 1. In total, 20 taxa were different in both comparisons: 11 were specific only for comparisons between people with T1D and G vs. those with T1D without G, and 17 were present only in comparisons between people with T1D and G and healthy controls. Most taxa were enriched in people with T1D with G, apart from Cutibacterium ssp., which was more abundant than that in people with T1D without G vs. those with T1D and G, and Hemophilus spp. which was enriched in healthy controls vs. in people with T1D and G (Table 1).
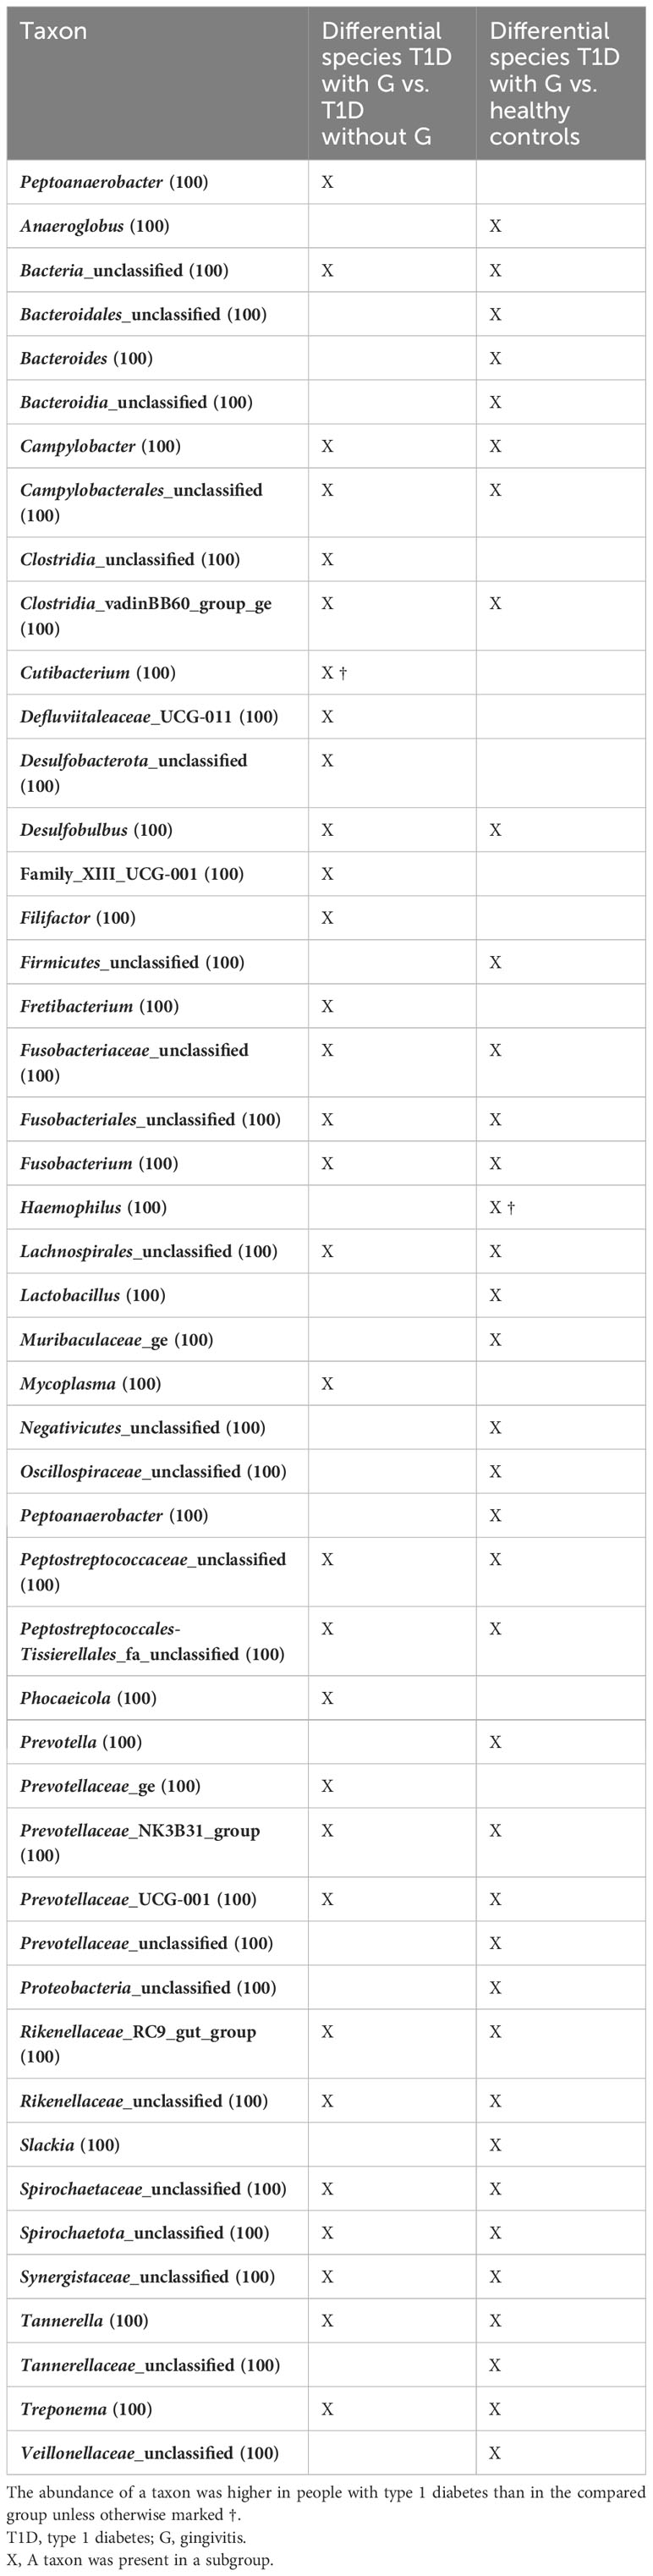
Table 1 Side-by-side comparison of differential taxa between people with T1D and gingivitis (G) and those with T1D without G vs. those with T1D and G vs. healthy controls.
Additionally, within the T1D group, those with HbA1c% in the first and fourth quartiles were compared, regardless of their gingival status. We further explored the association between the community structure of the GCF microbiome and HbA1c levels in people with T1D. There were no significant differences in the Shannon and Chao indexes and β-diversity (Supplementary Figure 1A–C). Two genera, Family_XIII_UCG-001 (padj 0.08; FC 2.53) and Prevotellaceae_YAB2003_group (p-adjusted 0.08; FC 2.25), tended to be overrepresented in the fourth quartile compared to the those in the first quartile of HbA1c after adjustment for multiple comparisons (Supplementary Table 4).
3.2 Metabolome
When comparing three groups – healthy controls without G, people with T1D without G, and people with T1D and G, after adjusting for multiple comparisons, there were some significant differences in the concentrations of the selected metabolites (Table 2). Acetic acid concentration was higher in people with T1D than in healthy controls, regardless of the presence of G. Propionic acid was significantly higher in people with T1D and G than in healthy controls. Isobutyric and isovaleric acid levels were higher in people with T1D and G than those in the other two subgroups. In contrast, valeric acid was lower and caproic acid was higher in individuals with diabetes (regardless of gingival status) than those in healthy controls (Figures 3A-E). There were some borderline insignificant results for the selected SCFAs and TMA (Figures 3F-H). In the correlation analysis between HbA1c and SCFA concentrations in people with T1D, there was only one significant result for VA, but the correlation was weak (Spearman’s correlation coefficient -0.272, p=0.031; Supplementary Table 5).

Table 2 Results of metabolomic analyses.
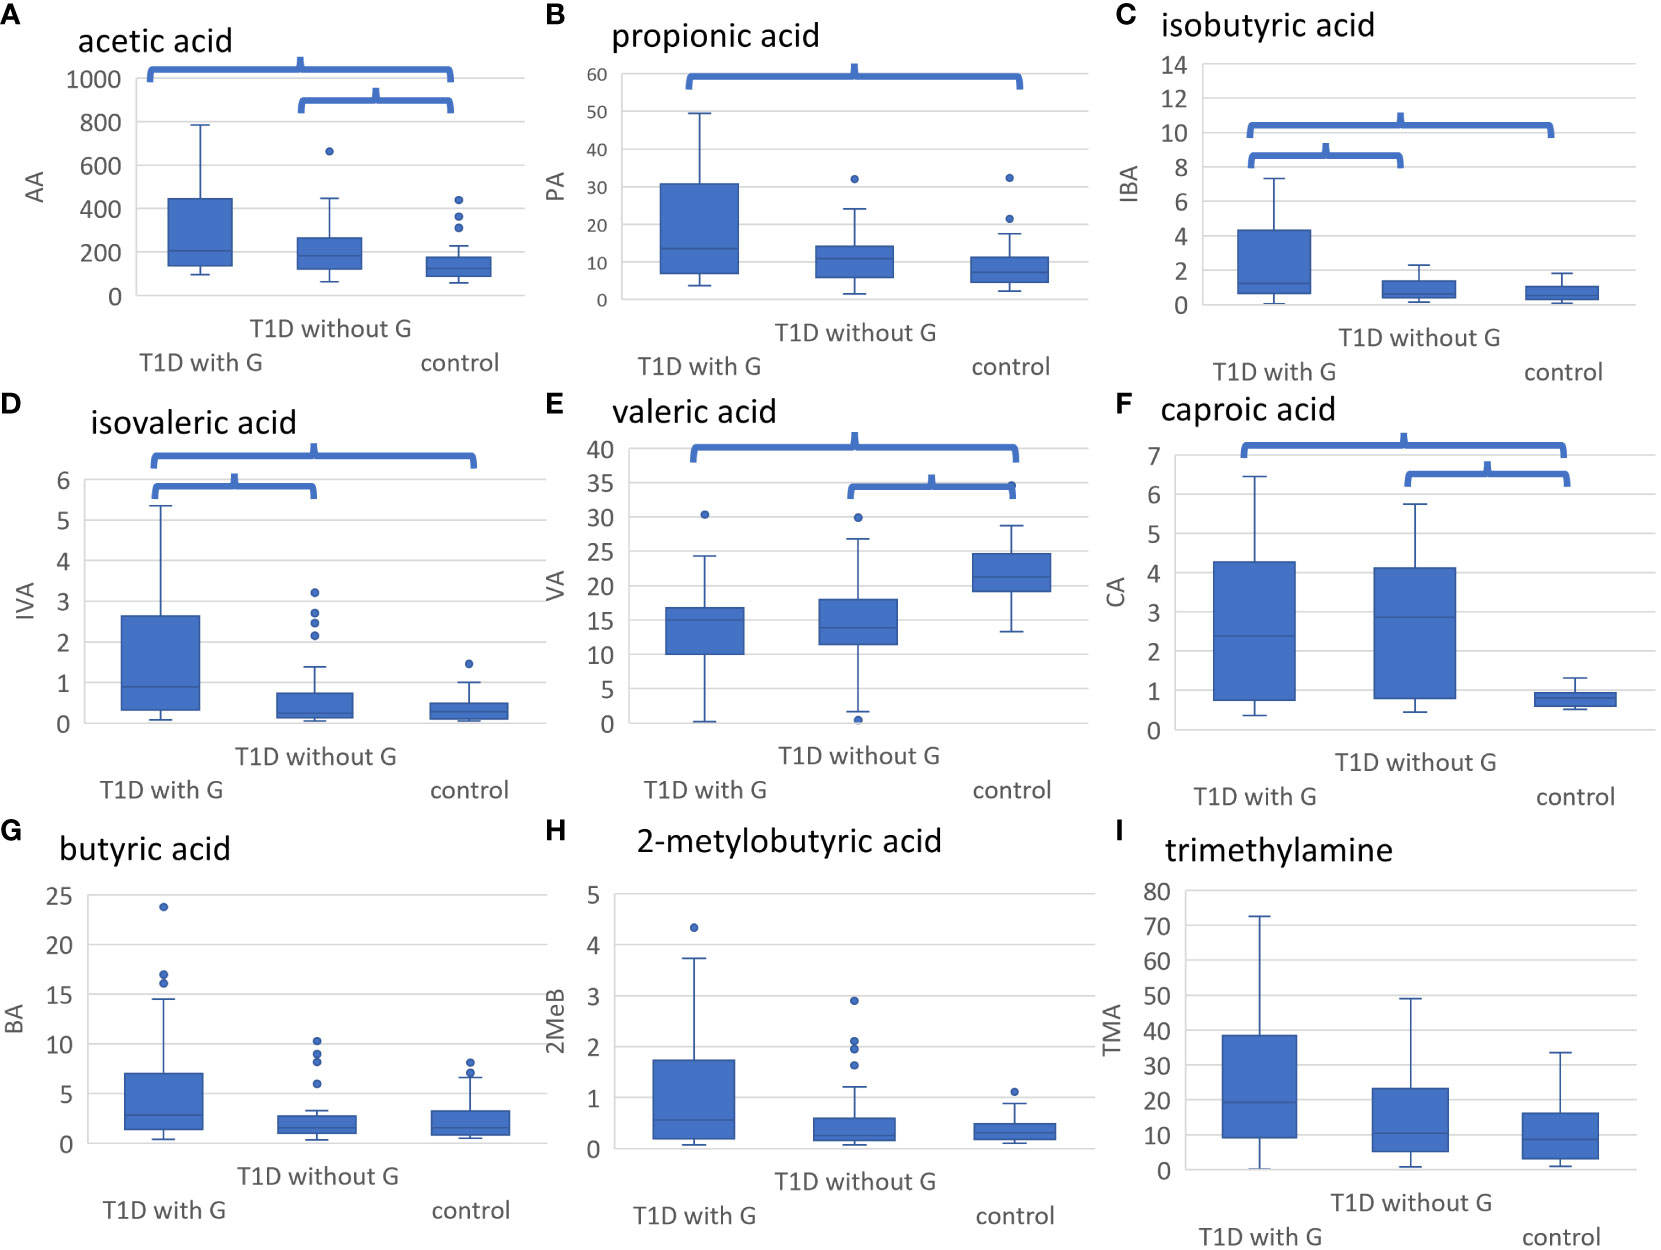
Figure 3 (A-I). Results of metabolomic analyses. Healthy controls without gingivitis (G), people with T1D without G and those with T1D and G were compared. Significant differences after adjustment with p value <0.05 are marked. (A) AA was significantly higher in people with T1D and G and those with T1D without G vs. healthy controls, (B) PA was significantly higher in people with T1D and G vs. healthy controls, (C) IBA was significantly higher in people with T1D and G vs. those with T1D without G and healthy controls, (D) IVA was significantly higher in people with T1D and G vs. those with T1D without G and healthy controls, (E) VA was significantly higher in healthy controls vs. all people with T1D, (F) CA was significantly lower in healthy controls vs. all people with T1D, (G) BA tended to be higher in people with T1D and G vs. those with T1D without D and healthy controls (not statistically significant), (H) 2MeB tended to be higher in people T1D and G vs. those with T1D without G and healthy controls (not statistically significant), (I) TMA tended to be higher in people with T1D and G vs. those with T1D without G and healthy controls (not statistically significant). LA, lactic acid; AA, acetic acid; PA, propionic acid; IBA, isobutyric acid; BA, butyric acid; 2MeB, 2-metylobutyric acid; IVA, isovaleric acid; VA, valeric acid; ICA, isocaproic acid; CA, caproic acid; TMA, trimethylamine; GPA, glycerophosphorylcholine; A-H, concentration in mmol/l; I, concentration in umol/l.
3.3 Integrated metagenomic–metabolomic analysis
In the metagenomic–metabolomic analysis, we analyzed the correlations between the identified bacterial taxa and selected metabolite concentrations. The results are shown in Figures 4A, B.
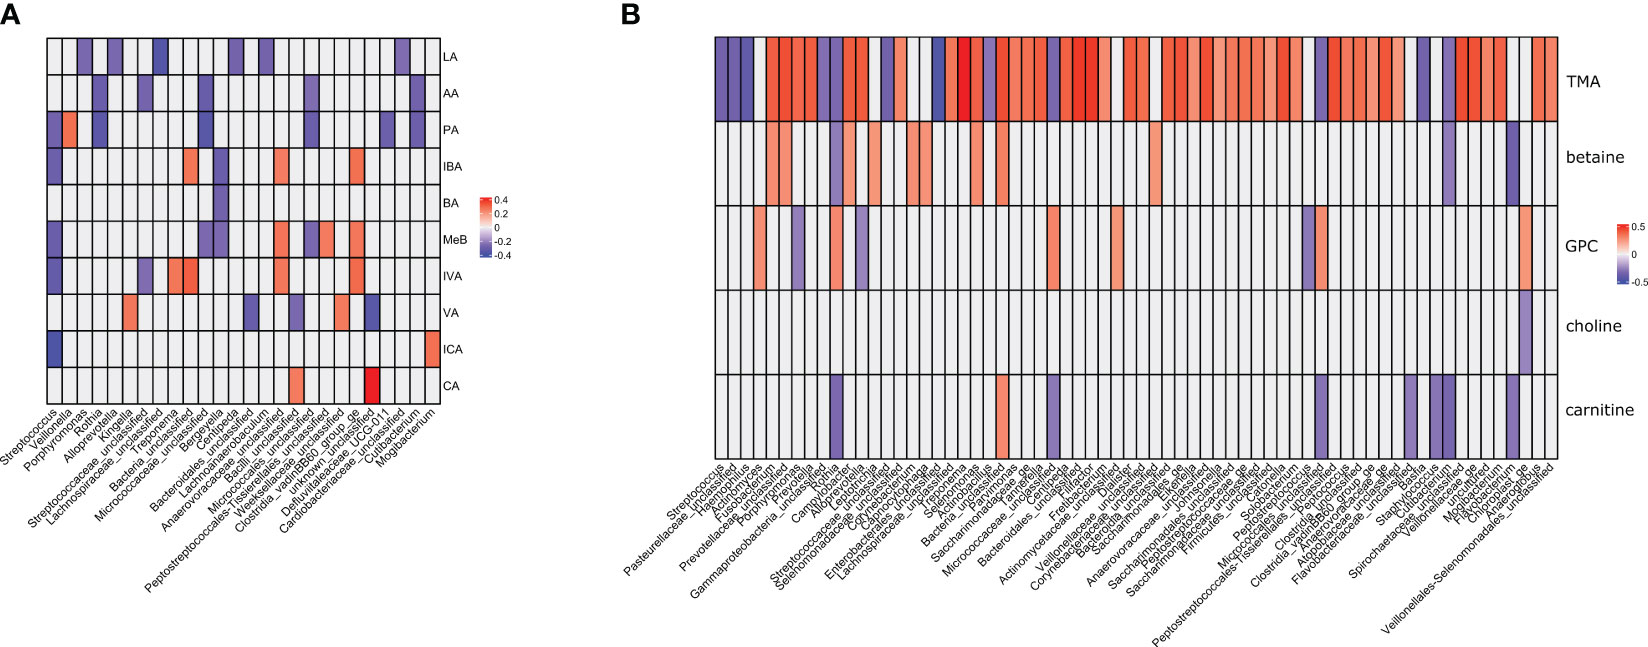
Figure 4 (A, B). Metagenomic–metabolomic analyses between the identified bacterial taxa and selected metabolites concentrations. Correlation coefficients significant at p>0.05 are presented and color-coded. (A) lactic acid and short chain fatty acids. (B) trimethylamine and its metabolites. LA, lactic acid; AA, acetic acid; PA, propionic acid; IBA, isobutyric acid; BA, butyric acid; 2MeB, 2-metylobutyric acid; IVA, isovaleric acid; VA, valeric acid; ICA, isocaproic acid; CA, caproic acid; TMA, trimethylamine; GPA, glycerophosphorylcholine.
There were 85 and 46 correlations with absolute value above 0.25 for amino acids and SCFAs, respectively. All correlations were statistically significant at a nominal p-value <0.05 (Supplementary Table 6). Among the amino acids, TMA had the strongest positive correlation with 20 correlations with coefficients above 0.4 (Supplementary Table 6). There were also two strong negative correlations (coefficient below -0.4). The correlations with SCFAs were of low strength, with only one absolute value above 0.4. Most correlations between SCFA concentrations and bacterial genera were weak or moderate. Bergeyella spp. were negatively correlated with BA, IBA, and MeB. Kingella spp. were positively correlated with VA. Micrococcae were negatively correlated with AA, PA, and MeB. Rothia spp. were negatively correlated with AA and PA. Streptococcae were negatively correlated with AA, PA, MeB, IBA, ICA, and IVA. Veilonella spp. were positively correlated with PA, and Treponema spp. with IVA. Trimethylamine was the only metabolite that showed moderate correlation with the selected bacterial genera. The strongest positive correlations were observed with Treponema spp., Tanerella spp., Filifactor spp., Tanerella spp., and Porphyrimonas spp. (Table S6). The greatest negative correlations were observed for Streptococcus spp., Hemophilus spp., Rothia spp., Basfia spp., and Flavobacterium spp.
4 Discussion
4.1 Microbiome
To date, most oral microbiome studies on people with T1D have included children or individuals with a wide range of metabolic controls. Furthermore, saliva is usually analyzed. To the best of our knowledge, this is the first study to investigate the GCF microbiome in people with T1D. In our study, we aimed to fill the knowledge gap in people with longstanding T1D treated with modern technologies, such as CSII, demonstrating good glycemic control.
In this study, we showed that intensively treated people with T1D with satisfactory glycemic control and non-diabetic individuals did not differ considering the Shannon and Chao indices, but β-diversity tended towards significant differences, especially pronounced for people with concomitant T1D and G. There were no differences within the T1D subgroup when comparing participants in the first and fourth quartile of HbA1c, that is, those with the best and worst metabolic control of diabetes. This is an important conclusion of the study. With relatively well-controlled diabetes, slight differences in glycemic control did not significantly affect the oral microbiome, which was comparable to that observed in people without diabetes. Despite good metabolic control of diabetes, people with T1D had a higher prevalence of mild G than healthy controls. People with T1D and G show apparent shifts in the GCF microbiome and metabolome, which have been associated with periodontitis.
In one study on the oral microbiome in children with metabolically stable T1D, differences between T1D participants and healthy children included reduced Shannon diversity in the T1D group. However, no differences in bacterial diversity have been reported in a cohort similar to that in the present study (51). When comparing participants after stratification by HbA1c level, the differences in microbiome composition were barely notable in our cohort, which is in line with other studies (17, 51). In contrast, another study investigated a cohort of people with severely uncontrolled T1D. Those with high HbA1c levels were characterized by significantly decreased Chao and Shannon indices and an increased Simpson index of the oral microbiome (52). A comparison between individuals with T1D without periodontal pathology and healthy controls did not reveal any significant differences in the GCF microbiome, with no apparent differentiating taxa between these two groups. This may suggest that in T1D population intensive treatment and good glycemic control along with the lack of oral pathology can increase the probability of preserving the “healthy” GCF microbiome in this population.
Previous studies comparing the oral microbiome in people with T1D and non-diabetic populations have reported some distinctions. They showed a significantly high abundance of Streptococcus spp., Actinomyces spp., and Rothia spp (17).. In another study, commensal Streptococcus spp., Granulicatella spp., Rothia spp., and Rhodococcus spp. were decreased in diabetic children as well as Veillonella spp. and Prevotella spp. However, these T1D children presented with severe glycemic dysregulation (52). Importantly, in studies comparing the oral microbiome between people with T1D with non-diabetics, a thorough assessment of oral health status has not been performed widely, in contrast to this study. However, the results of the selected reports are similar to ours (51). Within the T1D subgroup (regardless of gingival pathology), the abundance of Anaerovoracaceae and Prevotellaceae was higher in those with poor metabolic control. The higher prevalence of Prevotella in individuals with T1D and worse diabetes control may be associated with a higher risk of PD in this subgroup. A poor-quality, high-sugar diet in T1D has been reported to be associated with a high abundance of Prevotella copri (53). This was linked to an altered periodontal status (54, 55). Anaerovoracaceae is another novel taxon that has been reported in oral microbiome studies. These genes were found to be enriched in individuals with diabetic retinopathy (56).
Additional analyses comparing individuals with T1D and G and those with only T1D or non-diabetic individuals with a healthy periodontium revealed some interesting differences. G seemed to be responsible for the majority of these discrepancies, as multiple taxa differentiated participants with G from those without such pathology, including some associated with various oral pathologies, such as Fusobacterium spp (57)., Negativicutes (58), Prevotella spp (54, 55)., Tanerella spp., and Treponema spp (59).. Previously, periodontally healthy diabetic participants had lower species richness than healthy controls, but also had higher loads of red complex species responsible for the development of periodontal pathology, potentially putting them at risk of developing periodontitis (59, 60). There is no consensus on whether oral microbiome diversity is higher (61) or lower (60) in people with diabetes and PD. Specifically, the subgingival tissue microbiome showed a relatively high abundance of Leptotrichiaceae, Neisseriaceae, Lactobacillus, Corynebacterium, Pseudomonas, Saccharibacteria, Aggregatibacter, Neisseria, Gemella, Eikenella, Selenomonas, Actinomyces, Capnocytophaga, Fusobacterium, Veillonella, Streptococcus, and Actinomyces. For Filifactor, Prevotella, and Parvimonas, low abundances were observed (59). To date, studies have mainly included individuals with periodontitis. However, in our study, the spectrum of PD was limited to mild cases of G. This and the good metabolic control of diabetes may have been one of the reasons for the discrepancies between our data and those of previous research.
A more detailed analysis of the differences in differentiating taxa between people with T1D and G and T1D without it vs. those with T1D and G and non-diabetic controls revealed some interesting observations. Comparisons within people with T1D omit the impact of diabetes on any potential differentiating taxa, showing, in our opinion, the core differences between those with and without G. Nevertheless, quantitatively, there were more differentiating taxa in the analysis of nondiabetics than in those with T1D. Qualitatively, some taxa that differentiated people with T1D and G vs. non-diabetics but their abundances were similar within people with T1D included Bacteroides spp., Firmicutes spp., and Lactobacillus spp. This suggests that individuals with T1D, even those without clinically visible signs of periodontal pathology, show specific shifts in the GCF microbiome, putting them at risk of developing PD.
4.2 Metabolome
SCFAs are formed from saturated aliphatic organic acids containing one–six carbon atoms (62). SCFAs are produced by gut microbes during fiber fermentation (63). Considering the gut microbiome, SCFAs have also been investigated as potential additives in the regular diet to positively influence insulin sensitivity, obesity, diabetes control, and immune modulation to counter autoimmune diseases (63, 64). SCFAs, as products of bacterial metabolism, can also be found in periodontal pockets; however, there are only singular studies on this subject (65). Bacteria known to produce SCFAs include Porphyromonas gingivalis, Treponema denticola, Aggregatibacter actinomycetemcomitans, Prevotella intermedia, and Fusobacterium nucleatum (66). GCF SCFAs produced locally in gingival pockets seem to play a role opposite to that in the gut and are considered responsible for local pathologies, such as PD. The complexity is added by data suggesting that specific nutrients that modify the level of SCFAs production in the gut can improve periodontal status (67, 68). Finally, not only are SCFAs produced by bacteria, but dietary SCFAs can also influence the microbiome composition, implicating complex bidirectional associations (33).
In our study, the concentrations of selected SCFAs, including acetic acid and caproic acid, were higher in people with T1D than in those without diabetes, whereas isobutyric and isovaleric acids were higher in people with T1D and G than in the remaining participants. However, the concentration of valeric acid was lower in people with diabetes than in healthy controls. These findings are in agreement with the results of the integrated metagenomic–metabolic analysis. For example, Treponema spp. were positively correlated with isovaleric acid concentrations, which were higher in participants with T1D and G. Interestingly, we did not identify differences in the abundance of Streptococcus spp. between T1D participants and healthy controls but identified negative correlations between Streptococcus spp. and acetic acid, isobutyric acid, isocaproic acid, and isovaleric acid concentrations. The levels of these metabolites were high in the T1D subgroup. This, in concurrence with the abovementioned findings in differential taxa between the studied groups, may suggest the first stage towards the development of an abnormal oral microbiome and, further, the emergence of PD.
Along with the early alterations in the microbiome discussed above, disturbances in metabolite concentrations may be treated as a marker of oral cavity acidification, an auxiliary predisposing factor for caries and PD (69). This is consistent with previous observations showing an abundance of acid-producing bacteria in individuals with diabetes. As this process progresses, it can lead to destabilization of the balance between Streptococcus spp. and the emergence of clinical oral pathology (70).
Acetate, derived primarily from microorganisms on the skin in the oral cavity and the gastrointestinal, urogenital, and respiratory tracts, has immunomodulatory effects (71). They are also involved in tissue development, nutrient absorption, and metabolism (72–74). Acetate plays a role in maintaining the intestinal barrier (75, 76). The metabolic processes affected by acetate include the accumulation of body fat, liver lipids, and cholesterol synthesis (77). Acetate in the gut is predominantly produced by Prevotella and Bifidobacterium spp (78).. Acetate is also used by Firmicutes to produce butyrate (79). The serum concentrations of acetate and propionate in individuals with T1D have been reported to be lower than those in individuals without diabetes (17). Importantly, the roles of serum and gut acetate seem to contradict that of oral acetate. Although serum acetate may protect against the emergence of anti-islet cell autoantibodies (80), local oral acetate administration may also promote periodontal pathology.
In type 2 diabetes, propionate acts locally on tissues, improving insulin sensitivity, suppressing cholesterol synthesis, and lowering the risk of cardiovascular disease (81). In a mouse model, gut integrity is ensured by the healthy commensalism of lactate- and butyrate-producing bacteria, with non-butyrate-producing bacteria preventing optimal mucin synthesis in individuals with type 1 diabetes (82). Butyrate has also been intensely investigated as a supplement to improve immune function, strength, and physical function and alleviate symptoms of gastrointestinal tract diseases (83).
We did not observe any changes in GCF butyrate concentrations between people with T1D and healthy controls. One possible explanation for this may be that the gingival pocket was the site of sampling in our study, as most studies have assessed its levels in the gut or serum. Moreover, none of the participants had PD. Nevertheless, we hypothesized that the observed alterations in SCFAs concentrations may reflect a predisposition towards the development of an early preclinical stage of PD.
A few studies that investigated oral propionate and butyrate have reported that their levels are increased in PDs, regardless of the diagnosis of diabetes (84). In participants with PD, the GCF concentrations of acetic, propionic, and butyric acids were positively correlated with P. gingivalis, T. denticola, F. alocis, T. socraskii, F. nucleatum, and T. forsythia (85, 86).
In vitro studies have shown that high concentrations of butyrate can induce apoptosis in gingival fibroblasts, leading to periodontal tissue damage (87, 88). High concentrations of lactic acid and a wide range of SCFAs, including acetic, propionic, butyric, and isovaleric acids, in GCF have been observed in patients with aggressive periodontitis. Interestingly, the probing depth and attachment loss were positively correlated with the concentrations of the selected SCFAs (85). As butyrate can have both detrimental and beneficial effects, this is likely attributed to the tissues where it is produced, i.e., where it acts locally, and its concentration (89).
The functional and physiological effects of isobutyric and 2-methylbutanoic acids are poorly understood. Valeric acid in the gut is produced by the microbial metabolism of lactic acid and propionic acids (90). A study of women with gestational diabetes (GDM) showed that the levels of isobutyric, isovaleric, valeric, and caproic acids were high in women with GDM (91). The authors linked high levels of inflammation to hyperglycemia and a dysbiotic gut microbiome in this population (91). Women with GDM have also been reported to have a high abundance of Prevotella spp., a potential caproic acid-producer, which leads to increased caproic acid production (92). Our findings on valeric, isovaleric, and caproic acids in the GCF of people with T1D are novel and partially in contrast with these reports, requiring further investigation and analysis in conjunction with other potential factors, such as diet or body composition.
Trimethylamine and its metabolites were not significantly different between the subgroups in our study, with TMA being the only metabolite nearing significance, with numerically higher concentrations in people with T1D and G. Trimethylamine levels are elevated in patients with PD (93). In our study, trimethylamine concentrations were positively correlated with typical red complex bacteria (Tanerella spp., Treponema spp., and Fusobacterium spp.) that are responsible for the development of PDs.
4.3 Limitations
The inclusion of only relatively young people with T1D with good glycemic control may be regarded as both a limitation and a strength. This is a homogeneous subgroup representative of a large portion of the T1D population. The percentage of well-controlled people with T1D within the entire T1D population will probably increase, at least in developed countries, with more common usage of advanced technologies, such as continuous glucose measurements and semi-automated or hybrid insulin pumps. However, our findings cannot be extrapolated to patients with poor metabolic control. Notably, our group was relatively young and free of advanced complications of diabetes. Thus, the results of our analysis cannot be extrapolated to older populations or individuals with advanced micro-and macrovascular complications of diabetes, such as renal failure and advanced cardiovascular diseases. We did not observe any cases of PD in our population, which may have affected our microbiome and metabolome findings. In this study, we focused on limited confounders related to microbiome and metabolome results. As more data regarding diet and body structure remain to be analyzed, the acquired picture may not be fully explained. Finally, measurements of fecal and serum SCFA levels may poorly reflect biologically active SCFA levels. Only up to 10% are found in these types of samples, as active SCFAs are constantly produced, utilized by microbial cross-feeding, or interact with host cells (17).
5 Conclusions
The GCF microbiome in intensively treated people with T1D with satisfactory glycemic control and healthy gingival tissues was similar to that in non-diabetic controls. People with T1D and G show clear shifts in the GCF microbiome and metabolome. In this cohort of people with T1D, HbA1c% did not have a significant impact on SCFA concentrations in the correlation analysis. By contrast, the GCF microbiome appeared to have a significant relationship with SCFAs. This suggests that despite good metabolic control of diabetes, people with T1D are susceptible to the development of PDs. This was demonstrated by early changes in the structure of the GCF microbiome and altered concentrations of selected metabolites in this environment.
To summarize, the identification of early changes in periodontal tissues by targeting microbiome and metabolome changes could potentially enable effective prevention and initial treatment of PD in people with T1D.
Data availability statement
The data presented in the study are deposited in the NCBI BioProject repository, accession number ID: 1064953.
Ethics statement
This study involving humans was approved by the Jagiellonian University Bioethics Committee (Komisja Bioetyczna Uniwersytetu Jagiellońskiego). The study was conducted in accordance with local legislation and institutional requirements. All the participants provided written informed consent to participate in this study.
Author contributions
IG-M: Conceptualization, Funding acquisition, Investigation, Methodology, Project administration, Resources, Supervision, Writing – original draft, Writing – review & editing. MKa: Data curation, Formal analysis, Investigation, Validation, Visualization, Writing – original draft, Writing – review & editing. MD: Data curation, Formal analysis, Software, Validation, Visualization, Writing – review & editing. ES: Data curation, Formal analysis, Software, Validation, Visualization, Writing – review & editing. NŻ-L: Data curation, Formal analysis, Software, Validation, Visualization, Writing – review & editing. MKu: Data curation, Formal analysis, Software, Validation, Visualization, Writing – review & editing. TK: Methodology, Resources, Supervision, Writing – review & editing.
Funding
The author(s) declare financial support was received for the research, authorship, and/or publication of this article. This study was supported by a grant from the Polish Ministry of Science and Higher Education (NdS/545131/2022/2022).
Conflict of interest
The authors declare that the research was conducted in the absence of any commercial or financial relationships that could be construed as a potential conflict of interest.
Publisher’s note
All claims expressed in this article are solely those of the authors and do not necessarily represent those of their affiliated organizations, or those of the publisher, the editors and the reviewers. Any product that may be evaluated in this article, or claim that may be made by its manufacturer, is not guaranteed or endorsed by the publisher.
Supplementary material
The Supplementary Material for this article can be found online at: https://www.frontiersin.org/articles/10.3389/fendo.2023.1332406/full#supplementary-material
References
1. Jose M, Rajagopal V, Thankam FG. Oral tissue regeneration: Current status and future perspectives. Regenerated Organs: Future Perspect (2021), 169–87. doi: 10.1016/B978-0-12-821085-7.00009-9
2. Kamrani P, Sadiq NM. Anatomy, head and neck, oral cavity (Mouth) (2023). StatPearls. Available at: https://www.ncbi.nlm.nih.gov/books/NBK545271/ (Accessed December 13, 2023).
3. Atkinson ME. The oral cavity and related structures. Anat Dental Students (2013), 257–76. doi: 10.1093/OSO/9780199234462.003.0034
4. Dewhirst FE, Chen T, Izard J, Paster BJ, Tanner AC, Yu WH, et al. The human oral microbiome. J Bacteriol (2010) 192(19):5002–17. doi: 10.1128/JB.00542-10
5. Kleinstein SE, Nelson KE, Freire M. Inflammatory networks linking oral microbiome with systemic health and disease. J Dent Res (2020) 99(10):1131–9. doi: 10.1177/0022034520926126
6. Peng X, Cheng L, You Y, Tang C, Ren B, Li Y, et al. Oral microbiota in human systematic diseases. Int J Oral Sci (2022) 14:1. doi: 10.1038/s41368-022-00163-7
7. Li X, Liu Y, Yang X, Li C, Song Z. The oral microbiota: community composition, influencing factors, pathogenesis, and interventions. Front Microbiol (2022) 13:895537/BIBTEX. doi: 10.3389/FMICB.2022.895537/BIBTEX
8. Siljander H, Honkanen J, Knip M. Microbiome and type 1 diabetes. EBioMedicine (2019) 46:512–21. doi: 10.1016/J.EBIOM.2019.06.031
9. Bourgeois D, Inquimbert C, Ottolenghi L, Carrouel F. Periodontal pathogens as risk factors of cardiovascular diseases, diabetes, rheumatoid arthritis, cancer, and chronic obstructive pulmonary disease-is there cause for consideration? Microorganisms (2019) 7(10):424. doi: 10.3390/microorganisms7100424
10. Shaalan A, Lee S, Feart C, Garcia-Esquinas E, Gomez-Cabrero D, Lopez-Garcia E, et al. Alterations in the oral microbiome associated with diabetes, overweight, and dietary components. Front Nutr (2022) 9:914715. doi: 10.3389/FNUT.2022.914715
11. Diabetes . Available at: https://www.who.int/health-topics/diabetes#tab=tab_1 (Accessed July 8, 2023).
12. Berget C, Messer LH, Forlenza GP. A clinical overview of insulin pump therapy for the management of diabetes: past, present, and future of intensive therapy. Diabetes Spectr (2019) 32(3):194. doi: 10.2337/DS18-0091
13. Ferizi L, Dragidella F, Spahiu L, Begzati A, Kotori V. The influence of type 1 diabetes mellitus on dental caries and salivary composition. Int J Dent (2018) 2018:5780916. doi: 10.1155/2018/5780916
14. Dicembrini I, Serni L, Monami M, Caliri M, Barbato L, Cairo F, et al. Type 1 diabetes and periodontitis: prevalence and periodontal destruction—a systematic review. Acta Diabetol (2020) 57(12):1405–12. doi: 10.1007/s00592-020-01531-7
15. Ahmad R, Haque M. Oral health messiers: Diabetes mellitus relevance. Diabetes Metab Syndrome Obes (2021) 14:3001–15. doi: 10.2147/DMSO.S318972
16. Mauri-Obradors E, Estrugo-Devesa A, Jané-Salas E, Viñas M, López-López J. Oral manifestations of Diabetes Mellitus. A systematic review. Med Oral Patol Oral Cir Bucal (2017) 22(5):e586. doi: 10.4317/MEDORAL.21655
17. De Groot PF, Belzer C, Aydin Ö, Levin E, Levels JH, Aalvink S, et al. Distinct fecal and oral microbiota composition in human type 1 diabetes, an observational study. PloS One (2017) 12(12):e0188475. doi: 10.1371/JOURNAL.PONE.0188475
18. Martellacci L, Quaranta G, Patini R, Isola G, Gallenzi P, Masucci L. A literature review of metagenomics and culturomics of the peri-implant microbiome: current evidence and future perspectives. Materials (2019) 12(18):3010. doi: 10.3390/MA12183010
19. Jensen ED, Selway CA, Allen G, et al. Early markers of periodontal disease and altered oral microbiota are associated with glycemic control in children with type 1 diabetes. Pediatr Diabetes (2021) 22(3):474–81. doi: 10.1111/PEDI.13170
20. van Heck JIP, Gacesa R, Stienstra R, Fu J, Zhernakova A, Harmsen HJM, et al. The gut microbiome composition is altered in long-standing type 1 diabetes and associates with glycemic control and disease-related complications. Diabetes Care (2022) 45(9):2084–94. doi: 10.2337/DC21-2225
21. Buduneli N. Environmental factors and periodontal microbiome. Periodontol 2000 (2021) 85(1):112–25. doi: 10.1111/PRD.12355
22. Bertolini M, Costa RC, Barão VAR, Villar CC, Retamal-Valdes B, Feres M, et al. Oral microorganisms and biofilms: new insights to defeat the main etiologic factor of oral diseases. Microorganisms (2022) 10(12):2413. doi: 10.3390/microorganisms10122413
23. Curtis MA, Diaz PI, Van Dyke TE. The role of the microbiota in periodontal disease. Periodontol 2000 (2020) 83(1):14–25. doi: 10.1111/PRD.12296
24. Pachoński M, Koczor-Rozmus A, Mocny-Pachońska K, Łanowy P, Mertas A, Jarosz-Chobot P. Oral microbiota in children with type 1 diabetes mellitus. Pediatr Endocrinol Diabetes Metab (2021) 27(2):100–8. doi: 10.5114/PEDM.2021.104343
25. Gregorczyk-Maga I, Fiema M, Kania M, Jachowicz-Matczak E, Romaniszyn D, Gerreth K, et al. Oral microbiota—One habitat or diverse niches? A pilot study of sampling and identification of oral bacterial and fungal biota in patients with type I diabetes mellitus treated with insulin pump. Int J Environ Res Public Health (2023) 20(3):2252. doi: 10.3390/ijerph20032252
26. Hyvärinen E, Savolainen M, Mikkonen JJW, Kullaa AM. Salivary metabolomics for diagnosis and monitoring diseases: challenges and possibilities. Metabolites (2021) 11(9):587. doi: 10.3390/METABO11090587
27. Gardner A, Carpenter G, So PW. Salivary metabolomics: from diagnostic biomarker discovery to investigating biological function. Metabolites (2020) 10(2):47. doi: 10.3390/METABO10020047
28. Sukriti KC, Wang XZ, Gallagher JE. Diagnostic sensitivity and specificity of host-derived salivary biomarkers in periodontal disease amongst adults: Systematic review. J Clin Periodontol (2020) 47(3):289–308. doi: 10.1111/JCPE.13218
29. Brito F, Curcio HFQ, da Silva Fidalgo TK. Periodontal disease metabolomics signatures from different biofluids: a systematic review. Metabolomics (2022) 18(11):1–20. doi: 10.1007/S11306-022-01940-5/METRICS
30. Baima G, Iaderosa G, Citterio F, Grossi S, Romano F, Berta GN, et al. Salivary metabolomics for the diagnosis of periodontal diseases: a systematic review with methodological quality assessment. Metabolomics (2021) 17(1):1–21. doi: 10.1007/s11306-020-01754-3
31. Jin Q, Ma RCW. Metabolomics in diabetes and diabetic complications: insights from epidemiological studies. Cells (2021) 10(11):2832. doi: 10.3390/CELLS10112832
32. Arneth B, Arneth R, Shams M. Metabolomics of type 1 and type 2 diabetes. Int J Mol Sci (2019) 20(10):2467. doi: 10.3390/IJMS20102467
33. Magrin GL, Strauss FJ, Benfatti CAM, Maia LC, Gruber R. Effects of short-chain fatty acids on human oral epithelial cells and the potential impact on periodontal disease: A systematic review of in vitro studies. Int J Mol Sci (2020) 21(14):1–19. doi: 10.3390/IJMS21144895
34. Bibi T, Khurshid Z, Rehman A, Imran E, Srivastava KC, Shrivastava D. Gingival crevicular fluid (GCF): A diagnostic tool for the detection of periodontal health and diseases. Molecules (2021) 26(5):1208. doi: 10.3390/molecules26051208
35. Subbarao K, Nattuthurai G, Sundararajan S, Sujith I, Joseph J, Syedshah Y. Gingival crevicular fluid: an overview. J Pharm Bioallied Sci (2019) 11(Suppl 2):S135. doi: 10.4103/JPBS.JPBS_56_19
36. Pei J, Li F, Xie Y, Liu J, Yu T, Feng X. Microbial and metabolomic analysis of gingival crevicular fluid in general chronic periodontitis patients: lessons for a predictive, preventive, and personalized medical approach. EPMA J (2020) 11(2):197–215. doi: 10.1007/S13167-020-00202-5
37. Romero-Castro NS, Vázquez-Villamar M, Muñoz-Valle JF, Reyes-Fernández S, Serna-Radilla VO, García-Arellano S, et al. Relationship between TNF-α, MMP-8, and MMP-9 levels in gingival crevicular fluid and the subgingival microbiota in periodontal disease. Odontology (2020) 108(1):25–33. doi: 10.1007/s10266-019-00435-5
38. Löe H. The gingival index, the plaque index and the retention index systems. J Periodontol (1967) 38(6):610–6. doi: 10.1902/jop.1967.38.6.610
39. Mühlemann HR, Son S. Gingival sulcus bleeding–a leading symptom in initial gingivitis. Helv Odontol Acta (1971) 15(2):107–13.
40. Greene JC, Vermillion JR. The oral hygiene index: a method for classifying oral hygiene status. J Am Dental Assoc (1960) 61(2):172–9. doi: 10.14219/jada.archive.1960.0177
41. World Health Organization. Oral health surveys : basic methods . Available at: https://iris.who.int/handle/10665/41905 (Accessed September 24, 2023).
42. Zeber-Lubecka N, Kulecka M, Załęska-Oracka K, Dąbrowska M, Bałabas A, Hennig EE, et al. Gene expression-based functional differences between the bladder body and trigonal urothelium in adolescent female patients with micturition dysfunction. Biomedicines (2022) 10(6):1435. doi: 10.3390/biomedicines10061435
43. Maksymiuk KM, Szudzik M, Gawryś-Kopczyńska M, Onyszkiewicz M, Samborowska E, Mogilnicka , et al. Trimethylamine, a gut bacteria metabolite and air pollutant, increases blood pressure and markers of kidney damage including proteinuria and KIM-1 in rats. J Transl Med (2022) 20:470. doi: 10.1186/s12967-022-03687-y
44. Picard tools - by broad institute . Available at: https://broadinstitute.github.io/picard/ (Accessed July 9, 2023).
45. Schloss PD, Westcott SL, Ryabin T, Hall JR, Hartmann M, Hollister EB, et al. Introducing mothur: Open-source, platform-independent, community-supported software for describing and comparing microbial communities. Appl Environ Microbiol (2009) 75(23):7537–41. doi: 10.1128/AEM.01541-09
46. Rognes T, Flouri T, Nichols B, Quince C, Mahé F. VSEARCH: A versatile open source tool for metagenomics. PeerJ (2016) 2016(10):e2584. doi: 10.7717/PEERJ.2584/FIG-7
47. Quast C, Pruesse E, Yilmaz P, Gerken J, Schweer T, Yarza P, et al. The SILVA ribosomal RNA gene database project: improved data processing and web-based tools. Nucleic Acids Res (2013) 41(D1):D590–6. doi: 10.1093/NAR/GKS1219
48. Zhou H, He K, Chen J, Zhang X. LinDA: linear models for differential abundance analysis of microbiome compositional data. Genome Biol (2022) 23(1):1–23. doi: 10.1186/S13059-022-02655-5/FIGURES/5
49. Dixon P. VEGAN, a package of R functions for community ecology. J Vegetation Sci (2003) 14(6):927–30. doi: 10.1111/J.1654-1103.2003.TB02228.X
50. Benjamini Y, Hochberg Y. Controlling the false discovery rate: A practical and powerful approach to multiple testing. J R Stat Society: Ser B (Methodological) (1995) 57(1):289–300. doi: 10.1111/J.2517-6161.1995.TB02031.X
51. Stewart CJ, Nelson A, Campbell MD, Walker M, Stevenson EJ, Shaw JA, et al. Gut microbiota of Type 1 diabetes patients with good glycemic control and high physical fitness is similar to people without diabetes: an observational study. Diabetes Med (2017) 34(1):127–34. doi: 10.1111/DME.13140
52. Yuan X, Wu J, Chen R, Chen Z, Su Z, Ni J, et al. Characterization of the oral microbiome of children with type 1 diabetes in the acute and chronic phases. J Oral Microbiol (2022) 14(1). doi: 10.1080/20002297.2022.2094048
53. Moskovitz M, Nassar M, Moriel N, Cher A, Faibis S, Ram D, et al. Characterization of the oral microbiome among children with type 1 diabetes compared with healthy children. Front Microbiol (2021) 12:756808. doi: 10.3389/fmicb.2021.756808
54. Sun X, Li M, Xia L, Fang Z, Yu S, Gao J, et al. Alteration of salivary microbiome in periodontitis with or without type-2 diabetes mellitus and metformin treatment. Sci Rep (2020) 10(1):15363. doi: 10.1038/S41598-020-72035-1
55. Takahashi K, Nishimura F, Kurihara M, Iwamoto Y, Takashiba S, Miyata T, et al. Subgingival microflora and antibody responses against periodontal bacteria of young Japanese patients with type 1 diabetes mellitus. J Int Acad Periodontol (2001) 3(4):104–11.
56. Huang Y, Wang Z, Ma H, Ji S, Chen Z, Cui Z, et al. Dysbiosis and implication of the gut microbiota in diabetic retinopathy. Front Cell Infect Microbiol (2021) 11:646348. doi: 10.3389/fcimb.2021
57. Han YW. Fusobacterium nucleatum: a commensal-turned pathogen. Curr Opin Microbiol (2015) 23:141–7. doi: 10.1016/J.MIB.2014.11.013
58. Sharma N, Bhatia S, Sodhi AS, Batra N. Oral microbiome and health. AIMS Microbiol (2018) 4(1):42. doi: 10.3934/MICROBIOL.2018.1.42
59. Qin H, Li G, Xu X, Zhang C, Zhong W, Xu S, et al. The role of oral microbiome in periodontitis under diabetes mellitus. J Oral Microbiol (2022) 14(1):2078031. doi: 10.1080/20002297.2022.207803
60. Ganesan SM, Joshi V, Fellows M, Dabdoub SM, Nagaraja HN, O'Donnell B, et al. A tale of two risks: smoking, diabetes and the subgingival microbiome. ISME J (2017) 11(9):2075. doi: 10.1038/ISMEJ.2017.73
61. Matsha TE, Prince Y, Davids S, Chikte U, Erasmus RT, Kengne AP, et al. Oral microbiome signatures in diabetes mellitus and periodontal disease. J Dent Res (2020) 99(6):658–65. doi: 10.1177/0022034520913818
62. Macfarlane GT, Macfarlane S. Bacteria, colonic fermentation, and gastrointestinal health. J AOAC Int (2012) 95(1):50–60. doi: 10.5740/JAOACINT.SGE_MACFARLANE
63. Portincasa P, Bonfrate L, Vacca M, De Angelis M, Farella I, Lanza E, et al. Gut microbiota and short chain fatty acids: implications in glucose homeostasis. Int J Mol Sci (2022) 23(3):1105. doi: 10.3390/ijms23031105
64. Palau-Rodriguez M, Tulipani S, Queipo-Ortuño MI, Urpi-Sarda M, Tinahones FJ, Andres-Lacueva C. Metabolomic insights into the intricate gut microbial-host interaction in the development of obesity and type 2 diabetes. Front Microbiol (2015) 6:1151(OCT). doi: 10.3389/FMICB.2015.01151
65. Tonetti M, Eftimiadi C, Damiani G, Buffa P, Buffa D, Botta GA. Short chain fatty acids present in periodontal pockets may play a role in human periodontal diseases. J Periodontal Res (1987) 22(3):190–1. doi: 10.1111/J.1600-0765.1987.TB01565.X
66. Lu R, Meng H, Gao X, Xu L, Feng X. Effect of non-surgical periodontal treatment on short chain fatty acid levels in gingival crevicular fluid of patients with generalized aggressive periodontitis. J Periodontal Res (2014) 49(5):574–83. doi: 10.1111/JRE.12137
67. Woelber JP, Bremer K, Vach K, König D, Hellwig E, Ratka-Krüger P, et al. An oral health optimized diet can reduce gingival and periodontal inflammation in humans - a randomized controlled pilot study. BMC Oral Health (2016) 17(1):28. doi: 10.1186/s12903-016-0257-1
68. Woelber JP, Gärtner M, Breuninger L, Anderson A, König D, Hellwig E, et al. The influence of an anti-inflammatory diet on gingivitis. A randomized controlled trial. J Clin Periodontol (2019) 46(4):481–90. doi: 10.1111/JCPE.13094
69. Lăzureanu PC, Popescu F, Tudor A, Stef L, Negru AG, Mihăilă R. Saliva pH and flow rate in patients with periodontal disease and associated cardiovascular disease. Med Sci Monit (2021) 27:e931362–1. doi: 10.12659/MSM.931362
70. Kunath BJ, Hickl O, Queirós P, Martin-Gallausiaux C, Lebrun LA, Halder R, et al. Alterations of oral microbiota and impact on the gut microbiome in type 1 diabetes mellitus revealed by integrated multi-omic analyses. Microbiome (2022) 10(1):243. doi: 10.1186/s40168-022-01435-4
71. Hosmer J, McEwan AG, Kappler U. Bacterial acetate metabolism and its influence on human epithelia. Emerg Top Life Sci (2023) ETLS20220092. doi: 10.1042/ETLS20220092
72. Corrêa-Oliveira R, Fachi JL, Vieira A, Sato FT, Vinolo MAR. Regulation of immune cell function by short-chain fatty acids. Clin Transl Immunol (2016) 5(4):e73. doi: 10.1038/CTI.2016.17
73. Iraporda C, Errea A, Romanin DE, et al. Lactate and short chain fatty acids produced by microbial fermentation downregulate proinflammatory responses in intestinal epithelial cells and myeloid cells. Immunobiology (2015) 220(10):1161–9. doi: 10.1016/J.IMBIO.2015.06.004
74. Lobionda S, Sittipo P, Kwon HY, Lee YK. The role of gut microbiota in intestinal inflammation with respect to diet and extrinsic stressors. Microorganisms (2019) 7(8):271. doi: 10.3390/MICROORGANISMS7080271
75. Nakano T, Uchiyama K, Ushiroda C, et al. Promotion of wound healing by acetate in murine colonic epithelial cell via c-Jun N-terminal kinase activation. J Gastroenterol Hepatol (2020) 35(7):1171–9. doi: 10.1111/JGH.14987
76. Lyu J, Pirooznia M, Li Y, Xiong J. The short-chain fatty acid acetate modulates epithelial-to-mesenchymal transition. Mol Biol Cell (2022) 33(8):br13. doi: 10.1091/mbc.E22-02-0066
77. Kondo T, Kishi M, Fushimi T, Kaga T. Acetic acid upregulates the expression of genes for fatty acid oxidation enzymes in liver to suppress body fat accumulation. J Agric Food Chem (2009) 57(13):5982–6. doi: 10.1021/JF900470C
78. Rey FE, Faith JJ, Bain J, Muehlbauer MJ, Stevens RD, Newgard CB, et al. Dissecting the in vivo metabolic potential of two human gut acetogens. J Biol Chem (2010) 285(29):22082–90. doi: 10.1074/jbc.M110.117713
79. van der Hee B, Wells JM. Microbial regulation of host physiology by short-chain fatty acids. Trends Microbiol (2021) 29(8):700–12. doi: 10.1016/J.TIM.2021.02.001
80. Endesfelder D, Engel M, Davis-Richardson AG, Ardissone AN, Achenbach P, Hummel S, et al. Towards a functional hypothesis relating anti-islet cell autoimmunity to the dietary impact on microbial communities and butyrate production. Microbiome (2016) 4:17. doi: 10.1186/s40168-016-0163-4
81. Canfora EE, Jocken JW, Blaak EE. Short-chain fatty acids in control of body weight and insulin sensitivity. Nat Rev Endocrinol (2015) 11(10):577–91. doi: 10.1038/NRENDO.2015.128
82. Brown CT, Davis-Richardson AG, Giongo A, Gano KA, Crabb DB, Mukherjee N, et al. Gut microbiome metagenomics analysis suggests a functional model for the development of autoimmunity for type 1 diabetes. PloS One (2011) 6(10):e25792. doi: 10.1371/JOURNAL.PONE.0025792
83. Phillips SM, Lau KJ, D’Souza AC, Nunes EA. An umbrella review of systematic reviews of β-hydroxy-β-methyl butyrate supplementation in ageing and clinical practice. J Cachexia Sarcopenia Muscle (2022) 13(5):2265–75. doi: 10.1002/JCSM.13030
84. Lu X, Liu T, Zhou J, Liu J, Yuan Z, Guo L. Subgingival microbiome in periodontitis and type 2 diabetes mellitus: an exploratory study using metagenomic sequencing. J Periodontal Implant Sci (2022) 52(4):282. doi: 10.5051/JPIS.2103460173
85. Lu Rf, Meng Hx, Gao Xj, Feng L, Xu L. [Analysis of short chain fatty acids in gingival crevicular fluid of patients with aggressive periodontitis]. Zhonghua Kou Qiang Yi Xue Za Zhi (2008) 43(11):664–7.
86. Na HS, Kim S, Kim S, Yu Y, Kim SY, Kim HJ, et al. Molecular subgroup of periodontitis revealed by integrated analysis of the microbiome and metabolome in a cross-sectional observational study. J Oral Microbiol (2021) 13(1). doi: 10.1080/20002297.2021.1902707
87. Shirasugi M, Nishioka K, Yamamoto T, Nakaya T, Kanamura N. Normal human gingival fibroblasts undergo cytostasis and apoptosis after long-term exposure to butyric acid. Biochem Biophys Res Commun (2017) 482(4):1122–8. doi: 10.1016/J.BBRC.2016.11.168
88. Tsuda H, Ochiai K, Suzuki N, Otsuka K. Butyrate, a bacterial metabolite, induces apoptosis and autophagic cell death in gingival epithelial cells. J Periodontal Res (2010) 45(5):626–34. doi: 10.1111/J.1600-0765.2010.01277.X
89. Huang CB, Alimova Y, Myers TM, Ebersole JL. Short- and medium-chain fatty acids exhibit antimicrobial activity for oral microorganisms. Arch Oral Biol (2011) 56(7):650. doi: 10.1016/J.ARCHORALBIO.2011.01.011
90. Rasmussen HS, Holtug K, Mortensen PB. Degradation of amino acids to short-chain fatty acids in humans. Vitro study Scand J Gastroenterol (1988) 23(2):178–82. doi: 10.3109/00365528809103964
91. Gao Y, Chen H, Li J, Ren S, Yang Z, Zhou Y, et al. Alterations of gut microbiota-derived metabolites in gestational diabetes mellitus and clinical significance. J Clin Lab Anal (2022) 36(4):e24333. doi: 10.1002/JCLA.24333
92. Saresella M, Marventano I, Barone M, La Rosa F, Piancone F, Mendozzi L, et al. Alterations in circulating fatty acid are associated with gut microbiota dysbiosis and inflammation in multiple sclerosis. Front Immunol (2020) 11:1390. doi: 10.3389/fimmu.2020.01390
Keywords: type 1 diabetes, continuous subcutaneous insulin infusion, gingival crevicular fluid, microbiome, metabolome, gingivitis
Citation: Gregorczyk-Maga I, Kania M, Dąbrowska M, Samborowska E, Żeber-Lubecka N, Kulecka M and Klupa T (2024) The interplay between gingival crevicular fluid microbiome and metabolomic profile in intensively treated people with type 1 diabetes - a combined metagenomic/metabolomic approach cross-sectional study. Front. Endocrinol. 14:1332406. doi: 10.3389/fendo.2023.1332406
Received: 02 November 2023; Accepted: 31 December 2023;
Published: 02 February 2024.
Edited by:
Sen Li, Beijing University of Chinese Medicine, ChinaReviewed by:
Florence Carrouel, Université Claude Bernard Lyon 1, FranceDavi Silva, University of California, Los Angeles, United States
Copyright © 2024 Gregorczyk-Maga, Kania, Dąbrowska, Samborowska, Żeber-Lubecka, Kulecka and Klupa. This is an open-access article distributed under the terms of the Creative Commons Attribution License (CC BY). The use, distribution or reproduction in other forums is permitted, provided the original author(s) and the copyright owner(s) are credited and that the original publication in this journal is cited, in accordance with accepted academic practice. No use, distribution or reproduction is permitted which does not comply with these terms.
*Correspondence: Michał Kania, bWljaC5rYW5pYUB1ai5lZHUucGw=
†These authors have contributed equally to this work and share first authorship
‡ORCID: Iwona Gregorczyk-Maga, orcid.org/0000-0002-1384-9439
Michał Kania, orcid.org/0000-0002-4288-1024
Michalina Dąbrowska, orcid.org/0000-0002-7585-4946
Emilia Samborowska, orcid.org/0000-0002-0646-0847
Natalia Żeber-Lubecka, orcid.org/0000-0003-4036-3191
Maria Kulecka, orcid.org/0000-0002-9830-8892
Tomasz Klupa, orcid.org/0000-0002-7199-4079