 Lin Tuo
 Li-ting Yan
- Department of Infectious Disease, Sichuan Provincial People’s Hospital, University of Electronic Science and Technology of China, Chengdu, China
Background: NAFLD (Nonalcoholic fatty liver disease) is becoming an increasingly common cause of chronic liver disease. Metabolic dysfunction, overweight/obesity, and diabetes are thought to be closely associated with increased NAFLD risk. However, few studies have focused on the mechanisms of NAFLD occurrence in T1DM.
Methods: We conducted a two-sample Mendelian randomization (MR) analysis to assess the causal association between T1DM and NAFLD with/without complications, such as coma, renal complications, ketoacidosis, neurological complications, and ophthalmic complications. Multiple Mendelian randomization methods, such as the inverse variance weighted (IVW) method, weighted median method, and MR-Egger test were performed to evaluate the causal association of T1DM and NAFLD using genome-wide association study summary data from different consortia, such as Finngen and UK biobank.
Results: We selected 37 SNPs strongly associated with NAFLD/LFC (at a significance level of p < 5 × 10⁻⁸) as instrumental variables from the Finnish database based on the T1DM phenotype (8,967 cases and 308,373 controls). We also selected 14/16 SNPs based on with or without complications. The results suggest that the genetic susceptibility of T1DM does not increase the risk of NAFLD (OR=1.005 [0.99, 1.02], IVW p=0.516, MR Egger p=0.344, Weighted median p=0.959, Weighted mode p=0.791), regardless of whether complications are present. A slight causal effect of T1DM without complications on LFC was observed (OR=1.025 [1.00, 1.03], MR Egger p=0.045). However, none of the causal relationships were significant in the IVW (p=0.317), Weighted median (p=0.076), and Weighted mode (p=0.163) methods.
Conclusion: Our study did not find conclusive evidence for a causal association between T1DM and NAFLD, although clinical observations indicate increasing abnormal transaminase prevalence and NAFLD progression in T1DM patients.
1 Introduction
Non-alcoholic fatty liver disease (NAFLD) has a global prevalence of as high as 25% and poses a significant threat to human health, placing a tremendous economic burden on society (1). However, no pharmacological treatments have been approved for NAFLD worldwide. Metabolic dysfunction, overweight/obesity, and diabetes are thought to be closely associated with increased NAFLD risk. Thus, the latest 2020 international expert consensus statement redefined it as metabolic-associated fatty liver disease (MAFLD) (2, 3). In the progression of type 2 diabetes (T2D) complications, NAFLD can manifest as ectopic triglyceride accumulation through insulin resistance, impaired fatty acid oxidation, and altered lipid metabolism. However, few studies have examined the relationship between T1DM and NAFLD.
T1DM is an autoimmune disease characterized by β-cell destruction and absolute insulin deficiency (4). Treatment of T1DM mainly involves adjusting exogenous insulin supplementation based on the patient’s insulin needs. During T1DM progression, increasing insulin demand and poor glycemic control can lead to indirect insulin resistance (IR) (5). IR induces dyslipidemia through excessive lipolysis, increased lipogenesis, and lipotoxic changes in adipose tissue. Dysregulation of lipid metabolism can cause multi-organ dysfunction including the liver, which is key for NAFLD development. However, the association between T1DM and NAFLD incidence, particularly in advanced T1DM with complications, and its genetic predisposition remains contentious. Conversely, NAFLD is the most common cause of transaminase elevation in T1DM (6, 7), though the underlying mechanisms remain unclear.
Mendelian randomization (MR) analysis uses common genetic variations, typically single nucleotide polymorphisms (SNPs), as instrumental variables (IVs) to explore potential causal relationships between exposures and outcomes (8–10). Since SNPs are randomly assigned at conception and unaffected by confounders (11), they can largely avoid biases from confounding factors. Thanks to rapid GWAS developments and accumulating publicly available GWAS summary statistics, two-sample MR with significantly improved statistical power has become more accessible and flexible. Previous MR studies have elucidated causal relationships between NAFLD, T2D, and obesity (12, 13). However, no MR study has examined the causal association between T1DM and NAFLD.
This article analyzed the causal relationships between T1DM with various complications and NAFLD using a two-sample MR framework, with validation in separate databases.
2 Materials and methods
We performed two-sample MR analyses to investigate the causal relationship between type 1 diabetes and non-alcoholic fatty liver disease derived from different large-scale cohorts.
2.1 Overview of Mendelian randomization study
The study design is shown in (Figure 1).
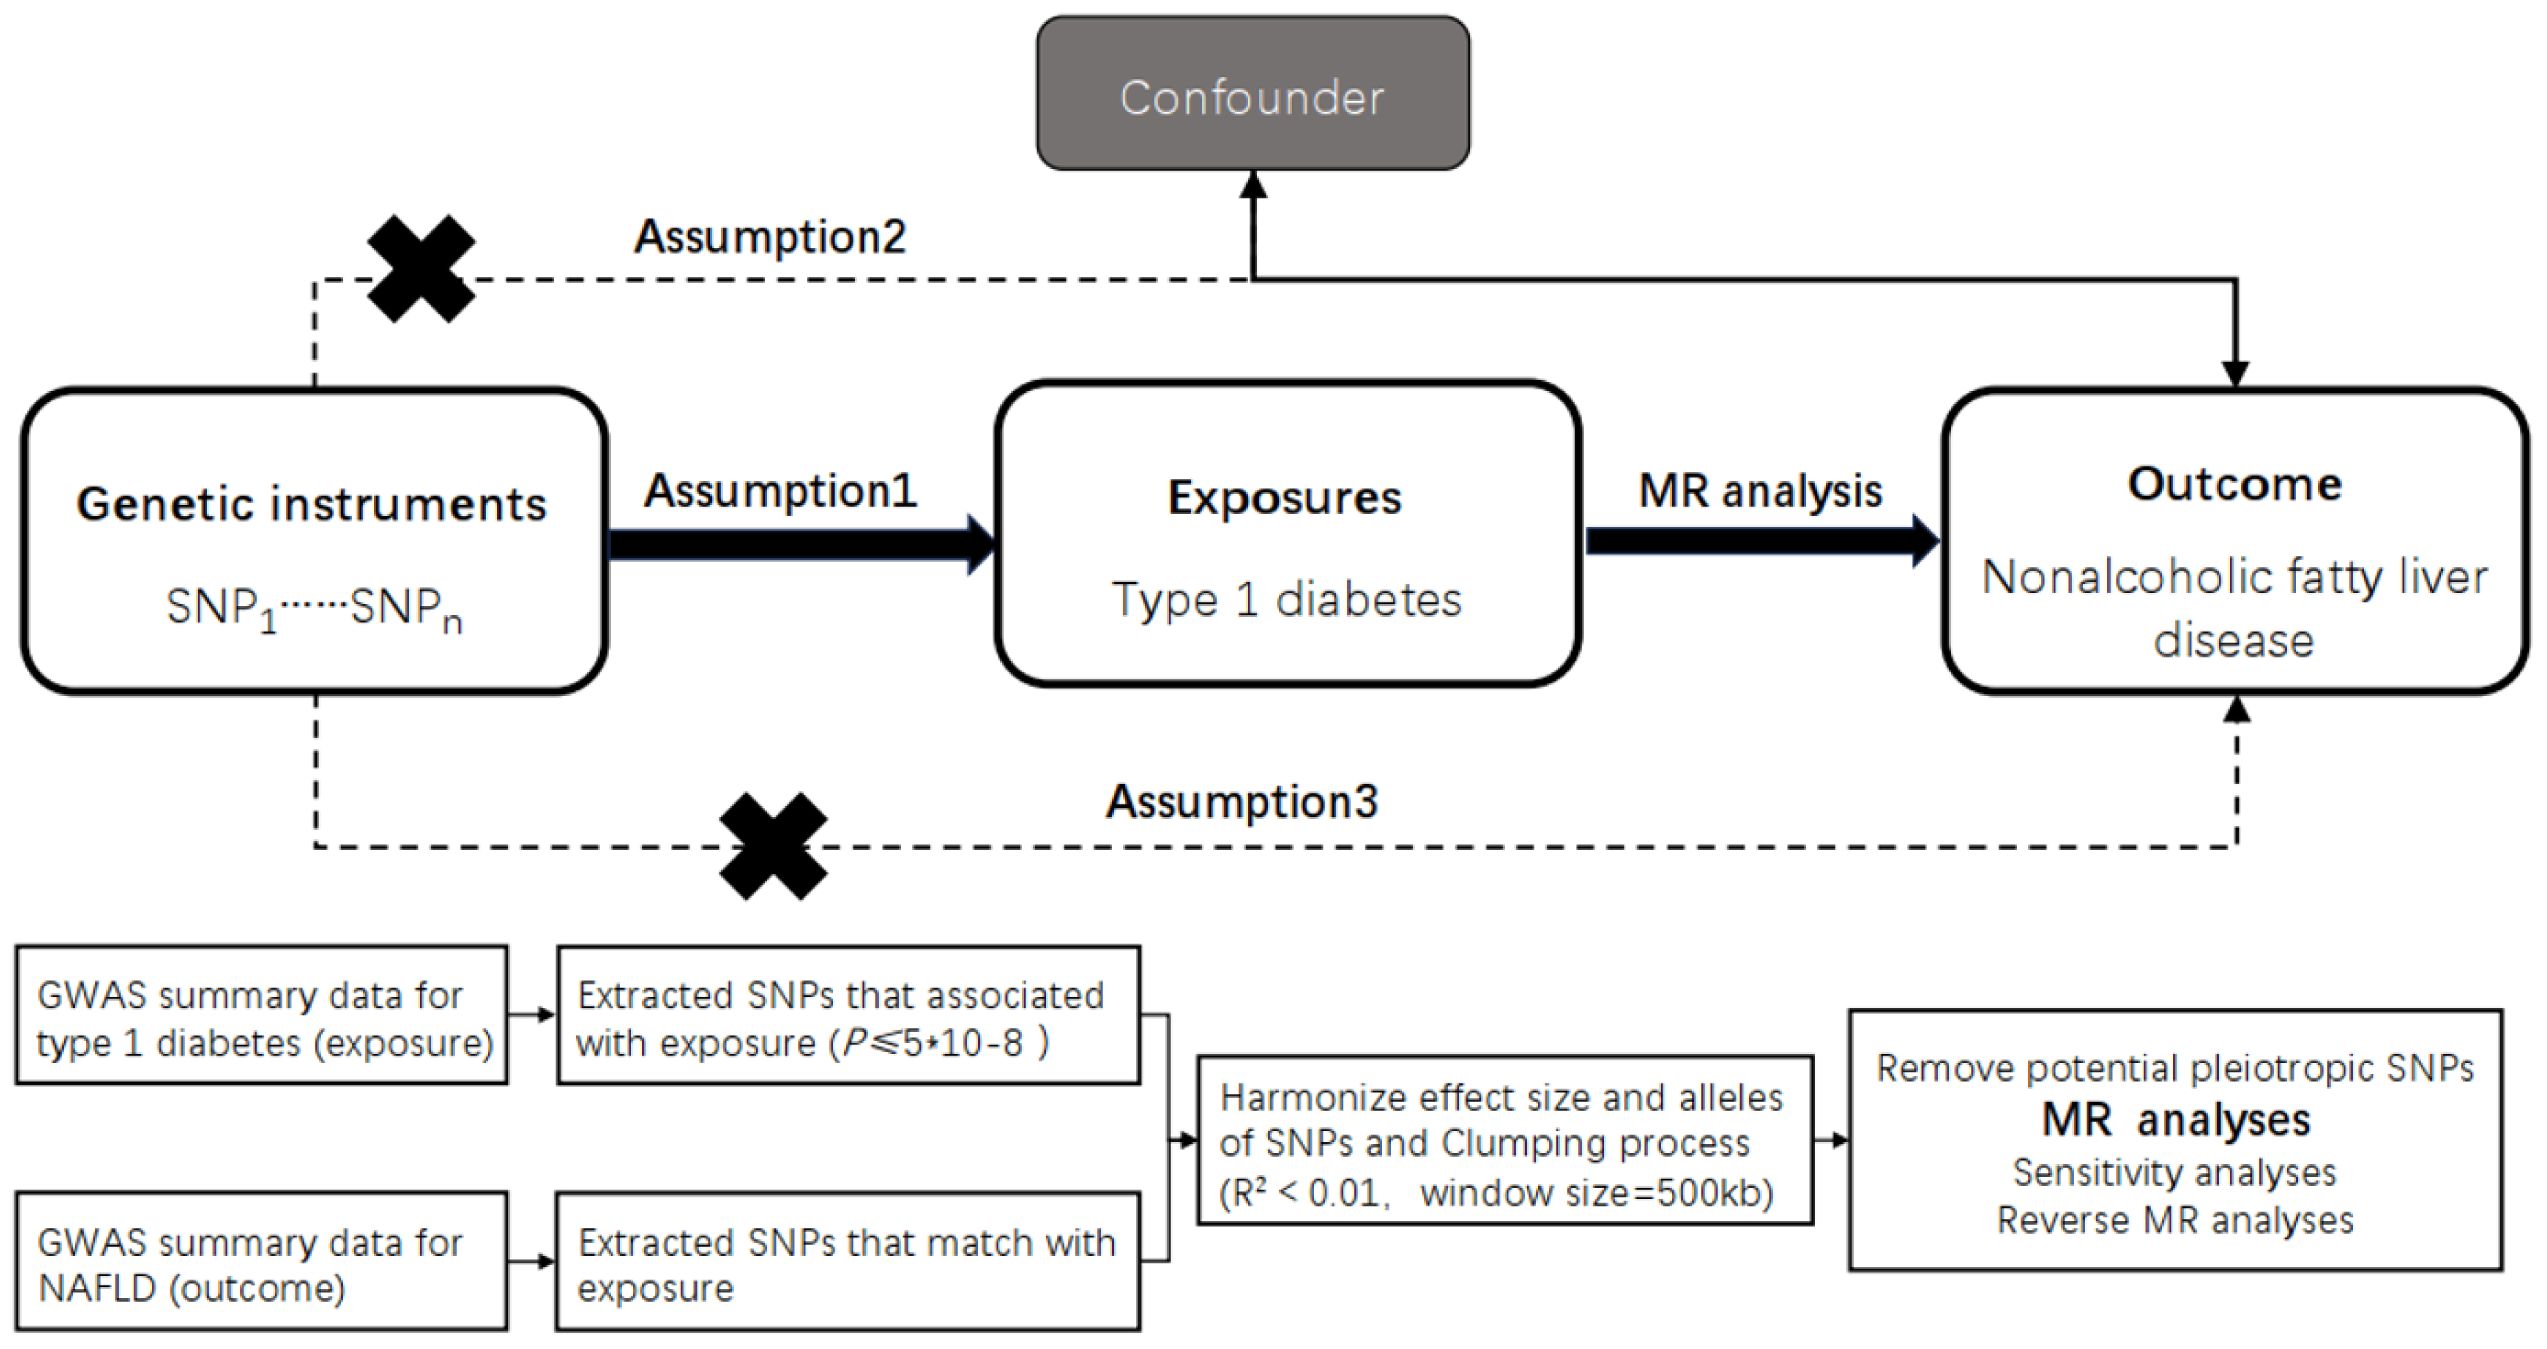
Figure 1 Overview of the design and methods used in this Mendelian randomization study. MR analysis was used to explore the causal relationships, including the following three assumptions: 1. Instrument validity assumption: the genetic variant used as an instrument for the exposure of interest is strongly associated with the exposure but not directly associated with any confounding factors that might influence the outcome. 2. Independence assumption: the genetic variant is independent of any other factors that might influence the outcome, except through its effect on the exposure. 3. Exclusion restriction assumption: the genetic variant affects the outcorne only through its effect on the exposure, and not through any other pathways. The specific workflow employed a Mendelian randomization analysis. The GWAS data for TIDM as the exposure factor and for NAFLD as the outcome factor were collected and inappropriate SNPs were removed through processes such as SNP extraction, harmonization, and clumping, followed by causality analysis. MR, Mendelian randomization; TIDM, type 1 diabetes.
We employed the statistical analysis technique known as the two-sample Mendelian randomization (MR) analysis method. This approach utilizes genetic variants as instrumental variables to assess causal relationships between exposure and outcome variables. Mendelian randomization is based on three assumptions: (i) genetic variation is associated with the risk factor, (ii) genetic variation is independent of confounding factors, and (iii) genetic variation influences the outcome only through the risk factor (Figure 1A).
The overlap of participants in two-sample Mendelian randomization (MR) may lead to an increased type 1 error rate due to weak instrument bias (14, 15). Non-overlap between exposure and outcome is crucial for the two-sample MR framework. Causal estimates from single-sample analysis (using data from a single data source) tend to be biased toward the observed association between the risk factor and the outcome. In contrast, estimates from two-sample analysis (using data from non-overlapping datasets of the risk factor and the outcome) have a smaller estimation bias, tending towards zero. As most exposure factors were derived from the FinnGen team (https://r9.finngen.fi/), the NAFLD GWAS based on the GWAS catalog (https://www.ebi.ac.uk/) was excluded to avoid bias due to sample overlap.
This analysis was conducted using summary-level data from published genome-wide association studies (GWAS) and followed the STROBE-MR guidelines (9). All GWAS studies included in the analysis had obtained approval from the relevant review committees, and all participants had provided informed consent. The FinnGen biobank GWAS was conducted by the FinnGen team and ethical approval was obtained from the original studies (Figure 1B).
2.2 Sources of genome-wide association studies
The GWAS summary statistics of NAFLD were obtained from a recently published GWAS catalog (GCST90054782), with 4,761 European NAFLD cases and 373,227 genetically matched controls. Considering NAFLD is closely associated with LFC, a recent LFC GWAS (GCST90016676) which included 25,617 European participants was also selected. The GWAS data for T1DM were obtained from the FinnGen team, which included 8,967 European T1DM cases and 308,373 control cases from the r9 version of the database. Further searches were conducted based on the occurrence of T1DM complications, resulting in GWAS data for the complication group (6,234 cases and 308,280 controls) and the non-complication group (4,918 cases and 183,185 controls). Specific complications were further analyzed, and GWAS data related to coma (2,050 cases), renal dysfunction (4,918 cases), ketoacidosis (2,102 cases), neurological complications (1,077 cases), and optic nerve complications (5,202 cases) were selected (Table 1).
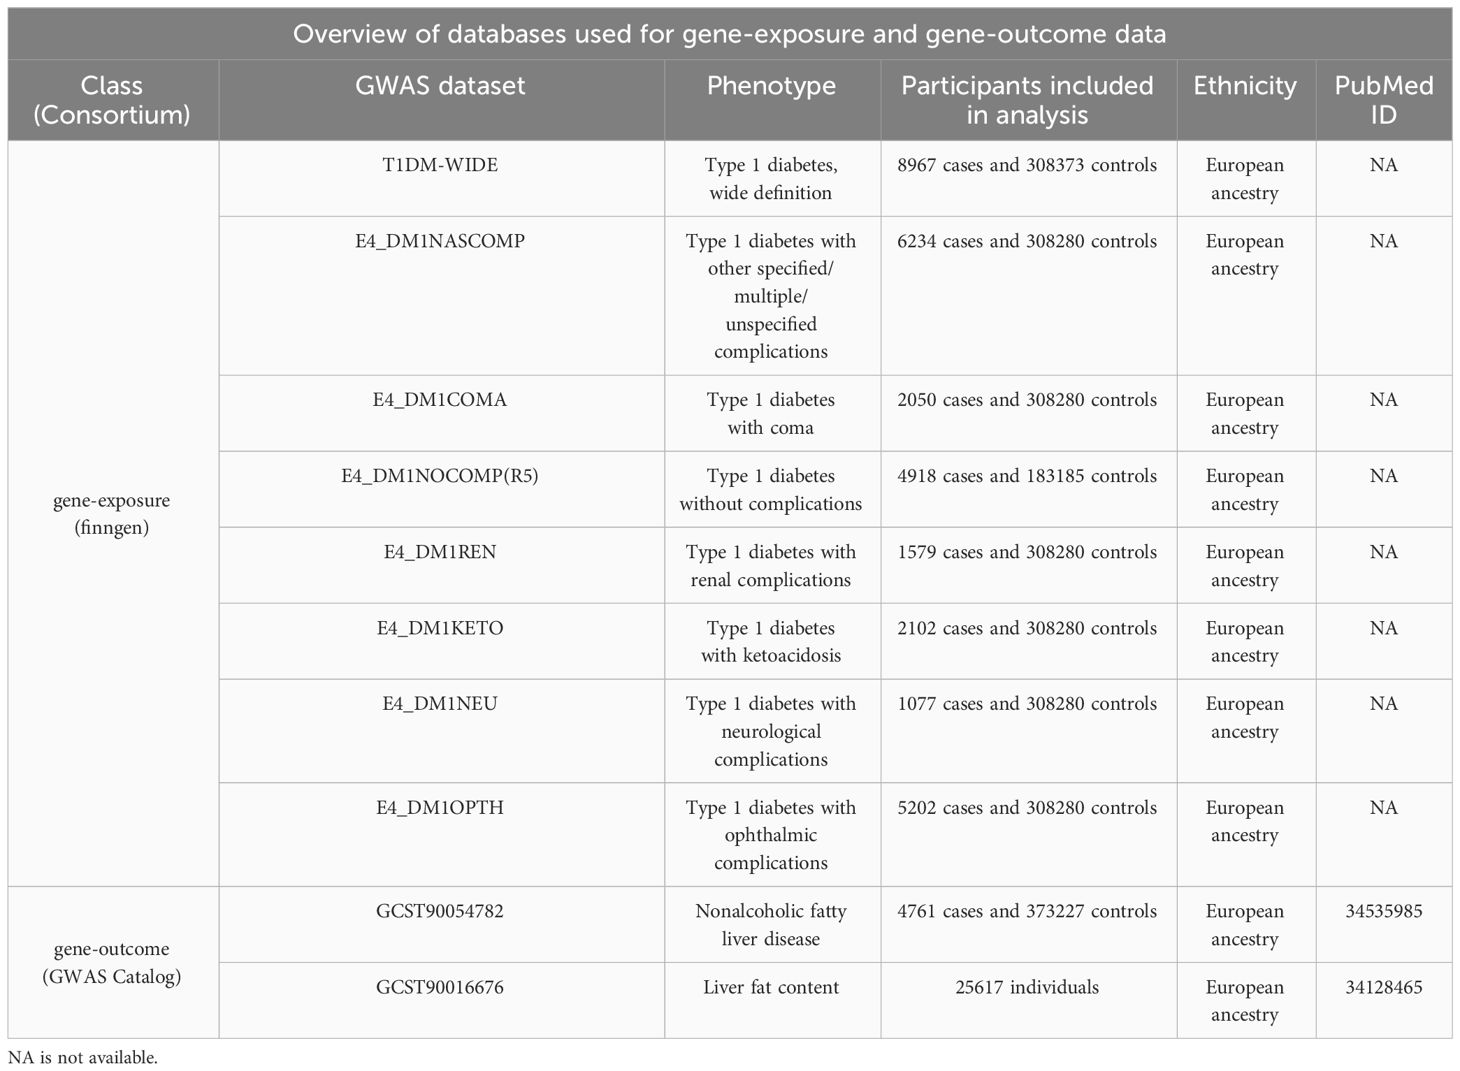
Table 1 A brief description of GWAS summary statistics. PubMed ID is the ID of publication in the Pubmed.
The coordination of encoding and reference alleles was employed to eliminate ambiguous SNPs with inconsistent alleles in the exposure and outcome datasets. Palindromic SNPs with minor allele frequencies between 0.45 and 0.55 were defined as having ambiguous minor alleles and all potentially ambiguous SNPs were excluded in sensitivity analyses. Some missing tools were not imputed by proxy SNPs, as the impact of a small fraction of missing tools on the results is considered negligible.
2.3 Statistical analysis
Mendelian randomization (MR) assumes that the genetic variants used as instruments are closely related to the exposure of interest and are unrelated to any potential confounding factors that might influence the outcome. The F-statistic quantifies the strength of association of each assumed risk factor with its genetic instrument. The power of each SNP was evaluated by its F-statistic (F = beta2/se2) and the overall F-statistic for all SNPs was calculated (excluding SNPs with F-values less than 10) (Table 2). Statistical power was calculated using mRnd (https://shiny.cnsgenomics.com/mRnd/). Additionally, the PhenoScanner (V2) database was utilized for filtering genetic variants associated with confounding factors. Subsequently, these rigorously filtered SNPs were employed as final instrumental variables for subsequent Mendelian randomization analysis. In this study, no instrumental variables related to phenotypes such as insulin resistance and lipid metabolism alterations were identified.
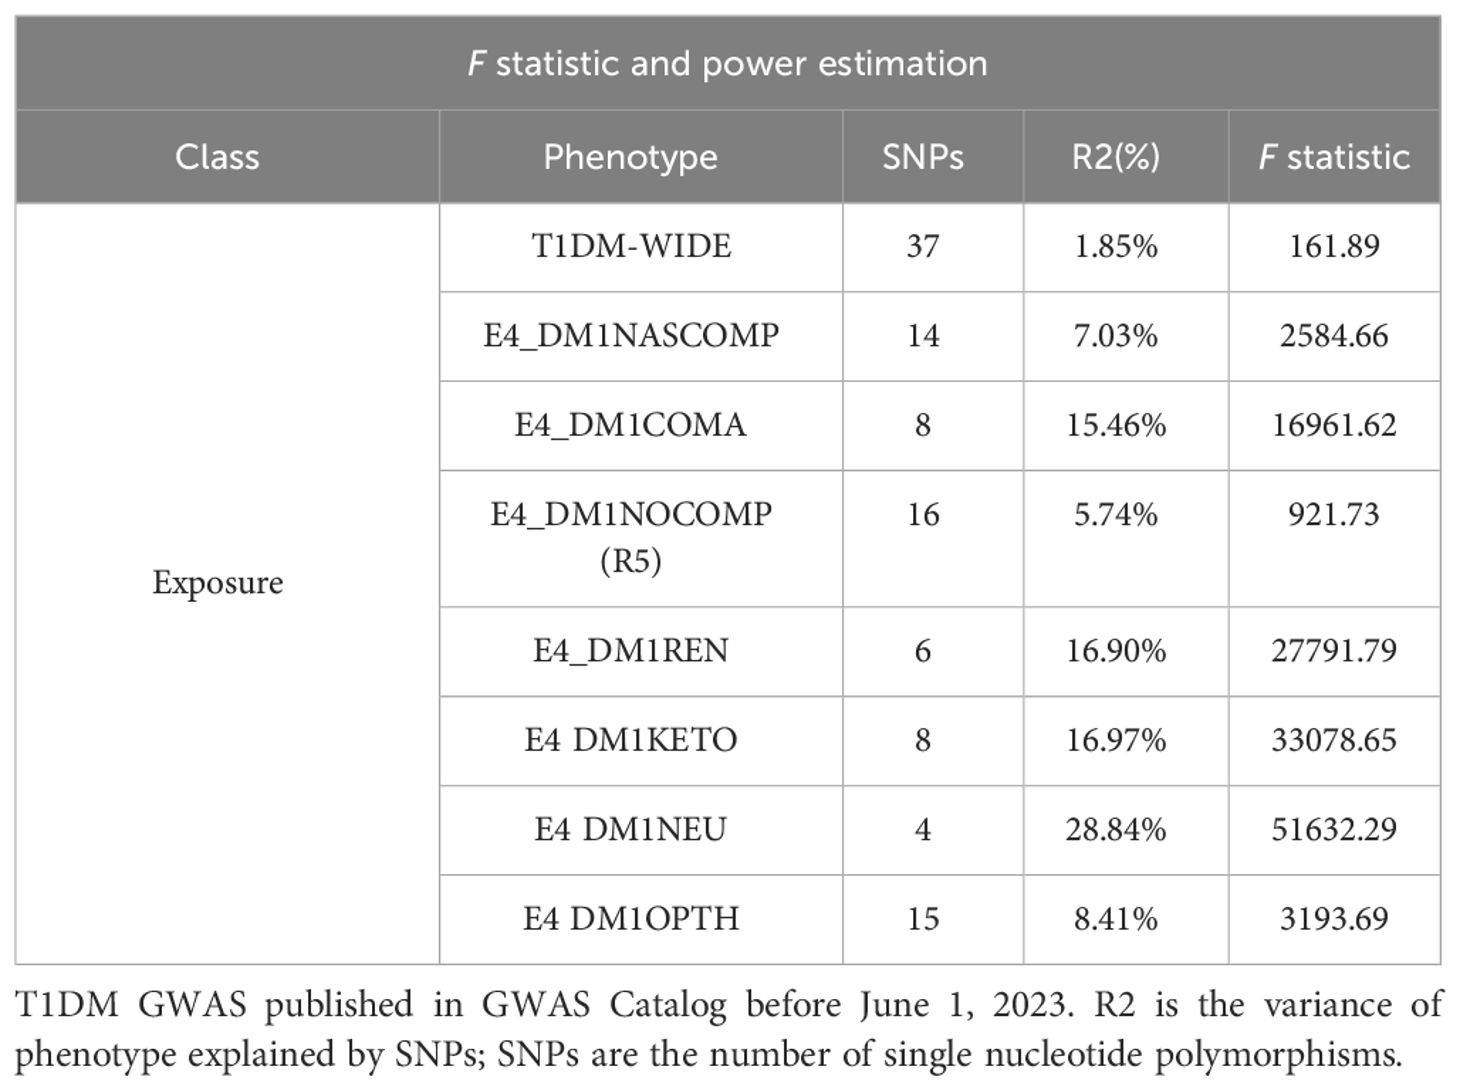
Table 2 F statistic and power estimation.
We conducted and reported the results of a range of sensitivity analyses that allowed for effective estimation in the presence of horizontal pleiotropy. First, the random-effects inverse variance weighted method was used to relax the exclusion restriction assumption by allowing all SNPs to exhibit random pleiotropic effect while maintaining asymptotic unbiasedness even if all SNPs show horizontal pleiotropy (16). The random-effects inverse variance weighted method has been reported as the most common and best-performing method in various scenarios that violate the exclusion restriction principle (17). Second, if at least 50% of the selected SNPs are valid, the weighted median estimator can provide an unbiased causal effect (18). Third, the MR-PRESSO method was performed, which can detect pleiotropy outliers in the multiple instrument summary-level MR analysis, and obtain causal effect estimates using the inverse variance weighted method after excluding the outliers (19). Finally, leave-one-out sensitivity tests were conducted to examine the influence of peripheral and pleiotropic SNPs on causal estimates (20). Heterogeneity and pleiotropy of individual SNPs were assessed using Cochran’s Q statistic and MR-PRESSO. Finally, a fixed-effects model was used to combine the MR results from the discovery and replication stages. All statistical analyses were performed using R 4.1.3 (R Foundation for Statistical Computing, Vienna, Austria).
3 Results
3.1 SNP selection
Firstly, several SNPs were identified as IVs (instrumental variables) related to different phenotypes in various databases, with a strong correlation (at a significance level of p < 5 × 10⁻⁸). Among the wide-definition T1DM phenotypes, 37 SNPs were identified. Based on the T1DM with/without complications, 14/16 SNPs were selected. Additionally, 5-15 SNPs were identified as related phenotypes of different T1DM complications. Secondly, the variances of all the aforementioned SNPs ranged from 1.85% to 28.84%. Eventually, the F statistics of all IVs were greater than 10, indicating the absence of potential weak instrument bias (Table 2).
3.2 The causal association between T1DM with/without complications and NAFLD
Generally, our MR study suggested that there might be no causal relationship between NAFLD and T1DM. Preliminary findings indicate that the genetic susceptibility of T1DM does not increase the risk of NAFLD (OR=1.005 [0.99, 1.02], IVW p=0.516). Consistent conclusions were obtained through additional statistical methods such as MR Egger (OR=0.982 [0.95, 1.02], p=0.344), Weighted median (OR=1.000 [0.98, 1.02], p=0.959), and Weighted mode (OR=1.002 [0.98, 1.02], p=0.791). Considering that T1DM is often classified into the presence or absence of complications, subgroup analysis for these two phenotypes also suggests that the genetic predisposition of both phenotypes does not influence the risk of NAFLD, both for T1DM with complications (OR=1.007 [0.99, 1.03], IVW p=0.519) and without complications (OR=1.020 [0.98, 1.06], IVW p=0.284) (Figure 2A, Supplementary Table 1).
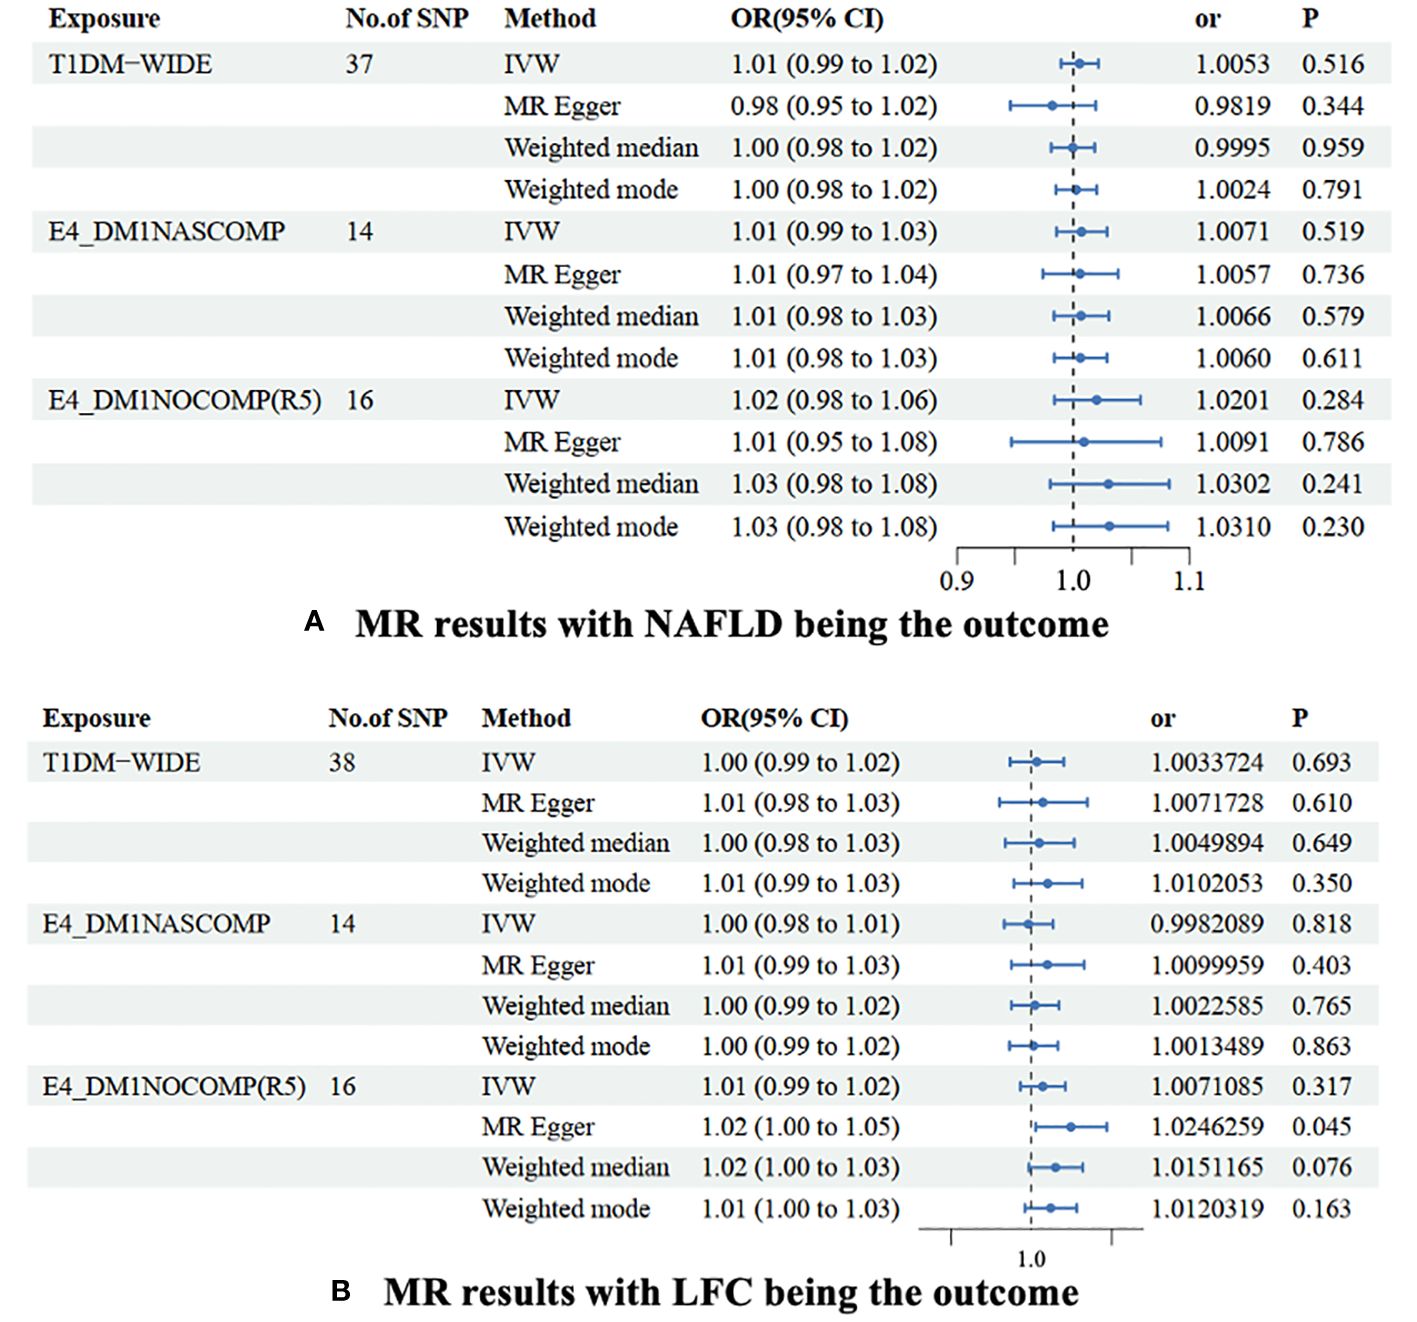
Figure 2 MR results were non-alcoholic fatty liver disease (A) and liver fat content (B) as the outcomes. The association of TIDM and NAFLD/LFH was analyzed with four different MR methods. NAFLD is a non-alcoholic fatty liver disease; LFC is liver fat content. No. of SNP is the number of single nucleotide polymorphisms used in MR analysis; OR is the odds ratio; 95% CI is the limit of 95% confidence interval of OR/BETA; SE is standard error; P is the p-value of OR. TIDM-WIDE is type 1 diabetes, wide definition; E4_DMINASCOMP is type 1 diabetes with other specified/multiple/unspecified complications; E4_DMINOCOMP is type 1 diabetes without complications.
A slight causal effect of T1DM without complications on LFC was observed (OR=1.025 [1.00, 1.03], MR Egger p=0.045). However, none of the causal relationships were significant in the IVW (p=0.317), Weighted median (p=0.076), and Weighted mode (p=0.163) methods. Similarly, genetically-driven T1DM (OR=1.003 [0.99, 1.02], IVW p=0.693) and T1DM with complications (OR=0.998 [0.98, 1.01], IVW p=0.818) did not alter LFC. In the MR-Egger regression and weighted median methods, none of the causal relationships were significant (Table 3). Despite detecting slight heterogeneity in the T1DM-NAFLD and T1DM-LFC analyses, the conclusions remained valid after outlier removal (Figure 2B, Supplementary Table 2).
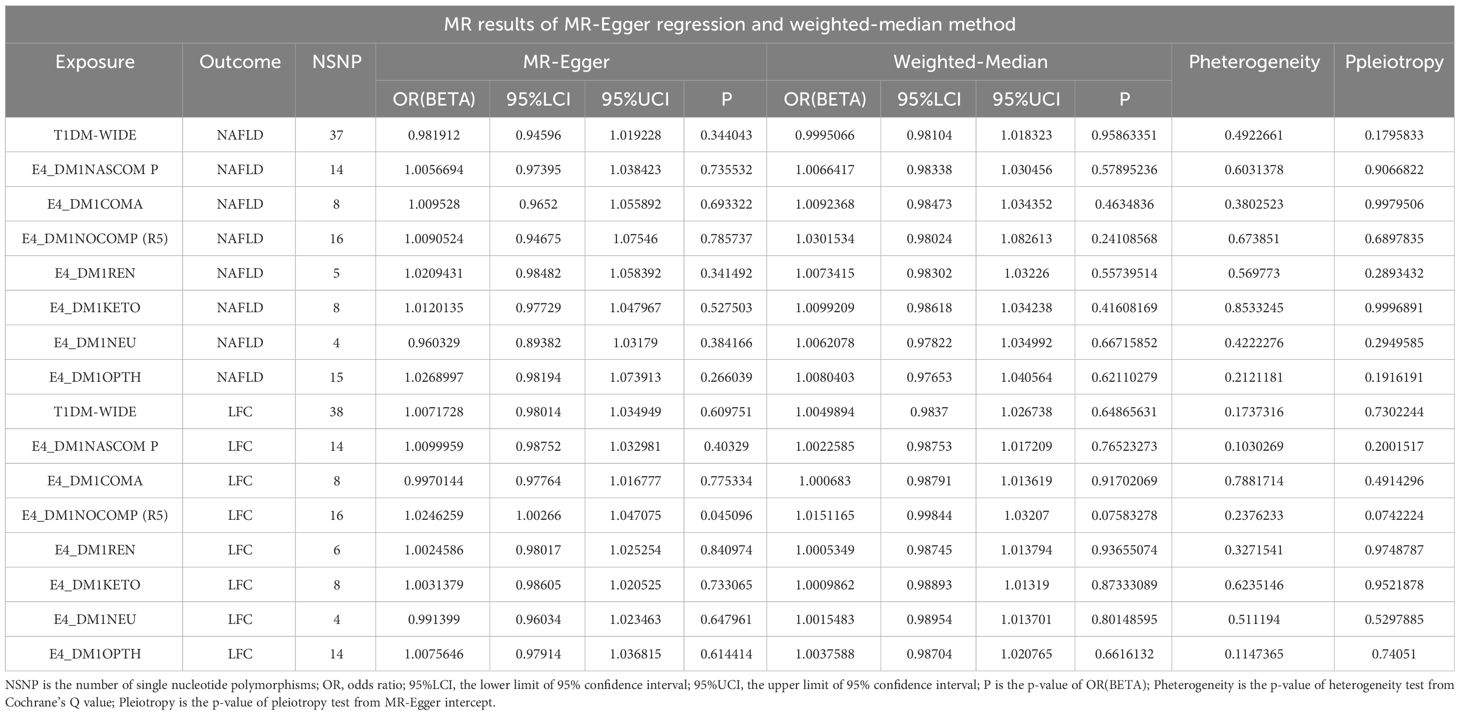
Table 3 MR results of MR-Egger regression and weighted-median method.
3.3 The causal association between common T1DM with different complications and NAFLD
3.3.1 E4_DM1COMA is type 1 diabetes with coma
In the set of IVs (p < 5 × 10⁻⁸), 8 SNPs related to type 1 diabetes with coma were identified. It was found that no genetic liability to type 1 diabetes with coma was causally associated with NAFLD (OR=1.009 [0.99, 1.03], IVW p=0.433). Consistent conclusions were obtained through additional statistical methods such as MR Egger (OR=1.010 [0.97, 1.06], p=0.693), Weighted median (OR=1.010 [0.98, 1.03], p=0.463), and Weighted mode (OR=1.009 [0.98, 1.03], p=0.489) (Figure 3, Supplementary Table 1).
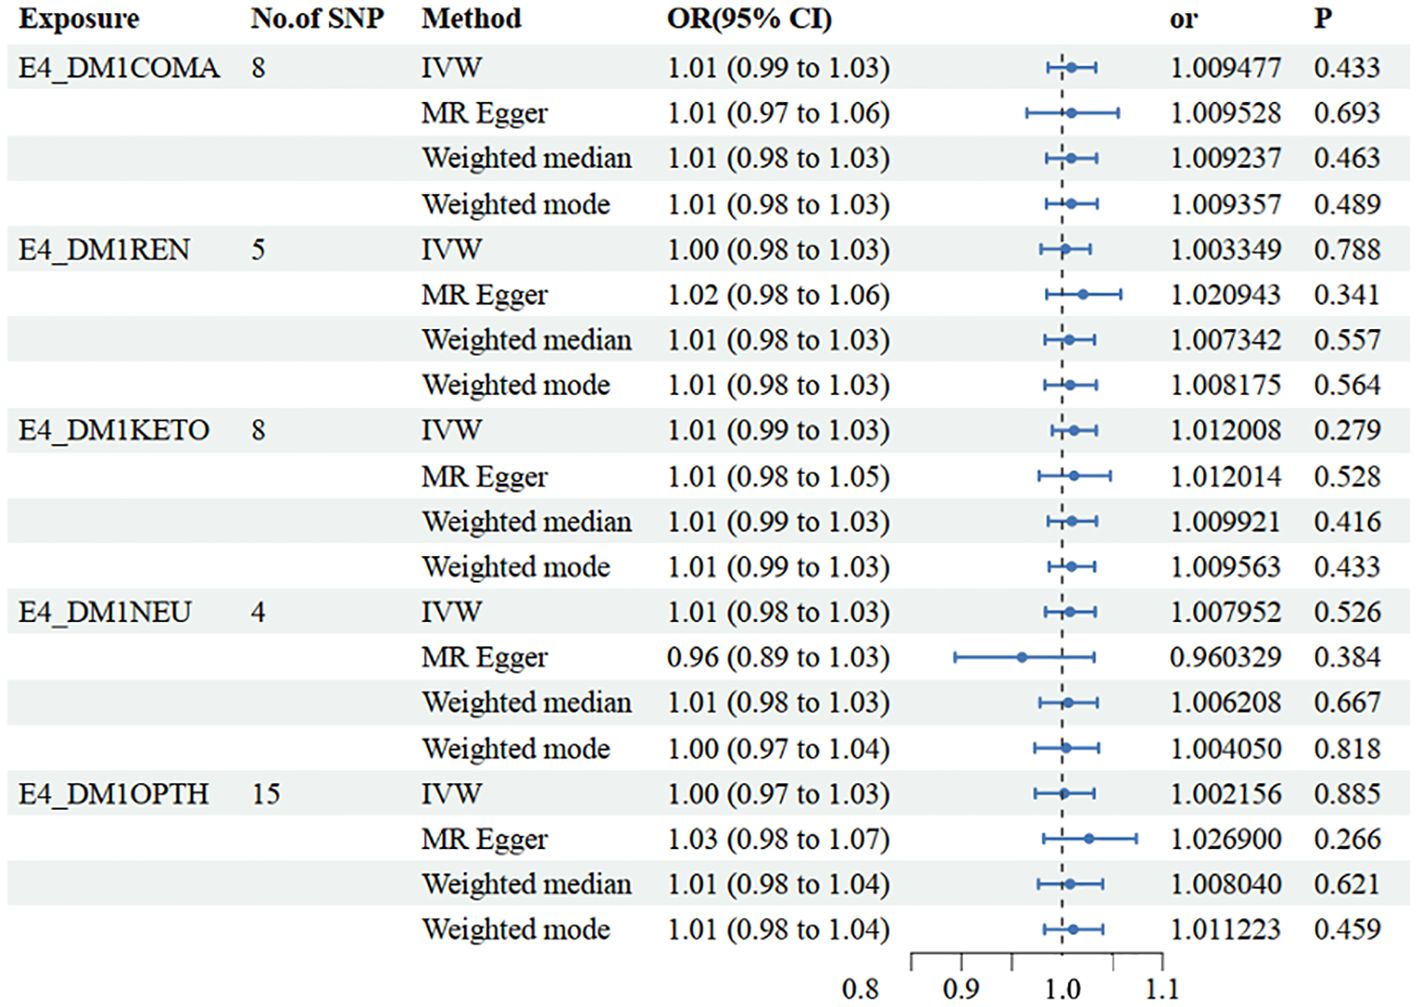
Figure 3 Mendelian randomization results of causal effects between type 1 diabetes with different complications and NAFLD. E4_DMICOMA is type 1 diabetes with coma; E4_DMIREN is type 1 diabetes with renal complications; E4_DMIKETO is type 1 diabetes with ketoacidosis; E4_DMINEU is type 1 diabetes with neurological complications; E4_DM1OPTH is type 1 diabetes with ophthalmic complications.
In the other database, consistent conclusions were obtained between type 1 diabetes with coma and LFC (OR=1.003 [0.99, 1.01], IVW p=0.604) (Figure 4, Supplementary Table 2).
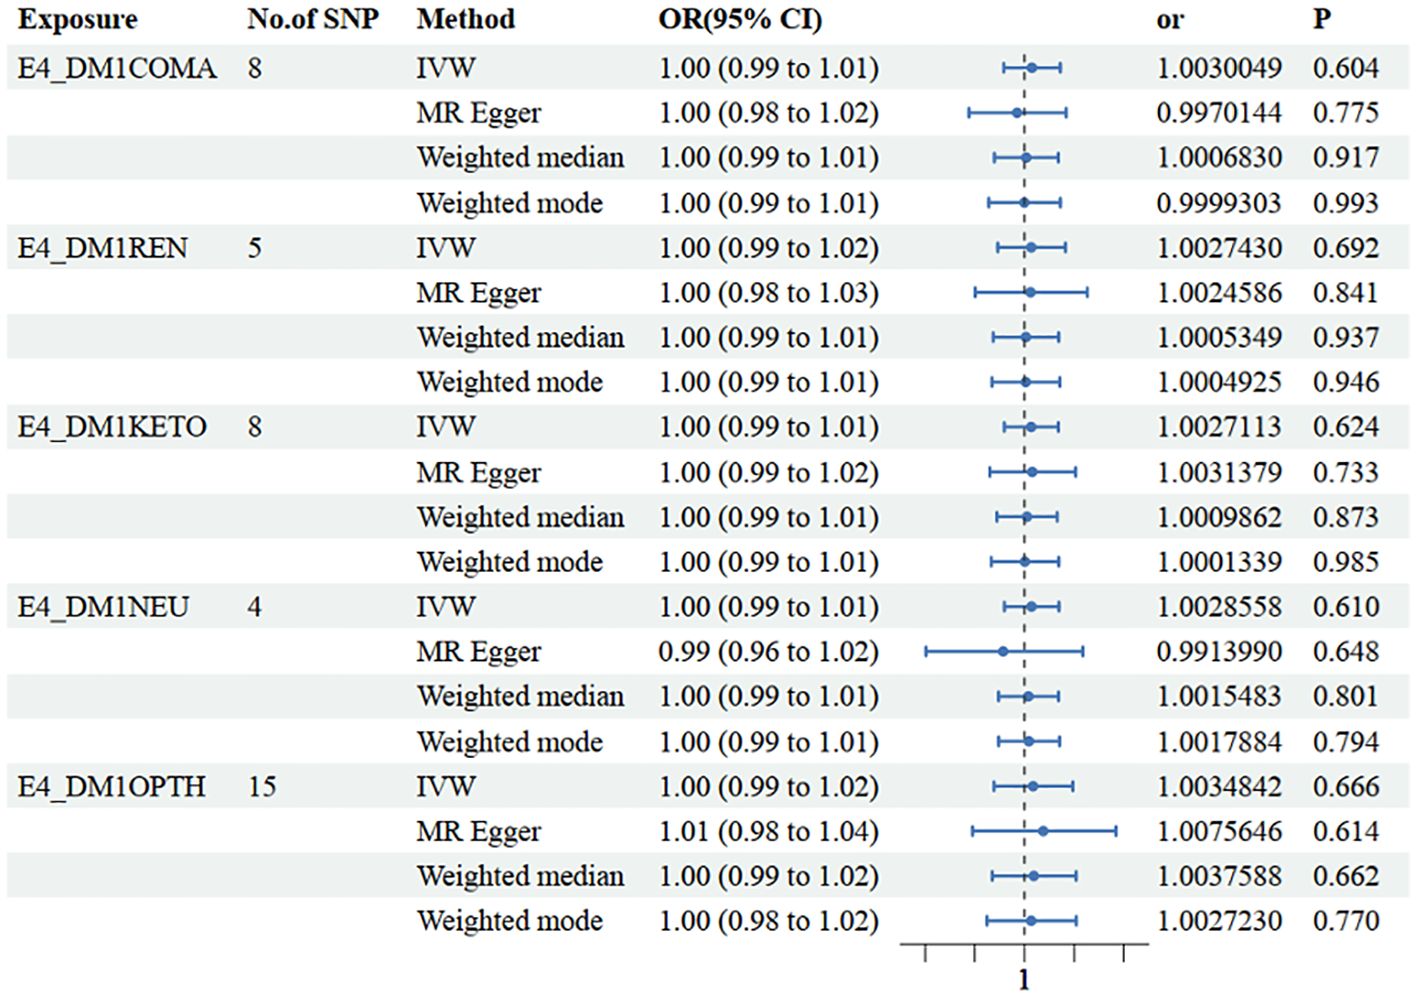
Figure 4 Mendelian randomization results of causal effects between type 1 diabetes with different complications and LFH.
3.3.2 E4_DM1REN is type 1 diabetes with renal complications
In the set of IVs (p < 5 × 10⁻⁸), 5 SNPs related to type 1 diabetes with renal complications were identified. It was found that no genetic liability to type 1 diabetes with renal complications was causally associated with NAFLD (OR=1.003 [0.98, 1.03], IVW p=0.788). Consistent conclusions were obtained through additional statistical methods such as MR Egger (OR=1.021 [0.98, 1.06], p=0.341), Weighted median (OR=1.007 [0.98, 1.03], p=0.557), and Weighted mode (OR=1.008 [0.98, 1.03], p=0.564) (Figure 3, Supplementary Table 1).
In the other database, consistent conclusions were obtained between type 1 diabetes with renal complications and LFC (OR=1.003 [0.99, 1.02], IVW p=0.692) (Figure 4, Supplementary Table 2).
3.3.3 E4_DM1KETO is type 1 diabetes with ketoacidosis
In the set of IVs (p < 5 × 10⁻⁸), 8 SNPs related to type 1 diabetes with ketoacidosis were identified. It was found that no genetic liability to type 1 diabetes with ketoacidosis was causally associated with NAFLD (OR=1.012 [0.99, 1.03], IVW p=0.279). Consistent conclusions were obtained through additional statistical methods such as MR Egger (OR=1.012 [0.98, 1.05], p=0.528), Weighted median (OR=1.010 [0.99 1.03], p=0.416), and Weighted mode (OR=1.010 [0.99, 1.03], p=0.433) (Figure 3, Supplementary Table 1).
In the other database, consistent conclusions were obtained between type 1 diabetes with ketoacidosis and LFC (OR=1.003 [0.99, 1.01], IVW p=0.624) (Figure 4, Supplementary Table 2).
3.3.4 E4_DM1NEU is type 1 diabetes with neurological complications
In the set of IVs (p < 5 × 10⁻⁸), 4 SNPs related to type 1 diabetes with neurological complications were identified. It was found that no genetic liability to type 1 diabetes with neurological complications was causally associated with NAFLD (OR=1.008 [0.98, 1.03], IVW p=0.526). Consistent conclusions were obtained through additional statistical methods such as MR Egger (OR=0.960 [0.89, 1.03], p=0.384), Weighted median (OR=1.010 [0.98 1.03], p=0.667), and Weighted mode (OR=1.004 [0.97, 1.04], p=0.818) (Figure 3, Supplementary Table 1).
In the other database, consistent conclusions were obtained between type 1 diabetes with neurological complications and LFC (OR=1.003 [0.99, 1.01], IVW p=0.610) (Figure 4, Supplementary Table 2).
3.3.5 E4_DM1OPTH is type 1 diabetes with ophthalmic complications
In the set of IVs (p < 5 × 10⁻⁸), 15 SNPs related to type 1 diabetes with ophthalmic complications were identified. It was found that no genetic liability to type 1 diabetes with ophthalmic complications was causally associated with NAFLD (OR=1.002[0.97, 1.03], IVW p=0.885). Consistent conclusions were obtained through additional statistical methods such as MR Egger (OR=1.027 [0.98, 1.07], p=0.266), Weighted median (OR=1.008 [0.98 1.04], p=0.621), and Weighted mode (OR=1.011 [0.98, 1.04], p=0.459) (Figure 3, Supplementary Table 1).
In the other database, consistent conclusions were obtained between type 1 diabetes with ophthalmic complications and LFC (OR=1.004 [0.99, 1.02], IVW p=0.666) (Figure 4, Supplementary Table 2).
4 Discussion
Given the escalating global burden of metabolic disorders, conducting high-quality prospective research to evaluate the correlation between the genetic condition T1DM and metabolic disorder NAFLD presents significant challenges. Our study extensively examined the correlation between non-alcoholic fatty liver disease (NAFLD) and type 1 diabetes mellitus (T1DM). Through an in-depth analysis of a substantial and independent cohort, our findings suggest that there may not be a direct causal relationship between T1DM and NAFLD. Prior studies have posited a plausible link between NAFLD and T1DM, potentially attributed to metabolic disruptions stemming from the evolution of T1DM, including secondary metabolic derangements induced by T1DM complications (21). We further investigated the relationship between NAFLD and T1DM with complications. Our research found that the presence or absence of complications such as renal dysfunction, coma, ketoacidosis, neurological complications, and retinopathy did not increase the probability of NAFLD development in individuals with T1DM. In other words, regardless of complications, the genetic susceptibility of T1DM does not increase the likelihood of NAFLD. Our findings carry noteworthy implications for understanding the T1DM-NAFLD relationship, potentially facilitating the clinical management of T1DM patients with concurrent NAFLD.
The observed causal effect of T1DM on LFC in this study may be a false positive, as this result was not significant in both the IVW and weighted median methods. However, we cannot completely rule out this causal relationship, as the genetic susceptibility of T1DM, high glucose-induced oxidative stress, and cellular metabolic dysfunction may impact the pathogenesis of NAFLD (22, 23). Additionally, reports suggest that as the disease progresses, the degree of hepatic steatosis increases further in T1DM with complications (21, 24, 25). Therefore, further investigations are warranted to elucidate this association.
Regarding the null associations, several factors can explain them. Metabolic syndrome, characterized by obesity, hyperglycemia, dyslipidemia, and systemic hypertension, currently represents the most prominent risk factor for NAFLD (26). More than 70% of NAFLD patients typically manifest elevated levels of triglycerides (TG), total cholesterol (TC), low-density lipoprotein cholesterol (LDL-C), and reduced levels of high-density lipoprotein cholesterol (HDL-C), primarily synthesized in the liver, indicating dysregulated lipid metabolism in these individuals. In contrast to type 2 diabetes mellitus (T2DM), well-controlled patients with type 1 diabetes mellitus (T1DM) show no significant alterations in lipid levels (LDL-C, HDL-C, TG) and blood pressure levels (27–29). Furthermore, the majority of T1DM patients tend to develop a lean phenotype rather than obesity (29). Hence, we postulate that T1DM may induce a specific metabolic state that may not predispose individuals to NAFLD.
Interestingly, there is direct evidence suggesting that the absolute insulin deficiency in T1DM patients, leading to the absence of portal vein/peripheral insulin gradients, may reduce insulin stimulation of hepatic lipogenesis and impede the development of NAFLD (30). Additionally, Perseghin et al. (31) reported significantly lower hepatic fat content in T1DM patients compared to non-diabetic individuals, with no significant association between NAFLD and T1DM (32). However, due to the lifelong subcutaneous insulin injections required in T1DM, relative peripheral hyperinsulinemia and hepatic hypoinsulinemia may occur, leading to insulin resistance (33). This relative insulin-resistant state can affect glucose and lipid hepatic metabolism, triggering pro-inflammatory cascades and resulting in hepatic steatosis, fibrosis, and cirrhosis (34–36). The onset and progression of NAFLD can be promoted following insulin resistance in T1DM. Therefore, the observed coexistence of NAFLD and T1DM may be attributed to the effects of treatment, particularly the impact of insulin resistance on NAFLD. In conclusion, based on previous studies, it is challenging to demonstrate a direct promotion of NAFLD development by T1DM.
Furthermore, recent studies indicate an association between NAFLD and complications in patients with T1DM (21). In the general population, the prevalence of hepatic steatosis (defined as HSI > 36) is 37.1%, but it increases to 49% in T1DM patients with complications and to 32% in those without complications. This suggests an independent correlation of NAFLD with cardiovascular disease, chronic kidney disease, retinopathy, and neuropathy in T1DM patients, regardless of established risk factors (24, 25, 37, 38). Some researchers propose that poor blood glucose control in patients with chronic diabetes complications leads to the conversion of glucose into fat in the liver via GLUT2 transport, thereby promoting hepatic lipid accumulation (39). However, these studies are based on populations of poorly controlled T1DM patients with complications, and there is no difference in prevalence compared to normal overweight populations. From a genetic susceptibility perspective, it cannot be inferred that the occurrence of T1DM (including T1DM with complications) is causally related to the development of NAFLD.
The selection of instrumental variables is a critical step in Mendelian randomization studies. To ensure validity, any genetic variation must influence the outcome solely through its effect on the exposure, without horizontal pleiotropy (40, 41). To address potential pleiotropic factors, MR-Egger regression can be used to reveal a statistically significant intercept when these genetic variants are excluded, thereby reducing heterogeneity and eliminating horizontal pleiotropy (42). In patients with T1DM, metabolic disturbances resulting from insulin resistance and alterations in glucose and lipid metabolism may significantly contribute to the development of NAFLD (43, 44). In this study, according to the fundamental assumption of MR studies, we adopted SNPs with a significance threshold of P < 5 × 10^-8 from the GWAS data as instrumental variables. To address potential linkage disequilibrium effects on the analysis outcomes, we imposed criteria of r^2 < 0.001 and a window size of 10,000 kb. To ensure robust associations between instrumental variables and endogenous variables and to mitigate bias from weak instrumental variables, we computed R^2 [R^2 = 2 × EAF × (1 - EAF) × b^2], which represents the proportion of variance explained by instrumental variable SNPs, and the F-statistic [F = R^2 × (N - 2)/(1 - R^2)] to evaluate the strength of instrumental variables, each with its distinct characteristics. Furthermore, we utilized the PhenoScanner (V2; http://www.phenoscanner.medschl.cam.ac.uk/upload/) database to filter out genetic variants linked to potential confounding factors like insulin resistance. These meticulously screened SNPs were subsequently employed as the definitive instrumental variables for subsequent MR analyses.
To minimize potential weak instrument bias amplification, separate databases with minimal sample overlap between exposure and outcome data sources were utilized. Despite our efforts, limitations of this study have been acknowledged that must be taken into account. One limitation is the challenges of pleiotropy in the MR framework, as found in all MR studies (45, 46). To address this, various sensitivity analyses with different assumptions were conducted.
Our research boasts several noteworthy strengths. Firstly, this analysis enrolled the largest number of phenotypes of T1DM with complications in different datasets to date, including discovery and validation stages, thereby enhancing the persuasiveness of the findings (47). Secondly, we conducted rigorous sensitivity analyses to validate the IVs pertinent to our hypothesis. After considering horizontal pleiotropy, outliers, and sample overlap, the confidence of the results was increased. Thirdly, our study was restricted to individuals of European descent, which could reduce population stratification bias (48, 49).. Finally, in our study, we maintained a minimal degree of overlap between exposure and outcome data sources, so that inflation of the weak instrument bias could be avoided as much as possible.
5 Conclusion
In this study, a two-sample Mendelian randomization framework was utilized to investigate the potential causal relationship between T1DM and NAFLD. The analysis was validated subsequent to the integration and scrutiny of selected databases. Our findings suggest that T1DM, as well as combined with complications, does not directly lead to an increased incidence of NAFLD. Mechanisms linking the two beyond genetics remain unclear and warrant further investigation in future studies.
Data availability statement
The original contributions presented in the study are included in the article/Supplementary Material. Further inquiries can be directed to the corresponding authors.
Ethics statement
The GWAS used in the current study were approved by their relevant review board, and written informed consent for participation was not required for the work in accordance with the national legislation and institutional requirements.
Author contributions
LT: Data curation, Writing – original draft. LY: Formal analysis, Funding acquisition, Writing – review & editing. YL: Writing – review & editing. XY: Formal analysis, Writing – review & editing.
Funding
The author(s) declare that financial support was received for the research, authorship, and/or publication of this article. This work was supported by the Young Talent Fund of Sichuan Provincial People’s Hospital (No. 2020QN03), and the Scientific Research Fund of Chengdu Science and Technology Bureau (2020-YF05-00053-SN).
Acknowledgments
The authors thank FinnGen study and UK Biobank collaborators for providing the data for our research and all the participants and researchers for their participation in this MR study.
Conflict of interest
The authors declare that the research was conducted in the absence of any commercial or financial relationships that could be construed as a potential conflict of interest.
Publisher’s note
All claims expressed in this article are solely those of the authors and do not necessarily represent those of their affiliated organizations, or those of the publisher, the editors and the reviewers. Any product that may be evaluated in this article, or claim that may be made by its manufacturer, is not guaranteed or endorsed by the publisher.
Supplementary material
The Supplementary Material for this article can be found online at: https://www.frontiersin.org/articles/10.3389/fendo.2024.1315046/full#supplementary-material
References
1. Yuen L, Saeedi P, Riaz M, Karuranga S, Divakar H, Levitt N, et al. Projections of the prevalence of hyperglycaemia in pregnancy in 2019 and beyond: Results from the International Diabetes Federation Diabetes Atlas, 9th edition. Diabetes Res Clin Pract. (2019) 157:107841. doi: 10.1016/j.diabres.2019.107841
2. Crane H, Gofton C, Sharma A, George J. MAFLD: an optimal framework for understanding liver cancer phenotypes. J Gastroenterol. (2023) 58:947–64. doi: 10.1007/s00535-023-02021-7
3. Gofton C, Upendran Y, Zheng M-H, George J. MAFLD: How is it different from NAFLD? Clin Mol Hepatol. (2023) 29:S17–31. doi: 10.3350/cmh.2022.0367
4. Bluestone JA, Buckner JH, Herold KC. Immunotherapy: Building a bridge to a cure for type 1 diabetes. Science. (2021) 373:510–6. doi: 10.1126/science.abh1654
5. Sims EK, Besser REJ, Dayan C, Geno Rasmussen C, Greenbaum C, Griffin KJ, et al. Screening for type 1 diabetes in the general population: A status report and perspective. Diabetes. (2022) 71:610–23. doi: 10.2337/dbi20-0054
6. Mertens J, De Block C, Spinhoven M, Driessen A, Francque SM, Kwanten WJ. Hepatopathy associated with type 1 diabetes: distinguishing non-alcoholic fatty liver disease from glycogenic hepatopathy. Front Pharmacol. (2021) 12:768576. doi: 10.3389/fphar.2021.768576
7. Abdelmalek MF. Nonalcoholic fatty liver disease: another leap forward. Nat Rev Gastroenterol Hepatol. (2021) 18:85–6. doi: 10.1038/s41575-020-00406-0
8. Sekula P, Del Greco MF, Pattaro C, Köttgen A. Mendelian randomization as an approach to assess causality using observational data. J Am Soc Nephrol JASN. (2016) 27:3253–65. doi: 10.1681/ASN.2016010098
9. Skrivankova VW, Richmond RC, Woolf BAR, Davies NM, Swanson SA, VanderWeele TJ, et al. Strengthening the reporting of observational studies in epidemiology using mendelian randomisation (STROBE-MR): explanation and elaboration. BMJ. (2021) 375:n2233. doi: 10.1136/bmj.n2233
10. Thanassoulis G, O’Donnell CJ. Mendelian randomization: nature’s randomized trial in the post-genome era. JAMA. (2009) 301:2386–8. doi: 10.1001/jama.2009.812
11. Davey Smith G, Hemani G. Mendelian randomization: genetic anchors for causal inference in epidemiological studies. Hum Mol Genet. (2014) 23:R89–98. doi: 10.1093/hmg/ddu328
12. Liu Z, Zhang Y, Graham S, Wang X, Cai D, Huang M, et al. Causal relationships between NAFLD, T2D and obesity have implications for disease subphenotyping. J Hepatol. (2020) 73:263–76. doi: 10.1016/j.jhep.2020.03.006
13. Xie J, Huang H, Liu Z, Li Y, Yu C, Xu L, et al. The associations between modifiable risk factors and nonalcoholic fatty liver disease: A comprehensive Mendelian randomization study. Hepatol Baltim Md. (2023) 77:949–64. doi: 10.1002/hep.32728
14. Rasooly D, Peloso GM. Two-sample multivariable mendelian randomization analysis using R. Curr Protoc. (2021) 1:e335. doi: 10.1002/cpz1.335
15. Zhang M, Chen J, Yin Z, Wang L, Peng L. The association between depression and metabolic syndrome and its components: a bidirectional two-sample Mendelian randomization study. Transl Psychiatry. (2021) 11:633. doi: 10.1038/s41398-021-01759-z
16. Lambert JE, Ramos-Roman MA, Browning JD, Parks EJ. Increased de novo lipogenesis is a distinct characteristic of individuals with nonalcoholic fatty liver disease. Gastroenterology. (2014) 146:726–35. doi: 10.1053/j.gastro.2013.11.049
17. Donnelly KL, Smith CI, Schwarzenberg SJ, Jessurun J, Boldt MD, Parks EJ. Sources of fatty acids stored in liver and secreted via lipoproteins in patients with nonalcoholic fatty liver disease. J Clin Invest. (2005) 115:1343–51. doi: 10.1172/JCI23621
18. Brouwers MCGJ, Simons N, Stehouwer CDA, Koek GH, Schaper NC, Isaacs A. Relationship between nonalcoholic fatty liver disease susceptibility genes and coronary artery disease. Hepatol Commun. (2019) 3:592–3. doi: 10.1002/hep4.1319
19. Mantovani A, Csermely A, Petracca G, Beatrice G, Corey KE, Simon TG, et al. Non-alcoholic fatty liver disease and risk of fatal and non-fatal cardiovascular events: an updated systematic review and meta-analysis. Lancet Gastroenterol Hepatol. (2021) 6:903–13. doi: 10.1016/S2468-1253(21)00308-3
20. Liu J, Au Yeung SL, Lin SL, Leung GM, Schooling CM. Liver enzymes and risk of ischemic heart disease and type 2 diabetes mellitus: A mendelian randomization study. Sci Rep. (2016) 6:38813. doi: 10.1038/srep38813
21. de Vries M, Westerink J, Kaasjager KHAH, de Valk HW. Prevalence of nonalcoholic fatty liver disease (NAFLD) in patients with type 1 diabetes mellitus: A systematic review and meta-analysis. J Clin Endocrinol Metab. (2020) 105:3842–53. doi: 10.1210/clinem/dgaa575
22. Régnier M, Carbinatti T, Parlati L, Benhamed F, Postic C. The role of ChREBP in carbohydrate sensing and NAFLD development. Nat Rev Endocrinol. (2023) 19:336–49. doi: 10.1038/s41574-023-00809-4
23. Kawamura S, Matsushita Y, Kurosaki S, Tange M, Fujiwara N, Hayata Y, et al. Inhibiting SCAP/SREBP exacerbates liver injury and carcinogenesis in murine nonalcoholic steatohepatitis. J Clin Invest. (2022) 132:e151895. doi: 10.1172/JCI151895
24. Aydın F, Gerenli N, Dursun F, Atasoy TÖ, Kalın S, Kırmızıbekmez H. Hepatopathies in children and adolescents with type 1 diabetes. J Pediatr Endocrinol Metab JPEM. (2019) 32:121–6. doi: 10.1515/jpem-2018-0255
25. Castera L, Friedrich-Rust M, Loomba R. Noninvasive assessment of liver disease in patients with nonalcoholic fatty liver disease. Gastroenterology. (2019) 156:1264–1281.e4. doi: 10.1053/j.gastro.2018.12.036
26. Friedman SL, Neuschwander-Tetri BA, Rinella M, Sanyal AJ. Mechanisms of NAFLD development and therapeutic strategies. Nat Med. (2018) 24:908–22. doi: 10.1038/s41591-018-0104-9
27. Chiesa ST, Charakida M, McLoughlin E, Nguyen HC, Georgiopoulos G, Motran L, et al. Elevated high-density lipoprotein in adolescents with type 1 diabetes is associated with endothelial dysfunction in the presence of systemic inflammation. Eur Heart J. (2019) 40:3559–66. doi: 10.1093/eurheartj/ehz114
28. Chait A, Goldberg I. Treatment of dyslipidemia in diabetes: recent advances and remaining questions. Curr Diabetes Rep. (2017) 17:112. doi: 10.1007/s11892-017-0942-8
29. Marx N, Federici M, Schütt K, Müller-Wieland D, Ajjan RA, Antunes MJ, et al. 2023 ESC Guidelines for the management of cardiovascular disease in patients with diabetes. Eur Heart J. (2023) 44:4043–140. doi: 10.1093/eurheartj/ehad192
30. Xu W, Cui C, Cui C, Chen Z, Zhang H, Cui Q, et al. Hepatocellular cystathionine γ lyase/hydrogen sulfide attenuates nonalcoholic fatty liver disease by activating farnesoid X receptor. Hepatol Baltim Md. (2022) 76:1794–810. doi: 10.1002/hep.32577
31. Perseghin G, Lattuada G, De Cobelli F, Esposito A, Costantino F, Canu T, et al. Reduced intrahepatic fat content is associated with increased whole-body lipid oxidation in patients with type 1 diabetes. Diabetologia. (2005) 48:2615–21. doi: 10.1007/s00125-005-0014-5
32. Llauradó G, Sevastianova K, Sädevirta S, Hakkarainen A, Lundbom N, Orho-Melander M, et al. Liver fat content and hepatic insulin sensitivity in overweight patients with type 1 diabetes. J Clin Endocrinol Metab. (2015) 100:607–16. doi: 10.1210/jc.2014-3050
33. Dugbartey GJ, Alornyo KK, Adams I, Atule S, Obeng-Kyeremeh R, Amoah D, et al. Targeting hepatic sulfane sulfur/hydrogen sulfide signaling pathway with α-lipoic acid to prevent diabetes-induced liver injury via upregulating hepatic CSE/3-MST expression. Diabetol Metab Syndr. (2022) 14:148. doi: 10.1186/s13098-022-00921-x
34. Roussel R, Travert F, Pasquet B, Wilson PWF, Smith SC, Goto S, et al. Metformin use and mortality among patients with diabetes and atherothrombosis. Arch Intern Med. (2010) 170:1892–9. doi: 10.1001/archinternmed.2010.409
35. Randriamboavonjy V, Mann WA, Elgheznawy A, Popp R, Rogowski P, Dornauf I, et al. Metformin reduces hyper-reactivity of platelets from patients with polycystic ovary syndrome by improving mitochondrial integrity. Thromb Haemost. (2015) 114:569–78. doi: 10.1160/TH14-09-0797
36. Carvajal R, Rosas C, Kohan K, Gabler F, Vantman D, Romero C, et al. Metformin augments the levels of molecules that regulate the expression of the insulin-dependent glucose transporter GLUT4 in the endometria of hyperinsulinemic PCOS patients. Hum Reprod Oxf Engl. (2013) 28:2235–44. doi: 10.1093/humrep/det116
37. Clemente MG, Mandato C, Poeta M, Vajro P. Pediatric non-alcoholic fatty liver disease: Recent solutions, unresolved issues, and future research directions. World J Gastroenterol. (2016) 22:8078–93. doi: 10.3748/wjg.v22.i36.8078
38. Carallo C, Tripolino C, De Franceschi MS, Irace C, Xu XY, Gnasso A. Carotid endothelial shear stress reduction with aging is associated with plaque development in twelve years. Atherosclerosis. (2016) 251:63–9. doi: 10.1016/j.atherosclerosis.2016.05.048
39. Shearer AM, Wang Y, Fletcher EK, Rana R, Michael ES, Nguyen N, et al. PAR2 promotes impaired glucose uptake and insulin resistance in NAFLD through GLUT2 and Akt interference. Hepatol Baltim Md. (2022) 76:1778–93. doi: 10.1002/hep.32589
40. Yin K-J, Huang J-X, Wang P, Yang X-K, Tao S-S, Li H-M, et al. No genetic causal association between periodontitis and arthritis: A bidirectional two-sample mendelian randomization analysis. Front Immunol. (2022) 13:808832. doi: 10.3389/fimmu.2022.808832
41. Li P, Wang H, Guo L, Gou X, Chen G, Lin D, et al. Association between gut microbiota and preeclampsia-eclampsia: a two-sample Mendelian randomization study. BMC Med. (2022) 20:443. doi: 10.1186/s12916-022-02657-x
42. Bowden J, Del Greco MF, Minelli C, Davey Smith G, Sheehan NA, Thompson JR. Assessing the suitability of summary data for two-sample Mendelian randomization analyses using MR-Egger regression: the role of the I2 statistic. Int J Epidemiol. (2016) 45:1961–74. doi: 10.1093/ije/dyw220
43. Liu DJ, Peloso GM, Yu H, Butterworth AS, Wang X, Mahajan A, et al. Exome-wide association study of plasma lipids in >300,000 individuals. Nat Genet. (2017) 49:1758–66. doi: 10.1040/ng.3977
44. Brouwers MCGJ, Simons N, Stehouwer CDA, Isaacs A. Non-alcoholic fatty liver disease and cardiovascular disease: assessing the evidence for causality. Diabetologia. (2020) 63:253–60. doi: 10.1007/s00125-019-05024-3
45. Smith ML, Bull CJ, Holmes MV, Davey Smith G, Sanderson E, Anderson EL, et al. Distinct metabolic features of genetic liability to type 2 diabetes and coronary artery disease: a reverse Mendelian randomization study. EBioMedicine. (2023) 90:104503. doi: 10.1016/j.ebiom.2023.104503
46. Brown BC, Knowles DA. Welch-weighted Egger regression reduces false positives due to correlated pleiotropy in Mendelian randomization. Am J Hum Genet. (2021) 108:2319–35. doi: 10.1016/j.ajhg.2021.10.006
47. Xiang K, Wang P, Xu Z, Hu Y-Q, He Y-S, Chen Y, et al. Causal effects of gut microbiome on systemic lupus erythematosus: A two-sample mendelian randomization study. Front Immunol. (2021) 12:667097. doi: 10.3389/fimmu.2021.667097
48. Teo K, Abeysekera KWM, Adams L, Aigner E, Anstee QM, Banales JM, et al. rs641738C>T near MBOAT7 is associated with liver fat, ALT and fibrosis in NAFLD: A meta-analysis. J Hepatol. (2021) 74:20–30. doi: 10.1016/j.jhep.2020.08.027
49. Mantovani A, Morieri ML, Palmisano L, Masulli M, Cossu E, Baroni MG, et al. Hepatic steatosis with significant fibrosis is associated with an increased 10-year estimated risk of cardiovascular disease in adults with type 1 diabetes mellitus. Cardiovasc Diabetol. (2023) 22:204. doi: 10.1186/s12933-023-01945-x
Keywords: two-sample Mendelian randomization, type 1 diabetes mellitus, non-alcoholic fatty liver disease, metabolic syndrome, causality
Citation: Tuo L, Yan L-t, Liu Y and Yang X-x (2024) Type 1 diabetes mellitus and non-alcoholic fatty liver disease: a two-sample Mendelian randomization study. Front. Endocrinol. 15:1315046. doi: 10.3389/fendo.2024.1315046
Received: 10 October 2023; Accepted: 29 March 2024;
Published: 12 April 2024.
Edited by:
Giuseppe Della Pepa, National Research Council (CNR), ItalyReviewed by:
Junzi Wu, Yunnan University of Traditional Chinese Medicine, ChinaKaijian Hou, Shantou University, China
Copyright © 2024 Tuo, Yan, Liu and Yang. This is an open-access article distributed under the terms of the Creative Commons Attribution License (CC BY). The use, distribution or reproduction in other forums is permitted, provided the original author(s) and the copyright owner(s) are credited and that the original publication in this journal is cited, in accordance with accepted academic practice. No use, distribution or reproduction is permitted which does not comply with these terms.
*Correspondence: Xing-xiang Yang, NzE5NTI1MzgzQHFxLmNvbQ==; Lin Tuo, dGx3aWxsQDEyNi5jb20=