 Qiuhong Li1,2
 Tongdan Wang1,2
 Xian Shao1,2
 Xiaoguang Fan3
 Yao Lin1,2
 Zhuang Cui4
 Hongyan Liu1,2
 Saijun Zhou1,2
 Pei Yu1,2*†
- 1NHC Key Laboratory of Hormones and Development, Chu Hsien-I Memorial Hospital and Tianjin Institute of Endocrinology, Tianjin Medical University, Tianjin, China
- 2Tianjin Key Laboratory of Metabolic Diseases, Tianjin Medical University, Tianjin, China
- 3Department of Nephrology, Fuwai Central China Cardiovascular Hospital, Zhengzhou, Henan, China
- 4Department of Epidemiology and Health Statistics, Tianjin Medical University, Tianjin, China
Background: The association of Remnant cholesterol (RC) with renal function and its progression in patients with Type 2 diabetes (T2DM) related chronic kidney disease (CKD) remains unclear.
Methods: 8,678 patients with T2DM-related CKD were included in cross-sectional analysis, and 6,165 patients were enrolled in longitudinal analysis and followed up for a median of 36.0 months. The outcomes were renal composite endpoint event and rapid progression of renal function.
Results: 24.54% developed a renal composite endpoint event, and 27.64% rapid progression of renal function. RC levels above 0.56 mmol/L independently increased the risk of both renal composite endpoint (HR, 1.17; 95% CIs, 1.03-1.33) and rapid progression of renal function (OR, 1.17; 95% CIs, 1.01- 1.37). TG levels above 1.65 mmol/L only increased the risk of renal composite endpoint (HR, 1.16; 95% CIs, 1.02 -1.32). TC levels above 5.21 mmol/L increased the risk of renal composite endpoint (HR, 1.14; 95% CIs, 1.01-1.29) only in patients with proteinuria≥0.5g/d. Conversely, HDL-C levels below 1.20 mmol/L or above 1.84 mmol/L increased the risk of rapid progression of renal function (OR, 0.88; 95% CIs, 0.70 -0.99) in patients with proteinuria<0.5g/d (all P<0.05).
Conclusion: In patients with T2DM-related CKD, RC was an independent risk factor for progression of renal function, and maintaining it below 0.56 mmol/L could reduce the risk of renal function progression.
Background
Epidemiological research reveals that in 2021, over 537 million people globally had diabetes mellitus(DM), with 141 million in China (1, 2). The majority of cases were Type 2 diabetes(T2DM) (>95%) (3). Chronic kidney disease (CKD) is a significant cause of disability and mortality, posing a substantial global public health challenge (4, 5). Recent studies indicate that DM has surpassed glomerulonephritis as the primary cause of CKD in China (6). In 2019, DM-related CKD was responsible for 760,300 deaths, with T2DM accounting for 83.32% (7). Moreover, the annual cost of dialysis for CKD treatment alone amounts to a staggering 1.5 billion yuan (8). Therefore, early identification and intervention for high-risk individuals with renal function progression in T2DM-related CKD can significantly improve patient quality of life and alleviate the burden on the healthcare and economic systems.
Research has demonstrated a high prevalence of hyperlipidemia in individuals with DM, ranging from72-85% (9). Dyslipidemia is similarly prevalent in patients with CKD, attributed to notable changes significant alterations in lipoprotein metabolism, structure and function (10, 11). Consequently, individuals with T2DM-related CKD are more likely to be complicated by dyslipidemia (12). Studies indicate that hyperlipidemia can directly cause structural and functional changes in podocytes, mesangial cells and proximal tubular cells, ultimately leading to renal fibrosis and the progression of CKD (11, 13). Additionally, hyperlipidemia can indirectly induce glomerular and tubular damage by promoting pathological changes in mitochondria. Remnant cholesterol (RC) is the cholesterol of triglyceride-rich lipoproteins, which is composed of very low-density lipoprotein cholesterol (VLDL-C), intermediate-density lipoproteins (IDL), and postprandial chylomicrons (14). Studies have shown that RC is associated not only with atherosclerotic plaque formation (15), but also with inflammation (16, 17). The pathophysiological processes of glomerulosclerosis share similarities with those of atherosclerosis.
Currently, there exist inconsistencies in the relationship between blood lipid profiles and the progression of renal function, while the majority of research on RC in the kidney are cross-sectional studies examining its association with renal function (18–21). There is a lack of research investigating the association between RC and renal function, as well as its progression in patients with T2DM-related CKD through prospective studies. Therefore, the aim of this study was to investigate the relationship between RCand renal function through a cross-sectional analysis. Additionally, we aimed to explore the impact of RCon renal function progression through a prospective study, and compare with that of common lipid profiles, providing a foundation for lipid management in T2DM-related CKD patients to delay renal function progression.
Methods
Study populations
Patients aged 18 and above with T2DM-related CKD were selected from the Chu Hsien-I Memorial Hospital of Tianjin Medical University between January 2014 and August 2021. The exclusion criteria used were: patients with (i) type 1 or other specific types of diabetes; (ii) acute kidney injury or end-stage renal disease; (iii) primary kidney disease or secondary kidney diseases caused by vasculitis, lupus, hypertension, or polycystic kidney disease; (iv) abnormalities in liver function tests (an alanine aminotransferase (ALT) or aspartate aminotransferase (AST) levels 2.5 times higher than normal), hepatitis B or hepatitis C infection; (v) endocrine metabolic diseases, such as Cushing’s syndrome or hyperthyroidism; (vi) complications, such as diabetic ketoacidosis and hyperosmolar hyperglycemia, hypoglycemia (fasting blood glucose<4 mmol/L), or other acute metabolic disorders; (vii) serious diseases, such as acute cardiovascular and cerebrovascular events, malignant tumors, hematological diseases, immune dysfunction, organ transplantation, or severe infections; (viii) using steroids and immunosuppressants within 6 months before enrollment; (ix) pregnancy or a malignancy. A total of 15,075 participants were initially enrolled in the study. After further screening, patients with missing data on triglycerides (TG), total cholesterol (TC), high-density lipoprotein cholesterol (HDL-C), low-density lipoprotein cholesterol (LDL-C), estimated glomerular filtration rate (eGFR), gender or other key information were excluded. The detailed screening procedure for participants is shown in Figure 1. The study was approved by the Ethics Committee of Tianjin Medical University Chu Hsien-I Memorial Hospital and adhered to the principles of the Helsinki Declaration of 1964.
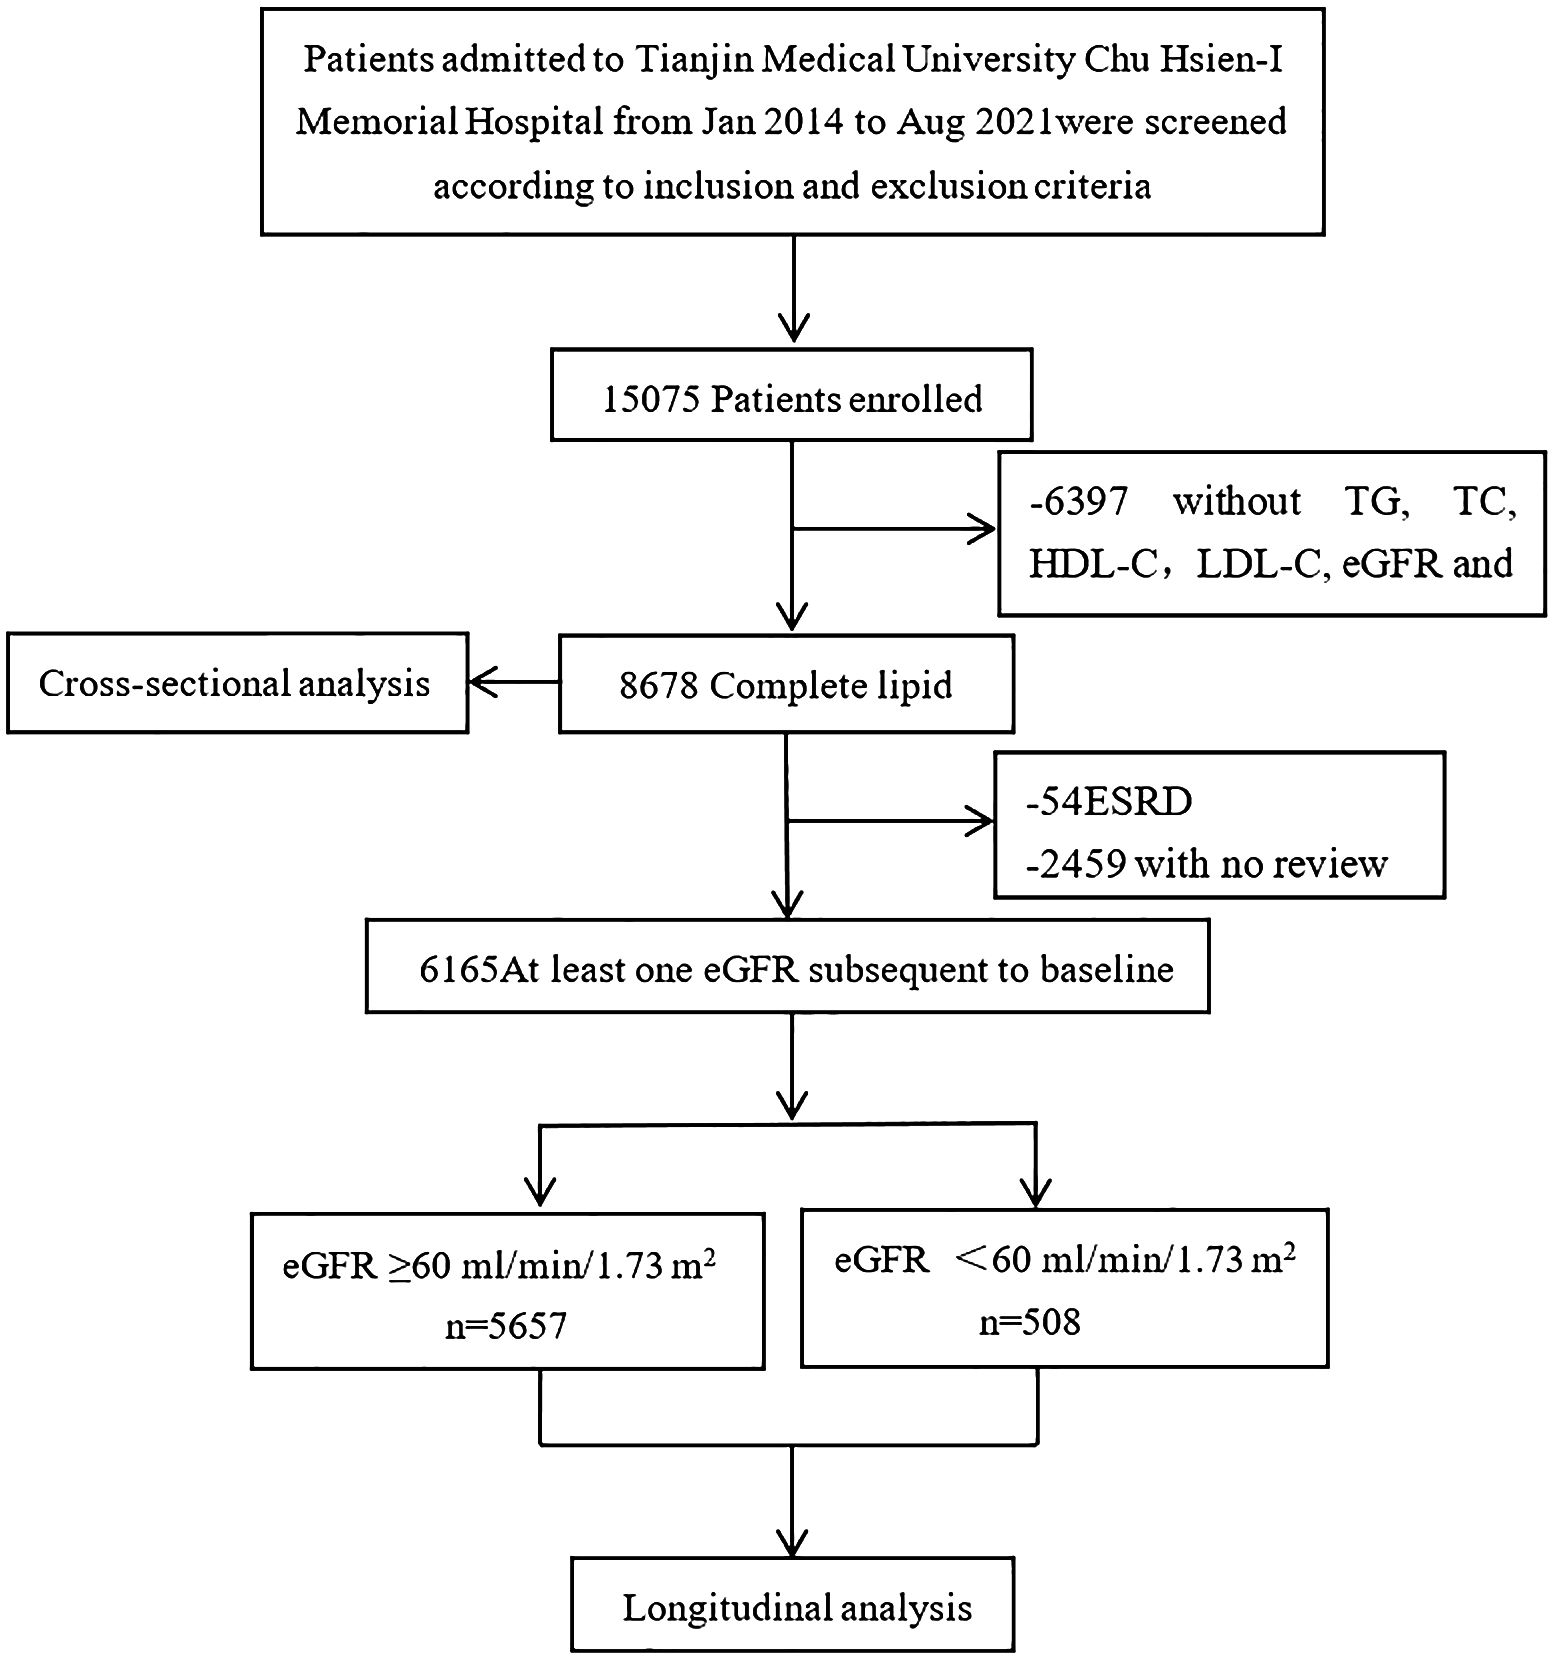
Figure 1 Flow chart of subject selection for this study.
Data collection and laboratory assays
Height, weight, and blood pressure were obtained through medical examination. Weight in kilograms was divided by height squared in meters to calculate the body mass index (BMI). Information on the use of lipid-lowering drugs, ACEI/ARB antihypertensive drugs, sodium-glucose cotransporter-2 inhibitors (SGLT2i), and glucagon-like peptide-1 receptor agonists (GLP1RA) hypoglycemic agents was collected through consultations. Laboratory tests including white blood cell count (WBC), hemoglobin (HGB), platelet count (PLT), glycosylated hemoglobin (HbA1c), fasting blood glucose (FBG), liver function (AST, ALT), renal function (serum uric acid (SUA), blood urea nitrogen (BUN), and serum creatinine (SCR)), and lipid profiles (LDL-C, HDL-C, TG, TC), 24-hours total urine protein (24hTP), and urinary albumin-to-creatinine ratio (UACR) were conducted through laboratory tests. Blood samples were collected in the morning after an 8-hour fasting period, while urine samples were collected in the early morning and 24-hours the day before. At the Clinical Laboratory Center of Tianjin Medical University Chu Hsien-I Memorial Hospital, all samples were performed. The eGFR (mL/min/1.73m²) was calculated using chronic kidney disease epidemiology collaboration (CKD-EPI) formula. The RC was calculated using the formula: RC (mmol/L) = TC (mmol/L) - HDL-C(mmol/L) - LDL-C(mmol/L) (22, 23).
Definition of covariates
The renal composite endpoint event was defined as a 30% decrease in eGFR from baseline, progression to eGFR<60ml/min/1.73m2 (for patients with eGFR≥60mL/min/1.73m2 at baseline) or ESRD (eGFR<15ml/min/1.73m2). Rapid progression of renal function was defined as a mean annual decline in eGFR>5ml/min/1.73m2.
Statistical analysis
Baseline data for continuous variables are presented as mean ± standard deviation (SD) if they were approximately normally distributed and median and interquartile range (IQR) if they were skewed. Categorical variables were presented as a number (percentage). Baseline characteristics were compared among groups stratified by eGFR levels using ANOVA or Kruskal-Wallis tests for continuous variables, and chi-square (χ2) tests for categorical variables. An analysis of the relationship between lipid profiles, including RC, and eGFR was carried out using a multivariate linear regression model. The association between lipid profiles and renal composite endpoint events was examined using Cox proportional hazards regression models (results presented as hazard ratios (HRs) and 95% confidence interval (95% CI)). The relationship between lipid profiles and rapid progression of renal function was analyzed using logistic regression model (results presented as odds ratios (ORs) and 95% CI). The dose-response relationship between lipid profiles and renal function progression was analyzed using restricted cubic spline (RCS) curves. Furthermore, we conducted subgroup analyzes to identify potential factors that could impact the stability of the findings.
Statistical analyses were performed using SPSS 24.0 software (SPSS Inc., Chicago, IL, USA), R version 4.2.1 (www.r-project.org) and GraphPad Prism version 8.0 software (San Diego, CA, USA). P-value<0.05 were considered statistically significant.
Results
Baseline characteristics
A total of 8,678 patients were included in the cross-sectional study. Clinical characteristics stratified by baseline eGFR level are presented in Table 1. The mean age was 59.56 ± 9.97 years, including 4,970 males (57.27%, age 58.20 ± 10.51 years) and 3,708 females (42.73%, age 61.38 ± 8.88 years). Patients with lower eGFR had a higher SBP, WBC, ACR, 24hTP, BUN, SCR, SUA, RC and TG, and lower HGB, FBG, ALT, AST, HDL-C, SGLT2i and GLP-1RA hypoglycemic drug use. The differences were significant (P<0.05).
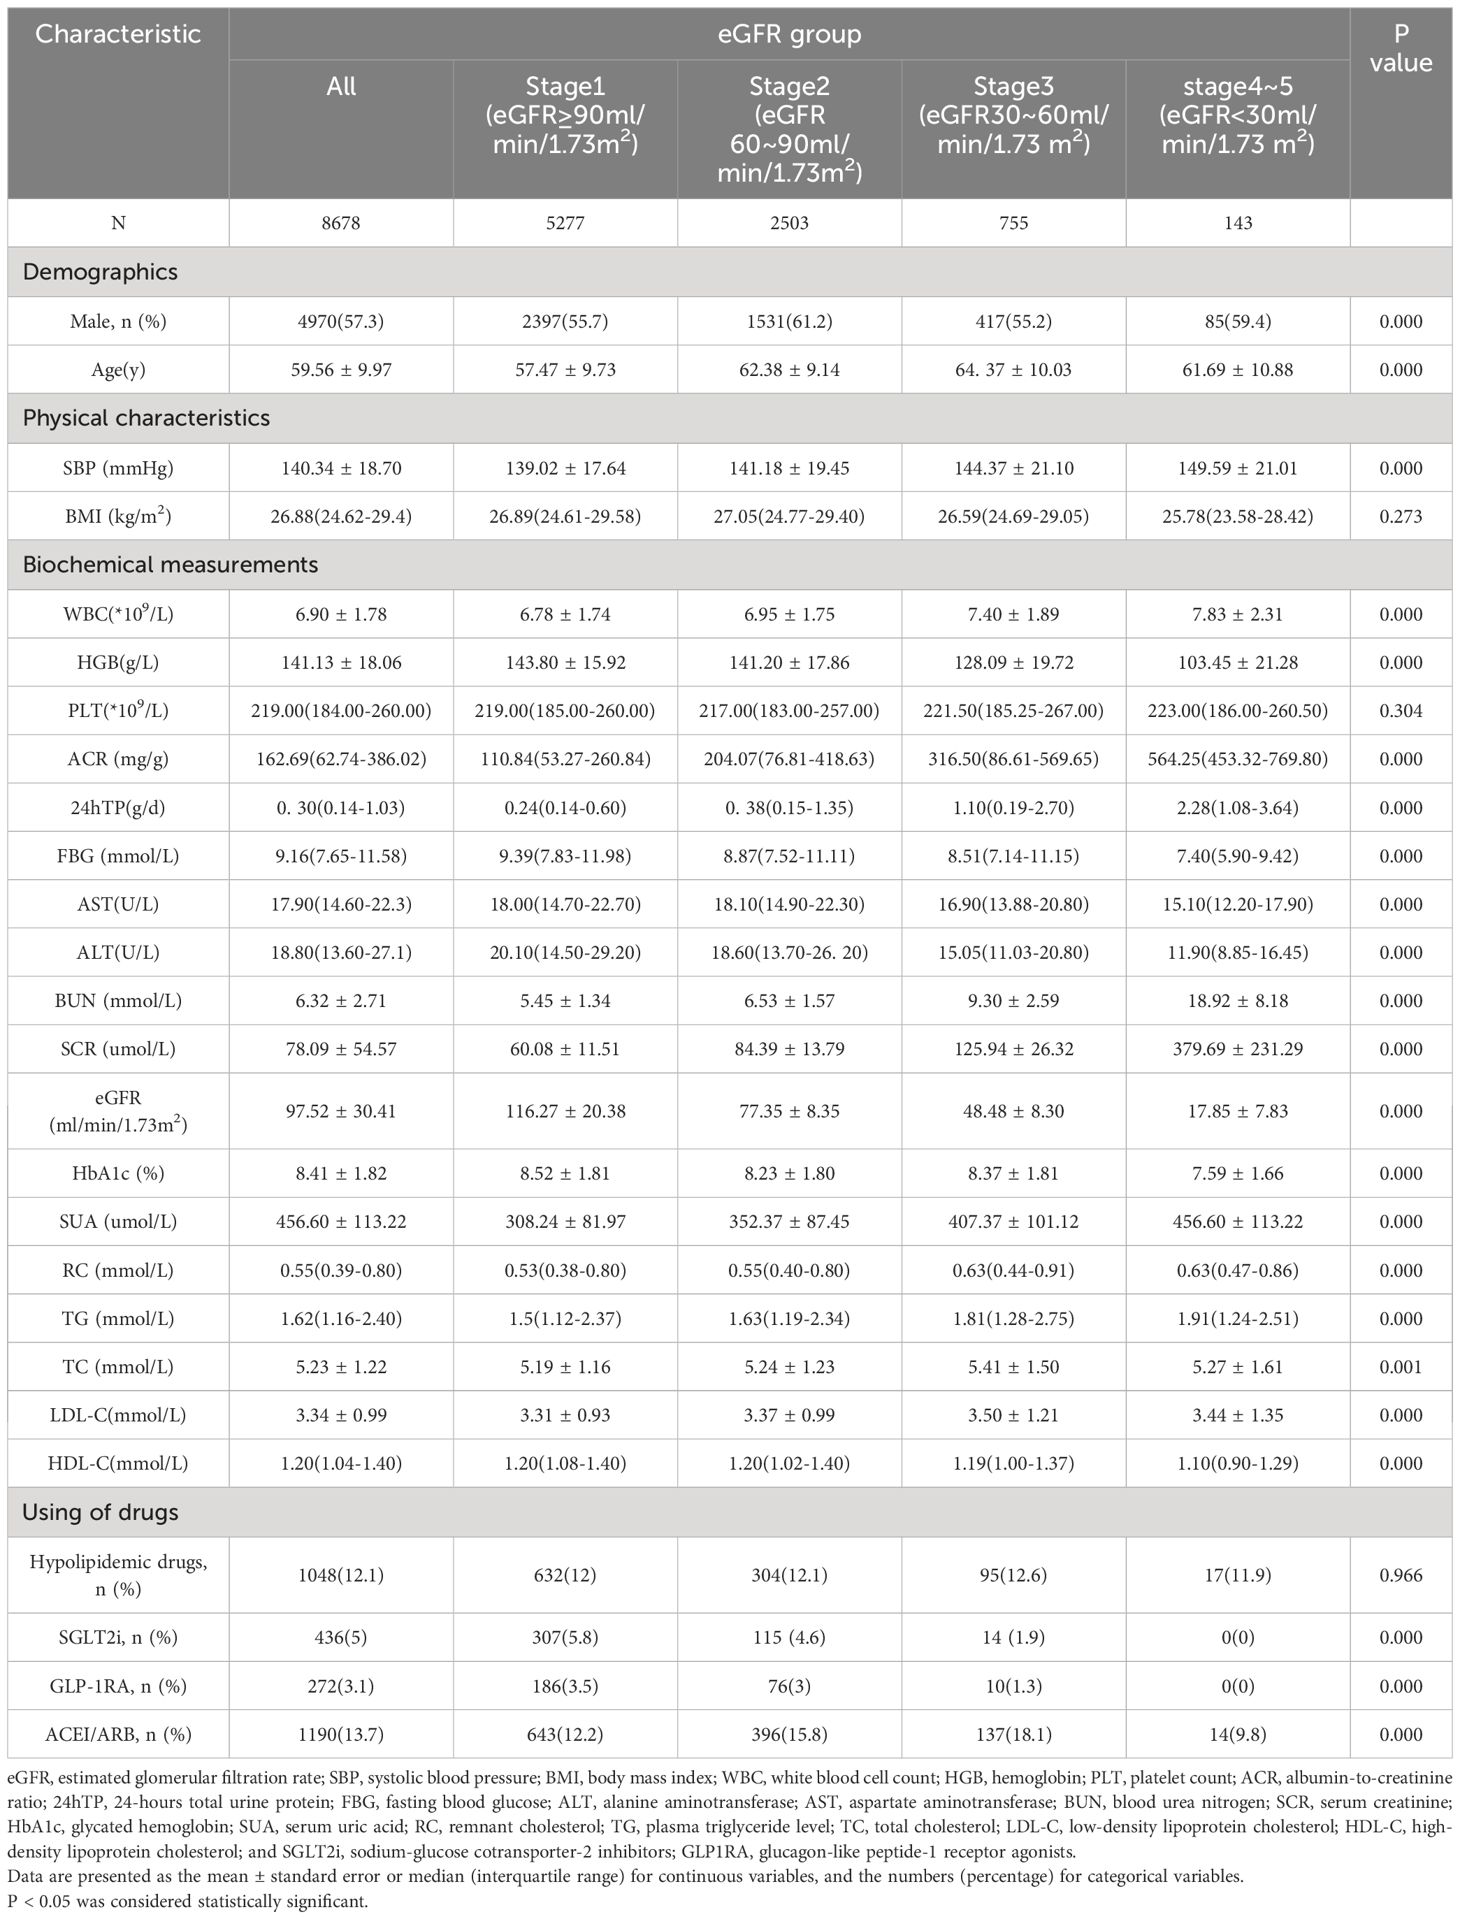
Table 1 Baseline characteristics of the populations stratified by baseline eGFR levels.
Relationship between lipid profiles, including RC, and baseline eGFR
Table 2 reveals the relationship between lipid profiles, including RC, and baseline eGFR. The results showed that each SD increase in RC, TC and LDL-C was significantly associated with a lower baseline eGFR (β=-1.48, β=-1.17, β=-1.59, respectively), while each SD increase in HDL-C was associated with a higher baseline eGFR (β=2.03) (all P<0.05). After adjusting for confounding factors, baseline eGFR was still significantly correlated with RC (β=-2.51, P=0.001), TC (β=-2.12, P=0.004), LDL-C (β=-1.89, P=0.007) and HDL-C (β=1.86, P=0.022).
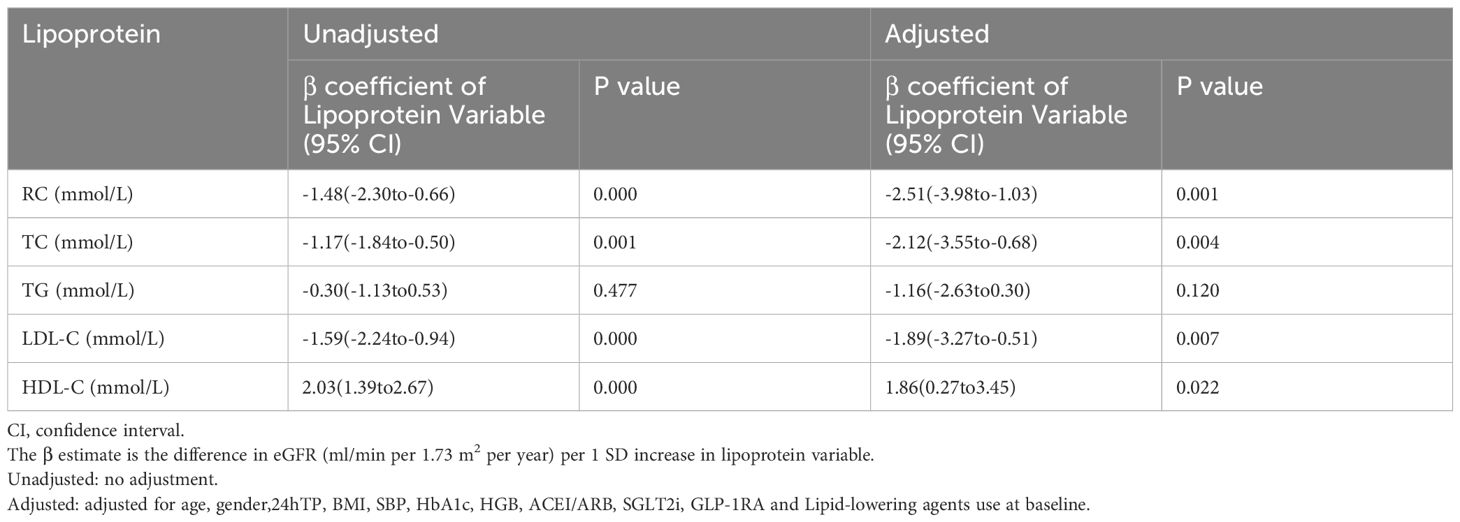
Table 2 The relationship between lipid profiles and the baseline eGFR.
Relationship between lipid profiles, including RC, and the progression of renal function
A total of 6,165 patients with at least one recorded follow-up of eGFR were included in the prospective analysis. At a median follow-up of 36 months, 1,513 patients (24.54%) reached a renal composite endpoint event, while 1,704 patients (27.64%) showed rapid progression of renal function event.
Table 3 presents the association between lipid profiles and the risk of renal composite endpoint event. Although elevated RC, TC, TG, LDL-C and HDL-C levels were all associated with the risk of renal composite endpoint event in the unadjusted model (all P<0.05). After adjusting for confounding factors, only RC, TC and TG could independently predict the renal composite endpoint event, with HRs (95% CIs) of 1.17 (1.03, 1.33),1.14 (1.01, 1.29), and 1.16 (1.02, 1.32), respectively (all P<0.05).
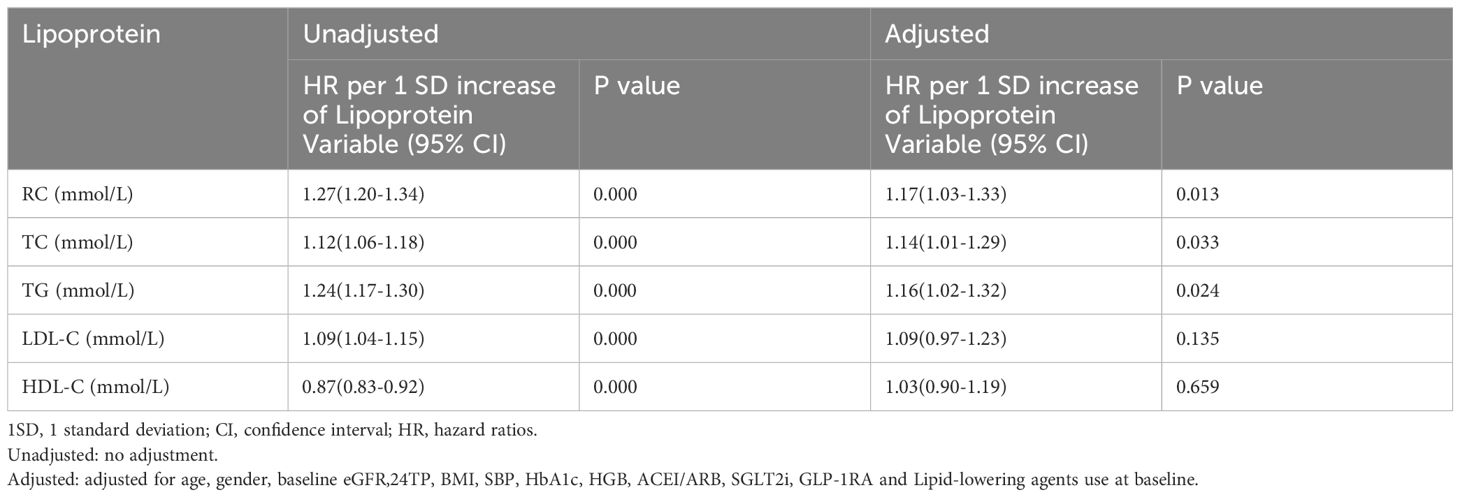
Table 3 The relationship between lipid profiles and the renal composite endpoint event.
Table 4 shows the association between lipid profiles and the risk of rapid progression of renal function. After adjusting for covariates, only RC and HDL-C could independently predict the occurrence of rapid progression of renal function, with ORs (95% CIs) of 1.17 (1.01, 1.37) and 0.88 (0.70, 0.99), respectively (P<0.05).
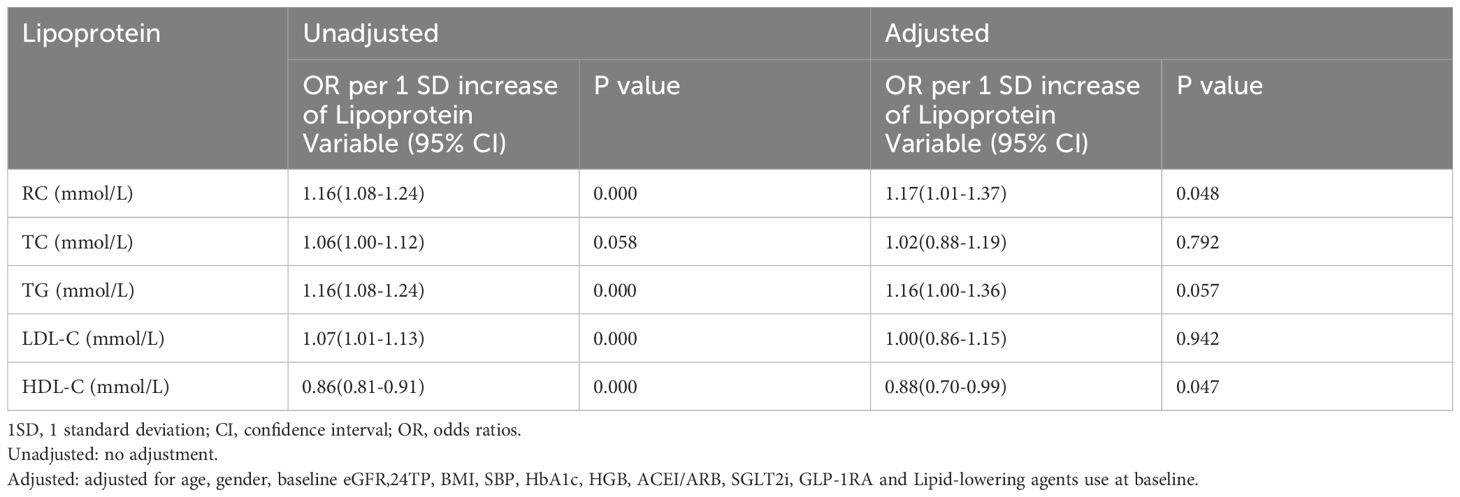
Table 4 The relationship between lipid profiles and the rapid progression of renal function.
Dose-response relationship of blood lipid profiles and the risk of progression of renal function
The RCS curve analyses revealed that RC, TC and TG were linearly positively correlated with the risk of renal composite endpoint event (nonlinear P>0.05) after controlling for confounders, and the cut-off points were 0.56mmol/L, 5.21mmol/L and 1.65mmol/L, respectively (Figures 2A–C, respectively).
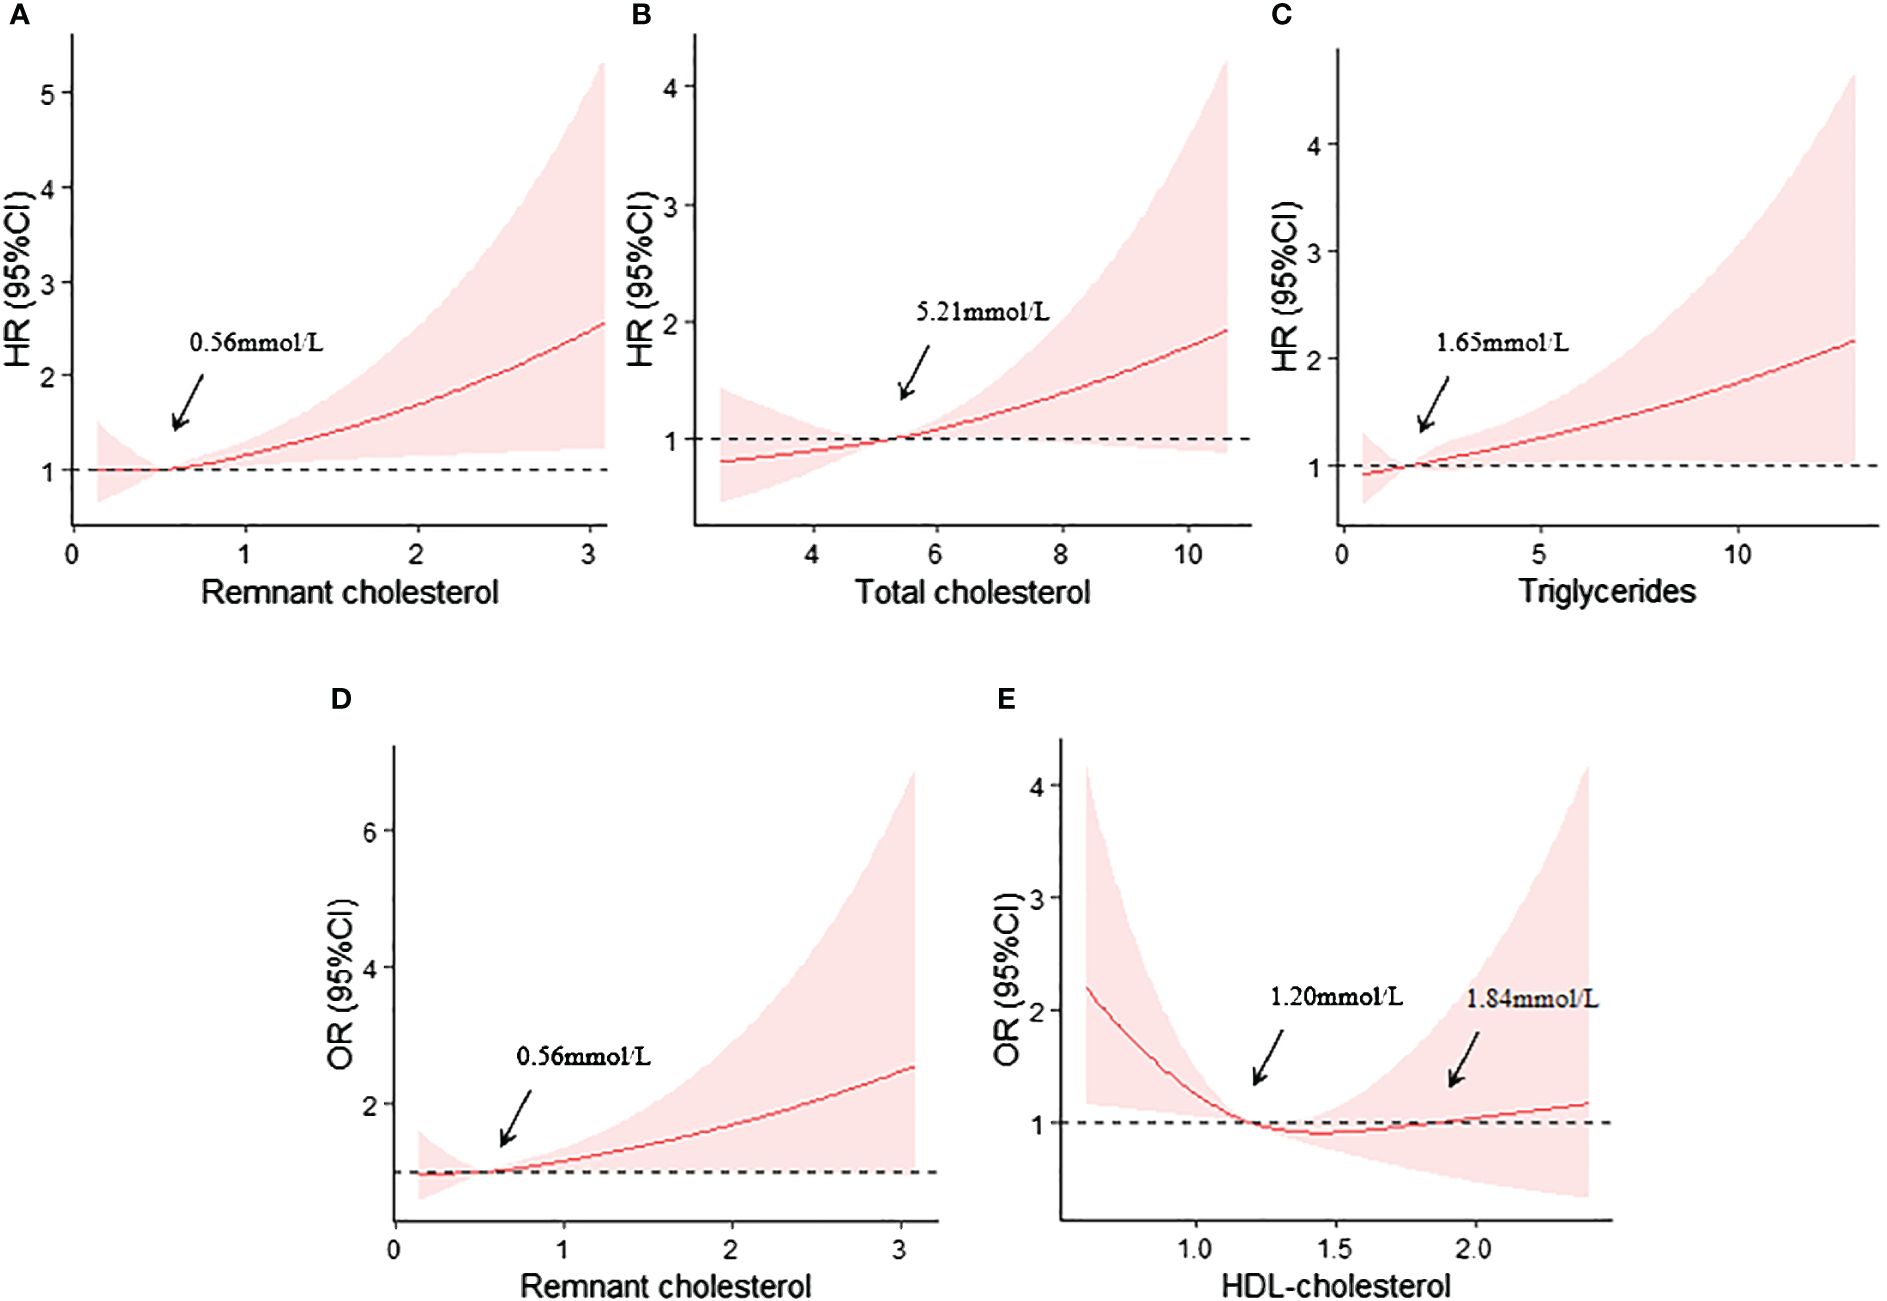
Figure 2 (A) Restricted cubic spline curves analyses of RC and the renal composite endpoint event; (B) Restricted cubic spline curves analyses of TC and the renal composite endpoint event; (C) Restricted cubic spline curves analyses of TG and the renal composite endpoint event; (D) Restricted cubic spline curves analyses of RC and the rapid progression of renal function; (E) Restricted cubic spline curves analyses of HDL-C and the rapid progression of renal function. All adjusted for age, gender, baseline eGFR,24TP, BMI, SBP, HbA1c, HGB, ACEI/ARB, SGLT2i, GLP-1RA and Lipid-lowering agents use at baseline.
Similarly, RC also exhibited a linearly positively correlation with the risk of rapid progression of renal function (nonlinear P>0.05), with a cut-off point of approximately 0.56mmol/L (Figure 2D). However, HDL-C level showed a U-shaped relationship with the risk of rapid progression of renal function. The cut-off points were 1.20mmol and 1.84mmol (Figure 2E).
Subgroup analyses
We further explored the relationships between the lipid profiles that were independently associated with the progression of renal function and corresponding renal outcomes, stratified by age, sex, BMI, 24hTP, SBP and HbA1c. No significant heterogeneity was observed (all P for interaction>0.05) in the relationship between RC and the risk of renal composite endpoint event and rapid progression of renal function (Figures 3A, D). Similarly, the relationship between TG and the risk of the renal composite endpoint was stable across all subgroups (Figure 3C).
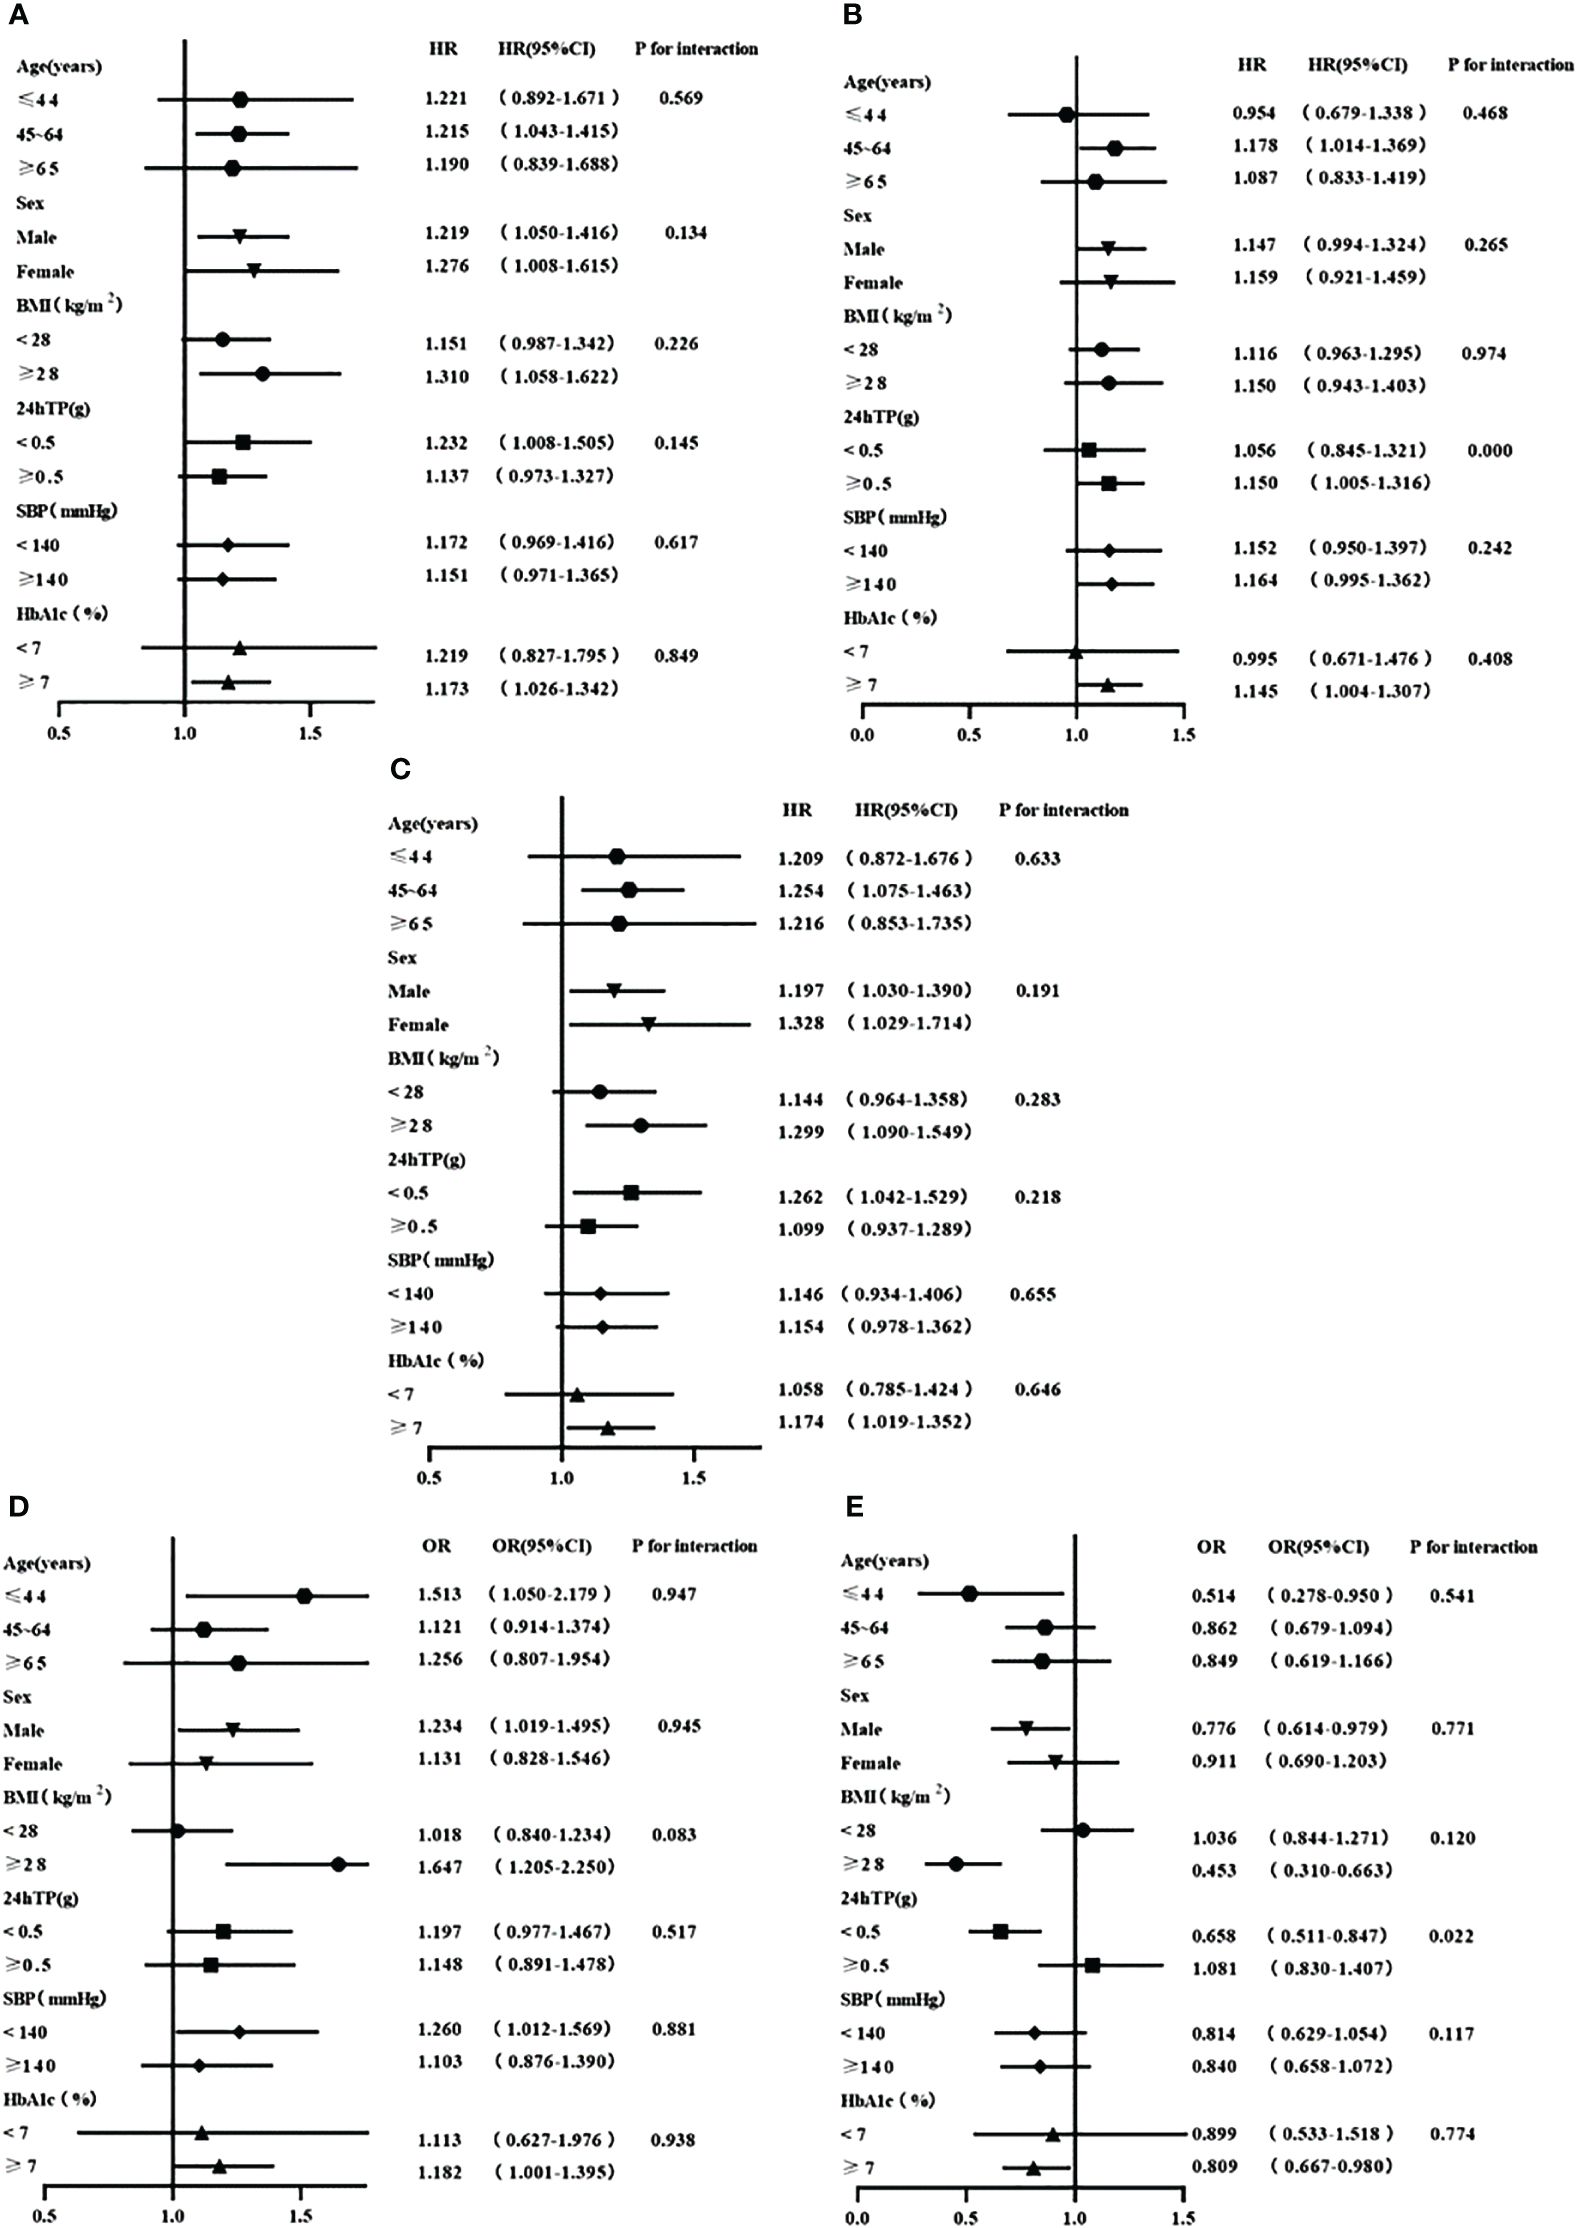
Figure 3 (A) Stratified analyses of the relationship between RC and the renal composite endpoint event; (B) Stratified analyses of the relationship between TC and the renal composite endpoint event; (C) Stratified analyses of the relationship between TG and the renal composite endpoint event; (D) Stratified analyses of the relationship between RC and the rapid progression of renal function; (E) Stratified analyses of the relationship between HDL-C and the rapid progression of renal function. All adjusted for age, gender, baseline eGFR,24TP, BMI, SBP, HbA1c, HGB, ACEI/ARB, SGLT2i, GLP-1RA and Lipid-lowering agents use at baseline.
In the subgroup analysis examining the association between TC and the risk of renal composite endpoint event, we found that TC level was associated with the risk of a renal composite endpoint only among patients with proteinuria≥0.5g/d (P=0.000 for interaction, HR 95%CI, 1.150 (1.005, 1.316)) (Figure 3B). However, the association between HDL-C and the risk of rapid progression of renal function existed only in patients with proteinuria<0.5g/d (P=0.022 for interaction, HR 95%CI, 0.658 (0.511, 0.847)) (Figure 3E).
Discussion
In patients with T2DM-related CKD, our study not only found that RC, TC, and LDL-C were negatively correlated with baseline eGFR, while HDL-C was positively correlated with baseline eGFR, but also demonstrated an independent association between RC and the risk of renal composite endpoint event as well as rapid progression of renal function. TG was found to be associated with the risk of renal composite endpoint event. The relationships observed were linear and robust. Additionally, our results showed significant linear relationship between TC and the risk of renal composite endpoint event only among patients with proteinuria≥0.5g/d, while a U-shape relationship between HDL-C and the risk of rapid progression of renal function only in patients with proteinuria<0.5g/d in the prospective cohort analysis. More importantly, our study revealed the optimal management value of lipid profiles to prevent the progression of renal function.
The negative association between RC and baseline eGFR is supported by previous studies conducted on patients with non-diabetic related CKD (21). One explanation may be that RC is cholesterol contained in triglyceride-rich lipoproteins. Studies have shown that the production of triglyceride-rich lipoproteins is increased and the clearance is decreased in CKD patients (24). Another explanation may be its composition, as studies have revealed that VLDL clearance from the circulation and conversion to IDL is also impaired in CKD patients due to reduced expression of VLDL receptors in adipocytes and muscle cells (25). Moreover, the metabolism, structure and post-translational modification of postprandial lipoproteins and triglyceride-rich lipoproteins are changed in CKD patients (26). In addition, the increased production and decreased metabolism of chylomicrons due to insulin resistance in T2DM may also contribute to the elevated RC levels (27). However, further in-depth studies are needed to explore the specific mechanisms underlying RC increase in T2DM-related CKD.
Our study provides novel evidence that elevated RC levels were associated with an increased risk of renal composite endpoint event and rapid progression of renal function in T2DM-related CKD patients. The mechanism underlying this relationship is not fully understood. It may be that elevated RC concentrations not only contribute to atherosclerosis similar to LDL-C (28, 29), but also promote systemic low-grade inflammation (30). Furthermore, studies have shown that RC can enhance the expression of adhesion molecules, coagulation factors, and inflammatory proteins in endothelial cells, leading to monocyte recruitment and attachment, and promote foam cell formation (31). Animal studies has also demonstrated a link between atherogenic lipid profiles and endothelial dysfunction and glomerulosclerosis (32).
We found that TG was associated with the risk of renal composite endpoint event in patients with T2DM-related CKD, while the relationship between TG levels and renal function progression in previous studies are inconsistent (33–35). Comparative analysis suggests that in patients with DM or massive proteinuria, TG may have a certain correlation with renal function, whereas dyslipidemia alone may not be sufficient to cause renal damage in individuals without DM or massive proteinuria. However, in patients with DM or massive proteinuria, typical metabolic disorders may contribute to the lipotoxic effects on the microvascular bed, which are necessary for the progression of renal function (34).
Consistent with previous studies (36, 37), our findings indicate that low levels of HDL-C increase the risk of rapid progression of kidney function in patients with T2DM-related CKD. However, no correlation was found between HDL-C and progression of renal function in some studies, which were carried out in populations with an overall eGFR lower than 60mL/min/1.73m2 (36, 38). The reason maybe that the protective functions of HDL-C affected due to toxins, inflammation and other environmental factors in these populations (39). Studies have also demonstrated that under conditions of inflammation and oxidative stress, HDL-C may not only be dysfunctional, but can also convert antioxidant and anti-inflammatory substances into pro-oxidant and pro-inflammatory particles (40, 41).
The most clinically relevant finding in our study was that the risk of renal function progression was significantly increased in T2DM-related CKD patients when RC, TC and TG levels exceeded 0.56mmol/L, 5.21mmol/L and 1.65mmol/L, respectively, and these cut-off values align with the lipid level control targets recommended in the Chinese guidelines for diagnosis and treatment of diabetic kidney disease (2021) (42). Additionally, our study revealed a U-shaped relationship between HDL-C and rapid progression of renal function in T2DM-related CKD patients, which was consistent with previous studies conducted on kidney and heart disease (37, 43). When HDL-C levels were lower than 1.20mmol/L or higher than 1.84mmol/L, the risk of rapid progression of renal function increased. The reason may be that although HDL-C has anti-oxidation, anti-inflammation and anti-thrombosis effects (44, 45), high HDL-C levels paradoxically promote senescence, weaken endothelial progenitor cell tube formation, and impair angiogenesis (46).
Subgroup analysis showed that HDL-C loses its protective effect on rapid progression of renal function in patients with proteinuria≥0.5g/d. This may be due to the fact that the protective effect of HDL-C depends not only on its circulating concentration but also on the “qualitative” characteristics of HDL-C particles (47). Increased concentration of advanced glycation end products in patients with diabetes and kidney disease impairs the antioxidant capacity of HDL-C (48). Similar to the interaction between TC and urine protein found in previous studies (36), our research also found that TC levels were associated with the risk of renal composite endpoint event only in patients with proteinuria≥0.5g/d. It may be that proteinuria not only causes dyslipidemia, but also promotes the progression of kidney disease (49, 50), and that this interaction makes the relationship between TC and the occurrence of renal function progression more obvious in individuals with high proteinuria concentrations.
Our study has several strengths. Firstly, we explored the association of lipid profiles, especially RC, and renal function as well as its progression in T2DM-related CKD patients for the first time using a comprehensive design that includes cross-sectional and prospective analysis. Furthermore, we revealed the optimal lipid profile management value. Secondly, we adjusted for potential confounders and performed a robust analysis.
However, there are some limitations to acknowledge. Firstly, RC values were calculated rather than directly measured, and there may be some deviations between the actual and calculated values. Nevertheless, calculated RC values are valid and have been widely used in large Danish cohort studies (22, 23). Secondly, study populations were T2DM-related CKD patients, and the application of the findings of this study to other populations needs further validation. Thirdly, this is an observational study and as such, the causal relationship between the lipid profiles and progression of renal function could not be confirmed.
Conclusions
In summary, in T2DM-related CKD populations, RC, TC and LDL-C levels were negatively correlated with renal function, while HDL-C levels were positively correlated with renal function. However, only RC was an independent risk factor for both renal composite endpoint event and rapid progression of renal function event. Maintaining RC levels below 0.56mmol/L can reduce the risk of progression of renal function. Further research is needed to validate these results in other cohorts and elucidate the underlying mechanisms driving the relationship.
Data availability statement
The original contributions presented in the study are included in the article/supplementary material, further inquiries can be directed to the corresponding author/s.
Ethics statement
The studies involving humans were approved by the ethics committee of Tianjin Chu Hsien-l Memorial Hospital. The studies were conducted in accordance with the local legislation and institutional requirements. The ethics committee/institutional review board waived the requirement of written informed consent for participation from the participants or the participants’ legal guardians/next of kin because the data were anonymous and observational.
Author contributions
QL: Data curation, Formal analysis, Methodology, Writing – original draft, Writing – review & editing. TW: Formal analysis, Writing – review & editing. XS: Formal analysis, Writing – review & editing. XF: Writing – review & editing. YL: Writing – review & editing. ZC: Formal analysis, Writing – review & editing. HL: Writing – review & editing. SZ: Writing – review & editing. PY: Formal analysis, Funding acquisition, Methodology, Writing – review & editing.
Funding
The author(s) declare financial support was received for the research, authorship, and/or publication of this article. This study was supported by research grants as follows: 1. First Level Leading Talent Project of “123 Climbing Plan” for Clinical Talents of Tianjin Medical University. 2.”Tianjin Medical Talents” project, the second batch of high-level talents selection project in health industry in Tianjin, No.TJSJMYXYC-D2-014. 3. Key Project of Natural Science Foundation of Tianjin, No.22JCZDJC00590. 4. Scientific Research Funding of Tianjin Medical University Chu Hsien-I Memorial Hospital, No.ZXY-ZDSYSZD-1. 5. Tianjin Science and Technology Major Special Project and Engineering Public Health Science and Technology Major Special Project, No.21ZXGWSY00100. 6. Tianjin Key Medical Discipline (Specialty) Construct Project No. TJYXZDXK-032A.
Acknowledgments
The authors thank all subjects who took part in this study and work hard to ensure the reliability and accuracy of data.
Conflict of interest
The authors declare that the research was conducted in the absence of any commercial or financial relationships that could be construed as a potential conflict of interest.
Publisher’s note
All claims expressed in this article are solely those of the authors and do not necessarily represent those of their affiliated organizations, or those of the publisher, the editors and the reviewers. Any product that may be evaluated in this article, or claim that may be made by its manufacturer, is not guaranteed or endorsed by the publisher.
References
1. Tuttle KR, Wong L, St Peter W, Roberts G, Rangaswami J, Mottl A, et al. Moving from evidence to implementation of breakthrough therapies for diabetic kidney disease. Clin J Am Soc Nephrol. (2022) 17:1092–103. doi: 10.2215/CJN.02980322
2. Ma RCW. Epidemiology of diabetes and diabetic complications in China. Diabetologia. (2018) 61:1249–60. doi: 10.1007/s00125-018-4557-7
3. Alicic RZ, Rooney MT, Tuttle KR. Diabetic kidney disease. Clin J Am Soc Nephrology. (2017) 12:2032–45. doi: 10.2215/CJN.11491116
4. Xie Y, Bowe B, Mokdad AH, Xian H, Yan Y, Li T, et al. Analysis of the Global Burden of Disease study highlights the global, regional, and national trends of chronic kidney disease epidemiology from 1990 to 2016. Kidney Int. (2018) 94:567–81. doi: 10.1016/j.kint.2018.04.011
5. Collaboration GBDCKD. Global, regional, and national burden of chronic kidney disease, 1990-2017: a systematic analysis for the Global Burden of Disease Study 2017. Lancet. (2020) 395:709–33. doi: 10.1016/S0140-6736(20)30045-3
6. Zhang L, Long J, Jiang W, Shi Y, He X, Zhou Z, et al. Trends in chronic kidney disease in China. N Engl J Med. (2016) 375:905–6. doi: 10.1056/NEJMc1602469
7. Pan X, Lin X, Huang X, Xu J, Ye L, Zhang T, et al. The burden of diabetes-related chronic kidney disease in China from 1990 to 2019. Front Endocrinol (Lausanne). (2022) 13:892860. doi: 10.3389/fendo.2022.892860
8. Yang C, Wang H, Zhao X, Matsushita K, Coresh J, Zhang L, et al. CKD in China: evolving spectrum and public health implications. Am J Kidney Dis. (2020) 76:258–64. doi: 10.1053/j.ajkd.2019.05.032
9. Doucet J, Le Floch JP, Bauduceau B, Verny C, Intergroup SS. GERODIAB: Glycaemic control and 5-year morbidity/mortality of type 2 diabetic patients aged 70 years and older: 1. Description of the population at inclusion. Diabetes Metab. (2012) 38:523–30. doi: 10.1016/j.diabet.2012.07.001
10. Speer T, Ridker PM, von Eckardstein A, Schunk SJ, Fliser D. Lipoproteins in chronic kidney disease: from bench to bedside. Eur Heart J. (2021) 42:2170–85. doi: 10.1093/eurheartj/ehaa1050
11. Kaysen GA. New insights into lipid metabolism in chronic kidney disease. J Renal Nutr. (2011) 21:120–3. doi: 10.1053/j.jrn.2010.10.017
12. Hirano T, Satoh N, Kodera R, Hirashima T, Suzuki N, Aoki E, et al. Dyslipidemia in diabetic kidney disease classified by proteinuria and renal dysfunction: A cross-sectional study from a regional diabetes cohort. J Diabetes Investig. (2022) 13:657–67. doi: 10.1111/jdi.13697
13. Stadler K, Goldberg IJ, Susztak K. The evolving understanding of the contribution of lipid metabolism to diabetic kidney disease. Curr Diabetes Rep. (2015) 15:40. doi: 10.1007/s11892-015-0611-8
14. Castaner O, Pinto X, Subirana I, Amor AJ, Ros E, Hernaez A, et al. Remnant cholesterol, not LDL cholesterol, is associated with incident cardiovascular disease. J Am Coll Cardiol. (2020) 76:2712–24. doi: 10.1016/j.jacc.2020.10.008
15. Miller YI, Choi SH, Fang L, Tsimikas S. Lipoprotein modification and macrophage uptake: role of pathologic cholesterol transport in atherogenesis. Subcell Biochem. (2010) 51:229–51. doi: 10.1007/978-90-481-8622-8
16. Shin HK, Kim YK, Kim KY, Lee JH, Hong KW. Remnant lipoprotein particles induce apoptosis in endothelial cells by NAD(P)H oxidase-mediated production of superoxide and cytokines via lectin-like oxidized low-density lipoprotein receptor-1 activation: prevention by cilostazol. Circulation. (2004) 109:1022–8. doi: 10.1161/01.CIR.0000117403.64398.53
17. Olufadi R, Byrne CD. Effects of VLDL and remnant particles on platelets. Pathophysiol Haemost Thromb. (2006) 35:281–91. doi: 10.1159/000093221
18. Yan P, Xu Y, Miao Y, Bai X, Wu Y, Tang Q, et al. Association of remnant cholesterol with chronic kidney disease in middle-aged and elderly Chinese: a population-based study. Acta Diabetol. (2021) 58:1615–25. doi: 10.1007/s00592-021-01765-z
19. Li B, Wang A, Wang Y, Li L, Li B, Yang Z, et al. A study on the correlation between remnant cholesterol and urinary albumin to creatinine ratio in Chinese community adults: A report from the REACTION study. J Diabetes. (2020) 12:870–80. doi: 10.1111/1753-0407.13076
20. Hayashi T, Hirano T, Taira T, Tokuno A, Mori Y, Koba S, et al. Remarkable increase of apolipoprotein B48 level in diabetic patients with end-stage renal disease. Atherosclerosis. (2008) 197:154–8. doi: 10.1016/j.atherosclerosis.2007.03.015
21. Bermudez-Lopez M, Forne C, Amigo N, Bozic M, Arroyo D, Bretones T, et al. An in-depth analysis shows a hidden atherogenic lipoprotein profile in non-diabetic chronic kidney disease patients. Expert Opin Ther Targets. (2019) 23:619–30. doi: 10.1080/14728222.2019.1620206
22. Varbo A, Freiberg JJ, Nordestgaard BG. Extreme nonfasting remnant cholesterol vs extreme LDL cholesterol as contributors to cardiovascular disease and all-cause mortality in 90000 individuals from the general population. Clin Chem. (2015) 61:533–43. doi: 10.1373/clinchem.2014.234146
23. Varbo A, Benn M, Tybjærg-Hansen A, Jørgensen AB, Frikke-Schmidt R, Nordestgaard BG. Remnant cholesterol as a causal risk factor for ischemic heart disease. J Am Coll Cardiol. (2013) 61:427–36. doi: 10.1016/j.jacc.2012.08.1026
24. Chan DT, Dogra GK, Irish AB, Ooi EM, Barrett PH, Chan DC, et al. Chronic kidney disease delays VLDL-apoB-100 particle catabolism: potential role of apolipoprotein C-III. J Lipid Res. (2009) 50:2524–31. doi: 10.1194/jlr.P900003-JLR200
25. Vaziri ND. Dyslipidemia of chronic renal failure: the nature, mechanisms, and potential consequences. Am J Physiol Renal Physiol. (2006) 290:F262–72. doi: 10.1152/ajprenal.00099.2005
26. Ferro CJ, Mark PB, Kanbay M, Sarafidis P, Heine GH, Rossignol P, et al. Lipid management in patients with chronic kidney disease. Nat Rev Nephrol. (2018) 14:727–49. doi: 10.1038/s41581-018-0072-9
27. Xiao C, Dash S, Morgantini C, Lewis GF. New and emerging regulators of intestinal lipoprotein secretion. Atherosclerosis. (2014) 233:608–15. doi: 10.1016/j.atherosclerosis.2013.12.047
28. Delialis D, Georgiopoulos G, Aivalioti E, Mavraganis G, Dimopoulou AM, Sianis A, et al. Remnant cholesterol and atherosclerotic disease in high cardiovascular risk patients. Beyond LDL cholesterol and hypolipidemic treatment. Hellenic J Cardiol. (2022) 66:26–31. doi: 10.1016/j.hjc.2022.05.011
29. Nordestgaard BG, Varbo A. Triglycerides and cardiovascular disease. Lancet. (2014) 384:626–35. doi: 10.1016/S0140-6736(14)61177-6
30. Varbo A, Benn M, Tybjaerg-Hansen A, Nordestgaard BG. Elevated remnant cholesterol causes both low-grade inflammation and ischemic heart disease, whereas elevated low-density lipoprotein cholesterol causes ischemic heart disease without inflammation. Circulation. (2013) 128:1298–309. doi: 10.1161/CIRCULATIONAHA.113.003008
31. Miller M, Stone NJ, Ballantyne C, Bittner V, Criqui MH, Ginsberg HN, et al. Triglycerides and cardiovascular disease. Circulation. (2011) 123:2292–333. doi: 10.1161/CIR.0b013e3182160726
32. Chen HC, Guh JY, Shin SJ, Lai YH. Pravastatin suppress superoxide and fibronectin production of glomerular mesangial cells induced by oxidized-LDL and high glucose. Atherosclerosis. (2002) 160:141–6. doi: 10.1016/S0021-9150(01)00545-7
33. Chawla V, Greene T, Beck GJ, Kusek JW, Collins AJ, Sarnak MJ, et al. Hyperlipidemia and long-term outcomes in nondiabetic chronic kidney disease. Clin J Am Soc Nephrol. (2010) 5:1582–7. doi: 10.2215/CJN.01450210
34. Russo GT, De Cosmo S, Viazzi F, Pacilli A, Ceriello A, Genovese S, et al. Plasma triglycerides and HDL-C levels predict the development of diabetic kidney disease in subjects with type 2 diabetes: the AMD annals initiative. Diabetes Care. (2016) 39:2278–87. doi: 10.2337/dc16-1246
35. Syrjanen J, Mustonen J, Pasternack A. Hypertriglyceridaemia and hyperuricaemia are risk factors for progression of IgA nephropathy. Nephrol Dial Transplant. (2000) 15:34–42. doi: 10.1093/ndt/15.1.34
36. Rahman M, Yang W, Akkina S, Alper A, Anderson AH, Appel LJ, et al. Relation of serum lipids and lipoproteins with progression of CKD: The CRIC study. Clin J Am Soc Nephrol. (2014) 9:1190–8. doi: 10.2215/CJN.09320913
37. Bowe B, Xie Y, Xian H, Balasubramanian S, Al-Aly Z. Low levels of high-density lipoprotein cholesterol increase the risk of incident kidney disease and its progression. Kidney Int. (2016) 89:886–96. doi: 10.1016/j.kint.2015.12.034
38. Samuelsson O, Mulec H, Knight-Gibson C, Attman PO, Kron B, Larsson R, et al. Lipoprotein abnormalities are associated with increased rate of progression of human chronic renal insufficiency. Nephrol Dial Transplant. (1997) 12:1908–15. doi: 10.1093/ndt/12.9.1908
39. Thobani A, Jacobson TA. Dyslipidemia in patients with kidney disease. Cardiol Clin. (2021) 39:353–63. doi: 10.1016/j.ccl.2021.04.008
40. Zheng C, Aikawa M. High-density lipoproteins: from function to therapy. J Am Coll Cardiol. (2012) 60:2380–3. doi: 10.1016/j.jacc.2012.08.999
41. Moradi H, Vaziri ND, Kashyap ML, Said HM, Kalantar-Zadeh K. Role of HDL dysfunction in end-stage renal disease: a double-edged sword. J Ren Nutr. (2013) 23:203–6. doi: 10.1053/j.jrn.2013.01.022
42. jianghua C. Chinese guidelines for diagnosis and treatment of diabetic kidney disease. Chin J Nephrol. (2021) 37:255–304.
43. Moradi H, Streja E, Kashyap ML, Vaziri ND, Fonarow GC, Kalantar-Zadeh K. Elevated high-density lipoprotein cholesterol and cardiovascular mortality in maintenance hemodialysis patients. Nephrol Dial Transplant. (2014) 29:1554–62. doi: 10.1093/ndt/gfu022
44. Davidson MH, Toth PP. High-density lipoprotein metabolism: potential therapeutic targets. Am J Cardiol. (2007) 100:n32–40. doi: 10.1016/j.amjcard.2007.08.011
45. Feig JE, Shamir R, Fisher EA. Atheroprotective effects of HDL: beyond reverse cholesterol transport. Curr Drug Targets. (2008) 9:196–203. doi: 10.2174/138945008783755557
46. Huang CY, Lin FY, Shih CM, Au HK, Chang YJ, Nakagami H, et al. Moderate to high concentrations of high-density lipoprotein from healthy subjects paradoxically impair human endothelial progenitor cells and related angiogenesis by activating Rho-associated kinase pathways. Arterioscler Thromb Vasc Biol. (2012) 32:2405–17. doi: 10.1161/ATVBAHA.112.248617
47. Asztalos BF, Demissie S, Cupples LA, Collins D, Cox CE, Horvath KV, et al. LpA-I, lpA-I:A-II HDL and CHD-risk: the framingham offspring study and the veterans affairs HDL intervention trial. Atherosclerosis. (2006) 188:59–67. doi: 10.1016/j.atherosclerosis.2005.10.018
48. Zhou H, Tan KC, Shiu SW, Wong Y. Increased serum advanced glycation end products are associated with impairment in HDL antioxidative capacity in diabetic nephropathy. Nephrol Dial Transplant. (2008) 23:927–33. doi: 10.1093/ndt/gfm631
49. Abbate M, Zoja C, Remuzzi G. How does proteinuria cause progressive renal damage? J Am Soc Nephrol. (2006) 17:2974–84. doi: 10.1681/ASN.2006040377
Keywords: remnant cholesterol, renal function, renal function progression, type 2 diabetes, chronic kidney disease
Citation: Li Q, Wang T, Shao X, Fan X, Lin Y, Cui Z, Liu H, Zhou S and Yu P (2024) Association of remnant cholesterol with renal function and its progression in patients with type 2 diabetes related chronic kidney disease. Front. Endocrinol. 15:1331603. doi: 10.3389/fendo.2024.1331603
Received: 01 November 2023; Accepted: 19 June 2024;
Published: 04 July 2024.
Edited by:
Kofi Asiedu, University of Houston, United StatesCopyright © 2024 Li, Wang, Shao, Fan, Lin, Cui, Liu, Zhou and Yu. This is an open-access article distributed under the terms of the Creative Commons Attribution License (CC BY). The use, distribution or reproduction in other forums is permitted, provided the original author(s) and the copyright owner(s) are credited and that the original publication in this journal is cited, in accordance with accepted academic practice. No use, distribution or reproduction is permitted which does not comply with these terms.
*Correspondence: Pei Yu, eXVwZWlAdG11LmVkdS5jbg==
†ORCID: Pei Yu, orcid.org/0000-0001-6137-5824