 Zijun Gao
 Ke Liu
- Department of Laboratory Medicine, Traditional Chinese and Western Medicine Hospital of Wuhan, Tongji Medical College, Huazhong University of Science and Technology, Wuhan, China
Objectives: This study aimed to evaluate the relationship between systemic immune-inflammation index (SII) and sex hormones in children and adolescents aged 6–19 years.
Methods: Data were obtained from the National Health and Nutrition Examination Survey (NHANES) conducted between 2013 and 2016. Inclusion criteria comprised subjects aged 6–19 years with complete data on both SII and sex hormones. We employed weighted multiple regression analysis and subgroup analytical methods to independently estimate the relationship between SII and sex hormones.
Results: In this study, a total of 3767 participants were included, with an average age of 12.32 ± 3.95 years. Males constituted 50.54%, and females 49.46%. Among males, a statistically significant negative correlation emerged between SII and sex hormone-binding globulin (SHBG). Similarly, in the female population, SII exhibited a statistically significant negative correlation with total testosterone (TT), SHBG, and the Ratio of TT to estradiol, while maintaining a positive correlation with free androgen index (FAI). Subgroup analysis underscored variances in the association between sex hormones and SII within cohorts distinguished by pubertal status or different body mass index (BMI). In addition, the relationship between SII and estradiol exhibited nonlinearity. Employing a two-segment linear regression model, we identified an inverted U-shaped association between SII and estradiol, with an inflection point of 748.09 (1000cell/ml).
Conclusion: Our findings suggest that SII may be an independent risk factor for changes in sex hormones in both male and female children and adolescents. More prospective and experimental studies should be conducted to validate our results and elucidate the underlying molecular pathways.
1 Introduction
Sex hormones play a crucial role in the growth and functioning of diverse tissues, influencing various aspects of health and disease. Testosterone (TT) is crucial for diagnosing hypogonadism and other androgen disorders (1). Low circulating testosterone levels in males lead to hypogonadism, which is a common issue in male reproductive health and sexual behavior (2). In addition to male reproductive health and sexual behavior, androgens are also essential for female reproduction. Female androgen imbalance leads to polycystic ovary syndrome. Moreover, androgens are associated with the development and progression of prostate cancer, breast cancer, and ovarian cancer (3). Estradiol is a common form of serum and tissue estrogen in both males and females, with most estrogen in the blood coming from the aromatization of testosterone in peripheral organs. It is responsible for the development of female secondary sexual characteristics and participates in the regulation of the female reproductive cycle. Moreover, for males, estrogen is indispensable for the proper development of cortical bone and the maintenance of healthy bone metabolism throughout the aging process (4, 5). Sex hormone-binding globulin (SHBG) is predominantly biosynthesized within hepatic tissues. Testosterone and estradiol circulate in the bloodstream, and some bind to SHBG. As a result, SHBG participates in regulating testosterone and estradiol (6, 7). Accumulated studies indicate that sex hormones play a pivotal role in shaping the development and growth of children and adolescents, orchestrating crucial physiological processes during this stage of life. Disturbances in sex hormone balance can potentially lead to a significant disease burden (8). Consequently, the management of sex hormones in the pediatric and adolescent population holds paramount significance.
The Systemic Immune-Inflammation Index (SII) is a novel and stable inflammation biomarker reflecting both local immune responses and systemic inflammation (9, 10). It is calculated by multiplying the platelet count by the ratio of the neutrophil to the lymphocyte count, providing a valuable measure of inflammation. Initially proposed for prognostic evaluation in hepatocellular carcinoma (11), it has subsequently undergone widespread scrutiny across various neoplastic disorders (10).
Research suggests that sex hormones, including female hormones such as estrogen and progesterone, and male hormones like testosterone directly affect the function of immune cells and inflammatory responses (12). Generally, androgens appear to have anti-inflammatory effects, while estrogens tend to have pro-inflammatory effects (13). Through ERα signal transduction, estradiol inhibits the differentiation of Th1 and Th17 cells, providing a protective mechanism against experimental inflammation (14). A reciprocal association has been elucidated between testicular hormones and inflammatory markers, such as IL-6 and TNF-α (15). However, the relationship between SII and sex hormones in children and adolescents is not yet clear.
Thus, we employed a substantial dataset drawn from children and adolescents from the National Health and Nutrition Examination Survey (NHANES) to investigate the association between SII and sex hormones. This exploration holds the potential to yield novel insights into sex hormone management within clinical practice.
2 Methods
2.1 Study design and population
This study utilized data from NHANES, a series of cross-sectional surveys conducted by the Centers for Disease Control and Prevention, to assess the nutritional and health status of the U.S. population (16). NHANES is an ongoing U.S. national cross-sectional survey using a complex multi-stage sampling strategy, repeated on a two-year cycle. All NHANES data are publicly available at https://www.cdc.gov/nchs/nhanes/.
Considering that only the 2013–2014 and 2015–2016 survey cycles encompass complete data on SII and sex hormones, we elected to focus on these specific survey periods. Initially, our cohort comprised 20,146 participants. Following the exclusion of individuals aged less than 6 or greater than 19 years (14,695 individuals), those with missing SII data (991 individuals), and participants lacking data on sex hormones (639 individuals), we ultimately identified 3,767 eligible participants. The sample selection flowchart is depicted in Figure 1.
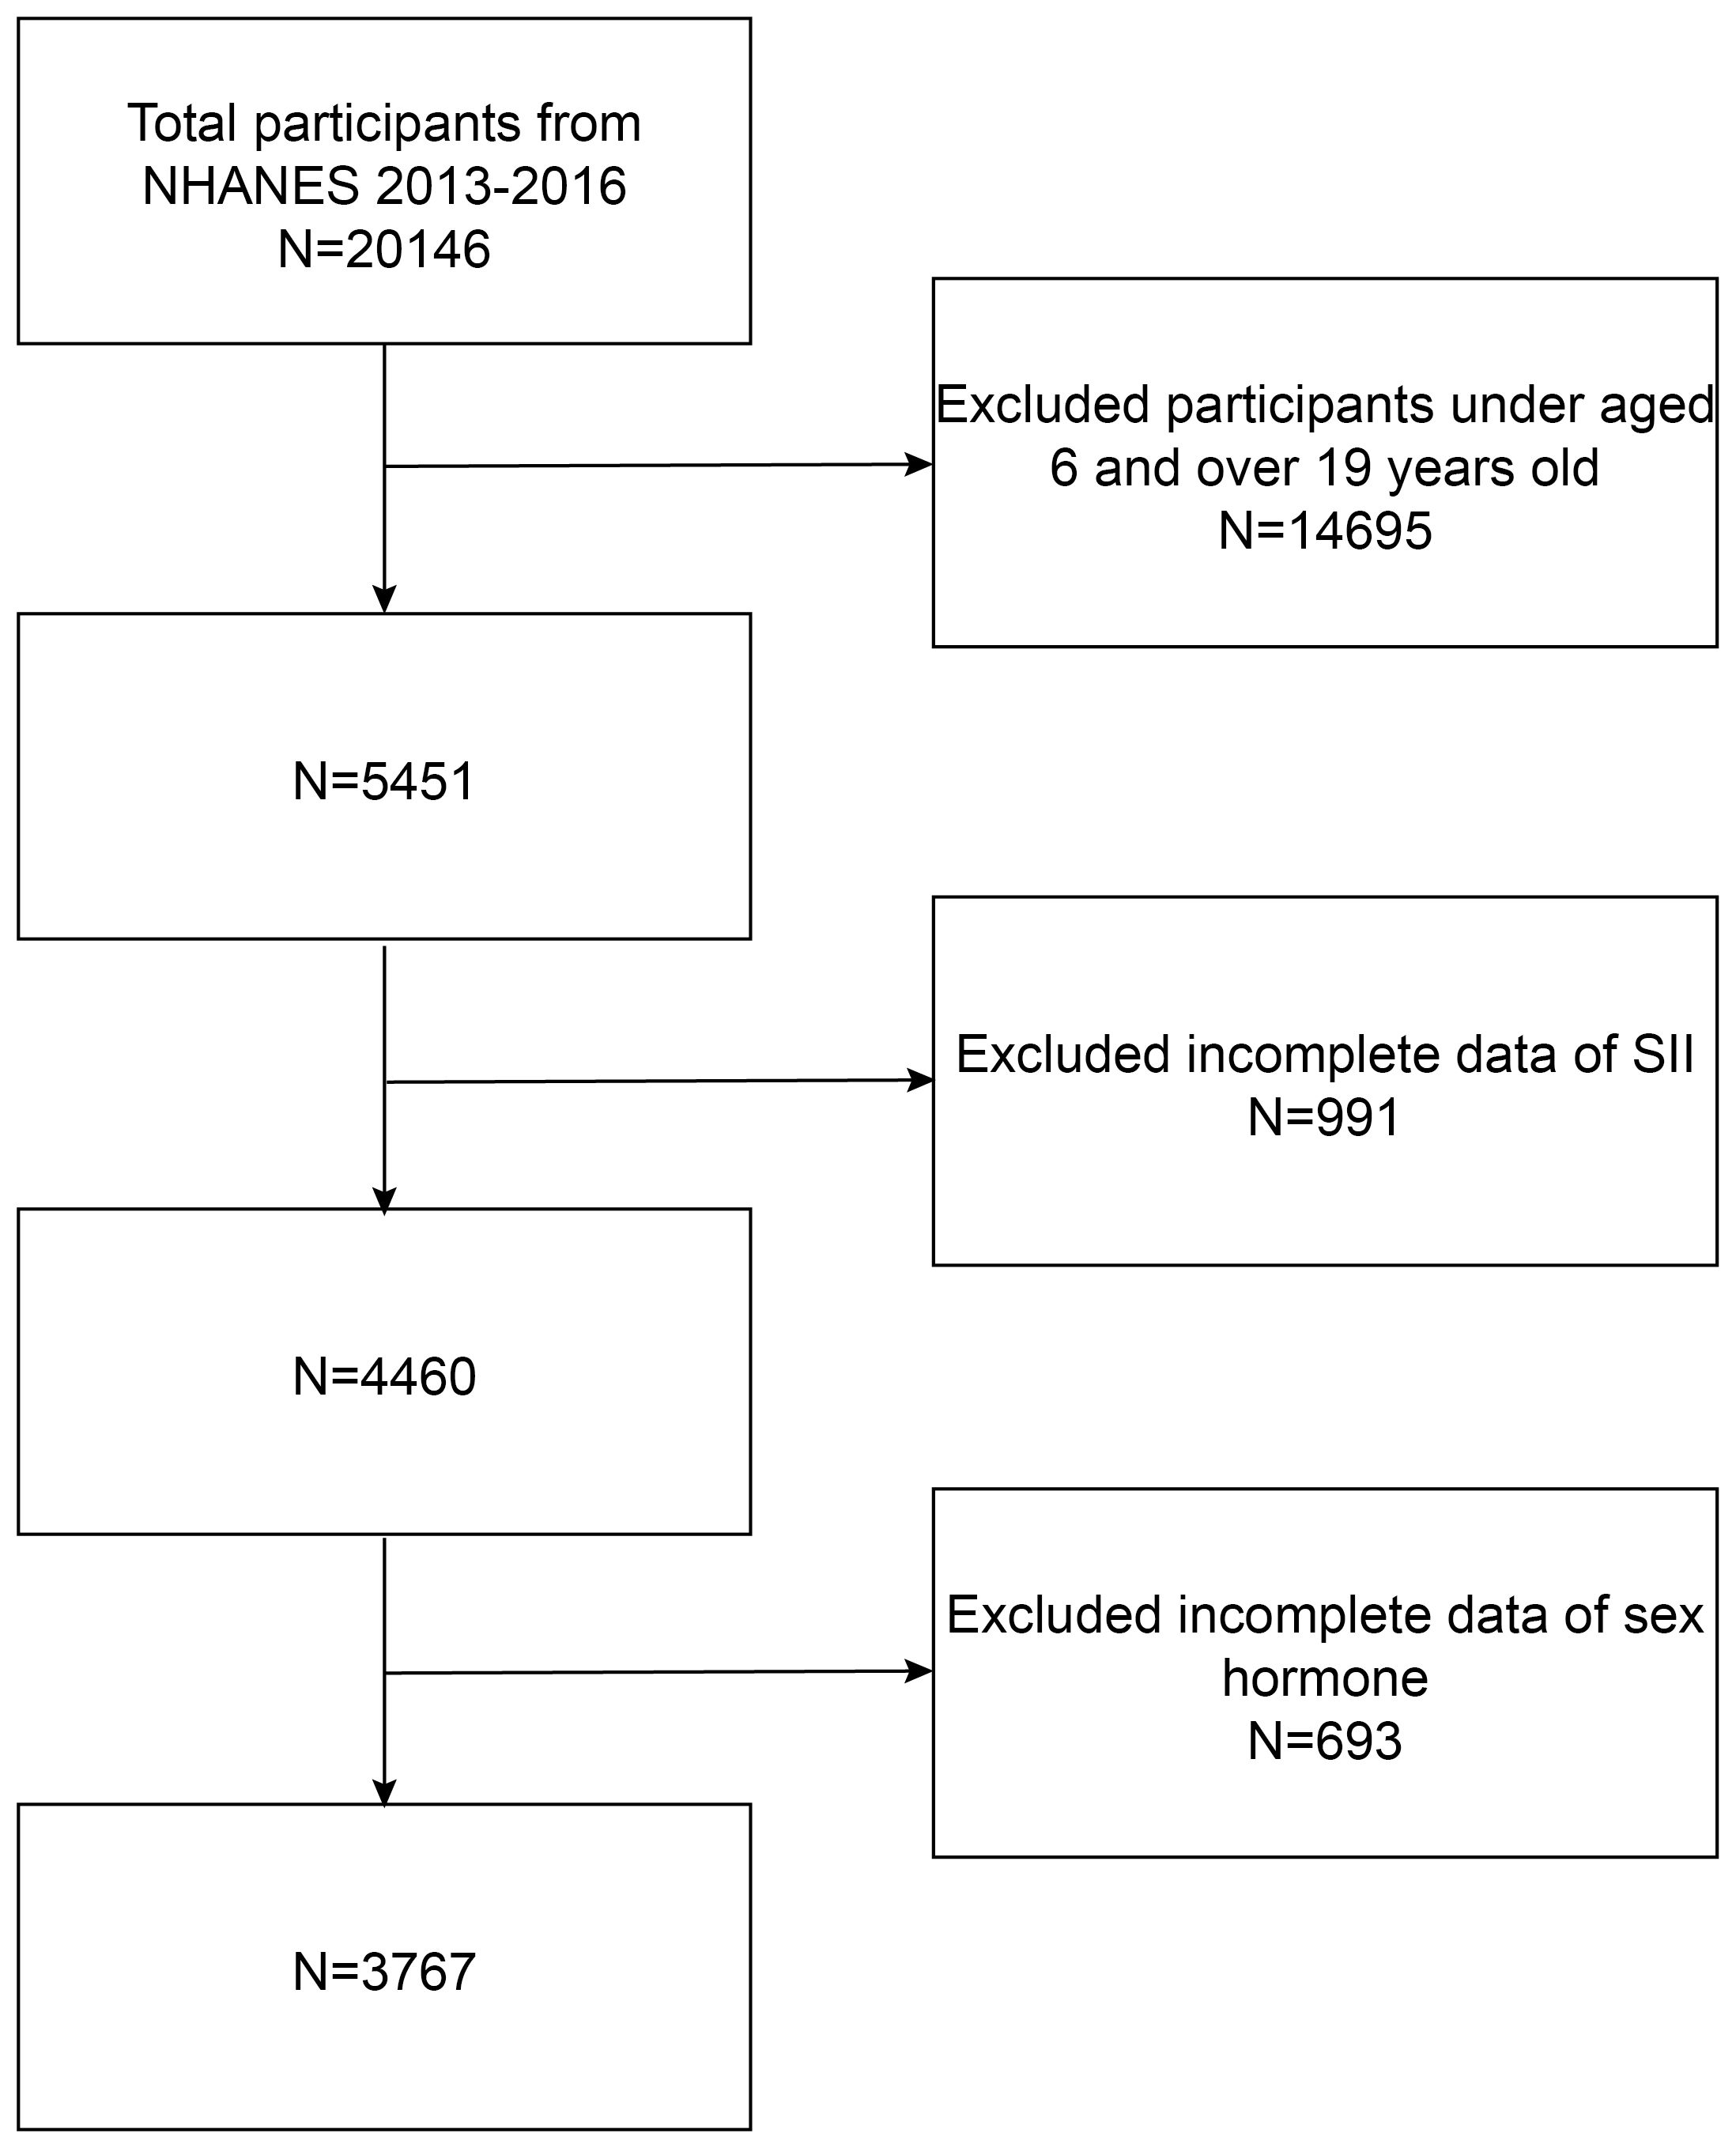
Figure 1 Flowchart of participant selection.
2.2 Exposure and outcome definition
The dependent variable in the current investigation was the systemic immunity-inflammation index, and the SII was designed as the exposure variable in our analysis. An automated hematology analysis device (Coulter®DxH 800 analyzer) was used to calculate whole blood counts of lymphocytes, neutrophils, and platelets, which were expressed as 103 cells/mL. SII was calculated by platelet count × neutrophil count/lymphocyte count (11, 17).
Prior to transportation to the National Center for Environmental Health for testing, serum specimens were stored at -20°C. Serum TT and estradiol concentrations were determined using isotope dilution high-performance liquid chromatography tandem mass spectrometry (ID-LC-MS/MS). In contrast, SHBG concentrations were determined through the reaction of SHBG with immune antibodies and chemiluminescence measurements of reaction products using photomultiplier tubes. Furthermore, we also calculated the Free Androgen Index (FAI), which is the value of TT (ng/dL) divided by SHBG (nmol/L) and the ratio of TT to estradiol. These were used to determine the approximate levels of circulating free testosterone and aromatase activity (18, 19).
2.3 Covariates
As demographic variables in our model, we incorporated age, gender, race, poverty income ratio (PIR), body mass index (BMI, kg/m2), educational level, and diabetes. Serum cotinine (ng/mL), a biomarker indicating exposure to tobacco smoke, was also incorporated. Considering the variations in sex hormone concentrations across different seasons and blood sampling times, we included variables for the six-month time period and venipuncture timing (morning, afternoon, and evening) as covariates (20). Furthermore, we divided BMI into three categories: normal weight (<25 kg/m2), overweight (≥25 kg/m2-<30 kg/m2) and obese (≥30 kg/m2).
To account for the differing conditions between children and adolescents, we categorized individuals aged 6–11 years and 12–19 years as children and adolescents, respectively, based on prior research (21, 22). However, categorizing participants aged 6–19 solely based on age into subgroups of children and adolescents may conflate prepubescent and adolescent individuals. This amalgamation could lead to aberrantly high or low hormone levels within each subgroup, potentially distorting the association between SII and sex hormones in regression analyses. Furthermore, the impact of SII on sex hormones may vary depending on the pubertal status. To address this issue, we further stratified participants into pubertal and prepubertal groups based on serum sex hormone levels and the onset of menstruation. Males with a TT level of 50 ng/dL or higher and Females with an estradiol level of 20 pg/mL or higher are classified as the pubertal group. All others are categorized as the prepubertal group (21).
2.4 Statistical analysis
In this investigation, continuous variables were presented as mean ± standard deviation, and categorical variables were delineated as proportions. Disparities among distinct SII groups (tertiles) were assessed using chi-square tests for categorical variables and t-tests for continuous variables. To scrutinize the association between SII and sex hormones, three models were devised to examine sex hormones as continuous variables. In model 1, no adjustment for covariates was made. Model 2 was adjusted for age and race. Model 3 was adjusted for age, race, PIR, BMI, education level, seasons and time of venipuncture, serum cotinine, diabetes, and pubertal status. The statistical study used the statistical computing and graphing software R (version 4.2.1) and EmpowerStats (version 2.0). Smooth curve fitting was performed simultaneously by adjusting for variables. A threshold effects analysis model was used to investigate the relationship and inflection points between SII and sex hormones. Finally, the same statistical study methods described above were performed for BMI, diabetes, and pubertal status subgroups. P<0.05 was determined to be statistically significant.
3 Results
3.1 Baseline characteristics of participants
This investigation enrolled a cohort of 3,767 participants, adhering to predefined inclusion and exclusion criteria. The clinical characteristics of the participants, stratified by gender, are comprehensively outlined in Table 1. The mean age of the participants was 12.32 ± 3.95 years, with males constituting 50.54% and females comprising 49.46% of the cohort. The racial/ethnic distribution was as follows: 24.56% Mexican Americans, 12.42% other Hispanic Americans, 26.28% non-Hispanic whites, 21.64% non-Hispanic black people, and 15.10% other racial/ethnic groups. 57.98% male and 31.51% female reached pubertal status.
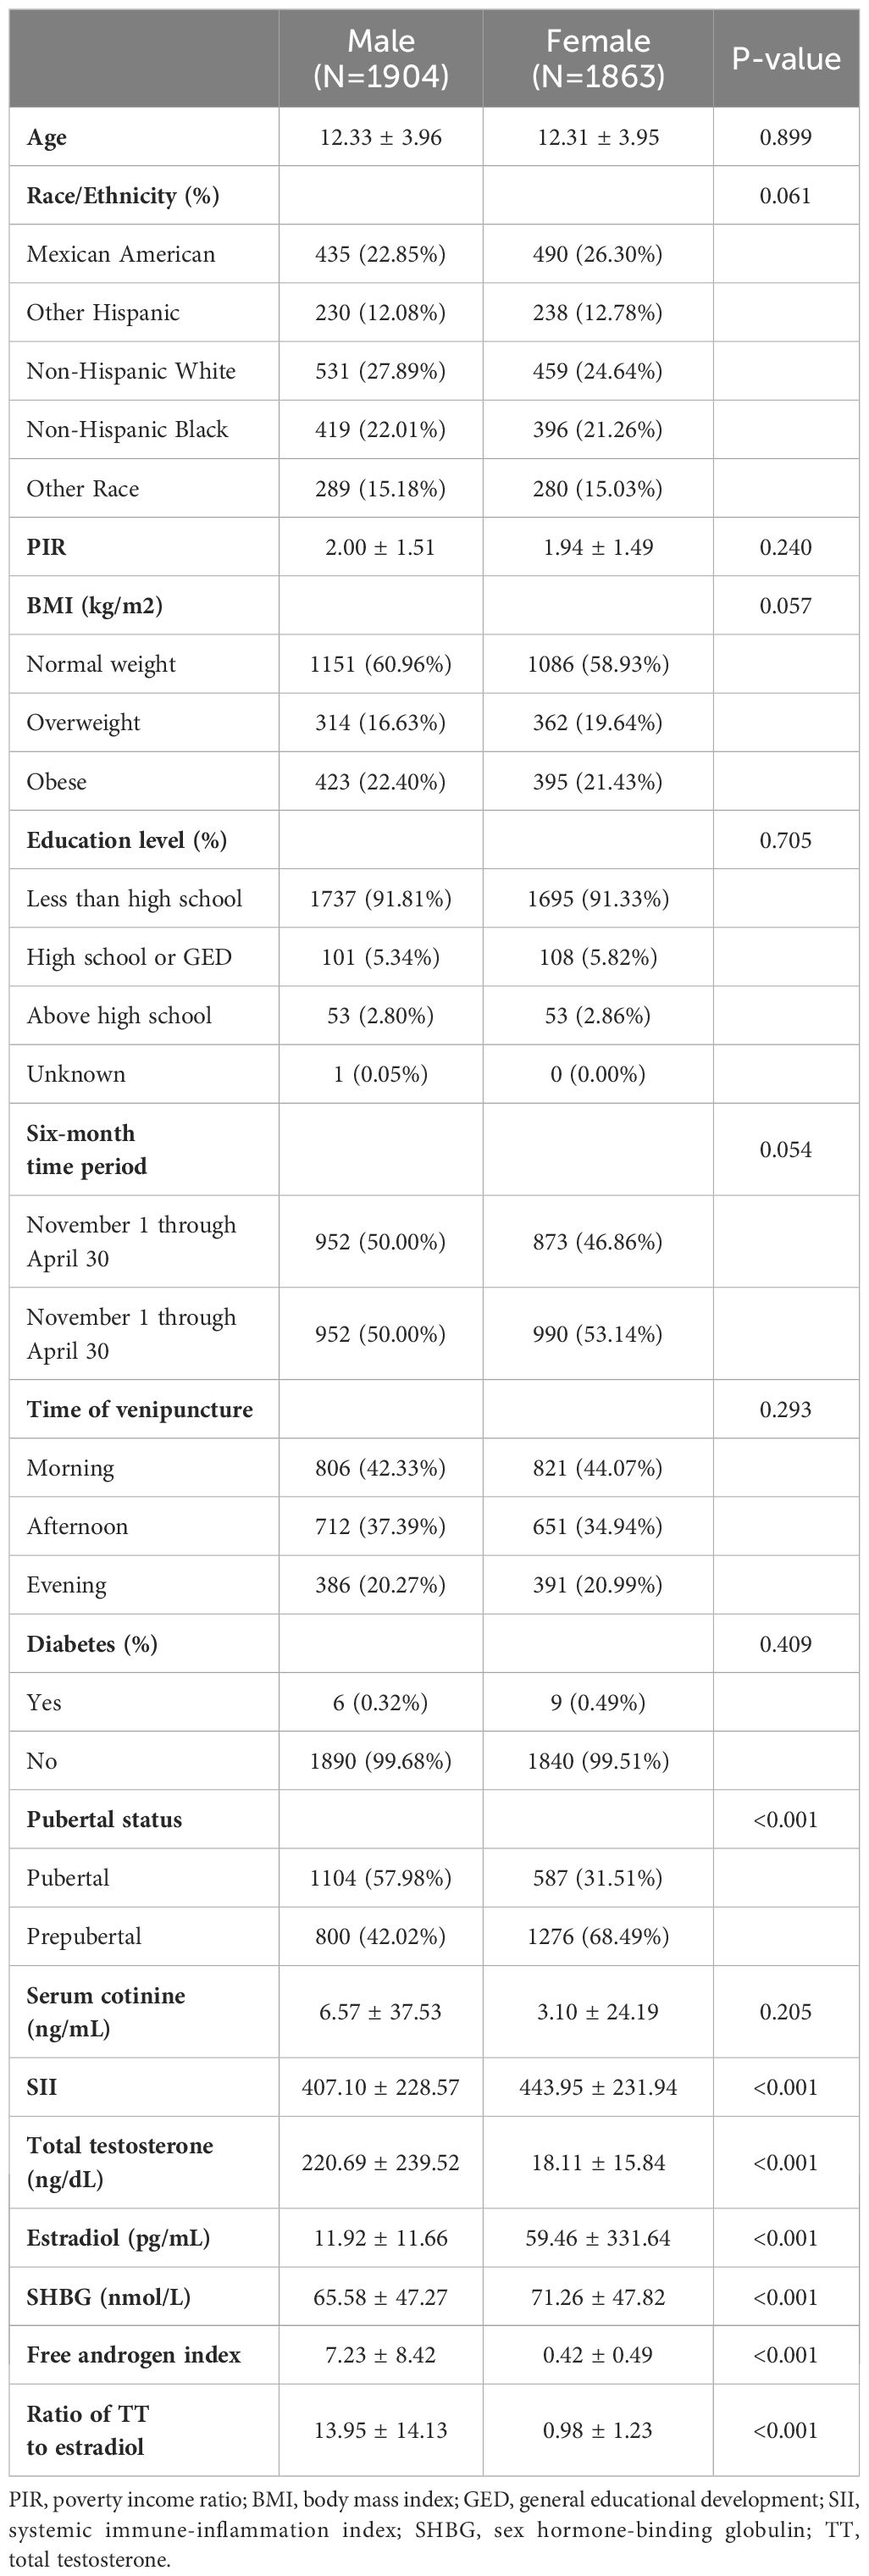
Table 1 Baseline characteristics of participants.
Compared to females, males exhibit relatively higher levels of TT, FAI, and the ratio of TT to estradiol. However, they show relatively lower levels of SII, E2, and SHBG. Moreover, no statistically significant differences were observed in age, PIR, BMI, education level, six-month time period, time of venipuncture, diabetes, and serum cotinine (P > 0.05).
To further characterize our study population, we categorized participants by gender and age groups in Supplementary Table 1. Children had lower levels of SII, TT, E2, FAI, and a lower TT to estradiol ratio compared to adolescents, while SHBG levels were higher in children than in adolescents.
3.2 Association between SII and sex hormone
Since no apparent effect values were seen, we used SII/100 to enhance the effect values. The results of the multivariate regression analysis between SII/100 and sex hormones, segregated by gender, are presented in Table 2. Initially, we assessed the association between SII and sex hormones in males. Within the fully adjusted model, a statistically significant negative correlation was observed between SII and SHBG (β= -0.70, 95% CI: -1.34, -0.06, P=0.0312). With each unit increase in SII, SHBG decreases by 0.7nmol/ml, indicating that higher SII scores correspond to lower SHBG levels. Subsequent analyses were conducted by categorizing SII into tertiles. However, no statistically significant correlation was found (P>0.05). Moreover, in exploring the relationship between SII and other sex hormones, encompassing TT, estradiol, FAI, and the Ratio of TT to estradiol, no statistically significant associations were identified (all P>0.05).
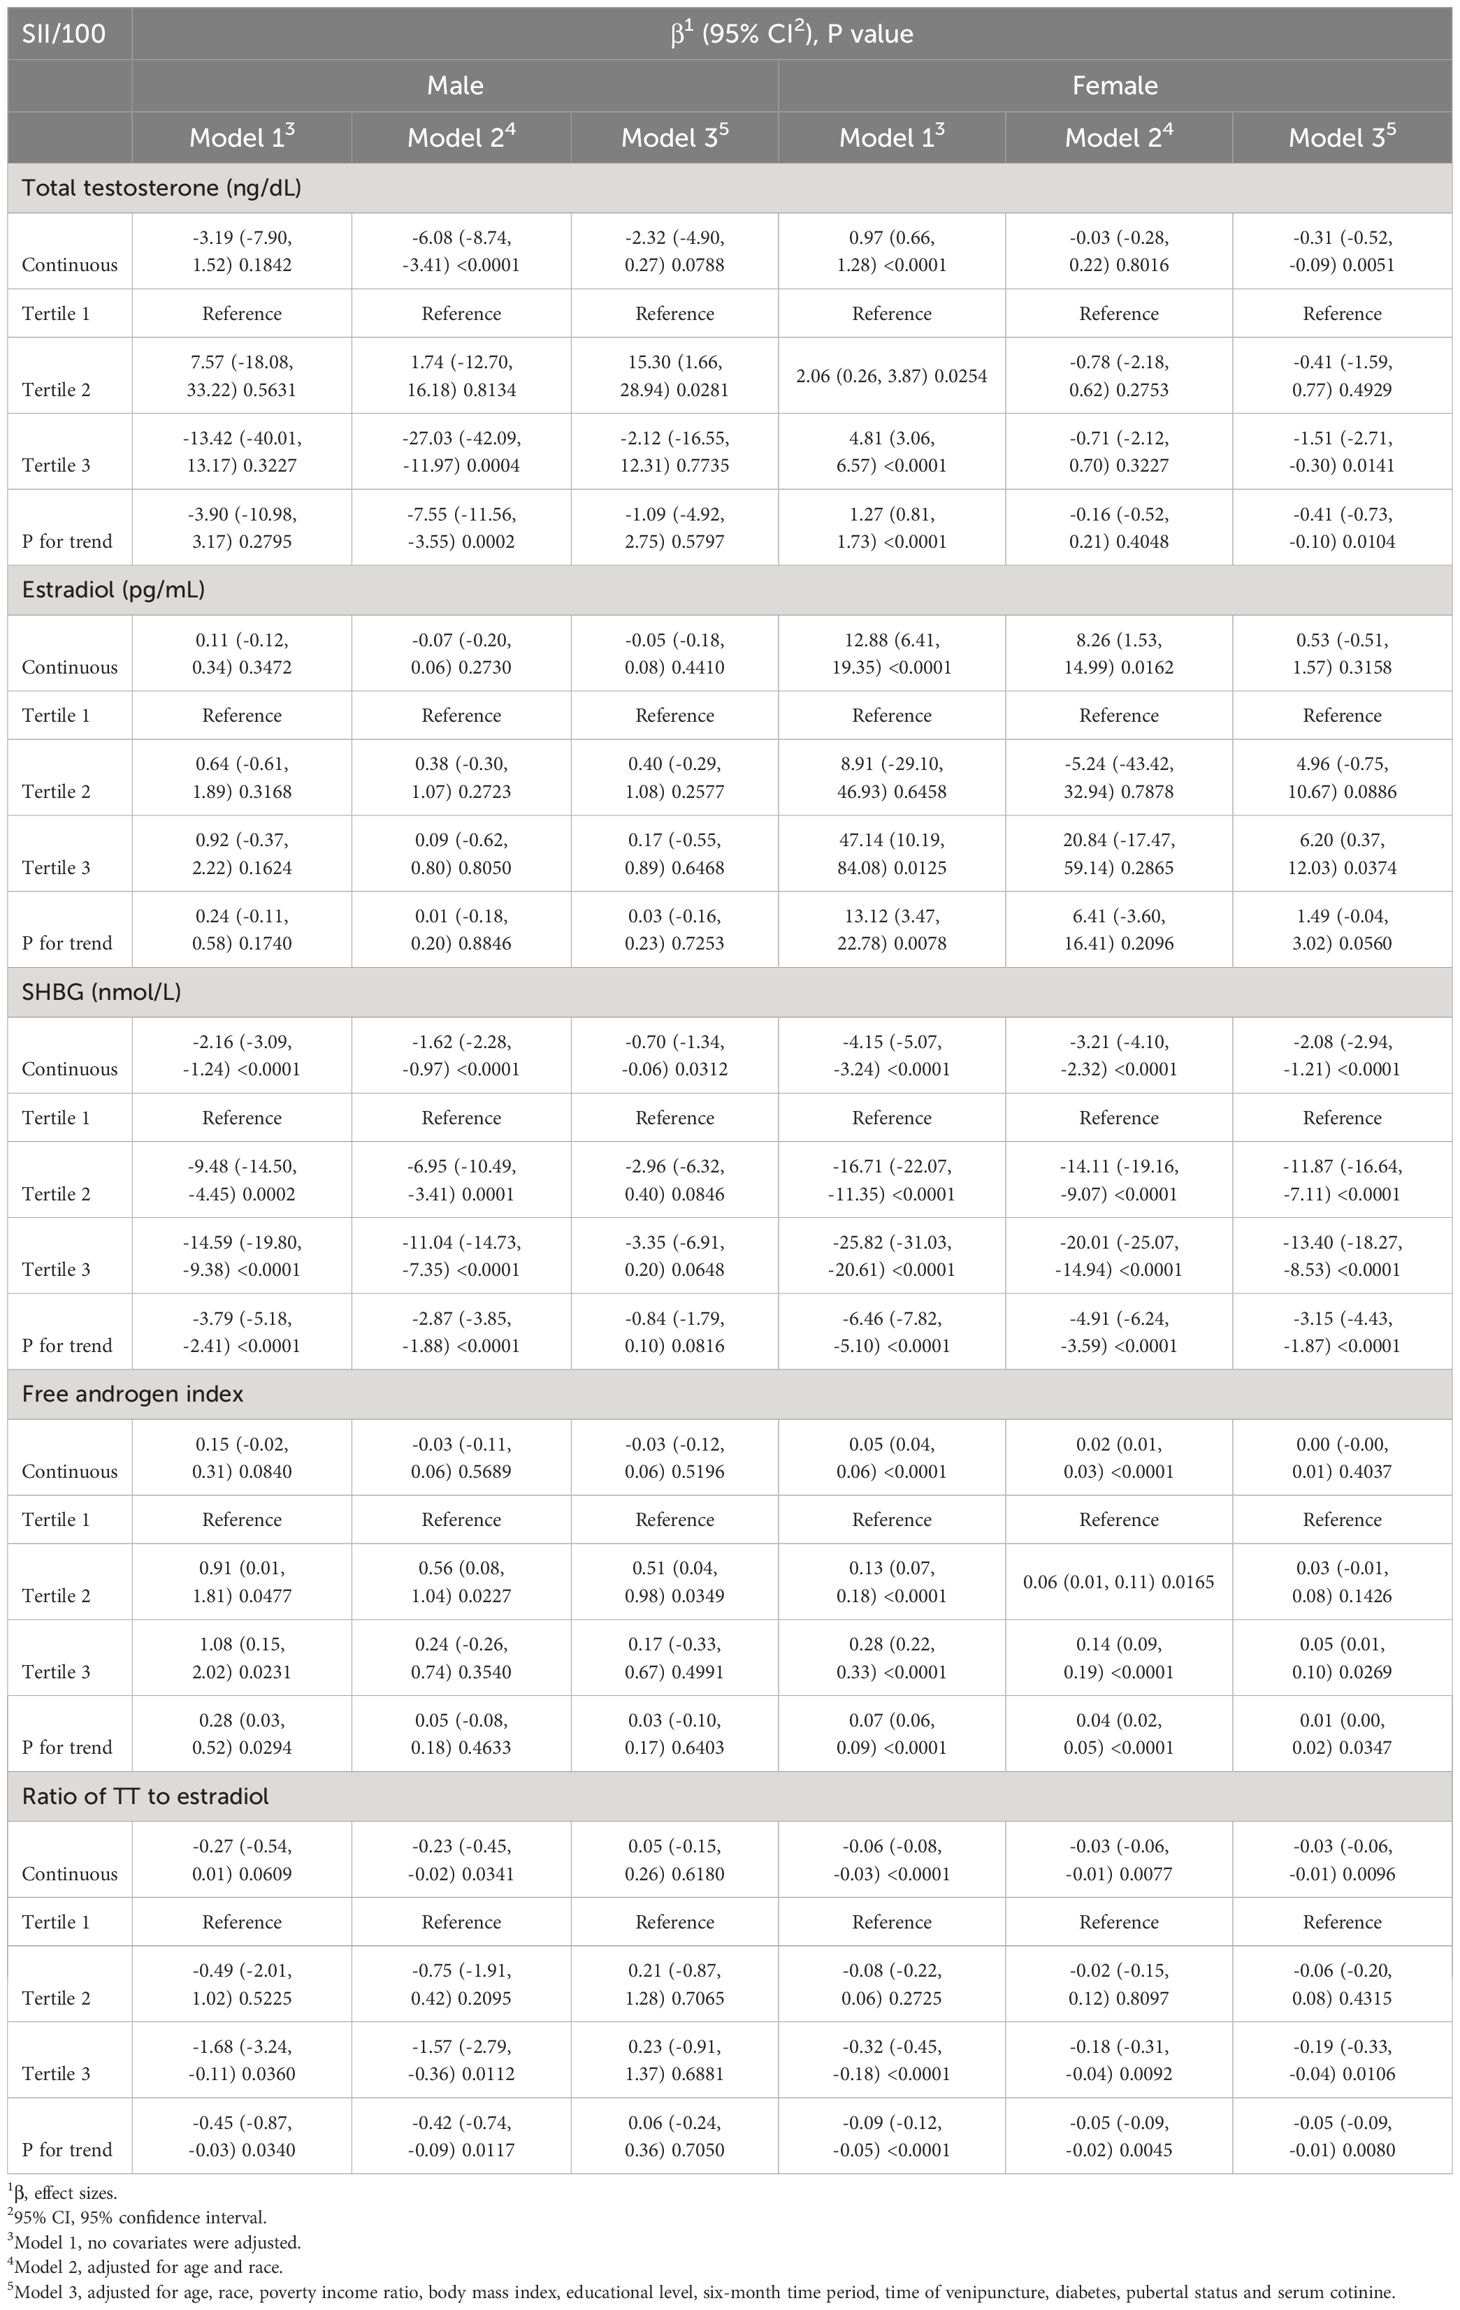
Table 2 Association between systemic immune-inflammation index with sex hormone in male and female aged 6–19.
In the analysis of the association between female SII and sex hormones, our fully adjusted model revealed a significant negative correlation when treating SII as a continuous variable. Specifically, SII exhibited significant negative correlations with TT (β=-0.31, 95% CI: -0.52, -0.09, p=0.0051), SHBG (β=-2.08, 95% CI: -2.94, -1.21, p<0.0001), and Ratio of TT to estradiol (β=-0.03, 95% CI: -0.06, -0.01, p=0.0096). When SII was converted into three strata, the significance with TT (β=-0.41, 95% CI: -0.73, -0.10, p=0.0104), SHBG (β=-3.15, 95% CI: -4.43, -1.87, p<0.0001), and ratio of TT to estradiol (β=-0.05, 95% CI: -0.09, -0.01, p=0.0080) remained unchanged. Furthermore, we found that as a continuous variable, SII had no statistical significance with FAI (P>0.05). Still, after tertile, SII was positively correlated with FAI (β=0.01, 95% CI: 0.00, -0.02, p=0.0347).
To assess whether the association between SII and sex hormones was consistent across the entire population and to identify potential variations within distinct population subgroups, we conducted meticulous subgroup analyses and interaction tests based on diabetes status, body mass index, and puberty status. Our results indicated that in males, SII did not have a significant correlation with these subgroups (Table 3). Conversely, we observed a more consistent association within female subgroups. Notably, Table 4 highlights significant interactions between BMI and FAI, as well as between pubertal status and estradiol (interaction P <0.05).
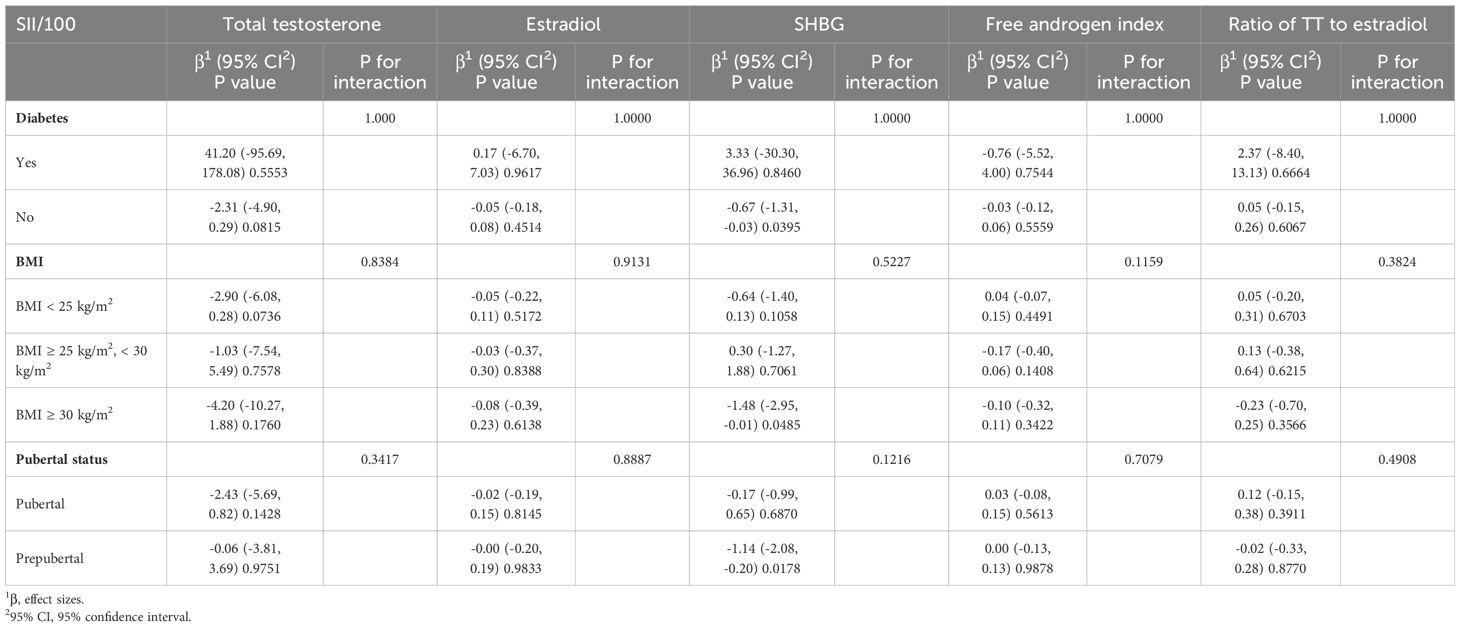
Table 3 Subgroup analysis for the association between SII and sex hormones in male aged 6–19.
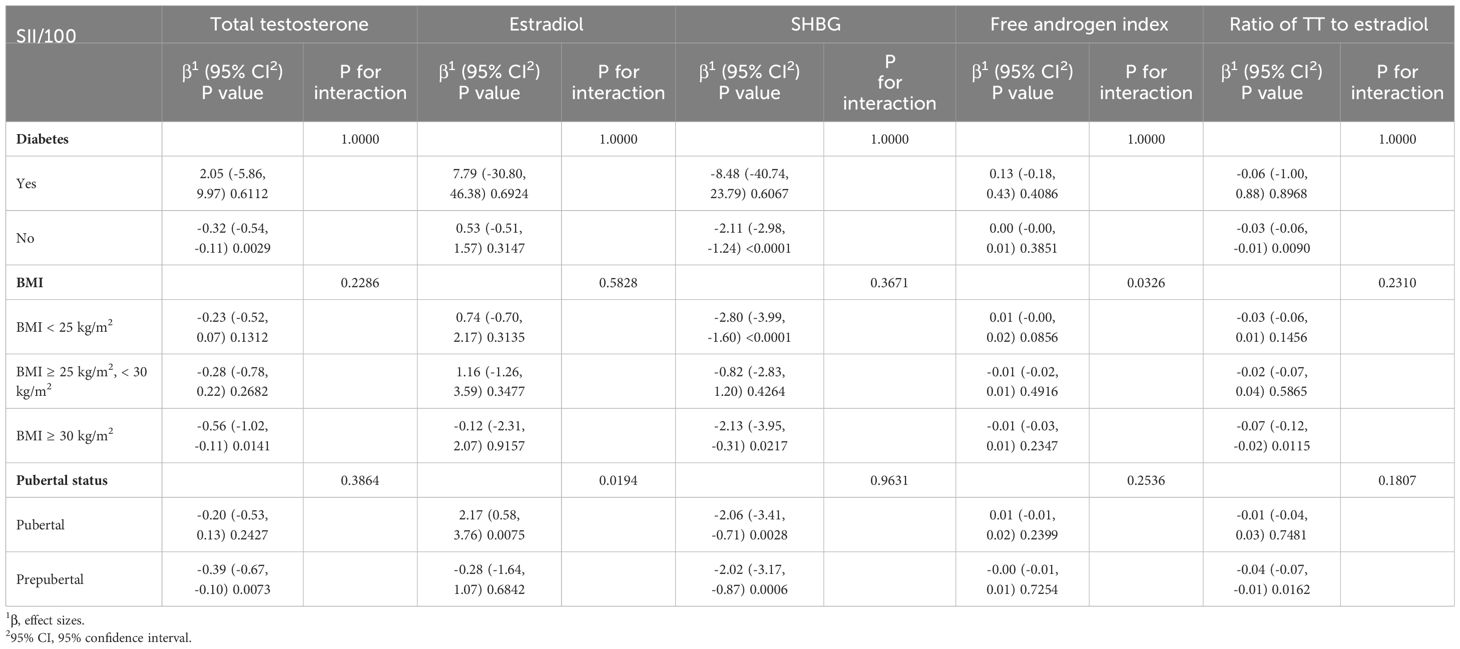
Table 4 Subgroup analysis for the association between SII and sex hormones in female aged 6–19.
We utilized a smoothing curve fitting method to illustrate the nonlinear relationship between SII and sex hormones, as shown in Figure 2. The variables adjusted in this analysis included age, race, PIR, BMI, education level, blood draw season and time, serum cotinine, diabetes, and puberty status. Utilizing a two-stage linear regression model, we unveiled a non-linear association between SII and sex hormones. Intriguingly, within the female population, an inverted U-shaped curve was discerned in the non-linear relationship between SII and estradiol, which appeared at 748.09 (Table 5).
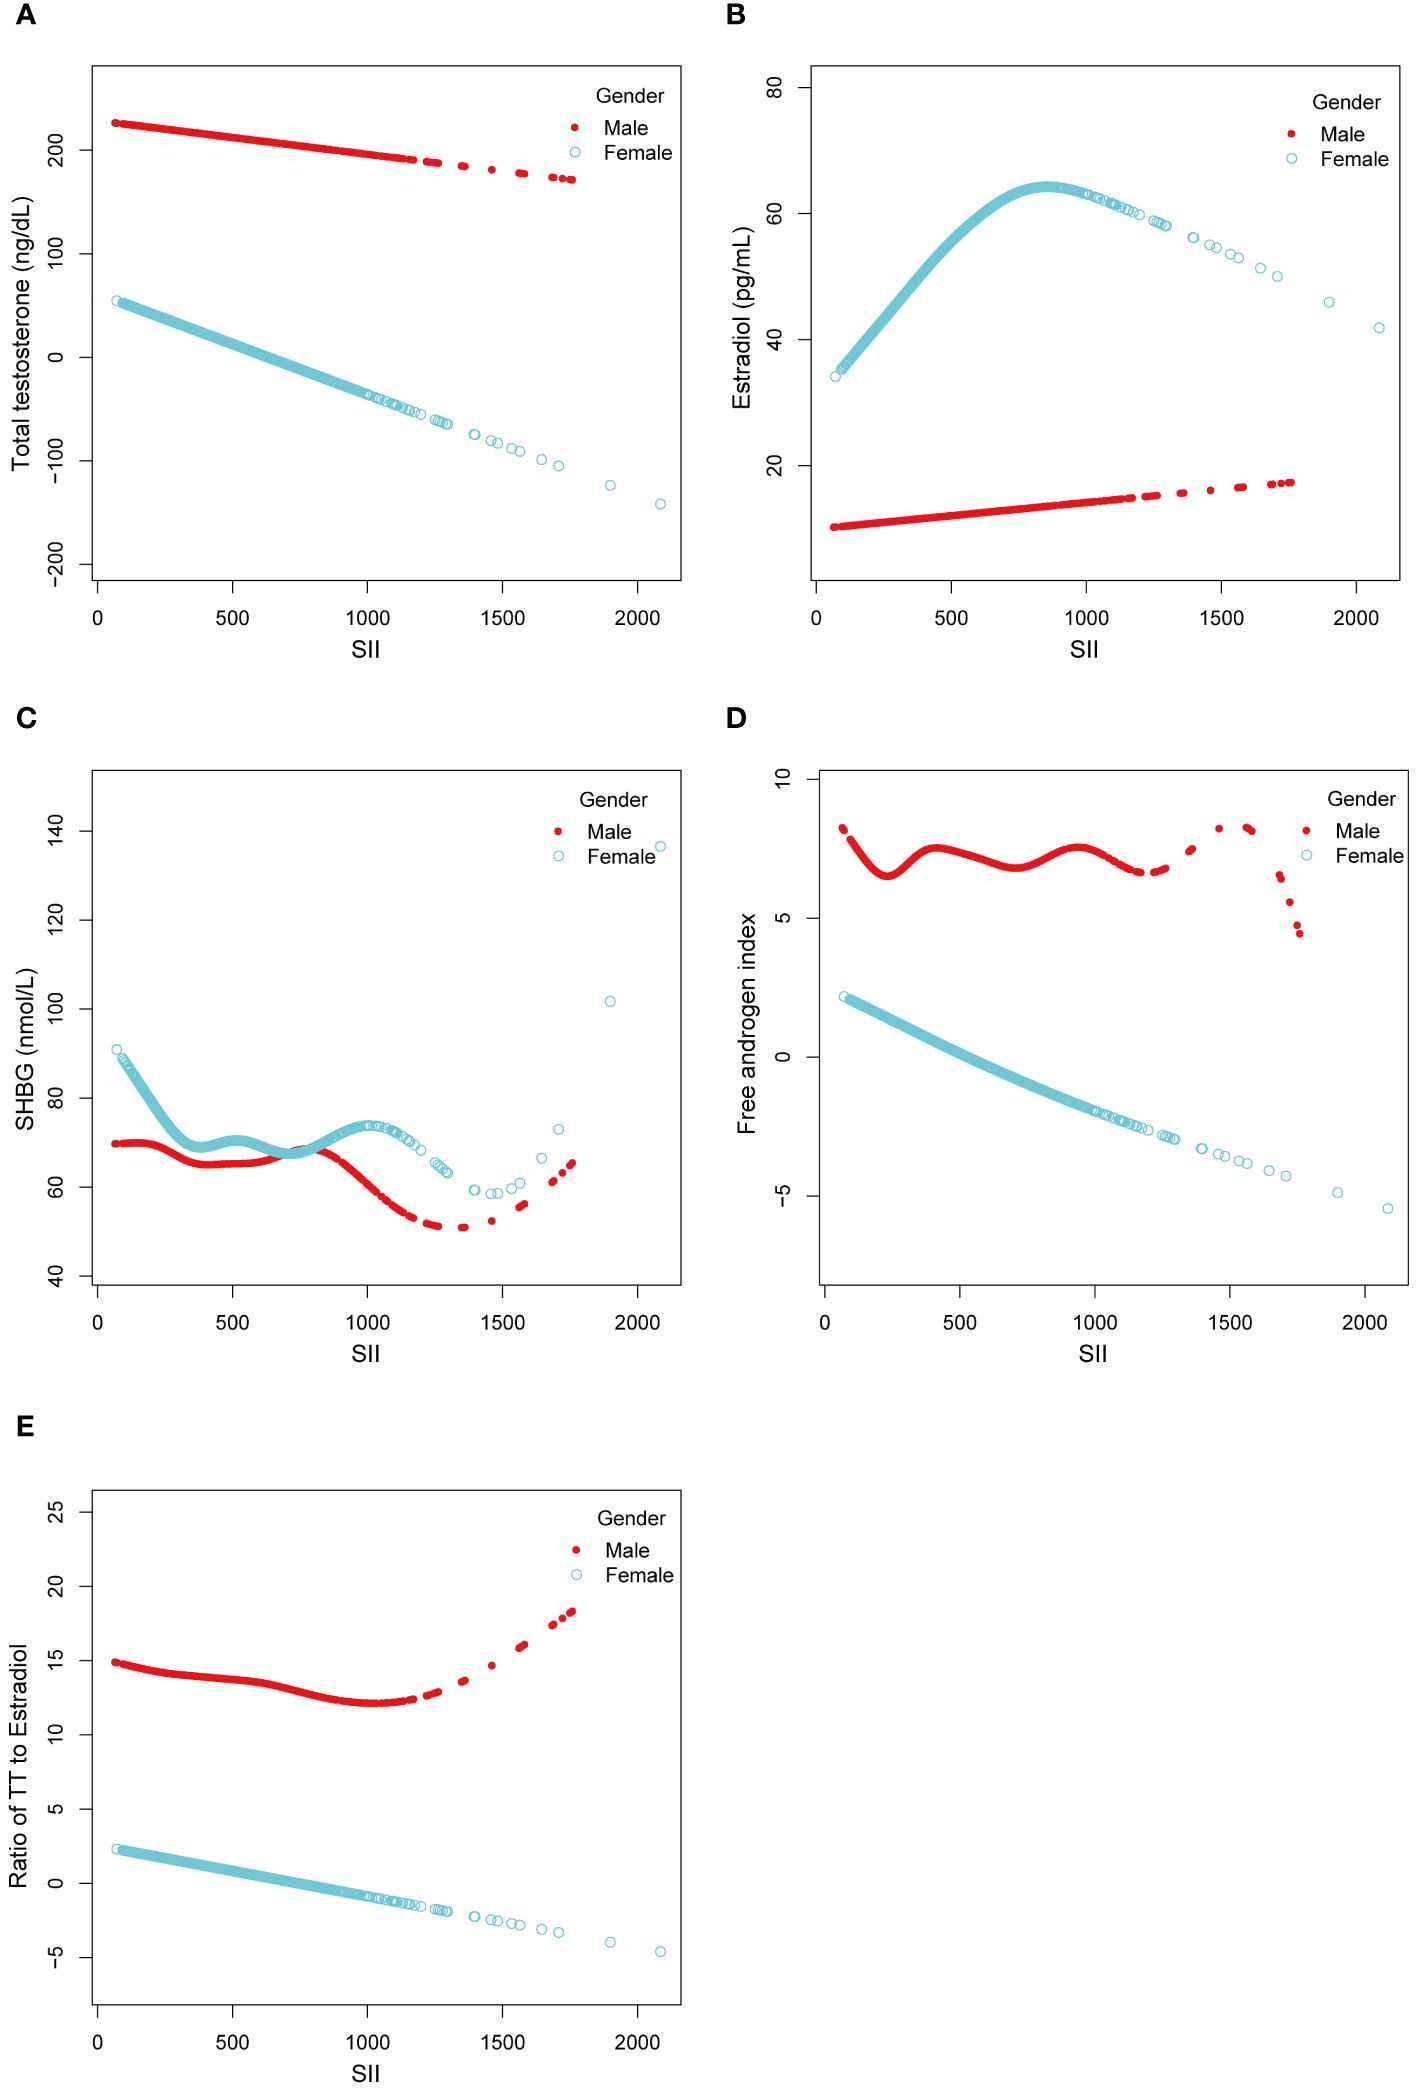
Figure 2 Linear and Non-linear relationship between SII and sex hormones among male and female aged 6-19. (A) TT and SII; (B) Estradiol and SII; (C) SHBG and SII; (D) FAI and SII; (E) Ratio of TT to Estradiol and SII.
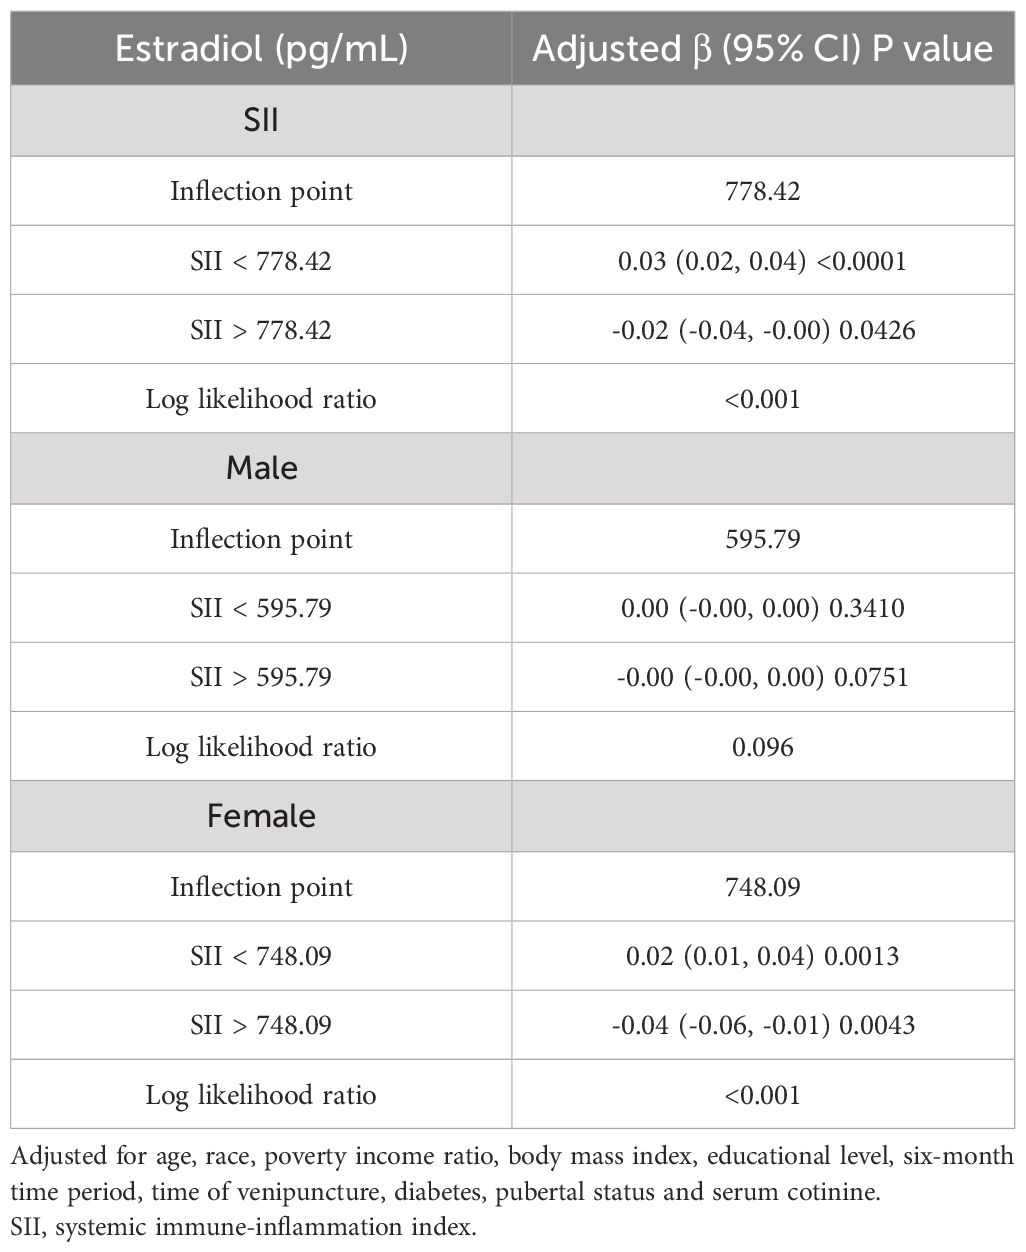
Table 5 Threshold effect analysis of SII on estradiol (pg/mL) using two-piecewise linear regression model.
4 Discussions
Our cross-sectional study involving 3767 children and adolescents identified significant correlations between the SII and specific sex hormones, even after adjusting for potential confounding factors. Notably, a substantial negative correlation emerged between SII and SHBG in males. In females, SII demonstrated significant negative associations with TT, SHBG, and the ratio of TT to estradiol, accompanied by a positive correlation with the FAI. Subgroup analysis and interaction tests unveiled variations among different populations, underscoring the nuanced nature of these relationships. Intriguingly, the relationship between SII and estradiol in females followed an inverted U-shaped curve, with an inflection point at 748.09 (1000 cells/ml). This finding suggests a complex interplay between systemic immune inflammation and sex hormones in this population.
This is the first study to evaluate the association between SII and sex hormones in children and adolescents. Previous clinical investigations have suggested a link between inflammation indices and sex hormones. For instance, Osmancevic et al. examined a community sample of 3041 men aged 45–84 years. They found a negative correlation between hsCRP levels, a biomarker for detecting chronic inflammation, and testosterone and SHBG levels (23). Similarly, Ma et al. using a similar NHANES participant, investigated 1382 adolescents and children aged 6–19 years and found a negative correlation between the Dietary Inflammatory Index (DII) and TT (P = 0.01) and FAI (P = 0.02) in female adolescents. In prepubescent males, DII exhibited a positive correlation with SHBG, while in prepubescent females, it demonstrated a negative association with FAI (24).. Wei et al. through a survey of 9372 adults, found a significant negative correlation between SII and SHBG in both male and female populations (25). These studies are consistent with our results, suggesting that inflammation-related factors may be associated with sex hormone levels. However, investigations into the relationship between immune-inflammatory factors and diverse sex hormone levels, particularly in the context of children and adolescents, are notably scarce in the current studies. Our study incorporated various confounding factors, analyzed male and female adolescents separately, explored the linear and non-linear associations between SII and sex hormones, conducted stratified analysis, and discovered the potential impact of pubertal status and BMI on the association between SII and sex hormone concentrations.
The gender-specific serum levels and metabolism of sex hormones largely account for the higher incidence of autoimmune diseases in females than in males (26). Moreover, numerous studies suggest that androgens are anti-inflammatory, while estrogens are pro-inflammatory (27–29). Studies have found that pro-inflammatory cytokines (TNF-α, IL-1β, IL-6) can increase the expression of aromatase, an enzyme that converts testosterone into estrogen, thereby accelerating the metabolic conversion of androgens to estrogens and reducing the amount of available testosterone in the body (30, 31). Our study results showed a significant negative correlation between SII and the ratio of TT to estradiol. We speculate this is mainly due to a significant decrease in testosterone levels. However, it’s important to note that the ratio of TT to estradiol may not accurately predict aromatase activity, as it is influenced by other factors, such as metabolic syndrome (32), introducing uncertainty to this result. In addition, under inflammatory conditions, these inflammatory factors also stimulate macrophages to produce pro-inflammatory cytokines, which inhibit Leydig cells. Macrophages also have Reactive Oxygen Species (ROS), hindering Leydig cell function and decreasing testosterone synthesis (33, 34). In animal experiments, systemic inflammation caused by bacterial infection in the mother during early embryonic development interferes with the migration and synapse formation of Gonadotropin-Releasing Hormone (GnRH) neurons. This interference affects the development and function of the Hypothalamic-Pituitary-Gonadal (HPG) axis in male rat offspring, resulting in reduced gonadotropin and sex steroid levels and gonadal structural damage (35). Klaudia Barabás et al. demonstrated that in females, inflammation inhibits the secretion of GnRH and Luteinizing Hormone (LH), leading to ovulation disorders and infertility (36). Furthermore, research indicates that Visceral Adipose Tissue (VAT) is a source of endogenous estrogen and pro-inflammatory cytokines, potentially reducing the synthesis of SHBG and decreasing serum SHBG levels (37). This finding aligns with our research results, indicating a negative correlation between SII and SHBG. However, it’s essential to note that no definitive research is currently establishing the relationship between SII and FAI. MaryFran R Sowers’ research suggests that androgens can influence the inflammatory response through various pathways. High FAI and low SHBG may reflect elevated levels of androgens (38).
Our findings bear significant implications for clinical application and future research. Firstly, our study utilized a nationally representative sample, reflecting the ethnically and gender-diverse population of children and adolescents in the United States. The substantial sample size enabled subgroup analyses, contributing to the robustness and generalizability of our results. Moreover, our findings suggest that a high SII may precede potential risks of sex hormone disorders, providing a basis for preventive strategies against such disorders through SII monitoring. However, our study has limitations. Firstly, we cannot establish definitive causal relationships due to the cross-sectional study design. Secondly, although we adjusted for several relevant confounding factors, we could only incorporate some covariates, thus limiting the attainment of entirely accurate results. Finally, we acknowledge that the presence of inflammatory diseases or infections could elevate inflammatory levels and confound our results. However, data on such conditions were not available and should be considered a limitation of this study.
5 Conclusions
Our findings suggest that SII may be an independent risk factor for changes in sex hormones in both male and female children and adolescents. More prospective and experimental studies should be conducted to validate our results and elucidate the underlying molecular pathways.
Data availability statement
The datasets presented in this study can be found in online repositories. The names of the repository/repositories and accession number(s) can be found below: https://www.cdc.gov/nchs/nhanes/.
Ethics statement
The studies involving humans were approved by NCHS Ethics Review Board (ERB). The studies were conducted in accordance with the local legislation and institutional requirements. Written informed consent for participation in this study was provided by the participants’ legal guardians/next of kin.
Author contributions
ZG: Writing – review & editing, Writing – original draft, Supervision, Software, Project administration, Conceptualization. KL: Writing – review & editing, Writing – original draft, Visualization, Validation, Investigation, Formal analysis, Conceptualization.
Funding
The author(s) declare that no financial support was received for the research, authorship, and/or publication of this article.
Conflict of interest
The authors declare that the research was conducted in the absence of any commercial or financial relationships that could be construed as a potential conflict of interest.
Publisher’s note
All claims expressed in this article are solely those of the authors and do not necessarily represent those of their affiliated organizations, or those of the publisher, the editors and the reviewers. Any product that may be evaluated in this article, or claim that may be made by its manufacturer, is not guaranteed or endorsed by the publisher.
Supplementary material
The Supplementary Material for this article can be found online at: https://www.frontiersin.org/articles/10.3389/fendo.2024.1355738/full#supplementary-material
References
1. Guzelce EC, Galbiati F, Goldman AL, Gattu AK, Basaria S, Bhasin S. Accurate measurement of total and free testosterone levels for the diagnosis of androgen disorders. Best Pract Res Clin Endocrinol Metab. (2022) 36:101683. doi: 10.1016/j.beem.2022.101683
2. Ward EP, Evans DB, Tsai S. Ten-year experience in optimizing neoadjuvant therapy for localized pancreatic cancer—Medical college of Wisconsin perspective. J Surg Oncol. (2021) 123:1405–13. doi: 10.1002/jso.26395
3. Wu E, Son SY, Gariwala V, O’Neill C. Gastric gastrointestinal stromal tumor (GIST) with co-occurrence of pancreatic neuroendocrine tumor. Radiol Case Rep. (2021) 16:1391–4. doi: 10.1016/j.radcr.2021.03.014
4. Hammes SR, Levin ER. Impact of estrogens in males and androgens in females. J Clin Invest. (2019) 129:1818–26. doi: 10.1172/JCI125755
5. Ryan KJ. Biochemistry of aromatase: significance to female reproductive physiology. Cancer Res. (1982) 42:3342s–4s.
6. Hammond GL, Bocchinfuso WP. Sex hormone-binding globulin: gene organization and structure/function analyses. Horm Res. (2008) 45:197–201. doi: 10.1159/000184787
7. Hansson V, Weddington SC, French FS, McLean W, Smith A, Nayfeh SN, et al. Secretion and role of androgen-binding proteins in the testis and epididymis. J Reprod Fertil Suppl. (1976) 24:17–33.
8. Ruth KS, Day FR, Tyrrell J, Thompson DJ, Wood AR, Mahajan A, et al. Using human genetics to understand the disease impacts of testosterone in men and women. Nat Med. (2020) 26:252–8. doi: 10.1038/s41591–020-0751–5
9. Wang J, Zhou D, Dai Z, Li X. Association between systemic immune-inflammation index and diabetic depression. Clin Interv Aging. (2021) 16:97–105. doi: 10.2147/CIA.S285000
10. Xie R, Xiao M, Li L, Ma N, Liu M, Huang X, et al. Association between SII and hepatic steatosis and liver fibrosis: A population-based study. Front Immunol. (2022) 13:925690. doi: 10.3389/fimmu.2022.925690
11. Hu B, Yang XR, Xu Y, Sun YF, Sun C, Guo W, et al. Systemic immune-inflammation index predicts prognosis of patients after curative resection for hepatocellular carcinoma. Clin Cancer Res. (2014) 20:6212–22. doi: 10.1158/1078–0432.CCR-14–0442
12. Sciarra F, Campolo F, Franceschini E, Carlomagno F, Venneri MA. Gender-specific impact of sex hormones on the immune system. Int J Mol Sci. (2023) 24:6302. doi: 10.3390/ijms24076302
13. Reyes-García J, Montaño LM, Carbajal-García A, Wang Y-X. Sex hormones and lung inflammation. Adv Exp Med Biol. (2021) 1304:259–321. doi: 10.1007/978–3-030–68748-9_15
14. Lélu K, Laffont S, Delpy L, Paulet P-E, Périnat T, Tschanz SA, et al. Estrogen receptor α signaling in T lymphocytes is required for estradiol-mediated inhibition of Th1 and Th17 cell differentiation and protection against experimental autoimmune encephalomyelitis. J Immunol. (2011) 187:2386–93. doi: 10.4049/jimmunol.1101578
15. Yialamas MA, Dwyer AA, Hanley E, Lee H, Pitteloud N, Hayes FJ. Acute sex steroid withdrawal reduces insulin sensitivity in healthy men with idiopathic hypogonadotropic hypogonadism. J Clin Endocrinol Metab. (2007) 92:4254–9. doi: 10.1210/jc.2007–0454
16. Curtin LR, Mohadjer LK, Dohrmann SM, Montaquila JM, Kruszan-Moran D, Mirel LB, et al. The national health and nutrition examination survey: sample design, 1999–2006. Vital Health Stat 2. (2012) 2:1–39.
17. Chen JH, Zhai ET, Yuan YJ, Wu KM, Xu JB, Peng JJ, et al. Systemic immune-inflammation index for predicting prognosis of colorectal cancer. World J Gastroenterol. (2017) 23:6261–72. doi: 10.3748/wjg.v23.i34.6261
18. Wilke TJ, Utley DJ. Total testosterone, free-androgen index, calculated free testosterone, and free testosterone by analog RIA compared in hirsute women and in otherwise-normal women with altered binding of sex-hormone-binding globulin. Clin Chem. (1987) 33:1372–5. doi: 10.1093/clinchem/33.8.1372
19. Newton CJ, Samuel DL, James VH. Aromatase activity and concentrations of cortisol, progesterone and testosterone in breast and abdominal adipose tissue. J Steroid Biochem. (1986) 24:1033–9. doi: 10.1016/0022–4731(86)90356–0
20. Woodward MJ, Obsekov V, Jacobson MH, Kahn LG, Trasande L. Phthalates and sex steroid hormones among men from NHANES, 2013–2016. J Clin Endocrinol Metab. (2020) 105:e1225–34. doi: 10.1210/clinem/dgaa039
21. Luo K, Liu J, Wang Y, Aimuzi R, Luo F, Ao J, et al. Associations between organophosphate esters and sex hormones among 6–19-year old children and adolescents in NHANES 2013–2014. Environ Int. (2020) 136:105461. doi: 10.1016/j.envint.2020.105461
22. Qin Z, Liu N, Liao R, Jiang L, Su B. The association between dietary inflammatory potential and sex hormones in male children and adolescents aged 6–19 years. Front Endocrinol (Lausanne). (2021) 12:722941. doi: 10.3389/fendo.2021.722941
23. Osmancevic A, Daka B, Michos ED, Trimpou P, Allison M. The Association between Inflammation, Testosterone and SHBG in men: A cross-sectional Multi-Ethnic Study of Atherosclerosis. Clin Endocrinol (Oxf). (2023) 99:190–7. doi: 10.1111/cen.14930
24. Ma Y, Li R, Zhan W, Huang X, Zhou Y, Sun Y, et al. Associations between dietary inflammatory index and sex hormones among 6- to 19-year-old children and adolescents in NHANES 2015–2016. Front Endocrinol (Lausanne). (2022) 12:792114. doi: 10.3389/fendo.2021.792114
25. Wei C, Zhang W, Chen J, He Q, Cao L, Zhang P, et al. Systematic analysis between inflammation-related index and sex hormones in American adults: cross-sectional research based NHANES 2013–2016. Front Immunol. (2023) 14:1175764. doi: 10.3389/fimmu.2023.1175764
26. Schmidt M. Inflammation and sex hormone metabolism. Ann N Y Acad Sci. (2006) 1069:236–46. doi: 10.1196/annals.1351.021
27. Straub RH, Cutolo M. HR. Involvement of the hypothalamic–pituitary–adrenal/gonadal axis and the peripheral nervous system in rheumatoid arthritis: viewpoint based on a systemic pathogenetic role. Arthritis & Rheumatism. (2001) 44:493–507. doi: 10.1002/1529-0131(200103)44:3<493::AID-ANR95>3.0.CO;2-U
28. Masi AT, Bijlsma JWJ, Chikanza IC, Pitzalis C, Cutolo M. Neuroendocrine, immunologic, and microvascular systems interactions in rheumatoid arthritis: Physiopathogenetic and therapeutic perspectives. Semin Arthritis Rheum. (1999) 29:65–81. doi: 10.1016/S0049–0172(99)80039–0
29. Cutolo M, Capellino S, Montagna P, Ghiorzo P, Sulli A, Villaggio B. Sex hormone modulation of cell growth and apoptosis of the human monocytic/macrophage cell line. Arthritis Res Ther. (2005) 7:1124–32. doi: 10.1186/ar1791
30. Purohit A, Ghilchik MW, Duncan L, Wang DY, Singh A, Walker MM, et al. Aromatase activity and interleukin-6 production by normal and Malignant breast tissues. J Clin Endocrinol Metab. (1995) 80:3052–8. doi: 10.1210/jcem.80.10.7559896
31. Zhou J, Wei Y, Lan Y, Zuo J, Hou X, Hou W. Individual and joint association of bioavailable testosterone and aging with neutrophil-to-lymphocyte ratio in Chinese middle-aged and elderly men. Aging Clin Exp Res. (2020) 32:1515–23. doi: 10.1007/s40520–019-01333–0
32. Ali Hamza M, Abdulhameed A, Ali Mansour A. Total testosterone to estradiol ratio as a predictor marker of metabolic syndrome in males. Arch Razi Inst. (2022) 77:351–7. doi: 10.22092/ARI.2021.356607.1878
33. Hales DB. Testicular macrophage modulation of Leydig cell steroidogenesis. J Reprod Immunol. (2002) 57:3–18. doi: 10.1016/S0165–0378(02)00020–7
34. Goluža T, Boscanin A, Cvetko J, Kozina V, Kosović M, Bernat MM, et al. Macrophages and Leydig cells in testicular biopsies of azoospermic men. BioMed Res Int. (2014) 2014:828697. doi: 10.1155/2014/828697
35. Ignatiuk V, Izvolskaia M, Sharova V, Zakharova L. Disruptions in hypothalamic–pituitary–gonadal axis development and their igG modulation after prenatal systemic inflammation in male rats. Int J Mol Sci. (2023) 24:2726. doi: 10.3390/ijms24032726
36. Barabás K, Szabó-Meleg E, Ábrahám IM. Effect of inflammation on female gonadotropin-releasing hormone (GnRH) neurons: Mechanisms and consequences. Int J Mol Sci. (2020) 21:529. doi: 10.3390/ijms21020529
37. Bradshaw PT, Cespedes Feliciano EM, Prado CM, Alexeeff S, Albers KB, Chen WY, et al. Adipose tissue distribution and survival among women with nonmetastatic breast cancer. Obesity. (2019) 27:997–1004. doi: 10.1002/oby.22458
Keywords: NHANES, systemic immune-inflammation index, sex hormones, children, adolescents
Citation: Gao Z and Liu K (2024) Association between systemic immunity-inflammation index and sex hormones in children and adolescents aged 6–19. Front. Endocrinol. 15:1355738. doi: 10.3389/fendo.2024.1355738
Received: 14 December 2023; Accepted: 03 June 2024;
Published: 13 June 2024.
Edited by:
Trine N. Jorgensen, Case Western Reserve University, United StatesReviewed by:
DeAnna Baker Frost, Medical University of South Carolina, United StatesOtilia Marginean, Victor Babes University of Medicine and Pharmacy, Romania
Copyright © 2024 Gao and Liu. This is an open-access article distributed under the terms of the Creative Commons Attribution License (CC BY). The use, distribution or reproduction in other forums is permitted, provided the original author(s) and the copyright owner(s) are credited and that the original publication in this journal is cited, in accordance with accepted academic practice. No use, distribution or reproduction is permitted which does not comply with these terms.
*Correspondence: Zijun Gao, a291bXJza2t1bkBvdXRsb29rLmNvbQ==
†These authors have contributed equally to this work