 Daniel Asmelash
 Marye Nigatie
 Tadele Melak
 Ermiyas Alemayehu
 Agenagnew Ashagre2
 Abebaw Worede
- 1Department of Medical Laboratory Science, College of Medicine and Health Sciences, Mizan-Tepi University, Mizan-Aman, Ethiopia
- 2Department of Medical Laboratory Sciences, College of Health Sciences, Woldia University, Woldia, Ethiopia
- 3Department of Clinical Chemistry, School of Biomedical and Laboratory Sciences, College of Medicine and Health Sciences, University of Gondar, Gondar, Ethiopia
- 4Department of Medical Laboratory Sciences, College of Medicine and Health Sciences, Wollo University, Dessie, Ethiopia
Background: The prevalence of metabolic syndrome (MetS) in patients infected with Helicobacter pylori, and the factors associated with it are not well understood. This study evaluates MetS and its associated factors among both H pylori-positive and H pylori-negative individuals in Northeast Ethiopia.
Methods: A cross-sectional study was conducted between 1 March 2022 to 30 May 2022. A semi-structured questionnaire was used to collect data on sociodemographic, behavioral, and clinical variables. A total of 228 subjects were randomly selected. Blood and stool samples were collected from each subject to measure fasting blood glucose and lipid profiles, and to identify H. pylori infection. Data were entered into Epi. Data 3.1 and analyzed using SPSS version 25. Logistic regression analysis and the Mann–Whitney U-test were performed to determine associated factors and compare median and interquartile ranges.
Results: Of the 228 participants, 114 were H. pylori positive, and 114 were H. pylori negative. Participants (50.9% female) ranged in age from 18 years to 63 years, with a median age of 31 (IQR, 22, 40) years. The overall prevalence of MetS among the participants was 23.2%. We found a statistically significant association between MetS and fasting blood glucose level (AOR, 15.965; 95% CI, 7.605–33.515, p<0.001). Furthermore, there was a statistically significant difference in the median serum levels of low-density lipoprotein cholesterol (p<0.001), triglycerides (p=0.036), systolic blood pressure (<0.001), and total cholesterol (p<0.001) between H. pylori-positive and H. pylori-negative participants.
Conclusion: MetS was prevalent among study participants. There was also a statistically significant association between fasting blood sugar and MetS. In addition, systolic blood pressure, total cholesterol, triglycerides, and low-density lipoprotein levels were significantly different between H. pylori-positive and H. pylori-negative individuals.
Introduction
Metabolic syndrome (MetS) is characterized by a cluster of metabolic abnormalities, including central obesity, impaired glucose tolerance, insulin resistance (IR), dyslipidemia, and hypertension, which markedly increase the risk of diabetes mellitus and cardio-cerebrovascular disease (1, 2). While dietary and lifestyle risk factors do not explain all the cases of MetS, other emerging risk factors are increasingly being studied (3).
Helicobacter pylori infection is a widespread global health issue, affecting over 50% of individuals, particularly in developing countries. The prevalence of this infection varies among different age groups and stages of development (4). H. pylori infection can lead to the production of inflammatory substances such as C-reactive protein (CRP), tumor necrosis factor, interferon, and interleukin-1, interleukin-6, and interleukin-8, which contribute to systemic inflammation (2, 5).
MetS affects over a quarter of the world’s population and has been linked to chronic inflammation (6). Effective management of MetS, including lowering LDL-C and raising HDL-C levels, is associated with a reduced risk of major cardiovascular events. A reduction in low-density lipoprotein cholesterol (LDL-C) by 1 mmol/L is associated with a 24% decrease in the relative risk of major vascular incidents over 5 years. Additionally, every 1 mg/dl increase in HDL-C is associated with a 2%–3% decrease in the future risk of coronary heart disease (7).
The relationship between MetS and infections can be explained by the production and secretion of pro-inflammatory cytokines, which induce metabolic manifestations (8). H. pylori invasion of the stomach can cause persistent stomach disturbances, which may affect some patients’ biochemical parameters (9). Potential underlying reasons for these conditions include chronic low-grade activation of the coagulation cascade, accelerated atherosclerosis, and antigenic mimicry between H. pylori and host epitopes, which can cause autoimmune diseases and abnormal lipid metabolism (10).
Furthermore, peptides like leptin and ghrelin, produced in the stomach, might also mediate the relationship between H. pylori infection and MetS (11, 12). In individuals infected with H. pylori, elevated levels of TC and LDL-C and reduced levels of HDL-C create an atherogenic lipid profile that may increase the risk of peripheral vascular disease, myocardial infarction, stroke, and atherosclerosis, its potential consequences (13). Specifically, the occurrence of H. pylori infections and reports of dyspepsia tend to rise when glycemic and metabolic control declines (14). Both the prevalence of MetS and H. pylori infection rise with age and are influenced by socioeconomic factors (15).
Epidemiological studies have shown mixed results regarding the association between H. pylori infection and MetS, with some studies indicating a significant link (16), while others do not (17, 18). This inconsistency highlights the need for further investigation, particularly in diverse populations.
Despite this, there is limited research on the impact of H. pylori on MetS within the Ethiopian context. Therefore, this study aims to fill this gap by investigating the prevalence of MetS and its associated factors among dyspeptic patients in northeast Ethiopia.
Materials and methods
Study area, design, and period
This study was conducted in the Waghimra Zone Sekota Woreda at Tefera Hailu Memorial General Hospital (THMGH), Northeast Ethiopia. A hospital-based cross-sectional study was conducted among dyspeptic patients attending THMGH from 1 March 2022 to 30 May 2022.
Sample size and sampling technique
The sampling technique employed in this study was a stratified random sampling method designed to ensure equal representation of H. pylori-positive and H. pylori-negative dyspeptic patients attending THMGH in Northeast Ethiopia from 1 March 2022 to 30 May 2022. Initially, the study population was divided into two strata based on H. pylori status, and each stratum contained a list of eligible participants. Within each stratum, participants were selected using a simple random sampling technique. Specifically, a computerized random number generator was used to randomly select 114 participants from each group, ensuring a balanced and representative sample. This approach accounted for key sociodemographic characteristics, aiming to maintain balance and reduce selection bias. In cases where a selected participant was unavailable or declined participation, another individual from the same stratum was randomly chosen to replace them, thus maintaining the intended sample size and representativeness.
Eligibility criteria
We included patients aged 18–65 who were clinically diagnosed with dyspepsia and had undergone both endoscopic examination and H. pylori testing. Patients with a history of chronic diseases such as diabetes mellitus, cardiovascular diseases, chronic liver, or kidney disease were excluded, as were those currently on medications that could interfere with lipid metabolism or H. pylori status. Additionally, we excluded patients with other gastrointestinal diseases, such as gastric cancer, to reduce heterogeneity. Subjects were screened using a two-step process: initial screening through patient medical history and clinical assessment followed by confirmatory diagnostic testing for H. pylori infection. Patients were excluded based on a predefined list of confounding factors. Participants who met the eligibility criteria were thoroughly informed about the study’s objectives, procedures, risks, and benefits. Written informed consent was obtained from all participants before their enrolment in the study.
Operational definition
MetS is defined based on the modified National Cholesterol Education Program Adult Treatment Panel III Criteria (NCEP-ATP III) (19), which requires at least three of the following metabolic factors: 1) WC of ≥ 94 cm for men and ≥ 80 cm for women; 2) BP, SBP ≥ 130 mmHg or DBP ≥ 85 mmHg; 3) hyperglycemia, fast blood sugar (FBS) ≥ 100 mg/dl; 4) hypertriglyceridemia, TG ≥ 150 mg/dl; and 5) low HDL-C, HDL-C < 40 mg/dl in men or HDL-C < 50 mg/dl in women. Dyslipidemia is defined as total cholesterol (TC) >200 mg/dl and/or triglycerides >150 mg/dl and/or LDL-C > 130 mg/dl and/or HDL-C <40 mg/dl in men and/or HDL-C <50 mg/d in women (20).
Alcohol intake was defined as consuming five or more alcoholic drinks for men or four or more alcoholic drinks for women on the same occasion (i.e., at the same time or within a couple of hours) on at least 1 day in the previous month. For cigarette smoking, those who had smoked any number of cigarettes in the last 12 months were considered current smokers, while those who had stopped smoking before 12 months were considered ex-smokers. For Body Mass Index, the WHO definition of obesity is based on the body mass index (BMI) of weight-for-height: underweight (<18.5 kg/m2), normal weight (18.5–24.9 kg/m2), overweight (25.0–29.9 kg/m2), and obesity (≥30 kg/m2) (21). Hypertension was defined as systolic blood pressure ≥140 mmHg, diastolic blood pressure ≥90 mmHg, or those taking anti-hypertensive drugs (22).
Data collection and laboratory methods
Socio-demographic characteristics and behavioral and health-related variables were collected using a structured and semi-structured questionnaire. Physical examinations, including measurements of height and weight, were performed by trained nurses to collect anthropometric data. Height (in meters) was measured using a stadiometer, and weight (in kilograms) was measured using a weighing scale in light clothing without shoes. BMI was calculated as weight in kilogram divided by height meter squared (kg/m2) (21).
Morning venous blood samples were collected after an overnight fast. The clotted blood samples were then centrifuged for 5 min at 3,000 rpm. The lipid panel testing utilized enzymatic colorimetric assays to measure serum glucose, total cholesterol, and triglycerides. HDL-c and LDL-c were measured using homogeneous assays, which selectively quantify HDL-c and LDL-c by selective solubilization or precipitating non-LDL-c and HDL-c and detection through spectrophotometry using a Dimension EXL Siemens clinical chemistry automation. Additionally, the stool antigen H. pylori Rapid Card™ InstaTest was used to diagnose H. pylori infection.
Statistical analysis
The data were analyzed using SPSS version 25. Categorical variables were summarized using frequency and percentage, while continuous variables were presented as median and inter-quartile range. Mann–Whitney U-test was used for comparing continuous variables between groups using median and interquartile range. Multivariable logistic regression analysis was carried out to identify those factors statistically significant for MetS. Variables with a p-value < 0.25 in univariate analysis were included in the multivariable model (23). The Mann–Whitney U-test was used for comparing continuous variables between groups due to non-normal distributions, and logistic regression was employed for assessing associations between H. pylori status and MetS components.
Results
Sociodemographic characteristics
This study included 228 participants, with 114 H. pylori-positive and 114 H. pylori-negative individuals. Of the total, 116 (50.9%) were women, and the median (IQR) age was 31 (22, 40). The median (IQR) age of H. pylori-positive and H. pylori-negative study participants was 31 (22, 42) and 31 (20, 38) years, respectively (Table 1).
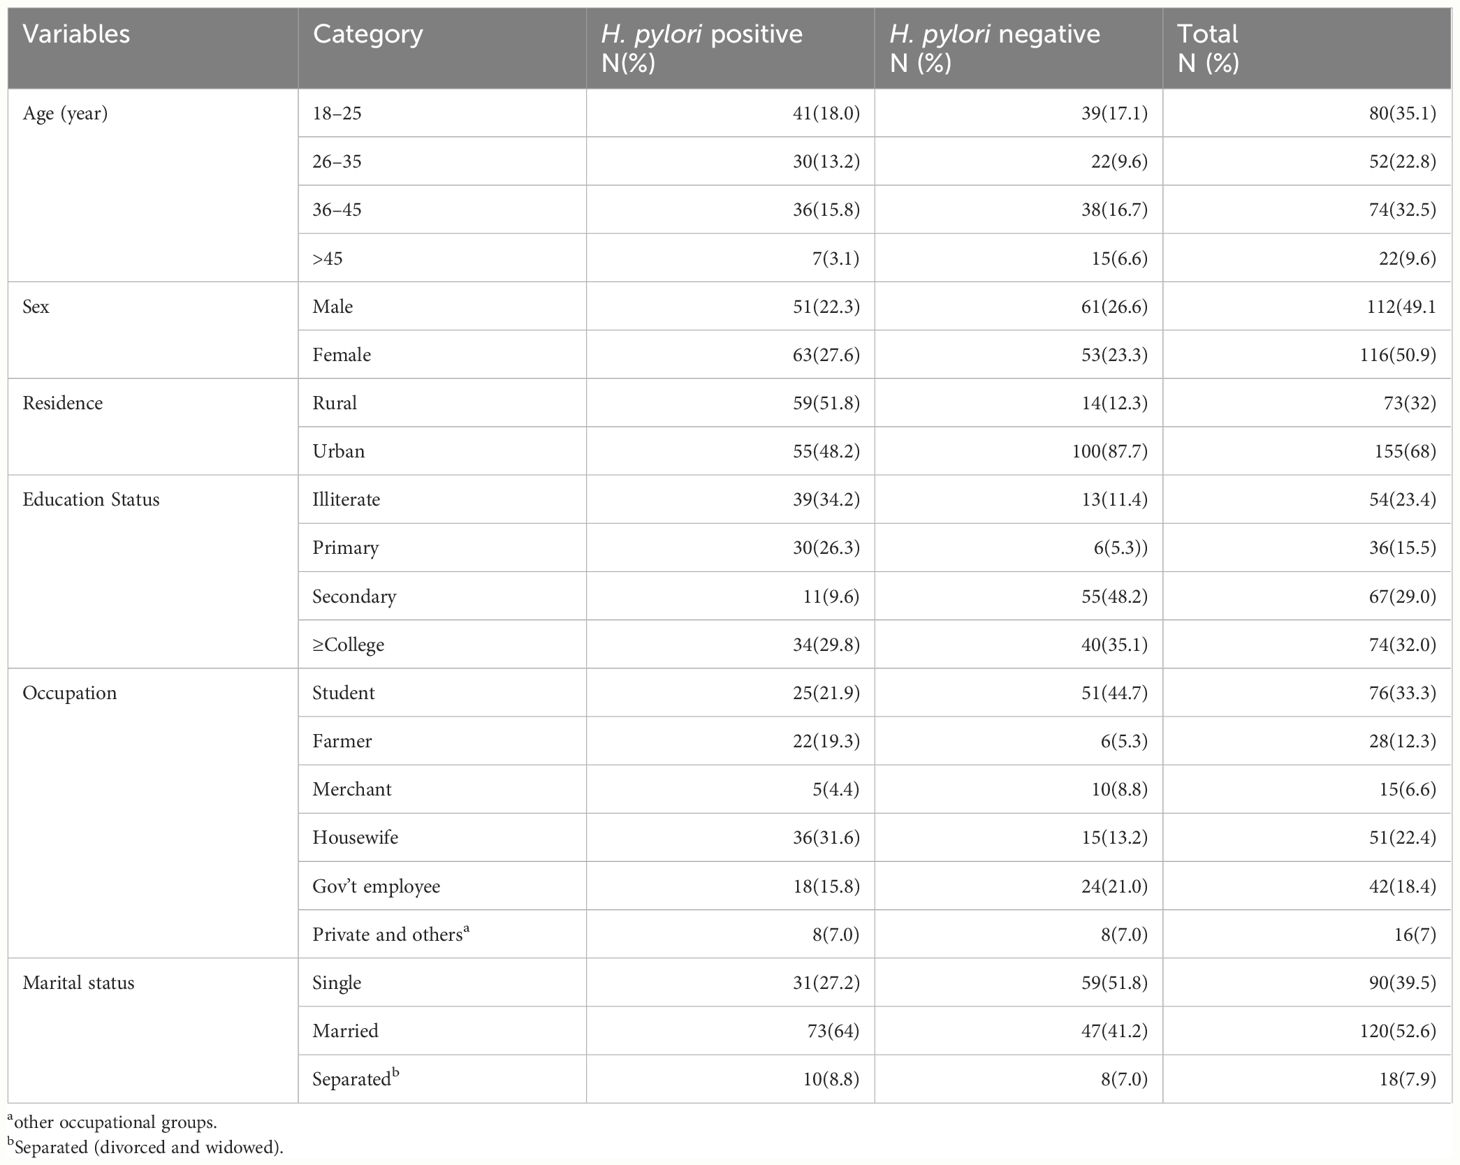
Table 1 Sociodemographic characteristics of study subjects (N=228, THMGH, Northeast Ethiopia, 2022).
Prevalence of the MetS and components
The overall prevalence of MetS was 53(23.2%) (95% CI, 17.9%–29.3%). The prevalence of MetS was 31 (27.2%; 95% CI, 19.3%–37.3%) and 22 (19.3%, 95% CI, 12.5%–27.7%) in H. pylori-infected patients and H. pylori-negative groups, respectively (Table 2). Of the study participants, 54 (23.7%) were hyperglycemic. The prevalence of hyperglycemia was 32 (28.1%) and 22 (19.3%) in the H. pylori-infected and H. pylori-negative groups, respectively. Low HDL-c 106(46.5%) and hypertriglycemia 54 (23.7%) were the two most common MetS components found among all study participants (Figure 1, Table 3). However, none of the participants reported smoking. In our study, female participants had a higher prevalence than male participants throughout the age group (Figure 2).
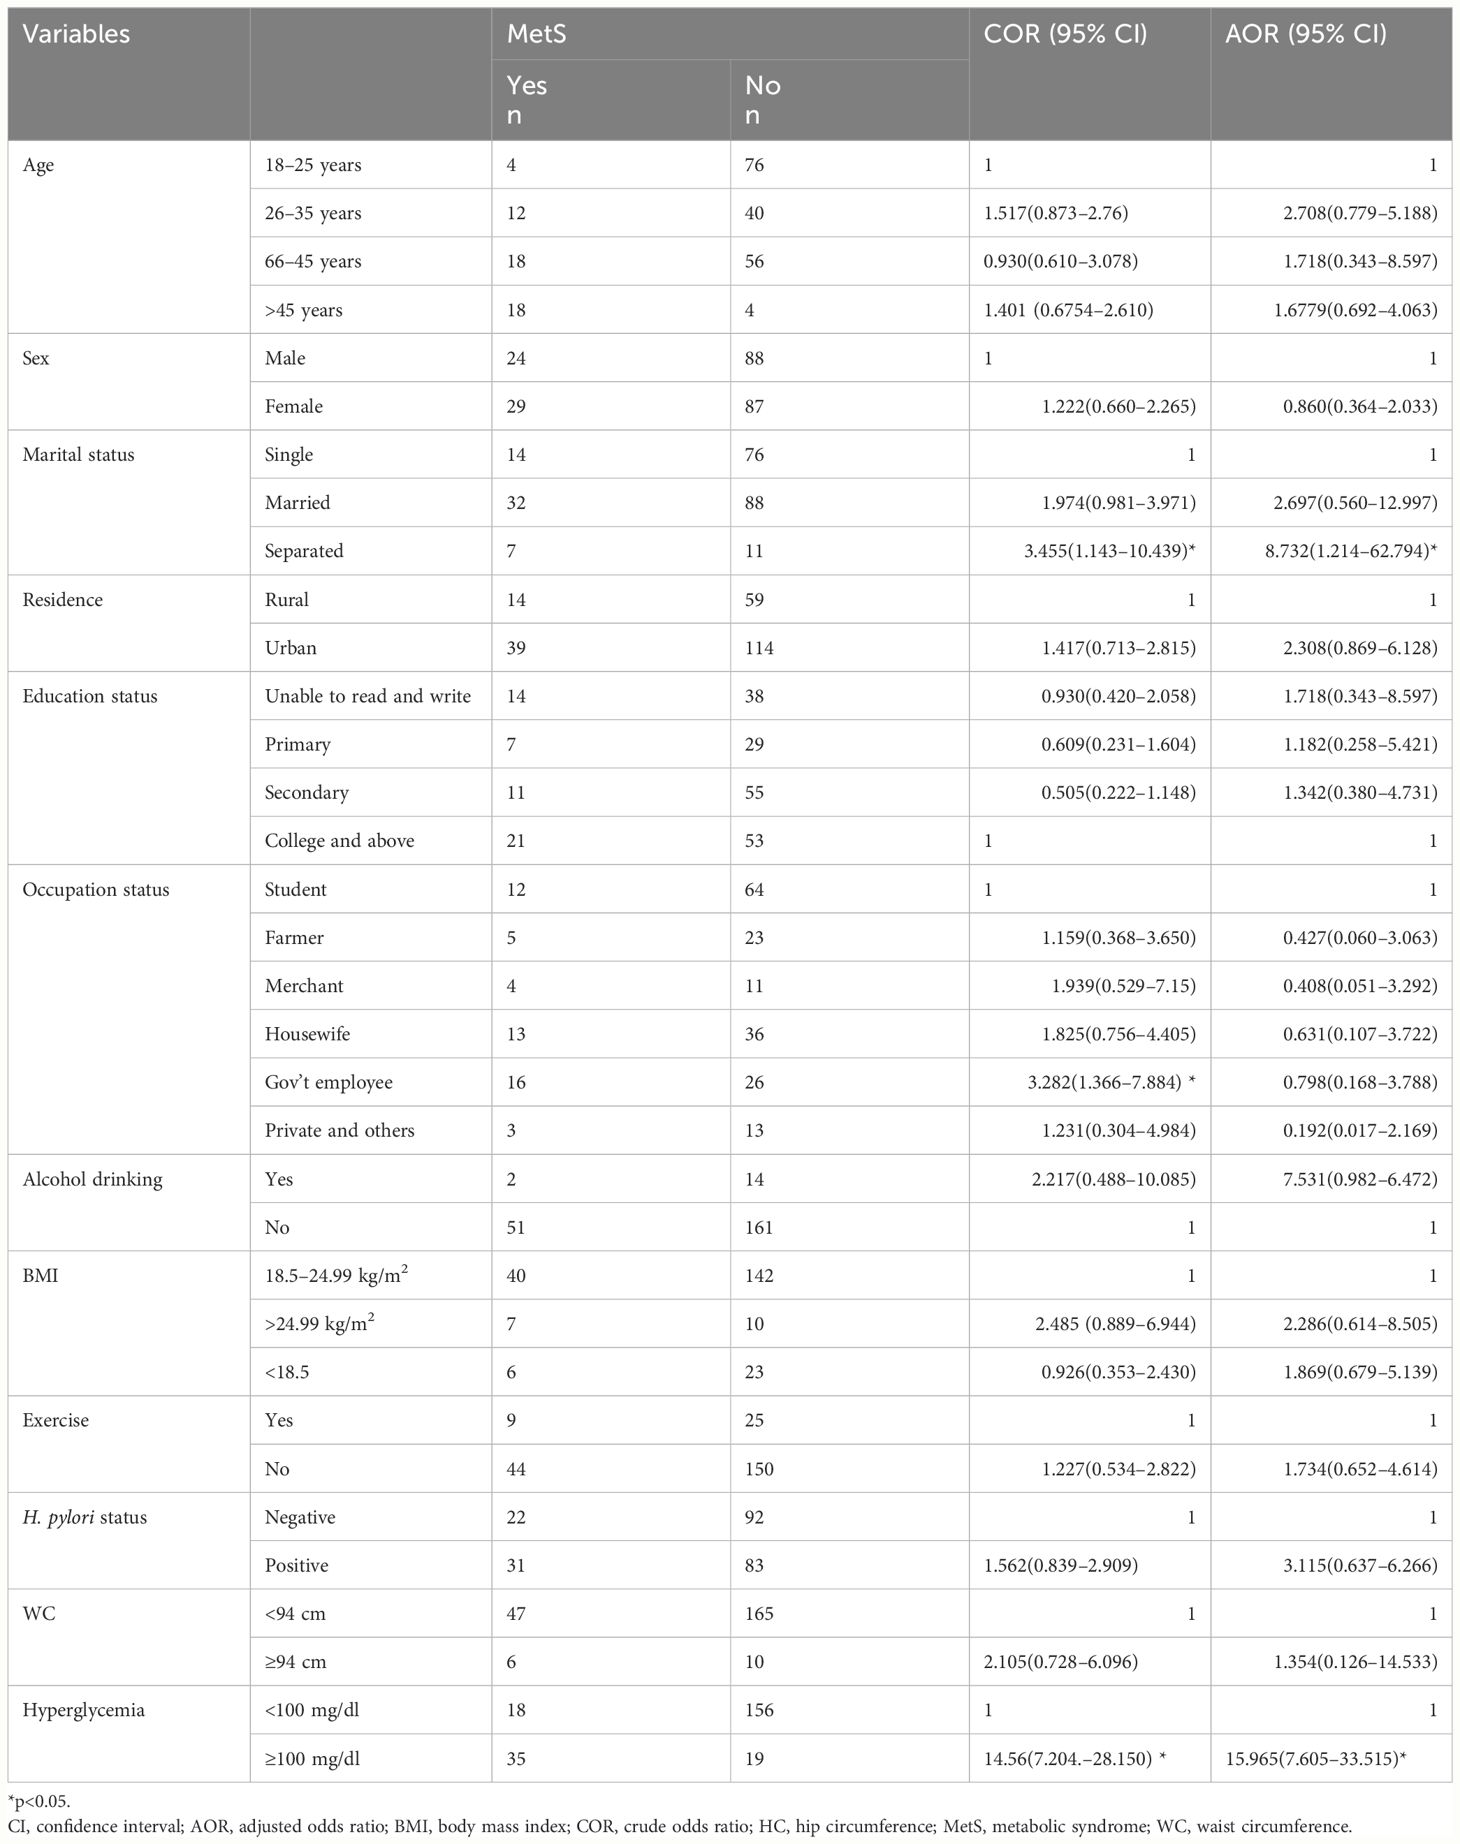
Table 2 Associated factors of MetS among study participants Northeast Ethiopia.
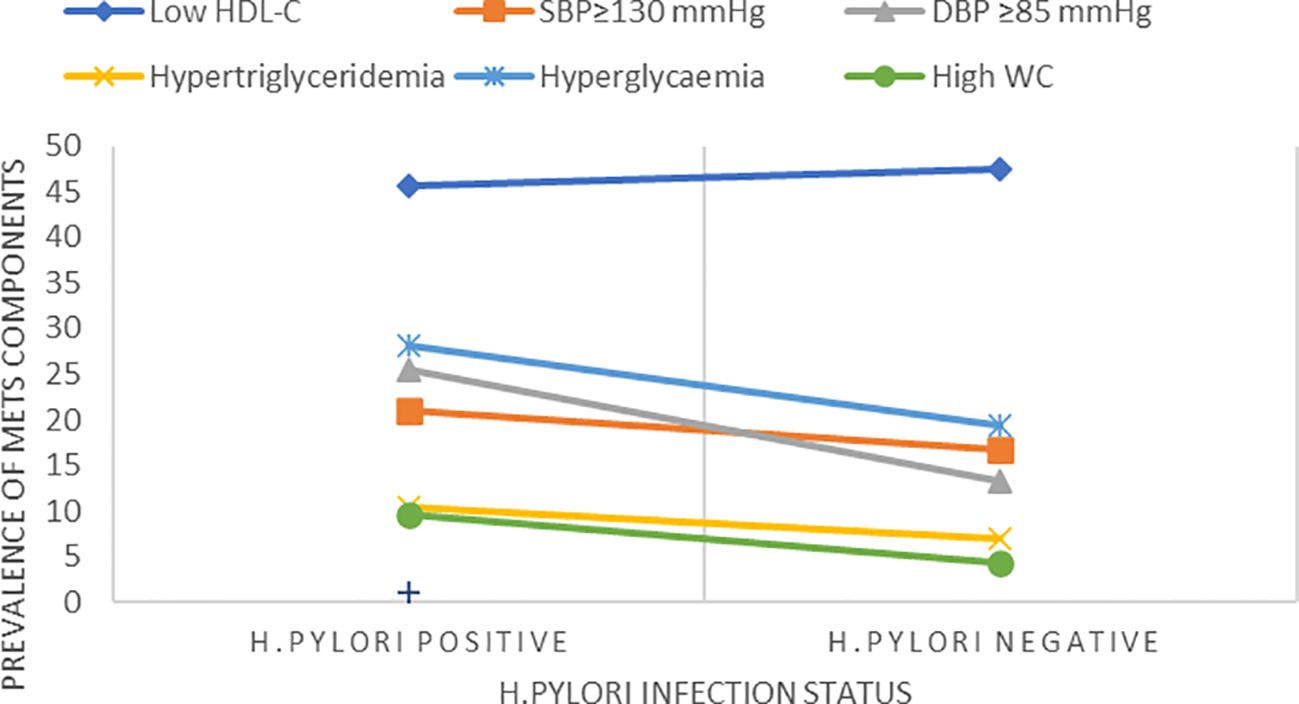
Figure 1 Prevalence of MetS components with H. pylori-positive and H. pylori-negative groups.
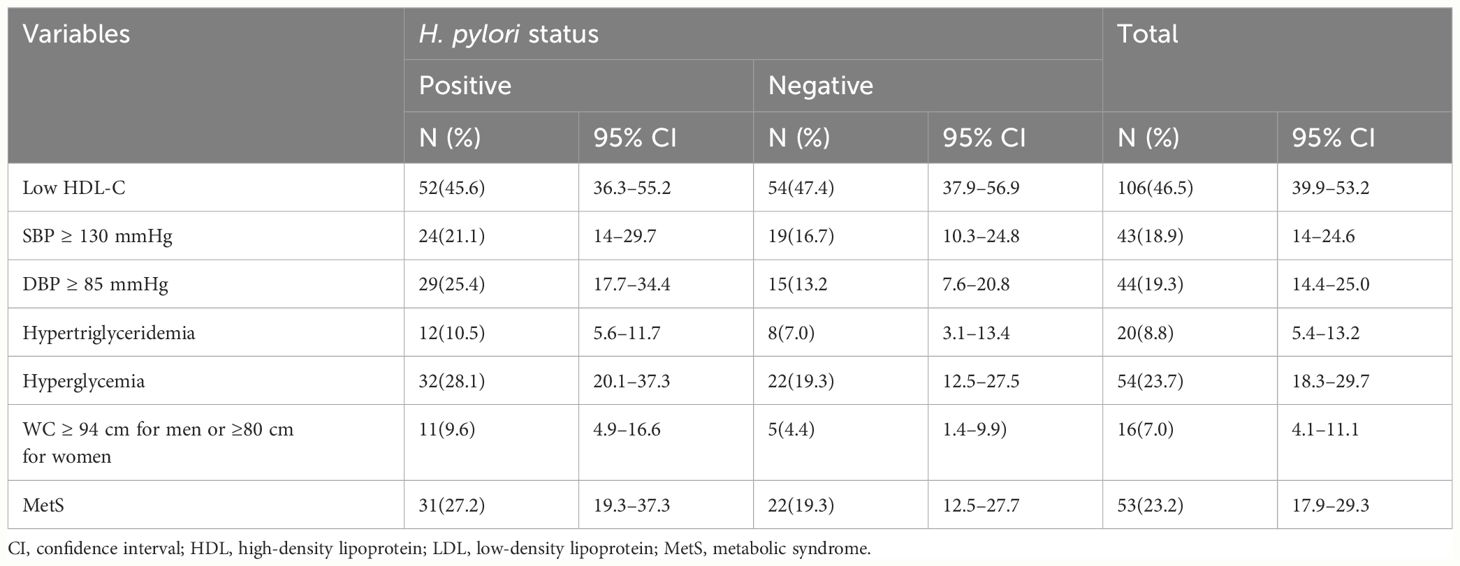
Table 3 MetS among H. pylori-positive and H. pylori-negative patients (N=228 at THMGH, Northeast Ethiopia, 2022).
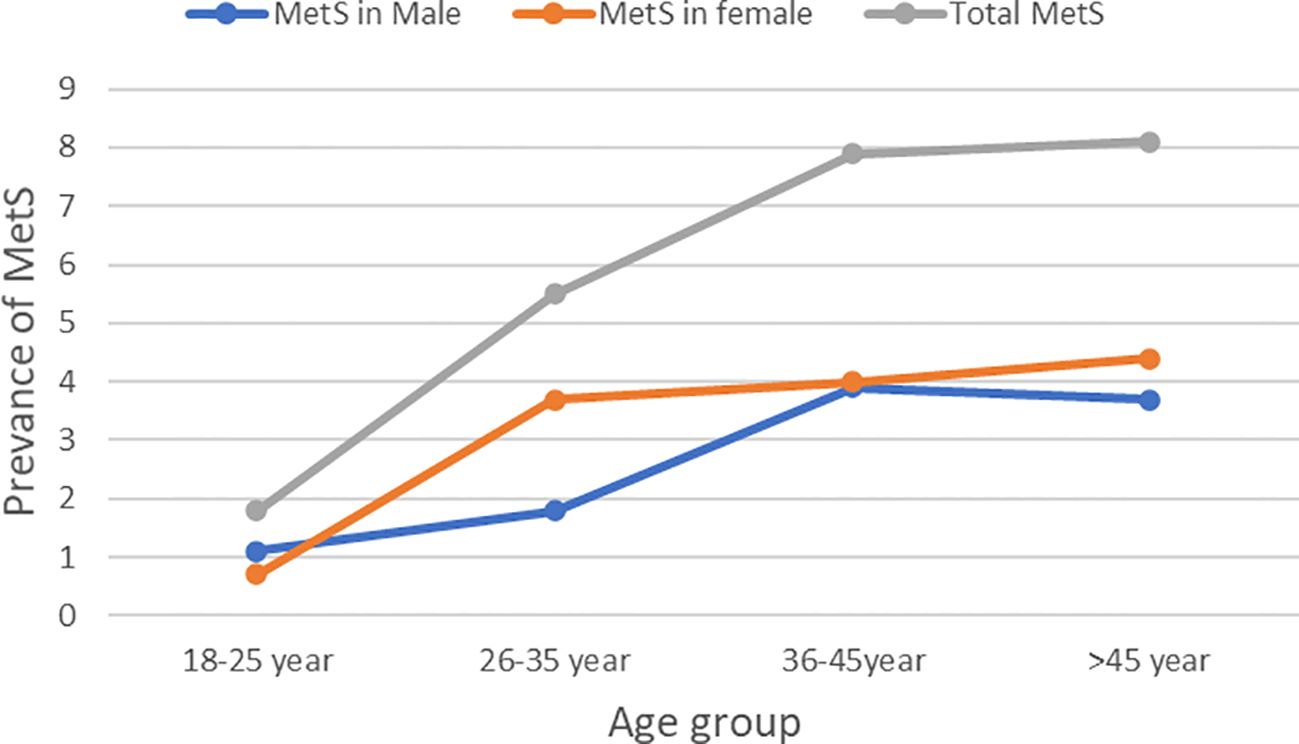
Figure 2 Prevalence of MetS in different age and gender.
Factors associated with MetS
In bivariate analysis, marital status, education status, occupation, and hyperglycemia were found to have statistically significant associations with MetS (p < 0.05). However, in the multivariable analysis, only fasting blood glucose (FPG) and marital status showed a statistically significant association with MetS. In addition, our analysis did not find a statistically significant association between H. pylori status and the frequency of metabolic syndrome (Table 2).
Biochemical and anthropometric comparisons
Participants with H. pylori infection had significantly higher median serum LDL-C (p < 0.001), TG (p = 0.036), TC (p < 0.001), and SBP (p <0.001) compared to H. pylori-negative participants (Table 4) and (Figure 3).
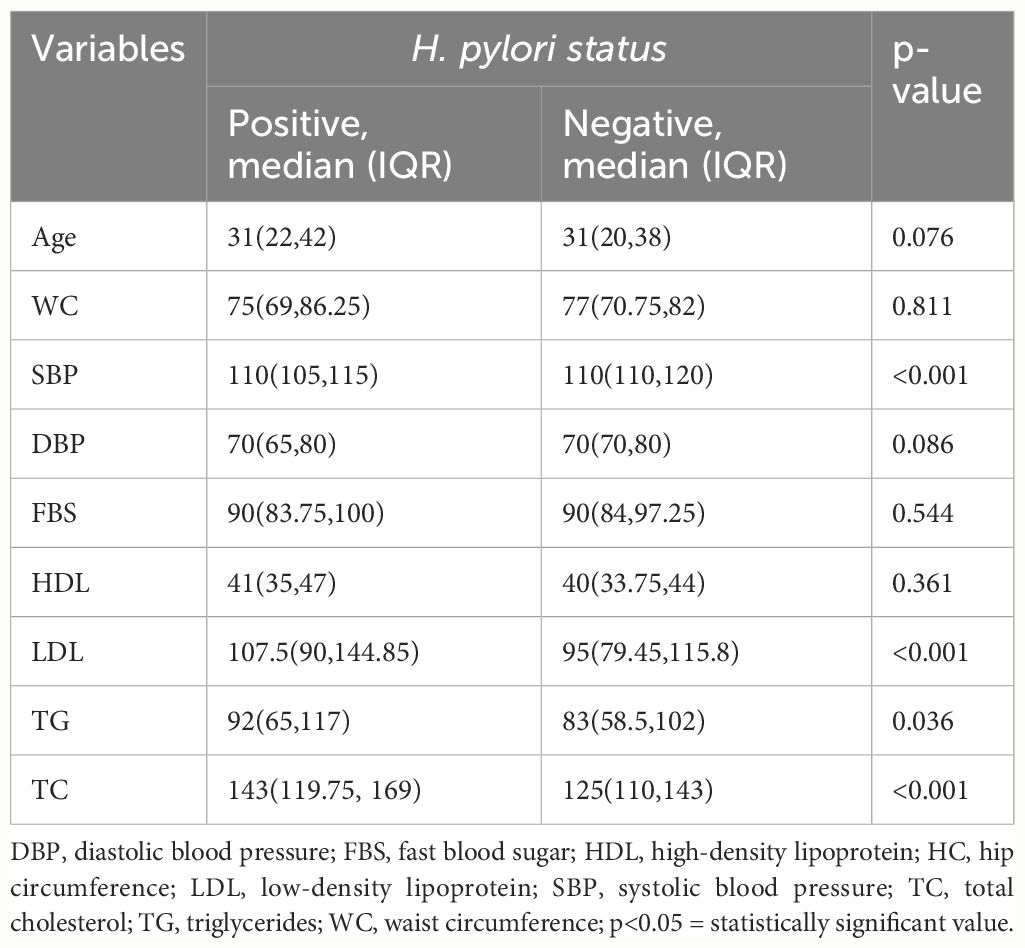
Table 4 Comparison of biochemical and anthropometric variables among H. pylori-positive and H. pylori-negative study participants (Mann–Whitney U test).
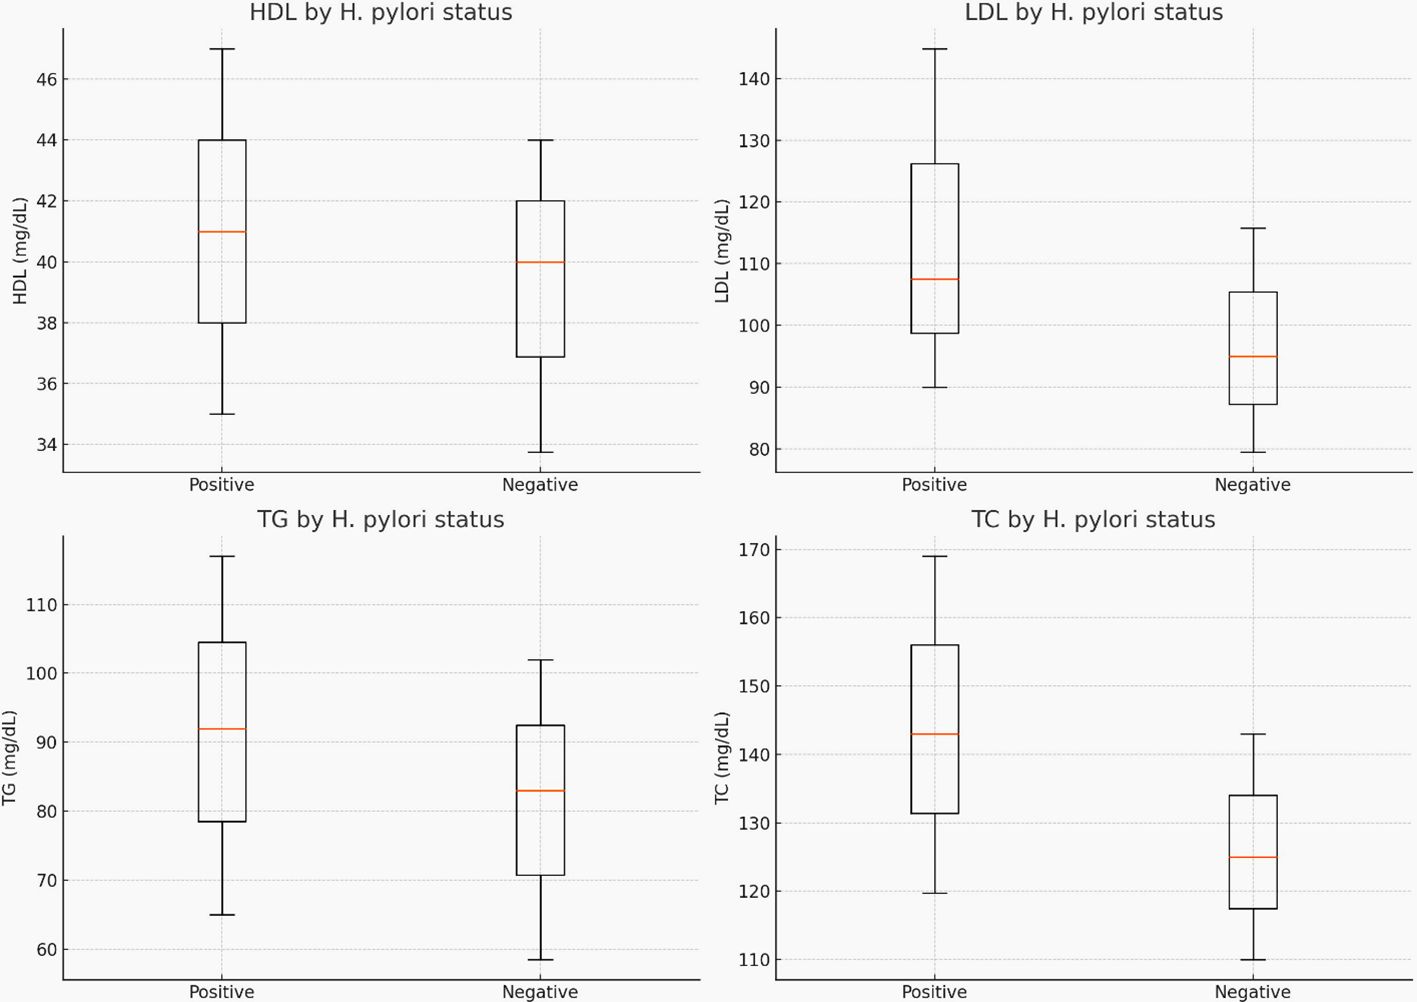
Figure 3 The median (IQR) for cholesterol, triglyceride, LDL-C, and HDL-C levels by H. pylori-infection status.
Discussion
The total prevalence of MetS among study participants was 23.2% (95% CI, 17.9–29.3), which was higher than a study conducted in Taiwan in 2015 (6.5%) (24). However, our findings were lower than those of a study conducted in the USA (47.8%) (25), in Lebanon in 2020 (37%) (17), and in China in 2016 (44.5%) (26). The observed variation in prevalence can be attributed to difference in the underlying important risk factors such as urbanization, westernization, lifestyle including unhealthy diet and physical inactivity, mental stress due to economic, social, and cultural factors (27, 28). The impact of intrauterine growth retardation, overnutrition, and a high prevalence of undernutrition further complicates this picture, reflecting the multifaceted nature of MetS risk factors (29).
The magnitude of MetS among H. pylori-positive study individuals was 27.2% (95% CI, 19.3–37.3), which aligns with a similar prevalence reported in Korea (25). However, the prevalence was lower than in Lebanon (46.5%) (17) and China (53.7%) (26) but higher than a study conducted in Taiwan (12.4%) (24). Among H. pylori-negative patients, the prevalence was 19.3% (95% CI, 12.5–27.7%), consistent with a Korean study that reported a prevalence of 21% (25) but lower than Chinese studies (44.8%) (30) and (53.7%) (26). These differences can be ascribed to lifestyle, population characteristics, study designs, eligibility criteria, and sample sizes.
In the current study, the odds of MetS among people with FPG levels ≥100 mg/dl were 15.965 times higher (AOR, 15.965; 95% CI, 7.605–33.515, p<0.001) than in those with FPG levels <100 mg/dl. This finding was consistent with studies in Jimma, Ethiopia (31) and Korea (25), suggesting that hyperglycemia, driven by insulin resistance, is a critical component of MetS. Insulin resistance impairs glucose uptake in peripheral tissues and increases hepatic glucose production, underscoring the importance of glycemic control in managing MetS risk. However, our analysis did not find a statistically significant association between H. pylori status and the frequency of metabolic syndrome. This suggests that other factors may play a more critical role in the development of metabolic syndrome.
The study reports a statistically significant difference in LDL-C and TC levels between H. pylori-positive and H. pylori-negative individuals, with no statistically significant difference in HDL-C levels. This may be due to the effect of H. pylori infection on lipid metabolism (32).
The higher median levels of LDL-C, TG, TC, and SBP among H. pylori-positive individuals compared to H. pylori-negative ones were consistent with findings from studies conducted in Iraq (33) and Japan (34). Additionally, a Turkish study found that H. pylori-infected patients had significantly higher TC levels compared to H. pylori-negative individuals. Furthermore, the H. pylori-positive group exhibited higher serum TG levels than H. pylori-negative individuals (35).
In addition, the current findings were supported by those of a study conducted in Sudan (36), China (37), Korea (38), and Korea (25), which found a statistical difference between patients and controls in TC, TG, and LDL-C values. This difference is believed to be due to a disturbance in food absorption in the digestive system, leading to changes in serum lipids. The impact of H. pylori infection on the inflammatory response system may contribute to these alterations in lipid profiles (39). Gram-negative bacteria like H. pylori contain LPS that triggers the release of high levels of cytokines (TNF-a and IL-6). These cytokines inhibit the action of lipoprotein lipase, leading to the mobilization of fat from tissues into the bloodstream and subsequently increasing serum lipid levels (40, 41).
However, these findings contradicted a study conducted in Finland (42), which found no significant difference in serum TC, LDL-C, and TG levels between H. pylori-positive and H. pylori-negative individuals, although a significant difference was observed in HDL-C levels. This discrepancy may be due to population-specific factors, different methodologies, or variations in the duration and severity of H. pylori infection.
The limitations of the study include the lack of controls for participants’ familiarity with metabolic syndrome and H. pylori infection, the exclusion of genetic factors, and the oversight in accounting for dietary habits, integral to metabolic health, may have confounded our results. Addressing these limitations in future studies is essential to offer a more holistic understanding of the relationship between H. pylori infection and metabolic syndrome.
Conclusion
This study found a high prevalence of MetS among dyspeptic patients, and hyperglycemia was a significant associated factor. SBP, LDL-c, TG, and TC showed a significant difference between H. pylori-positive and H. pylori-negative individuals. These findings suggest that H. pylori infection causes lipid metabolism disorders that increase the risk of cardiovascular diseases. This emphasizes the need for healthcare providers to consider H. pylori status when assessing cardiovascular risk and to incorporate lipid profile monitoring into the management plan for these patients.
Data availability statement
The original contributions presented in the study are included in the article/supplementary material. Further inquiries can be directed to the corresponding author.
Ethics statement
The studies involving humans were approved by the Ethical review committee of the College of Health Sciences, Woldia University with reference number WU/CHSEC/1235/22. The studies were conducted in accordance with the local legislation and institutional requirements. The participants provided their written informed consent to participate in this study.
Author contributions
DA: Conceptualization, Data curation, Formal analysis, Funding acquisition, Investigation, Methodology, Project administration, Resources, Software, Supervision, Validation, Visualization, Writing – original draft, Writing – review & editing. MN: Conceptualization, Data curation, Formal analysis, Funding acquisition, Investigation, Methodology, Project administration, Resources, Software, Supervision, Validation, Visualization, Writing – original draft, Writing – review & editing. TM: Data curation, Investigation, Methodology, Project administration, Resources, Validation, Visualization, Writing – original draft, Writing – review & editing. EA: Conceptualization, Investigation, Methodology, Project administration, Resources, Software, Supervision, Validation, Writing – original draft, Writing – review & editing. AA: Conceptualization, Data curation, Investigation, Software, Supervision, Validation, Visualization, Writing – original draft, Writing – review & editing. AW: Conceptualization, Data curation, Formal analysis, Funding acquisition, Investigation, Resources, Software, Validation, Visualization, Writing – original draft, Writing – review & editing.
Funding
The author(s) declare that no financial support was received for the research, authorship, and/or publication of this article.
Acknowledgments
The authors acknowledge the study participants, Tefera Hailu Memorial General Hospital, Amdework Primary Hospital, and the data collectors for their material and reagent support and cooperation.
Conflict of interest
The authors declare that the research was conducted in the absence of any commercial or financial relationships that could be construed as a potential conflict of interest.
Publisher’s note
All claims expressed in this article are solely those of the authors and do not necessarily represent those of their affiliated organizations, or those of the publisher, the editors and the reviewers. Any product that may be evaluated in this article, or claim that may be made by its manufacturer, is not guaranteed or endorsed by the publisher.
Abbreviations
BMI, body mass index; CRP, C-reactive protein; CI, confidence interval; FBS, fast blood sugar; H. pylori, helicobacter pylori; HDL-C, high-density lipoprotein cholesterol; IQR, inter-quartile range; LDL-C, low density lipoprotein cholesterol; MetS, metabolic syndrome; TNF, tumor necrosis factor; OR, odds ratio; SST, serum separator tube; SPSS, statistical package for social science; THMGH, Tefera Hailu Memorial General Hospital; TGs, triglycerides; TC, total cholesterol; WHO, World Health Organization.
References
1. Samson SL, Garber AJ. Metabolic syndrome. Endocrinol Metab Clinics North America. (2014) 43:1–23. doi: 10.1016/j.ecl.2013.09.009
2. Giudice A, Crispo A, Massimiliano G, D'Arena G, Tecce MF, Grimaldi M, et al. Metabolic syndrome, insulin resistance, circadian disruption, antioxidants and pancreatic carcinoma: an overview. J gastrointestinal liver Dis JGLD. (2014) 23:73–7. doi: 10.15403/jgld-1282
3. Naja F, Nasreddine L, Itani L, Adra N, Sibai AM, Hwalla N. Association between dietary patterns and the risk of metabolic syndrome among Lebanese adults. Eur J Nutr. (2013) 52:97–105. doi: 10.1007/s00394-011-0291-3
4. McColl KE. Clinical practice. Helicobacter pylori infection. New Engl J Med. (2010) 362:1597–604. doi: 10.1056/NEJMcp1001110
5. Oshima T, Ozono R, Yano Y, Oishi Y, Teragawa H, Higashi Y, et al. Association of Helicobacter pylori infection with systemic inflammation and endothelial dysfunction in healthy male subjects. J Am Coll Cardiol. (2005) 45:1219–22. doi: 10.1016/j.jacc.2005.01.019
6. Vafaeimanesh J, Bagherzadeh M, Mirzaei A, Parham M, Norouzinia M, Vafaee R. Effect of Helicobacter pylori on metabolic syndrome parameters in diabetic patients. Gastroenterol Hepatol bed to bench. (2016) 9:S36–s41.
7. Barter P, Gotto AM, LaRosa JC, Maroni J, Szarek M, Grundy SM, et al. HDL cholesterol, very low levels of LDL cholesterol, and cardiovascular events. New Engl J Med. (2007) 357:1301–10. doi: 10.1056/NEJMoa064278
8. Ferreira-Hermosillo A, Molina-Ayala M, Ramírez-Rentería C, Vargas G, Gonzalez B, Isibasi A, et al. Inflammatory cytokine profile associated with metabolic syndrome in adult patients with type 1 diabetes. J Diabetes Res. (2015) 2015:972073. doi: 10.1155/2015/972073
9. Albaker WI. Helicobacter pylori infection and its relationship to metabolic syndrome: is it a myth or fact? Saudi J Gastroenterol. (2011) 17:165–9. doi: 10.4103/1319-3767.80377
10. Kusters JG, van Vliet AH, Kuipers EJ. Pathogenesis of Helicobacter pylori infection. Clin Microbiol Rev. (2006) 19:449–90. doi: 10.1128/CMR.00054-05
11. Klok MD, Jakobsdottir S, Drent ML. The role of leptin and ghrelin in the regulation of food intake and body weight in humans: a review. Obes Rev. (2007) 8:21–34. doi: 10.1111/j.1467-789X.2006.00270.x
12. Kalra SP, Ueno N, Kalra PS. Stimulation of appetite by ghrelin is regulated by leptin restraint: peripheral and central sites of action. J Nutr. (2005) 135:1331–5. doi: 10.1093/jn/135.5.1331
13. Kim HL, Jeon HH, Park IY, Choi JM, Kang JS, Min KW. Helicobacter pylori infection is associated with elevated low density lipoprotein cholesterol levels in elderly Koreans. J Korean Med science. (2011) 26:654–8. doi: 10.3346/jkms.2011.26.5.654
14. Jinjuvadia R, Antaki F, Lohia P, Liangpunsakul S. The association between nonalcoholic fatty liver disease and metabolic abnormalities in the United States population. J Clin gastroenterology. (2017) 51:160–6. doi: 10.1097/MCG.0000000000000666
15. Lim S, Shin H, Song JH, Kwak SH, Kang SM, Won Yoon J, et al. Increasing prevalence of metabolic syndrome in Korea: the Korean National Health and Nutrition Examination Survey for 1998-2007. Diabetes Care. (2011) 34:1323–8. doi: 10.2337/dc10-2109
16. Christodoulou DK, Milionis HJ, Pappa P, Katsanos KH, Sigounas D, Florentin M, et al. Association of Helicobacter pylori infection with cardiovascular disease–is it just a myth? Eur J Intern Med. (2011) 22:191–4. doi: 10.1016/j.ejim.2010.11.010
17. Naja F, Nasreddine L, Hwalla N, Moghames P, Shoaib H, Fatfat M, et al. Association of H. pylori infection with insulin resistance and metabolic syndrome among Lebanese adults. Helicobacter. (2012) 17:444–51. doi: 10.1111/j.1523-5378.2012.00970.x
18. Tamura T, Morita E, Kawai S, Sasakabe T, Sugimoto Y, Fukuda N, et al. No association between Helicobacter pylori infection and diabetes mellitus among a general Japanese population: a cross-sectional study. SpringerPlus. (2015) 4:602. doi: 10.1186/s40064-015-1371-2
19. Grundy SM, Cleeman JI, Daniels SR, Donato KA, Eckel RH, Franklin BA, et al. Diagnosis and management of the metabolic syndrome: an American Heart Association/National Heart, Lung, and Blood Institute Scientific Statement. Circulation. (2005) 112:2735–52. doi: 10.1161/CIRCULATIONAHA.105.169404
20. Executive summary of the third report of the national cholesterol education program (NCEP) expert panel on detection, evaluation, and treatment of high blood cholesterol in adults (Adult treatment panel III). Jama. (2001) 285:2486–97. doi: 10.1001/jama.285.19.2486
21. Flegal KM, Graubard BI, Williamson DF, Gail MH. Cause-specific excess deaths associated with underweight, overweight, and obesity. Jama. (2007) 298:2028–37. doi: 10.1001/jama.298.17.2028
22. Whelton PK, Carey RM, Aronow WS, Casey DE Jr., Collins KJ, Dennison Himmelfarb C, et al. 2017 ACC/AHA/AAPA/ABC/ACPM/AGS/APhA/ASH/ASPC/NMA/PCNA guideline for the prevention, detection, evaluation, and management of high blood pressure in adults: a report of the American college of cardiology/American heart association task force on clinical practice guidelines. Hypertension (Dallas Tex 1979). (2018) 71:e13–e115. doi: 10.1016/j.jacc.2017.11.006
23. Bursac Z, Gauss CH, Williams DK, Hosmer DW. Purposeful selection of variables in logistic regression. Source Code Biol Med. (2008) 3:17. doi: 10.1186/1751-0473-3-17
24. Chen TP, Hung HF, Chen MK, Lai HH, Hsu WF, Huang KC, et al. Helicobacter pylori infection is positively associated with metabolic syndrome in Taiwanese adults: a cross-sectional study. Helicobacter. (2015) 20:184–91. doi: 10.1111/hel.12190
25. Lim SH, Kim N, Kwon JW, Kim SE, Baik GH, Lee JY, et al. Positive association between helicobacter pylori infection and metabolic syndrome in a Korean population: a multicenter nationwide study. Dig Dis Sci. (2019) 64:2219–30. doi: 10.1007/s10620-019-05544-3
26. Yang W, Xuan C. Influence of helicobacter pylori infection on metabolic syndrome in old Chinese people. Gastroenterol Res practice. (2016) 2016:6951264. doi: 10.1155/2016/6951264
27. Łopuszańska UJ, Skorzyńska-Dziduszko K, Lupa-Zatwarnicka K, Makara-Studzińska M. Mental illness and metabolic syndrome–a literature review. Ann Agric Environ Med AAEM. (2014) 21:815–21. doi: 10.5604/12321966.1129939
28. Kubota M, Yoneda M, Maeda N, Ohno H, Oki K, Funahashi T, et al. Westernization of lifestyle affects quantitative and qualitative changes in adiponectin. Cardiovasc diabetology. (2017) 16:83. doi: 10.1186/s12933-017-0565-z
29. Desai M, Babu J, Ross MG. Programmed metabolic syndrome: prenatal undernutrition and postweaning overnutrition. Am J Physiol Regulatory Integr Comp Physiol. (2007) 293:R2306–14. doi: 10.1152/ajpregu.00783.2006
30. Yu Y, Cai J, Song Z, Wang J, Wu L. Association of Helicobacter pylori infection with metabolic syndrome in aged Chinese females. Exp Ther Med. (2019) 17:4403–8. doi: 10.3892/etm
31. Abdu A, Cheneke W, Adem M, Belete R, Getachew A. Dyslipidemia and Associated Factors Among Patients Suspected to Have Helicobacter pylori Infection at Jimma University Medical Center, Jimma, Ethiopia. Int J Gen Med. (2020) 13:311–21. doi: 10.2147/IJGM.S243848
32. Murray LJ, Bamford KB, O'Reilly DP, McCrum EE, Evans AE. Helicobacter pylori infection: relation with cardiovascular risk factors, ischaemic heart disease, and social class. Br Heart J. (1995) 74:497–501. doi: 10.1136/hrt.74.5.497
33. Moutar FT, Alsamarai AM, Ibrahim F. Lipid profile in patients with gastritis. World J Pharm Pharm Sci. (2016) 5:74–90. doi: 10.20959/wjpps20167-6122
34. Shimamoto T, Yamamichi N, Gondo K, Takahashi Y, Takeuchi C, Wada R, et al. The association of Helicobacter pylori infection with serum lipid profiles: An evaluation based on a combination of meta-analysis and a propensity score-based observational approach. PloS One. (2020) 15:e0234433. doi: 10.1371/journal.pone.0234433
35. Al-Fawaeir S, Zaid MA, Awad AA, Alabedallat B. Serum lipid profile in Helicobacter pylori infected patients. Am J Physiol Biochem Pharmacol. (2013) 2:1–4. doi: 10.5455/jib.20130603084538.
36. Ali MAE. Assessment of serum high sensitivity C-reactive protein, lipid profile and magnesium among Sudanese Patients with H. pylori Infection. Khartoum State) Sudan Univ Sci Technol. (2019).
37. Gong Y, Wei W, Jingwei L, Nannan D, Yuan Y. Helicobacter pylori infection status correlates with serum parameter levels responding to multi-organ functions. Dig Dis Sci. (2015) 60:1748–54. doi: 10.1007/s10620-015-3522-2
38. Kim TJ, Lee H, Kang M, Kim JE, Choi YH, Min YW, et al. Helicobacter pylori is associated with dyslipidemia but not with other risk factors of cardiovascular disease. Sci Rep. (2016) 6:38015. doi: 10.1038/srep38015
39. Khovidhunkit W, Kim MS, Memon RA, Shigenaga JK, Moser AH, Feingold KR, et al. Effects of infection and inflammation on lipid and lipoprotein metabolism: mechanisms and consequences to the host. J Lipid Res. (2004) 45:1169–96. doi: 10.1194/jlr.R300019-JLR200
40. Sung KC, Rhee EJ, Ryu SH, Beck SH. Prevalence of Helicobacter pylori infection and its association with cardiovascular risk factors in Korean adults. Int J Cardiol. (2005) 102:411–7. doi: 10.1016/j.ijcard.2004.05.040
41. Grunfeld C, Gulli R, Moser AH, Gavin LA, Feingold KR. Effect of tumor necrosis factor administration in vivo on lipoprotein lipase activity in various tissues of the rat. J Lipid Res. (1989) 30:579–85. doi: 10.1016/S0022-2275(20)38349-8
Keywords: metabolic syndrome, H. pylori infection, associated factors, cross-sectional study, controls
Citation: Asmelash D, Nigatie M, Melak T, Alemayehu E, Ashagre A and Worede A (2024) Metabolic syndrome and associated factors among H. pylori-infected and negative controls in Northeast Ethiopia: a comparative cross-sectional study. Front. Endocrinol. 15:1358411. doi: 10.3389/fendo.2024.1358411
Received: 19 December 2023; Accepted: 27 June 2024;
Published: 16 July 2024.
Edited by:
Gaetano Santulli, Albert Einstein College of Medicine, United StatesReviewed by:
Giovanni Mario Pes, University of Sassari, ItalySasikala Muthusamy, Brigham and Women’s Hospital and Harvard Medical School, United States
Copyright © 2024 Asmelash, Nigatie, Melak, Alemayehu, Ashagre and Worede. This is an open-access article distributed under the terms of the Creative Commons Attribution License (CC BY). The use, distribution or reproduction in other forums is permitted, provided the original author(s) and the copyright owner(s) are credited and that the original publication in this journal is cited, in accordance with accepted academic practice. No use, distribution or reproduction is permitted which does not comply with these terms.
*Correspondence: Daniel Asmelash, RGFuaWVsLmFzbWVsYXNoMTExQGdtYWlsLmNvbQ==
†These authors share first authorship