Abstract
Purpose:
The ratio of monocyte to high-density lipoprotein cholesterol (MHR) has surfaced as a novel biomarker indicative of inflammation and oxidative stress. The aim of our study was to evaluate the association between MHR and the risk of kidney stones.
Methods:
This study analyzed data from individuals aged 20-79 who participated in the National Health and Nutrition Examination Survey (NHANES) between 2007 and 2018. The MHR was assessed as the exposure variable, while a self-reported history of kidney stones was used as the outcome variable. The independent relationship between MHR and the risk of kidney stones was thoroughly evaluated.
Results:
This study included 28,878 participants, and as the quartile range of the MHR increased, the proportion of kidney stones also rose progressively (7.20% to 8.89% to 10.88% to 12.05%, P<0.001). After adjusting for confounding factors, MHR was independently associated with an increased risk of kidney stones (OR=1.31, 95%CI=1.11-1.54, P=0.001), also independent of some common inflammatory indices. Subgroup analysis suggested that the relationship between MHR and kidney stones was more pronounced in female and individuals aged 20-49. Further restricted cubic spline (RCS) analysis indicated a nonlinear relationship between MHR and the risk of kidney stones.
Conclusion:
Our results indicate a positive correlation between MHR and an increased risk of kidney stones in US adults, underscoring the need for further large-scale prospective cohort studies to validate these findings.
1 Introduction
Kidney stones, a widespread urologic condition, arise from the conglomeration of crystalline minerals and organic molecules within the kidneys or urinary tract (1). The prevalence of the condition has risen significantly, with current global estimates at approximately 10% (2–5). Individuals with kidney stones commonly report a spectrum of discomforts, including pain in the lower back, hematuria, frequent urination, urgency to urinate, and painful urination. If left unaddressed, kidney stones can lead to severe complications, including obstruction of the ureter, infections in the urinary system, and potentially, kidney failure (6). The necessity of surgical procedures for the removal of kidney stones presents a significant economic impact and heightens public health concerns (1).
The development of kidney stones is intertwined with an array of inflammatory responses. Past clinical studies have highlighted some certain inflammatory markers, including the systemic immune-inflammation index (SII) and neutrophil to lymphocyte ratio (NLR), act as predictive biomarkers for the presence of kidney stones (7–9). Monocytes play a pivotal role in the innate immune response, orchestrating the elevation of pro-inflammatory cytokines (10). Concurrently, high-density lipoprotein cholesterol (HDL-c, mmol/L) is recognized for its antioxidative and anti-inflammatory properties (11–13). Previous studies demonstrated HDL-c has the capacity to mitigate and counteract monocyte activation via the inhibition of CD11b, mediated by apolipoprotein A-I (apoA-I) (14). The ratio of monocytes to HDL-c (MHR) has emerged as a potential novel indicator of the balance between the inflammatory and oxidative stress (15).
To date, there is a lack of research examining the link between MHR and the risk of kidney stones. This study, drawing on data from the National Health and Nutrition Examination Survey (NHANES), aims to elegantly dissect the potential association between MHR and the kidney stone risk through a comprehensive cross-sectional analysis.
2 Materials and methods
2.1 Data source
This population-based study drew upon data from the NHANES, a comprehensive survey conducted by the National Center for Health Statistics of the Centers for Disease Control and Prevention. NHANES employed a rigorous randomized, stratified, multi-stage survey methodology to ensure nationwide representation. Participants underwent thorough physical examinations, health, and nutrition questionnaires, as well as laboratory assessments (16, 17). The NHANES study protocol received approval from the Ethics Review Board of the National Center for Health Statistics. Detailed design and data from this study could be accessed at https://www.cdc.gov/nchs/nhanes/. The current study included a total of 28,878 eligible participants, obtained by consolidating data from the NHANES cycles: 2007–2008, 2009–2010, 2011–2012, 2013-2014, 2015-2016, and 2017-2018, encompassing 59,842 participants. All participants were aged between 20 and 79 years, were not pregnant, had complete data of MHR, and provided comprehensive questionnaire records on kidney stone.
2.2 Exposure and outcome definitions
The MHR, serving as an exposure variable, is defined as the quotient of monocyte count to HDL-c levels, with units in 10^9/L and mmol/L, respectively. Three typical indices associated with inflammatory response were also used to represent the effect of inflammation on kidney stones (7, 8, 18). The SII, NLR, and platelet to lymphocyte ratio (PLR) were calculated using the following formulas: SII = platelet x neutrophil/lymphocyte (10^9/L), NLR = neutrophil/lymphocyte (10^9/L), and PLR = platelet/lymphocyte (10^9/L). The assessment of the history of kidney stones, which served as the outcome variable, was determined by asking the question, “Have you or the sample person (SP) ever had a kidney stone?” (ID: KIQ026). Individuals who responded “yes” were categorized as having kidney stones, while those who responded “no” were classified as not having kidney stones. The reliability of self-reported kidney stone history has been established in previous studies (3, 4, 7, 19–21).
2.3 Covariate definitions
Demographic data (age, gender, and race) was obtained, along with various potential covariates such as annual household income, educational level, smoking status, hypertension, diabetes, cardiovascular disease, body mass index (BMI, kg/m2), alanine transaminase (ALT, U/L), aspartate transaminase (AST, U/L), gamma-glutamyl transferase (GGT, U/L), glycohemoglobin, triglycerides (TG, mmol/L), total cholesterol (TC, mmol/L), low-density lipoprotein cholesterol (LDL-c, mmol/L), blood urea nitrogen (BUN, mmol/L), serum creatinine (Scr, μmol/L), and serum uric acid (SUA, μmol/L). BMI is categorized as follows: <25 kg/m2 (normal weight), 25-29.9 kg/m2 (overweight), ≥30 kg/m2 (obesity). Smokers were identified as current or former smokers. Additionally, self-reported diabetes, hypertension, and cardiovascular disease were recorded. The presence of cardiovascular disease was determined based on self-reported history of heart attack, stroke, congestive heart failure, coronary artery disease, or angina. Comprehensive measurement procedures for all variables were publicly accessible in the NHANES database.
2.4 Statistical analysis
The statistical analyses adhered to the Centers for Disease Control and Prevention guidelines, using a complex multistage cluster survey design and weights from six cycles. Continuous variables were presented as means with standard errors (SE), and categorical variables as percentages. The weighted Student’s t-test and chi-squared test compared continuous and categorical variables across groups, respectively. Weighted logistic regression models were used to investigate the associations between monocytes, HDL-c, and MHR (both continuous and quartile) with the risk of kidney stones. Three common models were used: Model 1 was unadjusted; Model 2 adjusted for age, gender, and race; and Model 3 additionally for annual household income, education level, smokers, hypertension, diabetes, cardiovascular disease, BMI, ALT, AST, GGT, glycohemoglobin, TG, BUN, Scr, and SUA. Furthermore, the impacts of SII, NLR, and PLR have been additionally adjusted based on Model 3. Decision curve analysis (DCA) was employed to evaluate the performance of MHR, SII, NLR, and PLR on kidney stone risk. Subgroup analysis was based on age, gender, race, BMI, hypertension, diabetes, and cardiovascular disease stratification. Finally, Restricted Cubic Spline (RCS) analysis further investigated the relationship between MHR and kidney stone risk. For observed non-linear correlations, a two-piecewise linear regression model was used to define intervals and identify threshold effects. All statistical analyses in this study were performed based on the Empower software (http://www.empowerstats.com) and R software (http://www.R-project.org). A P value < 0.05 was deemed statistically significant.
3 Results
3.1 Baseline characteristics of study population
The study included 28,878 participants aged 20 to 79 years, who were not pregnant, had complete MHR data, and provided comprehensive kidney stone questionnaire records. Among them, 2,663 individuals were diagnosed with kidney stones. The average age was 46.25 years, and males constituted 49.21% of the cohort. Table 1 delineates the comparative analysis of general characteristics and clinical indicators between those with and without kidney stones. The kidney stone group had higher average age, male ratio, BMI, and prevalence of smokers, hypertension, diabetes, and cardiovascular disease. Elevated biochemical levels included glycohemoglobin, GGT, TG, Scr, BUN, and SUA, monocytes, and neutrophils (P<0.05). Conversely, this group demonstrated lower levels of HDL-c (P<0.001). Significant differences in race distribution were also observed between the groups (P<0.001). Crucially, the kidney stone group exhibited higher levels of MHR, SII, and NLR compared to the non-kidney stone group.
Table 1
| Overall (N=28,878) |
Non-kidney stone (N=26,215) | Kidney stone (N=2,663) |
P value | |
|---|---|---|---|---|
| Age (years) | 46.25±0.23 | 45.65±0.24 | 51.80±0.31 | <0.001 |
| Male gender, % (SE) | 49.21 (0.32) | 48.60 (0.35) | 54.85 (1.42) | <0.001 |
| Race, % (SE) | <0.001 | |||
| Mexican American | 8.92 (0.78) | 9.20 (0.79) | 6.41 (0.76) | |
| Non-Hispanic Black | 10.88 (0.72) | 11.42 (0.74) | 5.84 (0.56) | |
| Non-Hispanic White | 65.87 (1.43) | 64.76 (1.44) | 76.13 (1.54) | |
| Other Hispanic | 6.07 (0.50) | 6.16 (0.50) | 5.28 (0.71) | |
| Other Races | 8.26 (0.46) | 8.46 (0.47) | 6.34 (0.69) | |
| Annual household income (under $20,000), % (SE) | 13.68 (0.52) | 13.66 (0.53) | 13.92 (0.87) | 0.732 |
| Education level (above high school), % (SE) | 61.80 (0.92) | 61.81 (0.93) | 61.69 (1.58) | 0.933 |
| Smokers, % (SE) | 44.37 (0.62) | 43.81 (0.63) | 49.47 (1.51) | <0.001 |
| Hypertension, % (SE) | 30.64 (0.52) | 29.00 (0.51) | 45.72 (1.44) | <0.001 |
| Diabetes, % (SE) | 9.50 (0.26) | 8.58 (0.27) | 17.96 (0.96) | <0.001 |
| Cardiovascular disease, % (SE) | 7.47 (0.23) | 6.71 (0.24) | 14.45 (0.94) | <0.001 |
| BMI (kg/m2) | 29.17±0.09 | 28.99±0.09 | 30.80±0.18 | <0.001 |
| ALT (U/L) | 25.53±0.14 | 25.48±0.15 | 25.93±0.38 | 0.281 |
| AST (U/L) | 25.27±0.11 | 25.27±0.12 | 25.24±0.29 | 0.926 |
| GGT (U/L) | 28.32±0.27 | 28.13±0.29 | 30.06±0.77 | 0.022 |
| Glycohemoglobin (%) | 5.63±0.01 | 5.61±0.01 | 5.84±0.03 | <0.001 |
| TG (mmol/L) | 1.39±0.02 | 1.38±0.02 | 1.52±0.04 | <0.001 |
| TC (mmol/L) | 5.00±0.01 | 5.00±0.01 | 4.98±0.03 | 0.574 |
| HDL-c (mmol/L) | 1.37±0.01 | 1.38±0.01 | 1.29±0.01 | <0.001 |
| LDL-c (mmol/L) | 2.95±0.01 | 2.95±0.01 | 2.95±0.03 | 0.917 |
| BUN (μmol/L) | 4.81±0.02 | 4.77±0.02 | 5.19±0.06 | <0.001 |
| Scr (μmol/L) | 77.50±0.27 | 77.02±0.26 | 81.88±0.97 | <0.001 |
| SUA (μmol/L) | 322.37±0.82 | 321.25±0.85 | 332.66±2.18 | <0.001 |
| Monocytes (10^9/L) | 0.56±0.00 | 0.56±0.00 | 0.58±0.01 | <0.001 |
| Neutrophils (10^9/L) | 4.29±0.02 | 4.27±0.02 | 4.51±0.05 | <0.001 |
| Lymphocytes (10^9/L) | 2.15±0.01 | 2.15±0.01 | 2.13±0.03 | 0.330 |
| Platelets (10^9/L) | 244.65±0.83 | 244.92±0.81 | 242.16±1.82 | 0.090 |
| MHR | 0.45±0.00 | 0.45±0.00 | 0.50±0.01 | <0.001 |
| SII | 530.09±3.53 | 527.02±3.60 | 558.39±9.34 | 0.001 |
| NLR | 2.16±0.01 | 2.15±0.01 | 2.30±0.30 | <0.001 |
| PLR | 123.99±0.58 | 124.05±0.59 | 123.47±1.32 | 0.667 |
Baseline characteristics of study population in NHANES from 2007 to 2018, weighted.
Values for categorical variables are given as weighted percentage (standard error); for continuous variables, as weighted mean ± standard error. Weighted Student’s t-test and chi-squared test were used.
BMI, body mass index; ALT, alanine transaminase; AST, aspartate transaminase; GGT, gamma-glutamyl transferase; TG, triglyceride; TC, total cholesterol; HDL-c, high-density lipoprotein cholesterol; LDL-c, low-density lipoprotein cholesterol; BUN, blood urea nitrogen; Scr, serum creatinine; SUA, serum uric acid; MHR, monocyte to high-density lipoprotein cholesterol; SII, systemic immune-inflammation index; NLR, neutrophil to lymphocyte ratio; PLR, platelet to lymphocyte ratio.
3.2 Clinical features of the participants according to the quartiles of MHR
Participants were categorized into four quartiles based on their MHR levels (Table 2). In comparing the first quartile to quartiles 2-4, there was a notable rise in the percentage of males, annual household incoming under $20,000, smokers, and individuals with hypertension, diabetes, cardiovascular disease, and higher BMI (P<0.001). Concurrently, there was a significant increase in biochemical markers such as ALT, AST, GGT, glycohemoglobin, TG, LDL-c, BUN, Scr, SUA, and counts of monocytes, neutrophils, lymphocytes, and platelets (P<0.001). Additionally, inflammation indices like SII and NLR also escalated with higher MHR levels (P<0.001). In contrast, age, education level above high school, TC, HDL-c, and PLR, were inversely associated with higher MHR levels, and race distribution varied significantly (P<0.001). Notably, the prevalence of kidney stones increased progressively from 7.20% in quartile 1 to 12.05% in quartile 4, suggesting a strong association between elevated MHR levels and the risk of kidney stones (P<0.001).
Table 2
| Quartile 1 (< 0.29) |
Quartile 2 (0.29-0.40) | Quartile 3 (0.40-0.55) | Quartile 4 (> 0.55) |
P value | |
|---|---|---|---|---|---|
| Age (year) | 47.34±0.33 | 45.60±0.32 | 46.10±0.31 | 46.01±0.32 | <0.001 |
| Male gender, % (SE) | 27.78 (0.72) | 42.44 (0.74) | 56.30 (0.72) | 69.13 (0.63) | <0.001 |
| Race, % (SE) | <0.001 | ||||
| Mexican American | 6.50 (0.56) | 9.10 (0.85) | 9.91 (0.90) | 10.08 (1.00) | |
| Non-Hispanic Black | 14.66 (0.99) | 11.99 (0.78) | 9.61 (0.69) | 7.46 (0.60) | |
| Non-Hispanic White | 63.61 (1.56) | 65.42 (1.48) | 66.02 (1.53) | 68.33 (1.64) | |
| Other Hispanic | 5.22 (0.51) | 5.72 (0.52) | 6.72 (0.57) | 6.57 (0.64) | |
| Other Races | 10.00 (0.66) | 7.77 (0.56) | 7.75 (0.50) | 7.57 (0.51) | |
| Annual household income (under $20,000), % (SE) | 11.79 (0.58) | 13.61 (0.67) | 14.13 (0.65) | 15.12 (0.82) | <0.001 |
| Education level (above high school), % (SE) | 69.90 (1.09) | 63.15 (1.16) | 60.12 (1.06) | 54.41 (1.16) | <0.001 |
| Smokers, % (SE) | 36.79 (0.96) | 40.21 (0.85) | 46.65 (1.00) | 53.35 (0.86) | <0.001 |
| Hypertension, % (SE) | 25.01 (0.75) | 27.09 (0.86) | 31.93 (0.82) | 38.17 (0.88) | <0.001 |
| Diabetes, % (SE) | 5.36 (0.32) | 7.68 (0.42) | 10.38 (0.49) | 14.35 (0.53) | <0.001 |
| Cardiovascular disease, % (SE) | 4.56 (0.28) | 5.49 (0.30) | 8.14 (0.37) | 11.51 (0.60) | <0.001 |
| BMI (kg/m2), % (SE) | 26.53±0.12 | 28.61±0.12 | 29.90±0.13 | 31.51±0.11 | <0.001 |
| ALT (U/L) | 21.64±0.22 | 23.95±0.28 | 26.22±0.25 | 30.08±0.35 | <0.001 |
| AST (U/L) | 24.57±0.23 | 24.88±0.24 | 25.07±0.18 | 26.52±0.25 | <0.001 |
| GGT (U/L) | 24.80±0.54 | 26.69±0.72 | 28.61±0.39 | 32.98±0.56 | <0.001 |
| Glycohemoglobin (%) | 5.47±0.01 | 5.55±0.01 | 5.66±0.02 | 5.84±0.02 | <0.001 |
| TG (mmol/L) | 1.00±0.01 | 1.25±0.02 | 1.48±0.03 | 2.00±0.04 | <0.001 |
| TC (mmol/L) | 5.19±0.02 | 5.02±0.02 | 4.93±0.02 | 4.88±0.02 | <0.001 |
| HDL-c (mmol/L) | 1.80±0.01 | 1.45±0.01 | 1.25±0.00 | 1.03±0.00 | <0.001 |
| LDL-c (mmol/L) | 2.91±0.02 | 2.92±0.02 | 2.97±0.02 | 3.00±0.03 | <0.001 |
| BUN (mmol/L) | 4.66±0.04 | 4.73±0.03 | 4.88±0.04 | 4.97±0.04 | <0.001 |
| Scr (μmol/L) | 73.18±0.47 | 75.49±0.32 | 78.92±0.49 | 82.14±0.40 | <0.001 |
| SUA (μmol/L) | 290.25±1.26 | 311.83±1.27 | 332.54±1.26 | 353.06±1.43 | <0.001 |
| Monocytes (10^9/L) | 0.39±0.00 | 0.50±0.00 | 0.59±0.00 | 0.76±0.00 | <0.001 |
| Neutrophils (10^9/L) | 3.46±0.03 | 3.99±0.03 | 4.46±0.03 | 5.20±0.03 | <0.001 |
| Lymphocytes (10^9/L) | 1.82±0.01 | 2.05±0.01 | 2.22±0.01 | 2.50±0.01 | <0.001 |
| Platelets (10^9/L) | 236.08±1.17 | 241.78±1.00 | 246.94±1.20 | 253.31±1.30 | <0.001 |
| SII | 492.01±6.30 | 507.30±4.76 | 540.06±5.82 | 578.61±5.22 | <0.001 |
| NLR | 2.08±0.02 | 2.10±0.02 | 2.18±0.02 | 2.28±0.02 | <0.001 |
| PLR | 140.52±1.00 | 126.29±0.72 | 119.56±0.87 | 110.41±0.73 | <0.001 |
| Kidney stone, % (SE) | 7.20 (0.44) | 8.89 (0.46) | 10.88 (0.51) | 12.05 (0.60) | <0.001 |
Baseline characteristics of study population according to the quartiles of MHR, weighted.
Values for categorical variables are given as weighted percentage (standard error); for continuous variables, as weighted mean ± standard error. Weighted Student’s t-test and chi-squared test were used.
3.3 Associations between the MHR and kidney stone
Table 3 illustrates the relationship between the MHR and kidney stone risk. Initial analyses without adjustment indicated that monocytes and MHR each had a direct correlation with heightened kidney stone risk, whereas HDL-c was inversely correlated (P<0.001). These correlations persisted as significant even when adjusted for age, gender, and race (P<0.05). Additionally, after fully adjusted for confounding factors, for each unit increase in the MHR, the odds of kidney stone risk rose by 31% (OR=1.31, 95%CI=1.11-1.54, P=0.001). It is noteworthy that even after considering the influences of SII, NLR, and PLR, MHR remains an independent risk factor for kidney stones (OR=1.22, 95%CI=1.03-1.44, P=0.021). Additionally, according to the results of the DCA analysis, MHR demonstrated superior performance compared to SII, NLR, and PLR (Figure 1). When categorizing the MHR into quartiles, the result indicated that individuals in the higher MHR quartiles had a greater prevalence of kidney stones compared to those in the lowest quartile (P for trend < 0.001).
Table 3
| Kidney stone | OR (95%CI), P value | |||
|---|---|---|---|---|
| Model 1 | Model 2 | Model 3 | Additionally adjusted for SII, NLR, and PLR | |
| Continuous | ||||
| Monocytes | 1.68 (1.39, 2.03) <0.001 | 1.24 (1.03, 1.49) 0.025 | 1.10 (0.90, 1.33) 0.354 | 0.96 (0.77, 1.20) 0.717 |
| HDL-C | 0.57 (0.51, 0.64) <0.001 | 0.57 (0.51, 0.63) <0.001 | 0.64 (0.57, 0.72) <0.001 | 0.65 (0.58, 0.74) <0.001 |
| MHR | 1.93 (1.66, 2.25) <0.001 | 1.61 (1.37, 1.89) <0.001 | 1.31 (1.11, 1.54) 0.001 | 1.22 (1.03, 1.44) 0.021 |
| Categories | ||||
| Quartile 1 | 1.00 | 1.00 | 1.00 | 1.00 |
| Quartile 2 | 1.32 (1.17, 1.49) <0.001 | 1.30 (1.15, 1.48) <0.001 | 1.26 (1.11, 1.44) <0.001 | 1.25 (1.09, 1.42) 0.001 |
| Quartile 3 | 1.55 (1.37, 1.74) <0.001 | 1.46 (1.29, 1.65) <0.001 | 1.36 (1.19, 1.54) <0.001 | 1.32 (1.16, 1.51) <0.001 |
| Quartile 4 | 1.79 (1.59, 2.01) <0.001 | 1.61 (1.43, 1.82) <0.001 | 1.40 (1.23, 1.60) <0.001 | 1.35 (1.17, 1.55) <0.001 |
| P for trend | <0.001 | <0.001 | <0.001 | <0.001 |
Logistic regression analysis results of MHR and kidney stone.
OR, odds ratio.
95% CI: 95% confidence interval.
Model 2: adjusted for age, gender, and race.
Model 3: adjusted for age, gender, and race, annual household income, education level, smokers, hypertension, diabetes, cardiovascular disease, BMI, ALT, AST, GGT, glycohemoglobin, TG, BUN, Scr, and SUA.
Figure 1

DCA results.
3.4 Multivariate logistic regression models of kidney stone
A multivariate logistic regression analysis was performed, with the independent variables including the MHR, SII, NLR, PLR, age, gender, race, annual household income, educational level, smoking, hypertension, diabetes, cardiovascular disease, BMI, ALT, AST, GGT, glycohemoglobin, TG, BUN, Scr, and SUA (Table 4). The results showed that MHR, age, male, race, hypertension, diabetes, cardiovascular disease, BMI, and SUA were independent risk factors for kidney stones.
Table 4
| OR | 95%CI lower | 95%CI upper | P value | |
|---|---|---|---|---|
| MHR | 1.217 | 1.030 | 1.439 | 0.021 |
| SII | 1.000 | 1.000 | 1.001 | 0.159 |
| NLR | 0.969 | 0.885 | 1.061 | 0.495 |
| PLR | 0.999 | 0.998 | 1.001 | 0.489 |
| Age (years) | 1.015 | 1.010 | 1.020 | <0.001 |
| Gender (vs. female) | 1.419 | 1.226 | 1.642 | <0.001 |
| Race (vs. Mexican American) | ||||
| Other Hispanic | 0.596 | 0.467 | 0.761 | <0.001 |
| Non-Hispanic White | 1.378 | 1.140 | 1.666 | 0.001 |
| Non-Hispanic Black | 1.186 | 0.932 | 1.509 | 0.166 |
| Other Races | 1.018 | 0.789 | 1.314 | 0.888 |
| Under $20,000 (vs. no) | 1.026 | 0.880 | 1.196 | 0.741 |
| Above high school (vs. no) | 1.112 | 0.976 | 1.267 | 0.110 |
| Smokers (vs. no) | 0.943 | 0.829 | 1.072 | 0.371 |
| Hypertension (vs. no) | 1.231 | 1.067 | 1.419 | 0.004 |
| Diabetes (vs. no) | 1.497 | 1.227 | 1.826 | <0.001 |
| Cardiovascular disease (vs. no) | 1.353 | 1.125 | 1.626 | 0.001 |
| BMI (kg/m2) | 1.032 | 1.023 | 1.042 | <0.001 |
| ALT (U/L) | 1.000 | 0.994 | 1.006 | 0.996 |
| AST (U/L) | 0.996 | 0.989 | 1.004 | 0.361 |
| GGT (U/L) | 1.000 | 0.998 | 1.002 | 0.733 |
| Glycohemoglobin (%) | 0.994 | 0.932 | 1.060 | 0.851 |
| TG (mmol/L) | 1.015 | 0.959 | 1.074 | 0.604 |
| BUN (mmol/L) | 1.025 | 0.988 | 1.062 | 0.185 |
| Scr (μmol/L) | 1.000 | 0.999 | 1.002 | 0.706 |
| SUA (μmol/L) | 1.001 | 1.001 | 1.002 | <0.001 |
Multivariate logistic regression models of kidney stone.
3.5 Subgroup analyses
The subgroup analysis was performed to evaluate the consistency of the relationship between MHR and the risk of kidney stones across diverse demographic cohorts. The analysis results, depicted in Figure 2, demonstrated that stratification by race, BMI, or diabetes, hypertension, and cardiovascular disease did not significantly modify the association between MHR and kidney stones (P for interaction>0.05). Intriguingly, we noted a significant interplay between age (20-49/50-79) or gender (female/male) and the MHR-kidney stone linkage (P for interaction<0.05). In individuals aged 20 to 49 and among females, there is a stronger correlation between MHR and the risk of kidney stones compared to those aged 50 to 79 and males.
Figure 2
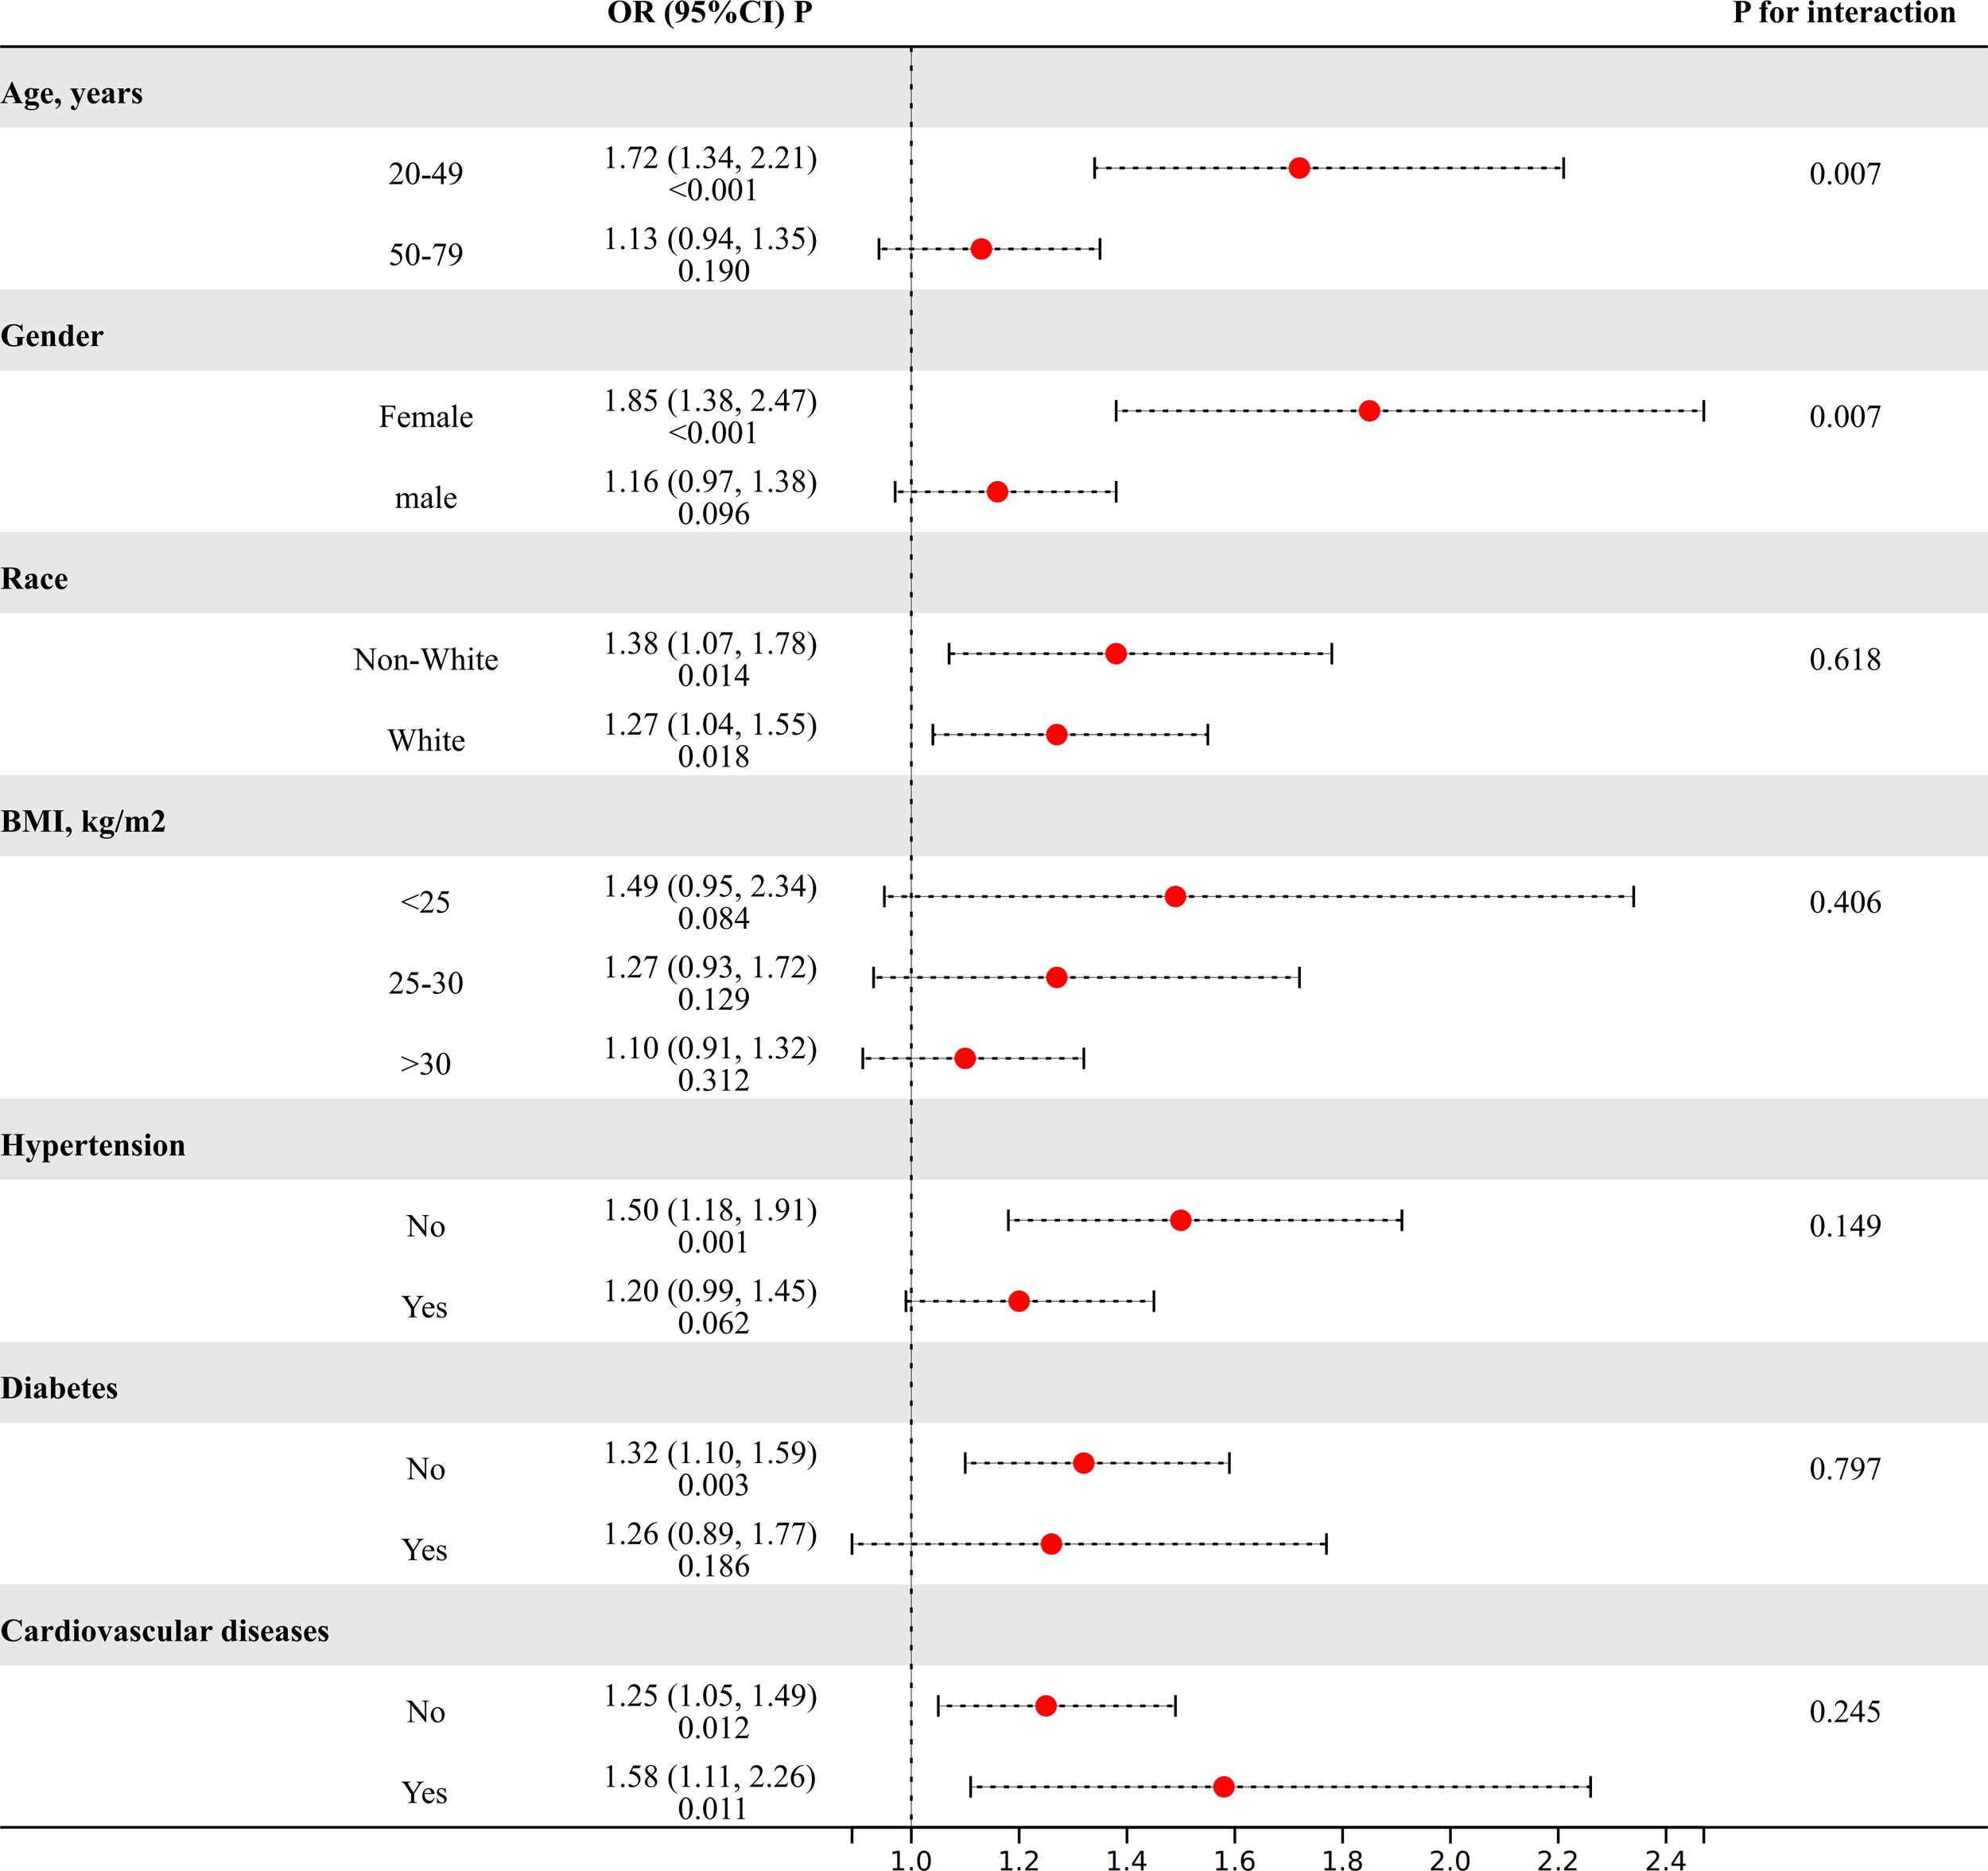
The results of subgroup analyses. (Age, gender, and race, annual household income, education level, smokers, hypertension, diabetes, cardiovascular disease, BMI, ALT, AST, GGT, glycohemoglobin, TG, BUN, Scr, and SUA were adjusted).
3.6 The analysis of threshold effect
The RCS analysis suggests a nonlinear relationship between the MHR and the risk of kidney stones in the overall sample (Figure 3) (P for nonlinear < 0.001). Further investigation using a two-piecewise linear regression model reveals a breakpoint (K) at 0.44 (Table 5). To the left of this breakpoint, there is a positive correlation between MHR and the risk of kidney stones, with an OR of 4.57 and a 95%CI ranging from 2.64 to 7.92 (P<0.001). To the right of the breakpoint, the association between MHR and kidney stones is not statistically significant, with an OR of 1.02 and a 95% CI from 0.84 to 1.23 (P=0.864). There is a significant change across the breakpoint (P for logarithmic likelihood ratio<0.001). The results of RCS analysis stratified by age and gender is also provided in Supplementary Figure 1.
Figure 3
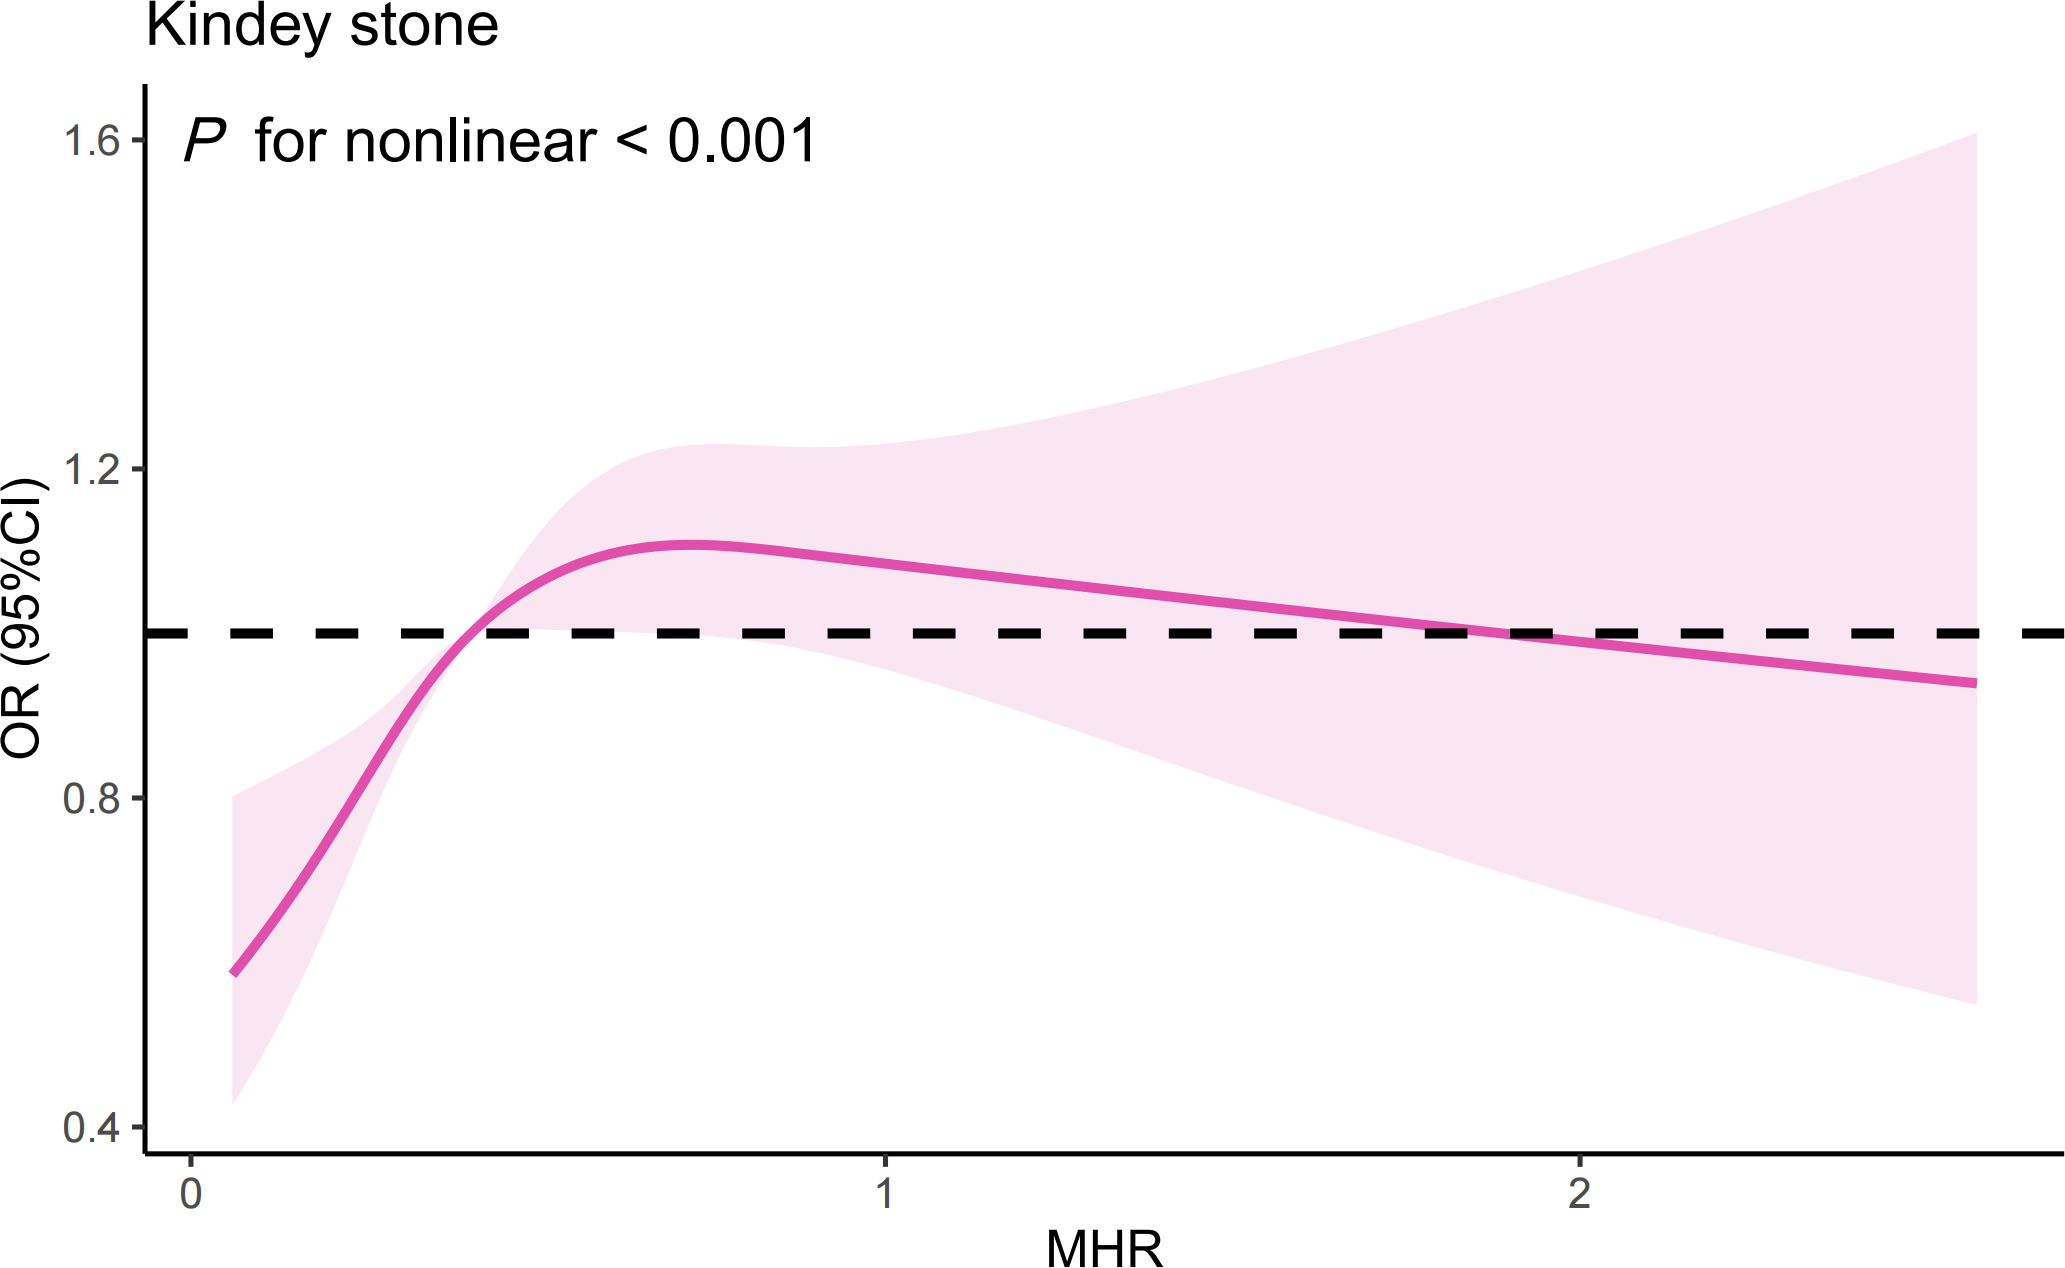
The results of RCS analysis. (Age, gender, and race, annual household income, education level, smokers, hypertension, diabetes, cardiovascular disease, BMI, ALT, AST, GGT, glycohemoglobin, TG, BUN, Scr, and SUA were adjusted).
Table 5
| Model | OR (95% CI), P value |
|---|---|
| Fitting by standard linear model | |
| 1.31 (1.11, 1.54), 0.001 | |
| Fitting by two-piecewise linear model | |
| Breakpoint (K) | 0.44 |
| OR1 (<0.44) | 4.57 (2.64, 7.92), <0.001 |
| OR2 (>0.44) | 1.02 (0.84, 1.23), 0.864 |
| OR2/OR1 | 0.22 (0.12, 0.42), <0.001 |
| P for logarithmic likelihood ratio | <0.001 |
Threshold effect analysis of MHR on kidney stone using a two-piecewise linear regression model.
Adjusted for age, gender, and race, annual household income, education level, smokers, hypertension, diabetes, cardiovascular disease, BMI, ALT, AST, GGT, glycohemoglobin, TG, BUN, Scr, and SUA.
4 Discussion
To our knowledge, this is the first population-based study to examine the relationship between MHR and the risk of kidney stones. In the US population, MHR is associated with kidney stones, independently of the effects of other common inflammatory indices (OR=1.22, 95%CI=1.03-1.44, P=0.021). RCS analysis indicates a nonlinear relationship, with a saturation threshold of 0.44. Subgroup analysis revealed a stronger correlation between MHR and the risk of kidney stones in individuals aged 20 to 49 and among females. MHR could be a valuable indicator for assessing and predicting the risk of kidney stones.
Inflammation can serve as both a contributing factor in its onset and a consequence of its progression in kidney stone disease (10). In lithogenic environments, an excessive burden of chemical and mineral components, or other sources of inflammatory stimuli, may initially act as triggers, followed by the generation of reactive oxygen species (22). This cascade leads to injury of renal epithelial cells and results in the deposition of calcium oxalate crystals (22). Monocytes and their differentiated counterparts, macrophages, play a crucial role in this context (23, 24). M1-like macrophages facilitate the development of renal calcium oxalate crystals, which is associated with inflammation, fibrosis, and cellular damage within the kidneys (23). In contrast, M2-like macrophages act to suppress the formation of calcium oxalate crystals, thereby potentially protecting against renal pathology (23). On other hand, immune dysfunction in patients with kidney stones can also lead to an excessive generation of reactive oxygen species due to oxalate and calcium oxalate (10). This overproduction of reactive oxygen species can harm the mitochondria of monocytes, compromising their ability to clear stone crystals (10). However, our research indicates that the impact of MHR on kidney stones cannot be fully explained solely from the perspective of immune inflammation and oxidative stress even after adjusting for some representative inflammatory indices. Furthermore, the DCA demonstrates that the evaluation value of the MHR for kidney stones is significantly superior to that of the SII, NLR, and PLR. Therefore, we speculated that the association between MHR and kidney stones extends beyond the impact of inflammatory responses on the formation of kidney stones. Metabolic abnormalities are also intricately linked to the formation of kidney stones (25, 26). Previous research has also revealed a strong connection between MHR and metabolic disorders, such as non-alcoholic fatty liver disease, metabolic syndrome, and polycystic ovary syndrome (27–29). Considering only dyslipidemia, changes in lipid profiles can influence urinary metabolite concentrations and stone composition. Lipid-lowering drugs like atorvastatin also alter urinary citrate and uric acid levels, as well as urine pH (30). Individuals with reduced levels of HDL-c show a significant rise in urinary sodium, oxalate, and uric acid, coupled with a noticeable reduction in urine pH (31). The MHR also serves as an independent marker for cardiovascular diseases (15, 32). Some scholars propose that the build-up of atherosclerotic plaques could result in calcification, which might then breach into the Bellini collecting ducts, thereby heightening the probability of stone formation (33). Thus, we propose that MHR might serve as a comprehensive marker, potentially quantifying the influence of inflammatory responses and metabolic abnormalities on the formation of kidney stones. Further subgroup analyses and interaction tests revealed a more robust correlation between the MHR and kidney stone risk within the demographic of individuals aged 20 to 49 and among females. The inherent independent risk factors of advanced age and male for kidney stone formation could potentially mask the influence of this biomarker on stone risk. Moreover, the divergences in gender and age might reflect distinct pathophysiological pathways in kidney stone genesis across varied populations. The potential confounders present in different gender and age brackets should also be meticulously accounted for in this context.
This research utilized a sample reflective of the ethnic diversity among US adults, yet its limitations must be acknowledged. The cross-sectional nature precludes causal inferences between the MHR and kidney stone risk. Longitudinal studies and clinical trials are essential to verify such associations. Additionally, the exclusion of potential confounders such as metabolic syndrome and nonalcoholic fatty liver disease might have influenced our outcomes. The reliance solely on SII, NLR, and PLR as markers of inflammation on kidney stone could introduce bias. Moreover, as this investigation was based on the US population, its applicability to other populations warrants further exploration.
5 Conclusion
In a nationwide study of US adults aged 20-79, a nonlinear relationship was found between MHR and an increased risk of kidney stones. Subgroup analysis indicated this relationship was more pronounced in individuals aged 20 to 49 and among women. MHR could potentially be used as an epidemiological tool to measure the impact of inflammatory responses and metabolic abnormalities on kidney stone formation.
Statements
Data availability statement
The original contributions presented in the study are included in the article/Supplementary Materials, further inquiries can be directed to the corresponding author/s.
Ethics statement
The studies involving humans were approved by the Ethics Review Board of the National Center for Health Statistics. The studies were conducted in accordance with the local legislation and institutional requirements. The participants provided their written informed consent to participate in this study.
Author contributions
ZW: Writing – original draft, Writing – review & editing. GZ: Writing – original draft, Writing – review & editing. YC: Writing – original draft, Writing – review & editing. TG: Writing – review & editing. QY: Funding acquisition, Writing – review & editing.
Funding
The author(s) declare financial support was received for the research, authorship, and/or publication of this article. This study was supported by the Science and Technology Project of Changzhou Health Commission (WZ202226) and the Young Talent Development Plan of Changzhou Health Commission (CZQM2022029).
Acknowledgments
We want to acknowledge all participants of this study and the support provided by the Jiangsu University.
Conflict of interest
The authors declare that the research was conducted in the absence of any commercial or financial relationships that could be construed as a potential conflict of interest.
Publisher’s note
All claims expressed in this article are solely those of the authors and do not necessarily represent those of their affiliated organizations, or those of the publisher, the editors and the reviewers. Any product that may be evaluated in this article, or claim that may be made by its manufacturer, is not guaranteed or endorsed by the publisher.
Supplementary material
The Supplementary Material for this article can be found online at: https://www.frontiersin.org/articles/10.3389/fendo.2024.1374376/full#supplementary-material
References
1
Peerapen P Thongboonkerd V . Kidney stone prevention. Adv Nutr. (2023) 14:555–69. doi: 10.1016/j.advnut.2023.03.002
2
Coe FL Evan A Worcester E . Kidney stone disease. J Clin Invest. (2005) 115:2598–608. doi: 10.1172/jci26662
3
Abufaraj M Xu T Cao C Waldhoer T Seitz C D’Andrea D et al . Prevalence and trends in kidney stone among adults in the USA: analyses of national health and nutrition examination survey 2007-2018 data. Eur Urol Focus. (2021) 7:1468–75. doi: 10.1016/j.euf.2020.08.011
4
Scales CD Jr. Smith AC Hanley JM Saigal CS . Prevalence of kidney stones in the United States. Eur Urol. (2012) 62:160–5. doi: 10.1016/j.eururo.2012.03.052
5
Singh P Harris PC Sas DJ Lieske JC . The genetics of kidney stone disease and nephrocalcinosis. Nat Rev Nephrol. (2022) 18:224–40. doi: 10.1038/s41581-021-00513-4
6
Rule AD Lieske JC Pais VM Jr . Management of kidney stones in 2020. Jama. (2020) 323:1961–2. doi: 10.1001/jama.2020.0662
7
Di X Liu S Xiang L Jin X . Association between the systemic immune-inflammation index and kidney stone: A cross-sectional study of NHANES 2007-2018. Front Immunol. (2023) 14:1116224. doi: 10.3389/fimmu.2023.1116224
8
Lee KS Ha JS Koo KC . Significance of neutrophil-to-lymphocyte ratio as a novel indicator of spontaneous ureter stone passage. Yonsei Med J. (2017) 58:988–93. doi: 10.3349/ymj.2017.58.5.988
9
Mao W Wu J Zhang Z Xu Z Xu B Chen M . Neutrophil-lymphocyte ratio acts as a novel diagnostic biomarker for kidney stone prevalence and number of stones passed. Transl Androl Urol. (2021) 10:77–86. doi: 10.21037/tau-20-890
10
Thongboonkerd V Yasui T Khan SR . Editorial: immunity and inflammatory response in kidney stone disease. Front Immunol. (2021) 12:795559. doi: 10.3389/fimmu.2021.795559
11
Podrez EA . Anti-oxidant properties of high-density lipoprotein and atherosclerosis. Clin Exp Pharmacol Physiol. (2010) 37:719–25. doi: 10.1111/j.1440-1681.2010.05380.x
12
Sirtori CR Corsini A Ruscica M . The role of high-density lipoprotein cholesterol in 2022. Curr Atheroscler Rep. (2022) 24:365–77. doi: 10.1007/s11883-022-01012-y
13
Jia C Anderson JLC Gruppen EG Lei Y Bakker SJL Dullaart RPF et al . High-density lipoprotein anti-inflammatory capacity and incident cardiovascular events. Circulation. (2021) 143:1935–45. doi: 10.1161/circulationaha.120.050808
14
Murphy AJ Woollard KJ Hoang A Mukhamedova N Stirzaker RA McCormick SP et al . High-density lipoprotein reduces the human monocyte inflammatory response. Arterioscler Thromb Vasc Biol. (2008) 28:2071–7. doi: 10.1161/atvbaha.108.168690
15
Jiang M Yang J Zou H Li M Sun W Kong X . Monocyte-to-high-density lipoprotein-cholesterol ratio (MHR) and the risk of all-cause and cardiovascular mortality: a nationwide cohort study in the United States. Lipids Health Dis. (2022) 21:30. doi: 10.1186/s12944-022-01638-6
16
Paulose-Ram R Graber JE Woodwell D Ahluwalia N . The national health and nutrition examination survey (NHANES), 2021-2022: adapting data collection in a COVID-19 environment. Am J Public Health. (2021) 111:2149–56. doi: 10.2105/ajph.2021.306517
17
Ahluwalia N Dwyer J Terry A Moshfegh A Johnson C . Update on NHANES dietary data: focus on collection, release, analytical considerations, and uses to inform public policy. Adv Nutr. (2016) 7:121–34. doi: 10.3945/an.115.009258
18
Abou Heidar N Labban M Bustros G Nasr R . Inflammatory serum markers predicting spontaneous ureteral stone passage. Clin Exp Nephrol. (2020) 24:277–83. doi: 10.1007/s10157-019-01807-5
19
Wang M Jian Z Ma Y Jin X Li H Wang K . Depression increases the risk of kidney stone: Results from the National Health and Nutrition Examination Survey 2007-2018 and Mendelian randomization analysis. J Affect Disord. (2022) 312:17–21. doi: 10.1016/j.jad.2022.06.008
20
Di X Xiang L Wang M Wei X . Association between marijuana use and kidney stone: a cross-sectional study of NHANES 2009 to 2018. Front Pharmacol. (2023) 14:1214647. doi: 10.3389/fphar.2023.1214647
21
Lin W Ye Q Lin ME . Relationship between the weight-adjusted-waist index and kidney stone: a population-based study. World J Urol. (2023) 41:3141–7. doi: 10.1007/s00345-023-04620-8
22
Khan SR Canales BK Dominguez-Gutierrez PR . Randall’s plaque and calcium oxalate stone formation: role for immunity and inflammation. Nat Rev Nephrol. (2021) 17:417–33. doi: 10.1038/s41581-020-00392-1
23
Taguchi K Okada A Unno R Hamamoto S Yasui T . Macrophage function in calcium oxalate kidney stone formation: A systematic review of literature. Front Immunol. (2021) 12:673690. doi: 10.3389/fimmu.2021.673690
24
Kumar P Laurence E Crossman DK Assimos DG Murphy MP Mitchell T . Oxalate disrupts monocyte and macrophage cellular function via Interleukin-10 and mitochondrial reactive oxygen species (ROS) signaling. Redox Biol. (2023) 67:102919. doi: 10.1016/j.redox.2023.102919
25
Sakhaee K Maalouf NM Sinnott B . Clinical review. Kidney stones 2012: pathogenesis, diagnosis, and management. J Clin Endocrinol Metab. (2012) 97:1847–60. doi: 10.1210/jc.2011-3492
26
Soligo M Morlacco A Zattoni F Valotto C DEG G Beltrami P . Metabolic syndrome and stone disease. Panminerva Med. (2022) 64:344–58. doi: 10.23736/s0031-0808.21.04517-1
27
Jia J Liu R Wei W Yu F Yu X Shen Y et al . Monocyte to high-density lipoprotein cholesterol ratio at the nexus of type 2 diabetes mellitus patients with metabolic-associated fatty liver disease. Front Physiol. (2021) 12:762242. doi: 10.3389/fphys.2021.762242
28
Herkiloglu D Gokce S . Correlation of monocyte/HDL ratio (MHR) with inflammatory parameters in obese patients diagnosed with polycystic ovary syndrome. Ginekol Pol. (2021) 92:537–43. doi: 10.5603/GP.a2020.0191
29
Chen T Chen H Xiao H Tang H Xiang Z Wang X et al . Comparison of the value of neutrophil to high-density lipoprotein cholesterol ratio and lymphocyte to high-density lipoprotein cholesterol ratio for predicting metabolic syndrome among a population in the southern coast of China. Diabetes Metab Syndr Obes. (2020) 13:597–605. doi: 10.2147/dmso.S238990
30
Liu CJ Huang HS . Statins significantly alter urinary stone-related urine biochemistry in calcium kidney stone patients with dyslipidemia. Int J Urol. (2020) 27:839–44. doi: 10.1111/iju.14312
31
Gao M Liu M Zhu Z Chen H . The association of dyslipidemia with kidney stone: result from the NHANES 2007-2020. Int Urol Nephrol. (2024) 56:35–44. doi: 10.1007/s11255-023-03784-x
32
Villanueva DLE Tiongson MD Ramos JD Llanes EJ . Monocyte to High-Density Lipoprotein Ratio (MHR) as a predictor of mortality and Major Adverse Cardiovascular Events (MACE) among ST Elevation Myocardial Infarction (STEMI) patients undergoing primary percutaneous coronary intervention: a meta-analysis. Lipids Health Dis. (2020) 19:55. doi: 10.1186/s12944-020-01242-6
33
Stoller ML Meng MV Abrahams HM Kane JP . The primary stone event: a new hypothesis involving a vascular etiology. J Urol. (2004) 171:1920–4. doi: 10.1097/01.ju.0000120291.90839.49
Summary
Keywords
NHANES, kidney stone, inflammation, oxidative stress, monocyte to high-density lipoprotein cholesterol ratio
Citation
Wang Z, Zhao G, Cao Y, Gu T and Yang Q (2024) Association between monocyte to high-density lipoprotein cholesterol ratio and kidney stone: insights from NHANES. Front. Endocrinol. 15:1374376. doi: 10.3389/fendo.2024.1374376
Received
23 January 2024
Accepted
22 May 2024
Published
04 June 2024
Volume
15 - 2024
Edited by
Bohan Wang, Zhejiang University, China
Reviewed by
Xingpeng Di, Sichuan University, China
Ivana Trutin, Clinical Hospital Centre Sestre Milosrdnice, Croatia
Updates
Copyright
© 2024 Wang, Zhao, Cao, Gu and Yang.
This is an open-access article distributed under the terms of the Creative Commons Attribution License (CC BY). The use, distribution or reproduction in other forums is permitted, provided the original author(s) and the copyright owner(s) are credited and that the original publication in this journal is cited, in accordance with accepted academic practice. No use, distribution or reproduction is permitted which does not comply with these terms.
*Correspondence: Qichao Yang, yangqichao@wjrmyy.cn
†These authors have contributed equally to this work
Disclaimer
All claims expressed in this article are solely those of the authors and do not necessarily represent those of their affiliated organizations, or those of the publisher, the editors and the reviewers. Any product that may be evaluated in this article or claim that may be made by its manufacturer is not guaranteed or endorsed by the publisher.