 Ding-Qiang Chen1,2†
 Zhi-Qiang Que1†
 Wen-Bin Xu1Ke-Yi Xiao1,2
 Nai-Kun Sun1Hong-Yu Song1Jin-Yi Feng1
 Guang-Xun Lin1,2*
 Gang Rui1,2*
- 1Department of Orthopedics, The First Affiliated Hospital of Xiamen University, School of Medicine, Xiamen University, Xiamen, Fujian, China
- 2The School of Clinical Medicine, Fujian Medical University, Fuzhou, China
Background: While intervertebral disc degeneration (IVDD) is crucial in numerous spinally related illnesses and is common among the elderly, the complete understanding of its pathogenic mechanisms is still an area of ongoing study. In recent years, it has revealed that liposomes are crucial in the initiation and progression of IVDD. However, their intrinsic mediators and related mechanisms remain unclear. With the development of genomics, an increasing amount of data points to the contribution of genetics in the etiology of disease. Accordingly, this study explored the causality between liposomes and IVDD by Mendelian randomization (MR) analysis and deeply investigated the intermediary roles of undetected metabolites.
Methods: According to MR analysis, 179 liposomes and 1400 metabolites were evaluated for their causal association with IVDD. Single nucleotide polymorphisms (SNPs) are strongly associated with the concentrations of liposomes and metabolites. Consequently, they were employed as instrumental variables (IVs) to deduce if they constituted risk elements or protective elements for IVDD. Furthermore, mediation analysis was conducted to pinpoint possible metabolic mediators that link liposomes to IVDD. The inverse variance weighting (IVW) was the main analytical technique. Various confidence tests in the causality estimates were performed, including consistency, heterogeneity, pleiotropy, and sensitivity analyses. Inverse MR analysis was also utilized to estimate potential reverse causality.
Results: MR analysis identified 13 liposomes and 79 metabolites markedly relevant to IVDD. Moreover, the mediation analysis was carried out by choosing the liposome, specifically the triacylglycerol (48:2) levels, which were found to be most notably associated with an increased risk of IVDD. In all, three metabolite-associated mediators were identified (3-methylcytidine levels, inosine 5’-monophosphate (IMP) to phosphate ratio, and adenosine 5’-diphosphate (ADP) to glycine ratio).
Conclusion: The analysis’s findings suggested possible causal connections between liposomes, metabolites, and IVDD, which could act as both forecast and prognosis clinical indicators, thereby aiding in the exploration of the pathogenesis behind IVDD.
Introduction
Lipid metabolism represents a complicated process for maintaining the body’s regular physiological functions. Disorders of lipid metabolism are linked to various human disorders, including cardiovascular and bone diseases (1). IVDD represents a degenerative condition that is notably widespread. As the proteoglycan and water within the nucleus pulposus (NP) gradually decrease, the intervertebral discs (IVD) between the vertebrae may rupture. Subsequently, the herniation of the NP exerts pressure on the spinal nerves, leading to a significant deterioration in the patient’s quality of life (2). Furthermore, IVDD is a primary contributor to numerous spine-related conditions, including spinal stenosis and chronic sciatica (3). As the global population ages rapidly, the prevalence of IVDD continues to be high, posing a significant challenge to both public health and socioeconomic development. Nevertheless, existing non-surgical therapies and surgical procedures alike have been found ineffective in reversing the condition of IVDD (4).
Lipid metabolism performs a crucial function in maintaining IVD stability. When lipid metabolic homeostasis is disturbed, the IVD microenvironment is impacted. Disorders of lipid metabolism are strongly associated with the development of IVDD (5). A retrospective clinical study involving 302 hospitalized patients demonstrated that age, high-density lipoprotein cholesterol (HDL-C), and triglycerides (TGs) can influence degeneration levels of patients with symptomatic degenerative lumbar spine without underlying disease (6). Another case-control study with 396 patients and 394 controls showed that abnormal blood lipids may be linked to higher risk of lumbar disc herniation (7). The excess mechanic load on the lumbar spine caused by excess weight due to disorders of lipid metabolism is a logical pathogenic explanation for IVDD (8). However, the presumption of obesity being associated with pain and degenerative disease as a result of joint overload contradicts the fact that non-weight-bearing joints present with similar degenerative disease and related pain (9). An annulus fibrosus (AF) with structural deterioration is intimately linked to IVDD. Unusual mechanical stress is a major factor in annulus fibrosus cell (AFC) apoptosis, which harms the AF structurally and aggravates IVDD (10), and the majority of scholars agree that obesity is a mechanical risk factor for IVDD (11, 12). Nonetheless, the literature indicates that there has been disagreement on its function (13–15). It is not possible to attribute these observed disparities to the mechanical consequences of obesity alone. Obesity has not just mechanical impacts but also metabolic and inflammatory ones (16, 17). It is now acknowledged that adipose tissue is an active organ with a variety of metabolic and inflammatory characteristics. Adipokines, which function both locally and across the body’s circulation to reach distant regions and exert pro- or anti-inflammatory effects, are distinct and specialized proteins secreted by adipocytes (18). Obese adipose tissue produces systemic pro-inflammatory substances at a low level over an extended period of time, indicating that obesity-related chronic low-grade inflammation may play a significant role in IVDD. Thus, mechanistically, purely mechanical loading cannot explain the association between obesity and IVDD.
Other possible mechanisms beyond the impact of mechanical strain on the development of IVDD need further investigation. Plasma lipids are typically measured by HDL-C, low-density lipoprotein cholesterol, TGs, and total cholesterol (TC); however, the versatility and range of circulating lipids have been much more understood because to the development of contemporary high-performance lipidomic methods. Lipid classes are more finely delineated and may improve risk assessment for IVDD compared with standard lipids (19). Ultimately, an improved knowledge of the biology of lipid metabolism and its link to the pathogenesis of IVDD could also lead to novel therapeutic options for IVDD.
Presently, the most convincing explanation for the relationship between elevated body fat and IVDD is the internal secretory function of fatty tissue. Obesity increases the impaired cellular metabolism of free fatty acids, which promotes the development of IVDD (1). As a competitive inhibitor of arachidonic acid (AA), eicosapentaenoic acid (EPA) reduces inflammation by preventing the synthesis of lipoxygenase (LOX) and cyclooxygenase (CYC). In an alternative dietary control study, Napier et al. discovered that omega-3 fatty acids (n-3 FA) dietary supplementation lowers systemic inflammation and may even prevent the advancement of degenerative disc degeneration by lowering serum AA/EPA ratios. This was observed in a mice model of acupuncture-elicited IVDD (20). However, further exploration is needed to identify other possible metabolic factors linking liposomes to IVDD. The majority of existing research in this area has not conclusively established whether the liposomes examined have a direct causal connection to IVDD. Therefore, the search for IVDD-causing liposomes and the metabolite mediators that play an essential role between them could contribute to the mechanistic study of IVDD and it aids in making clinical judgments prior to the development of serious spinal conditions.
Luckily, the increasing attention on IVDD in the elderly population, genome-wide association study (GWAS) data related to IVDD has been concluded, uncovering genetic insights linked to the condition. Therefore, the possible causative relationship between liposomes, metabolites, and IVDD was assessed using MR techniques. A two-step MR approach was also used to identify possible metabolic mediators between liposomes and IVDD. As gametogenesis adheres to Mendel’s principles of inheritance, the distribution of parental genes to offspring occurs randomly in accordance with Mendelian genetics. Consequently, genetic types might not correlate with elements that affect the accuracy of observational research. MR techniques are capable of differentiating diseases from their underlying causes, thereby preventing the misinterpretation of causal relationships (21). Consequently, employing genetic variants associated with the target characteristic as IVs, MR emerges as a highly dependable analyzing technique that shows promise in determining exposure-outcome causality, eliminating confounding variables, measuring inaccuracies and correcting causal misinterpretations (22–24). Furthermore, genetic variation must be extracted from exposure- and outcome-related information in order to use two-sample MR designs, which enhances the statistical strength in confirming causal relationships between exposures and outcomes (25, 26).
Materials and methods
Study design
This research utilized the TwosampleMR software package. SNPs act as genetic proxies for inferring the influence of exposures on outcomes. Three presumptions should be met by genetic tools in MR analysis: SNPs are linked to the exposures, they are not connected with confounding factors that could interfere with the causality between the exposures and the outcomes, and their relationship with the outcomes are mediated exclusively through the exposures.
Data sources
Summary statistics for liposomes (covering 4 major lipid categories: glycerolipids, glycerophospholipids, sphingolipids, and sterols) were obtained from a large-scale GWAS study by Linda Ottensmann and his team, which performed univariate and multivariate genome-wide analyses of 179 lipids from 7174 Finnish individuals. The GWAS catalog database provides access to the data for download (accession codes GCST90277238-GCST90277416) (19). Summary statistics for metabolites were obtained from a series of large GWASs study by Yiheng Chen and his team, which included 1091 metabolites and 309 metabolite ratios across 8299 participants. The GWAS catalog database provides access to the data for download (accession numbers from GCST90199621-90201020) (27). IVDD-related GWAS data from 184,683 subjects from European populations, including 20,001 IVDD cases and 164,682 controls, were sourced from the FinnGen repository, which contained a total of 16,380,337 SNPs.
The process of selecting instrumental variables involved
SNPs were incorporated based on achieving a threshold of genome-wide significance (P < 1 × 10⁻⁵). For the inverse MR analysis, the IV significance threshold for IVDD was defined as 5×10⁻⁸. To avoid strong linkage disequilibrium (LD), an LD threshold of r2 < 0.001 was established. Additionally, the selection was limited to SNPs with an F-value greater than 10 to minimize the risk of weak instrumental bias. (Supplementary Tables 1, 2; Table 1).
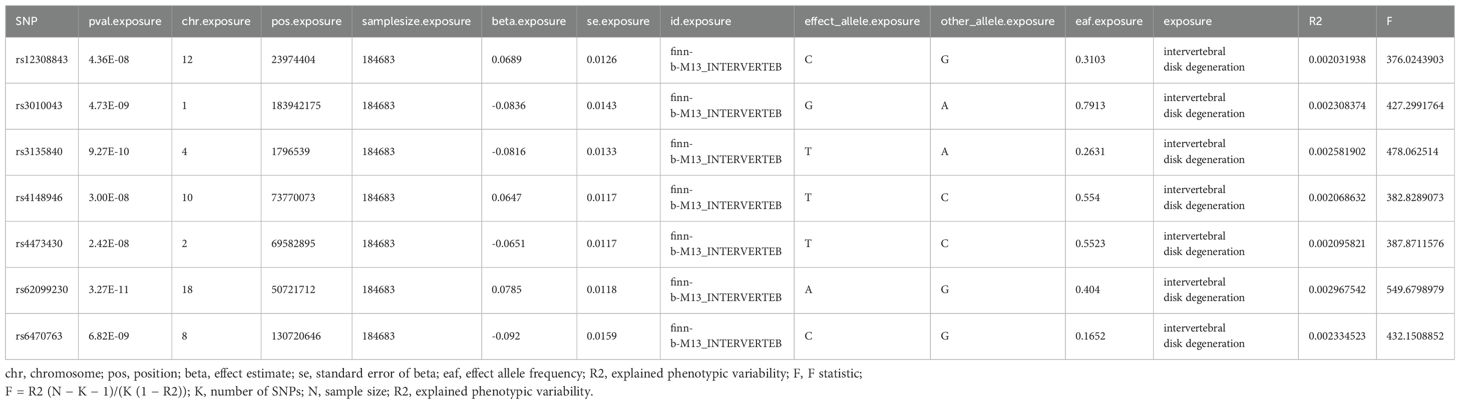
Table 1. Characteristics of significant SNPs for intervertebral disk degeneration on liposomes.
Data analysis
Utilizing the IVW method can provide a reliable assessment of causal relationships between exposures and outcomes, provided that each genetic variant meets the instrumental variable criteria (28). The Egger and weighted median methods can yield trustworthy causal inferences for a range of genetic variants, utilizing pooled data and operating under more lenient conditions. Even if up to 50 percent the data comes from genetic variants that are null IVs, the weighted median estimation continues to deliver coherent causality assessments (29). Additionally, MR-Egger regression and the MR-pleiotropy residual sum and outlier methods were used to detect and correct for pleiotropy. MR-Egger regression techniques aggregate causal effect estimates from multiple individual variables to assess and adjust for potential pleiotropy imbalances (30). Weighted linear regression of genetic outcome data to genetic exposure data was the approach that MR-Egger used. The causal estimation is represented by the slope of the linear regression, while the interception reflects the average impact of multiplicative effects from genetic variations (31). The heterogeneity among SNP estimates was evaluated using the statistical measure known as Cochran’s Q (32). A P-value greater than 0.05 suggests that neither horizontal pleiotropy nor heterogeneity is present. Ultimately, a leave-one-out approach was applied to the sequential removal of each SNP in order to verify that none of the SNPs had a significant effect on the outcome.
Primary analysis
First, to determine the causality between liposomes and IVDD or metabolites and IVDD (Figure 1), two-sample MR analyses were used. The primary analytical technique employed was the IVW technique. Additionally, validation was conducted using MR Egger, weighted median, simple mode, and weighted mode methods (33).
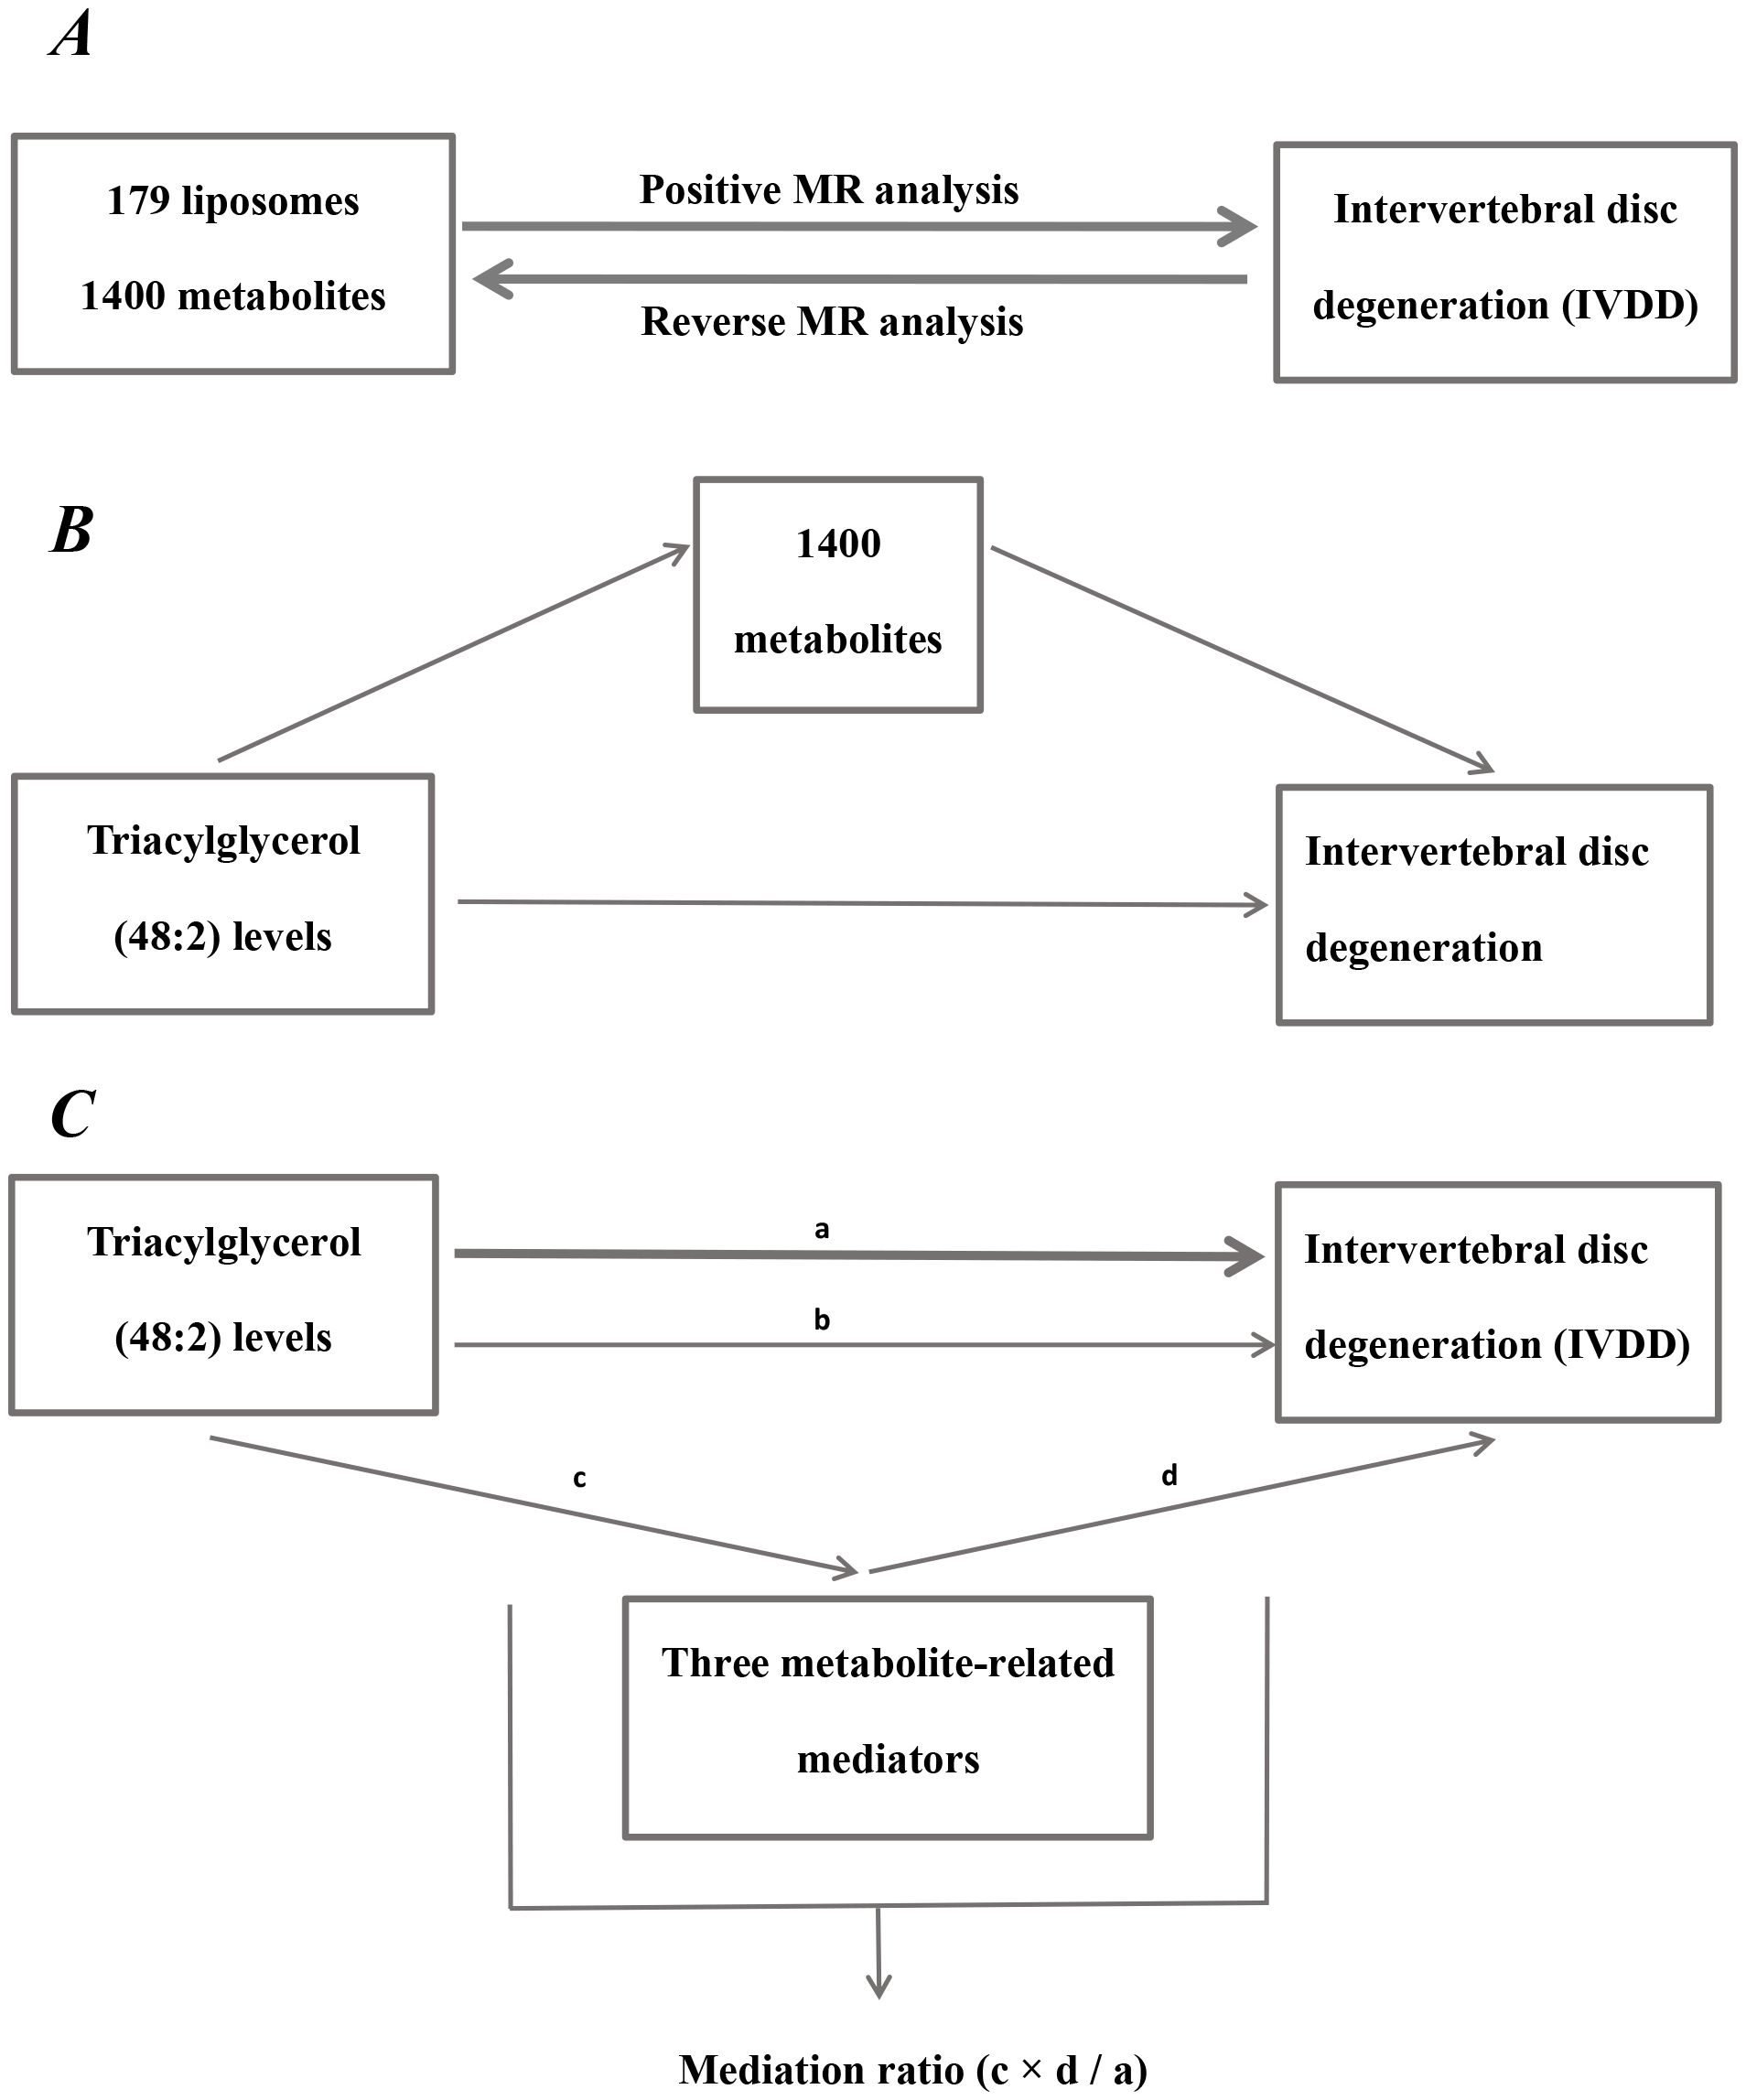
Figure 1. Diagram of analytical relationships. (A) Diagram of positive and reverse MR analysis between 179 liposomes and 1400 metabolites with IVDD. (B) Diagram of mediated MR analysis. Triacylglycerol (48:2) levels as the exposure factor, 1400 metabolites as mediators, and IVDD as the outcome. (C) Diagram of mediation ratio calculation. ‘a’ indicates the total influence of triacylglycerol (48:2) levels on IVDD. ‘c’ indicates the effect of triacylglycerol (48:2) levels on three metabolite-related mediators. ‘d’ indicates the effect of three metabolite-related mediators on IVDD. ‘b’ indicates direct effects = a - c × d (indirect impact). Mediation ratio = c × d/a.
Mediation analysis
Mediation analysis represents a novel technique for ascertaining if a variable mediates between two variables, which enables the construction of pathways from exposure factors to outcomes through mediators, aiding in the elucidation of the mechanisms through which exposure factors affect outcomes (34). For instance, both liposomes and metabolites have a significant causal impact on IVDD, with the liposome additionally having a significant causal effect on the metabolites. This setup establishes a triangular interaction where liposomes act as the exposure, metabolites serve as the mediator, and IVDD represents the outcome. The subsequent equation was applied: Mediation ratio = c × d/a. The total influence of liposomes on IVDD is dissected into two components: the immediate effect of liposomes on IVDD and the indirect influence mediated by the metabolites. The subsequent steps determine the percentage of mediating effect: initially, the impact of liposomes on metabolites is calculated to derive the value ‘c’; the next step involves computing the influence of metabolites on IVDD to ascertain the value ‘d’. The mediation impact percentage is subsequently determined by division of the indirect impact (c × d) by the total impact of liposomes on IVDD (a). (Figure 1). A larger percent of mediating impacts suggests that a greater portion of liposome impacts on IVDD are mediated through metabolites.
Statistical analysis
This study was executed using R version 4.3.1. The “Forestploter” package was leveraged to create forest plots. Additionally, the “MRPRESSO” package was used for detecting outlier.
Results
MR analysis results of liposomes and IVDD
MR analysis showed a total of 13 liposomes were identified as significantly associated with IVDD, of which seven liposomes were risk factors, including diacylglycerol (18:1_18:3) levels, phosphatidylcholine (16:0_18:3) levels, and triacylglycerol (48:2) levels, etc. And six liposomes as protective factors, including phosphatidylcholine (14:0_16:0) levels, phosphatidylcholine (16:0_20:4) levels, sphingomyelin (d36:2) levels, etc (Table 2). Reverse MR analysis revealed a significant link between IVDD and one liposome phosphatidylcholine (O-16:0_20:3) levels (Table 3).
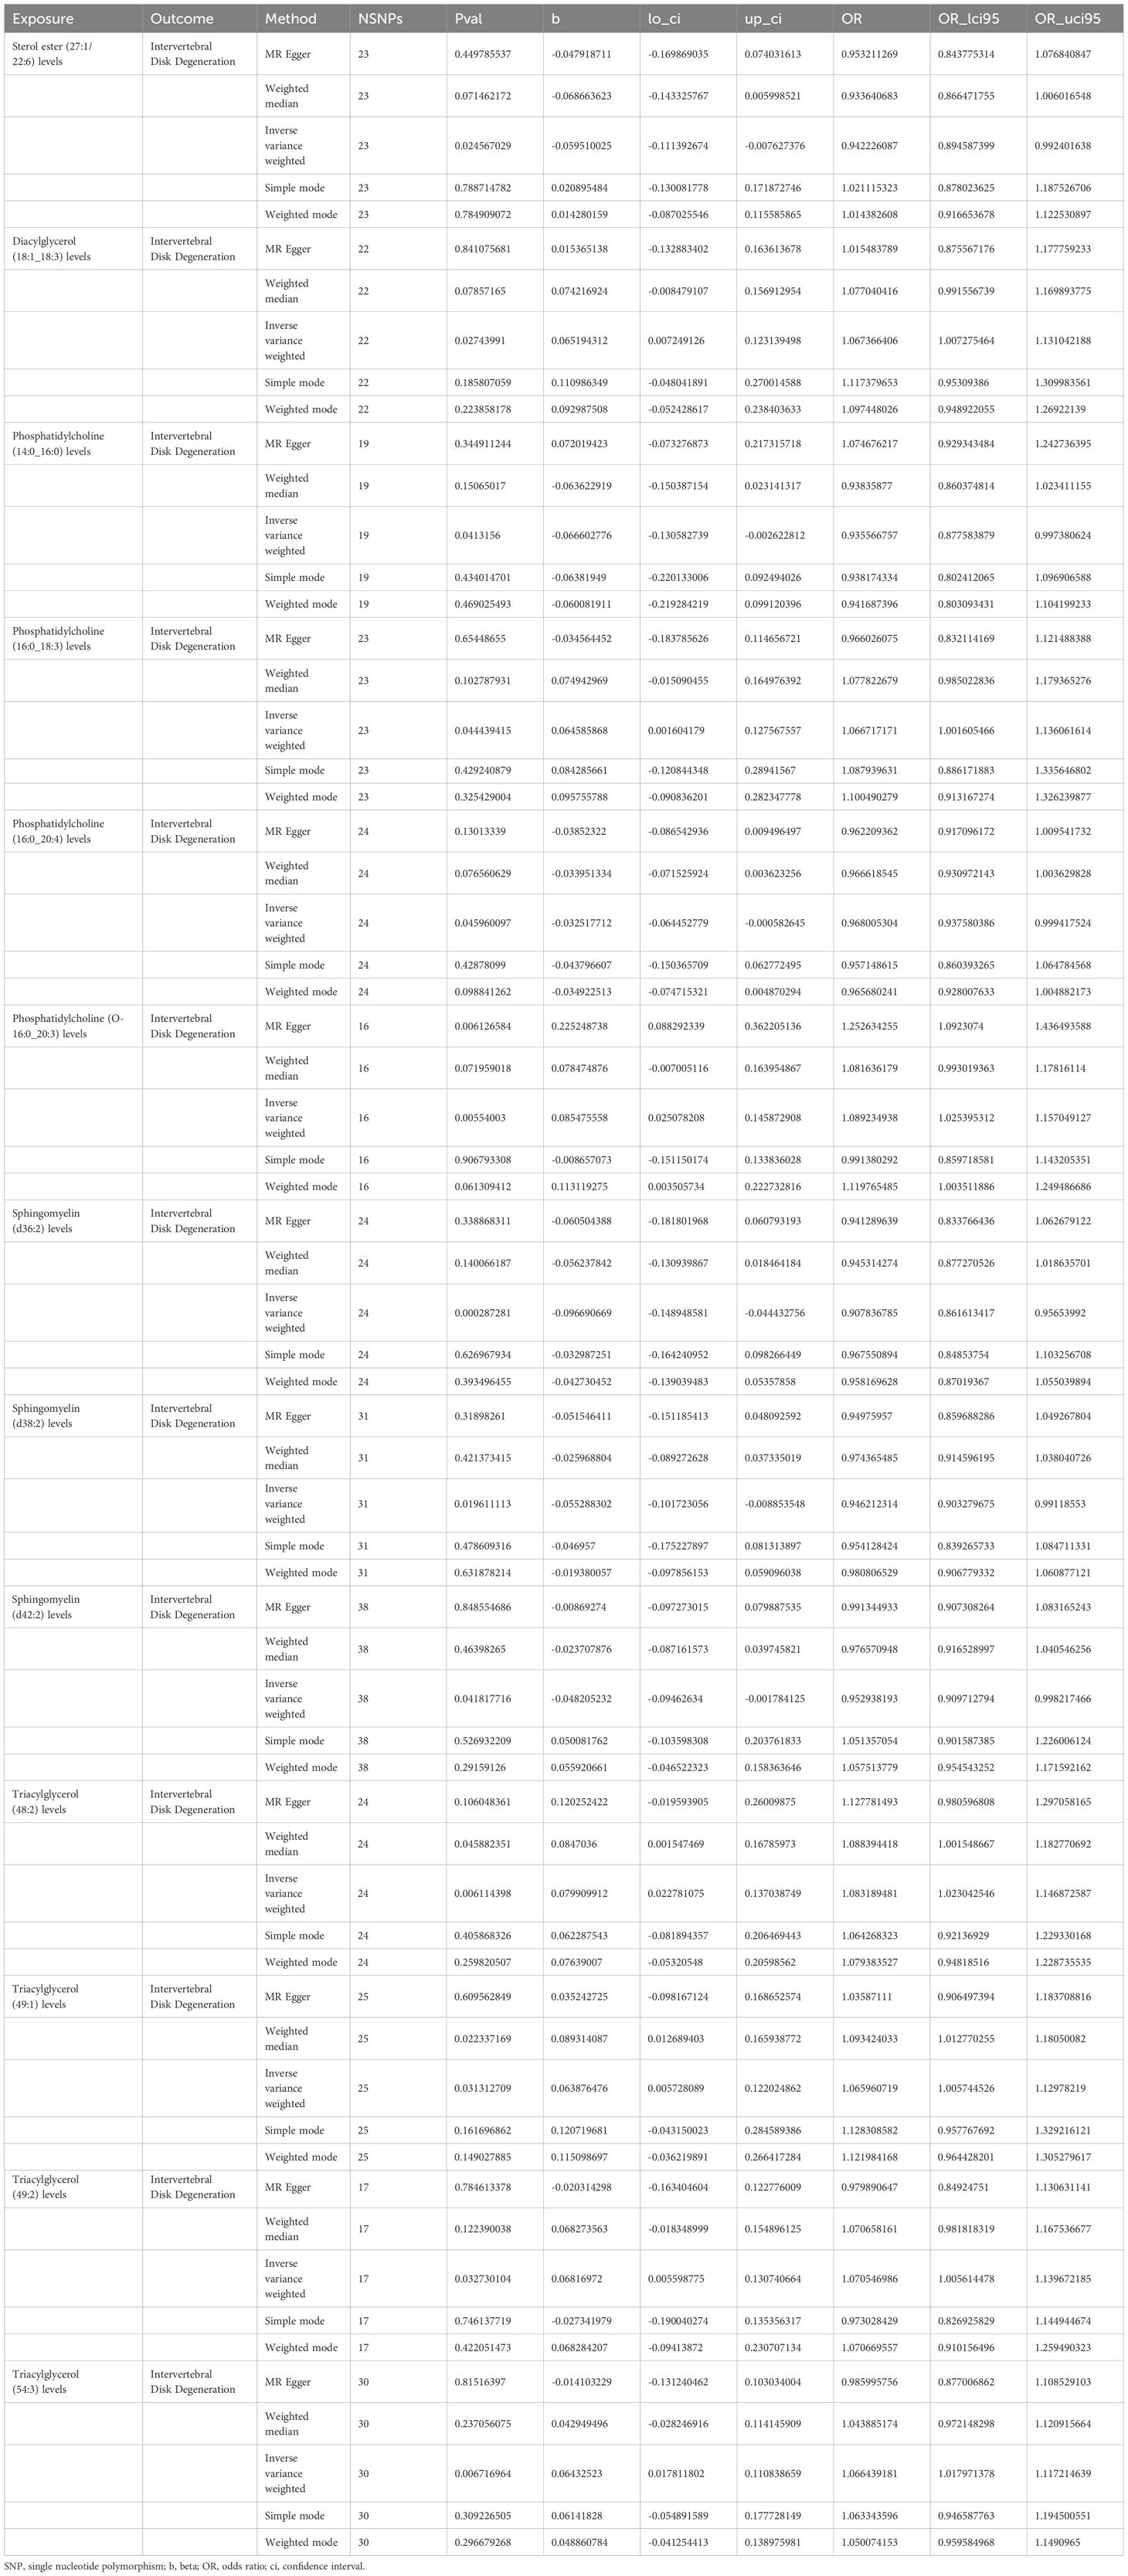
Table 2. Causal effects of liposomes on intervertebral disk degeneration.
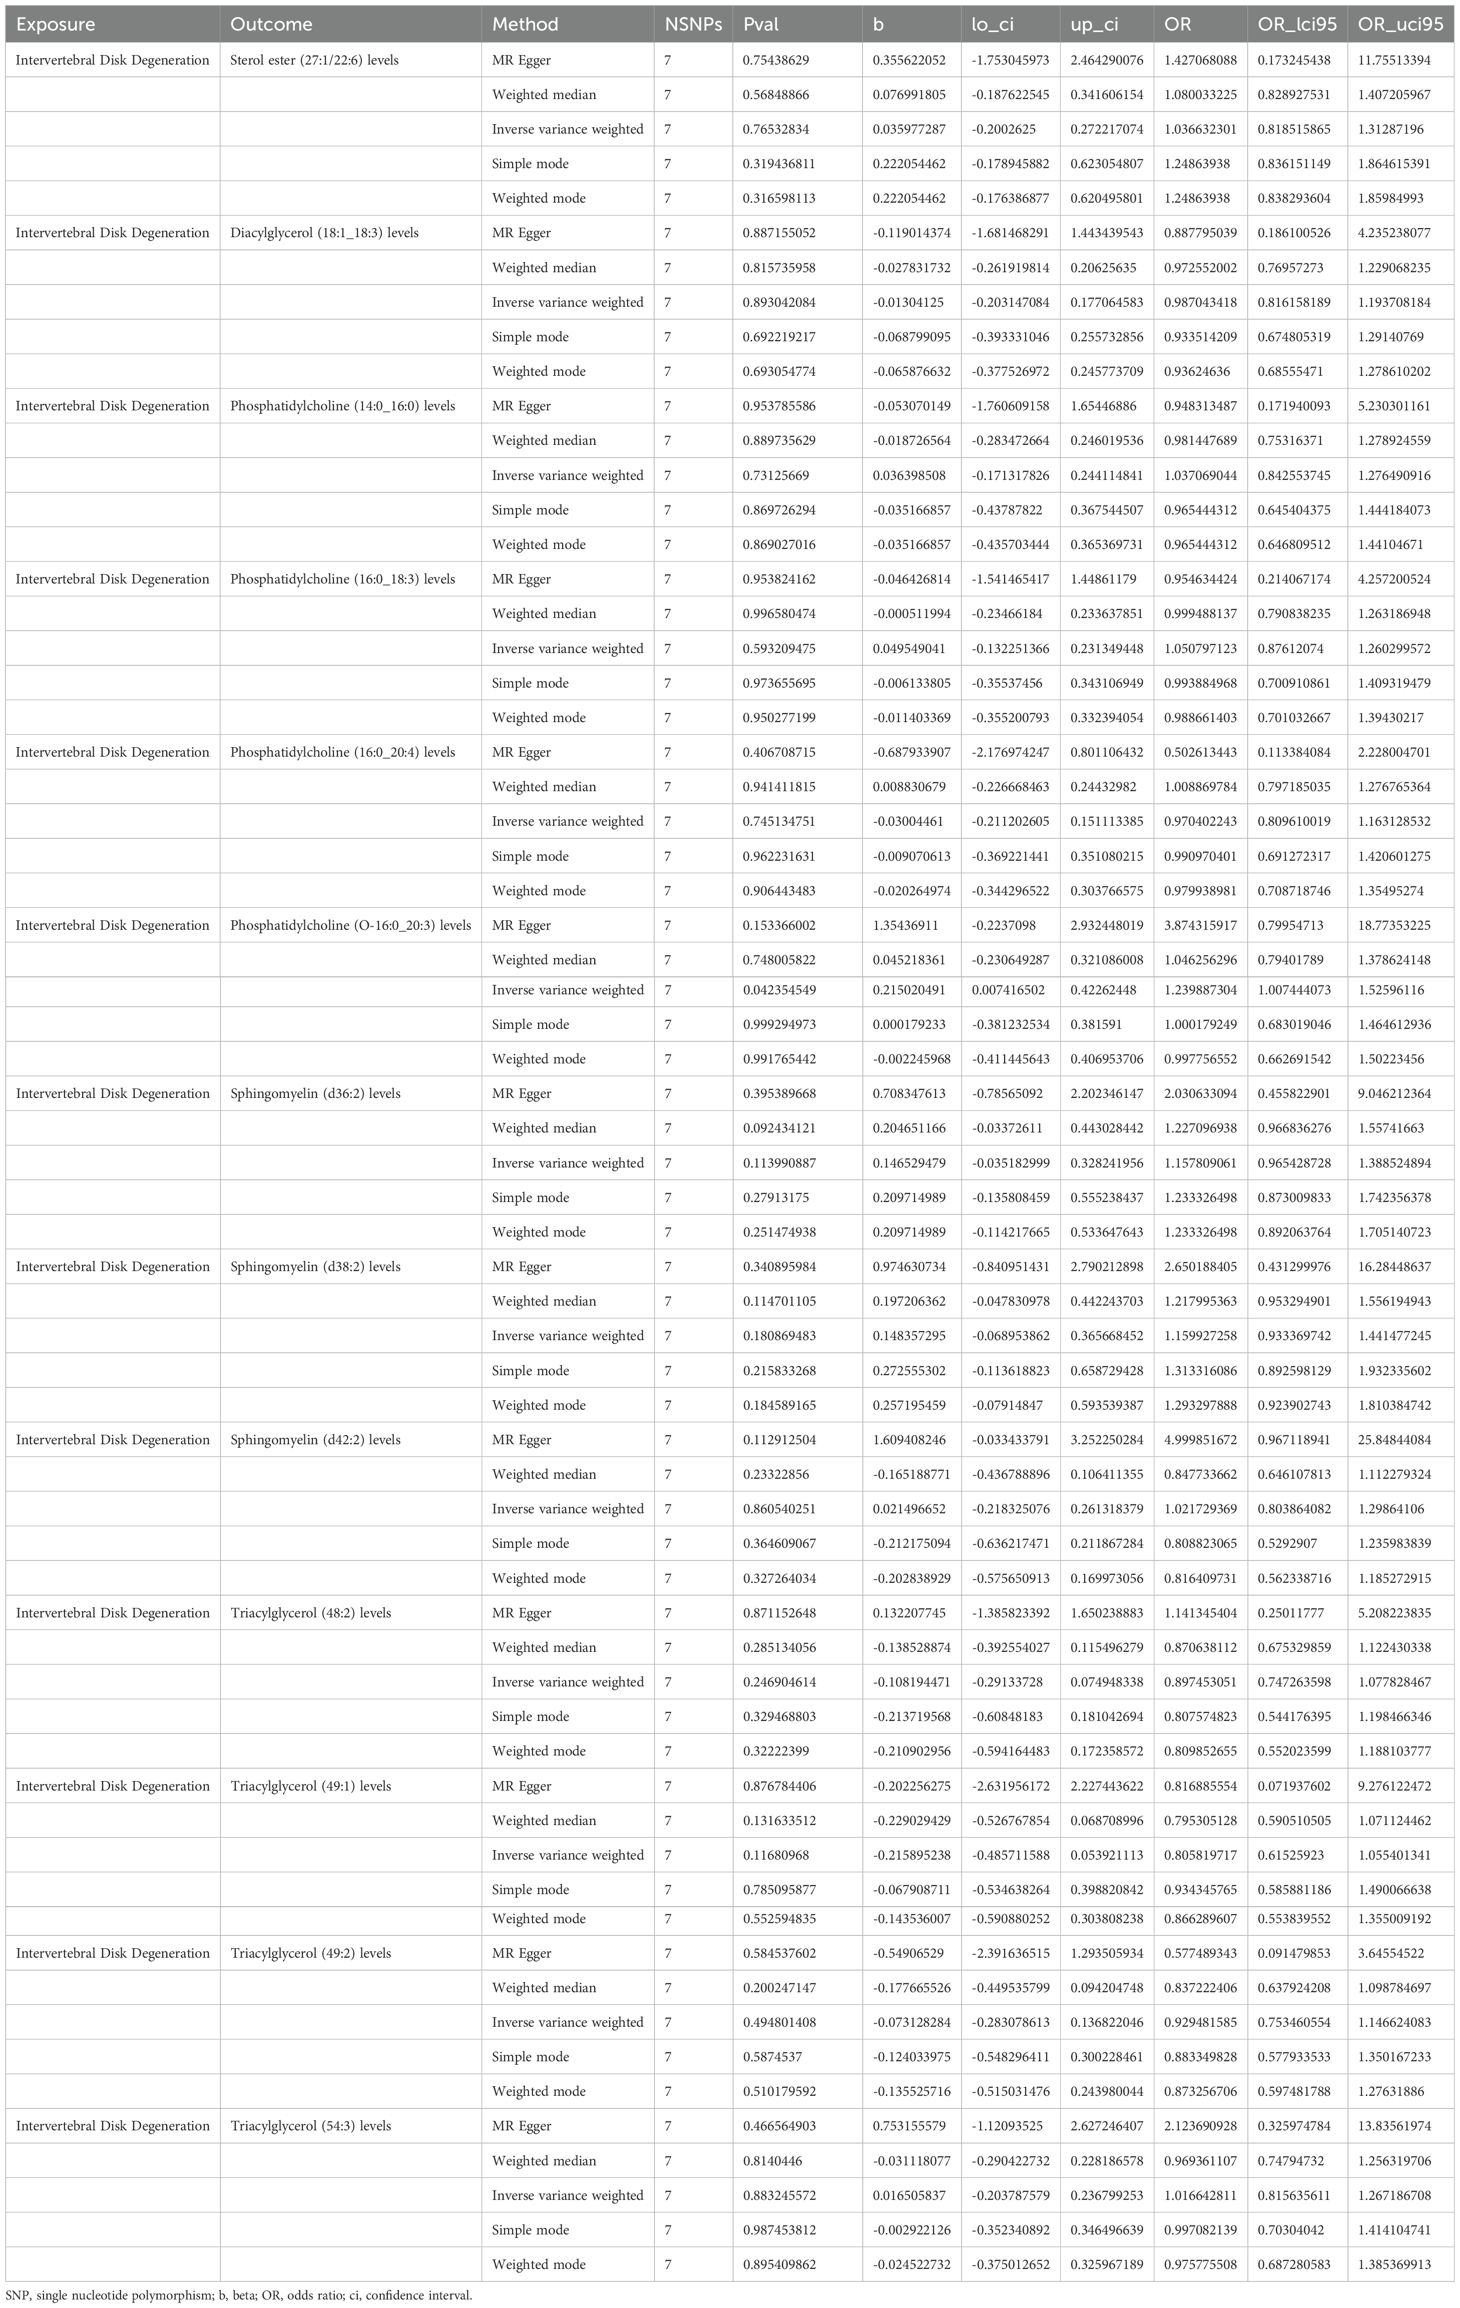
Table 3. Causal effects of intervertebral disk degeneration on liposomes.
MR analysis results of metabolite and IVDD
In the two-sample MR analysis, a total of 79 metabolites were found to be significantly linked to IVDD. Among these, 40 were identified as risk factors, such as N6-carbamoylthreonyladenosine levels, 2-hydroxy-3-methylvalerate levels, N-methyltaurine levels, 2-hydroxydecanoate levels, etc. Conversely, the remaining 39 metabolites were recognized as protective factors, including glucose to mannitol to sorbitol ratio, proline to trans-4-hydroxyproline ratio, mannose to mannitol to sorbitol ratio, etc (Supplementary Table 3).
Findings from the mediation MR analysis
To explore how liposomes might be involved in the development of IVDD, we conducted a mediation analysis using MR, with metabolites serving as the mediating factors between liposomes and IVDD. Three distinct mediating associations were discovered. Triacylglycerol (48:2) levels influence IVDD risk via the three metabolites, with the mediation via the ADP to glycine ratio being consistent with the overall effect, with a mediating effect percentage of 7.13%. In contrast, the mediating effects of 3-methylcytidine levels and IMP to phosphate ratio were opposite to the overall impact (Figure 2).
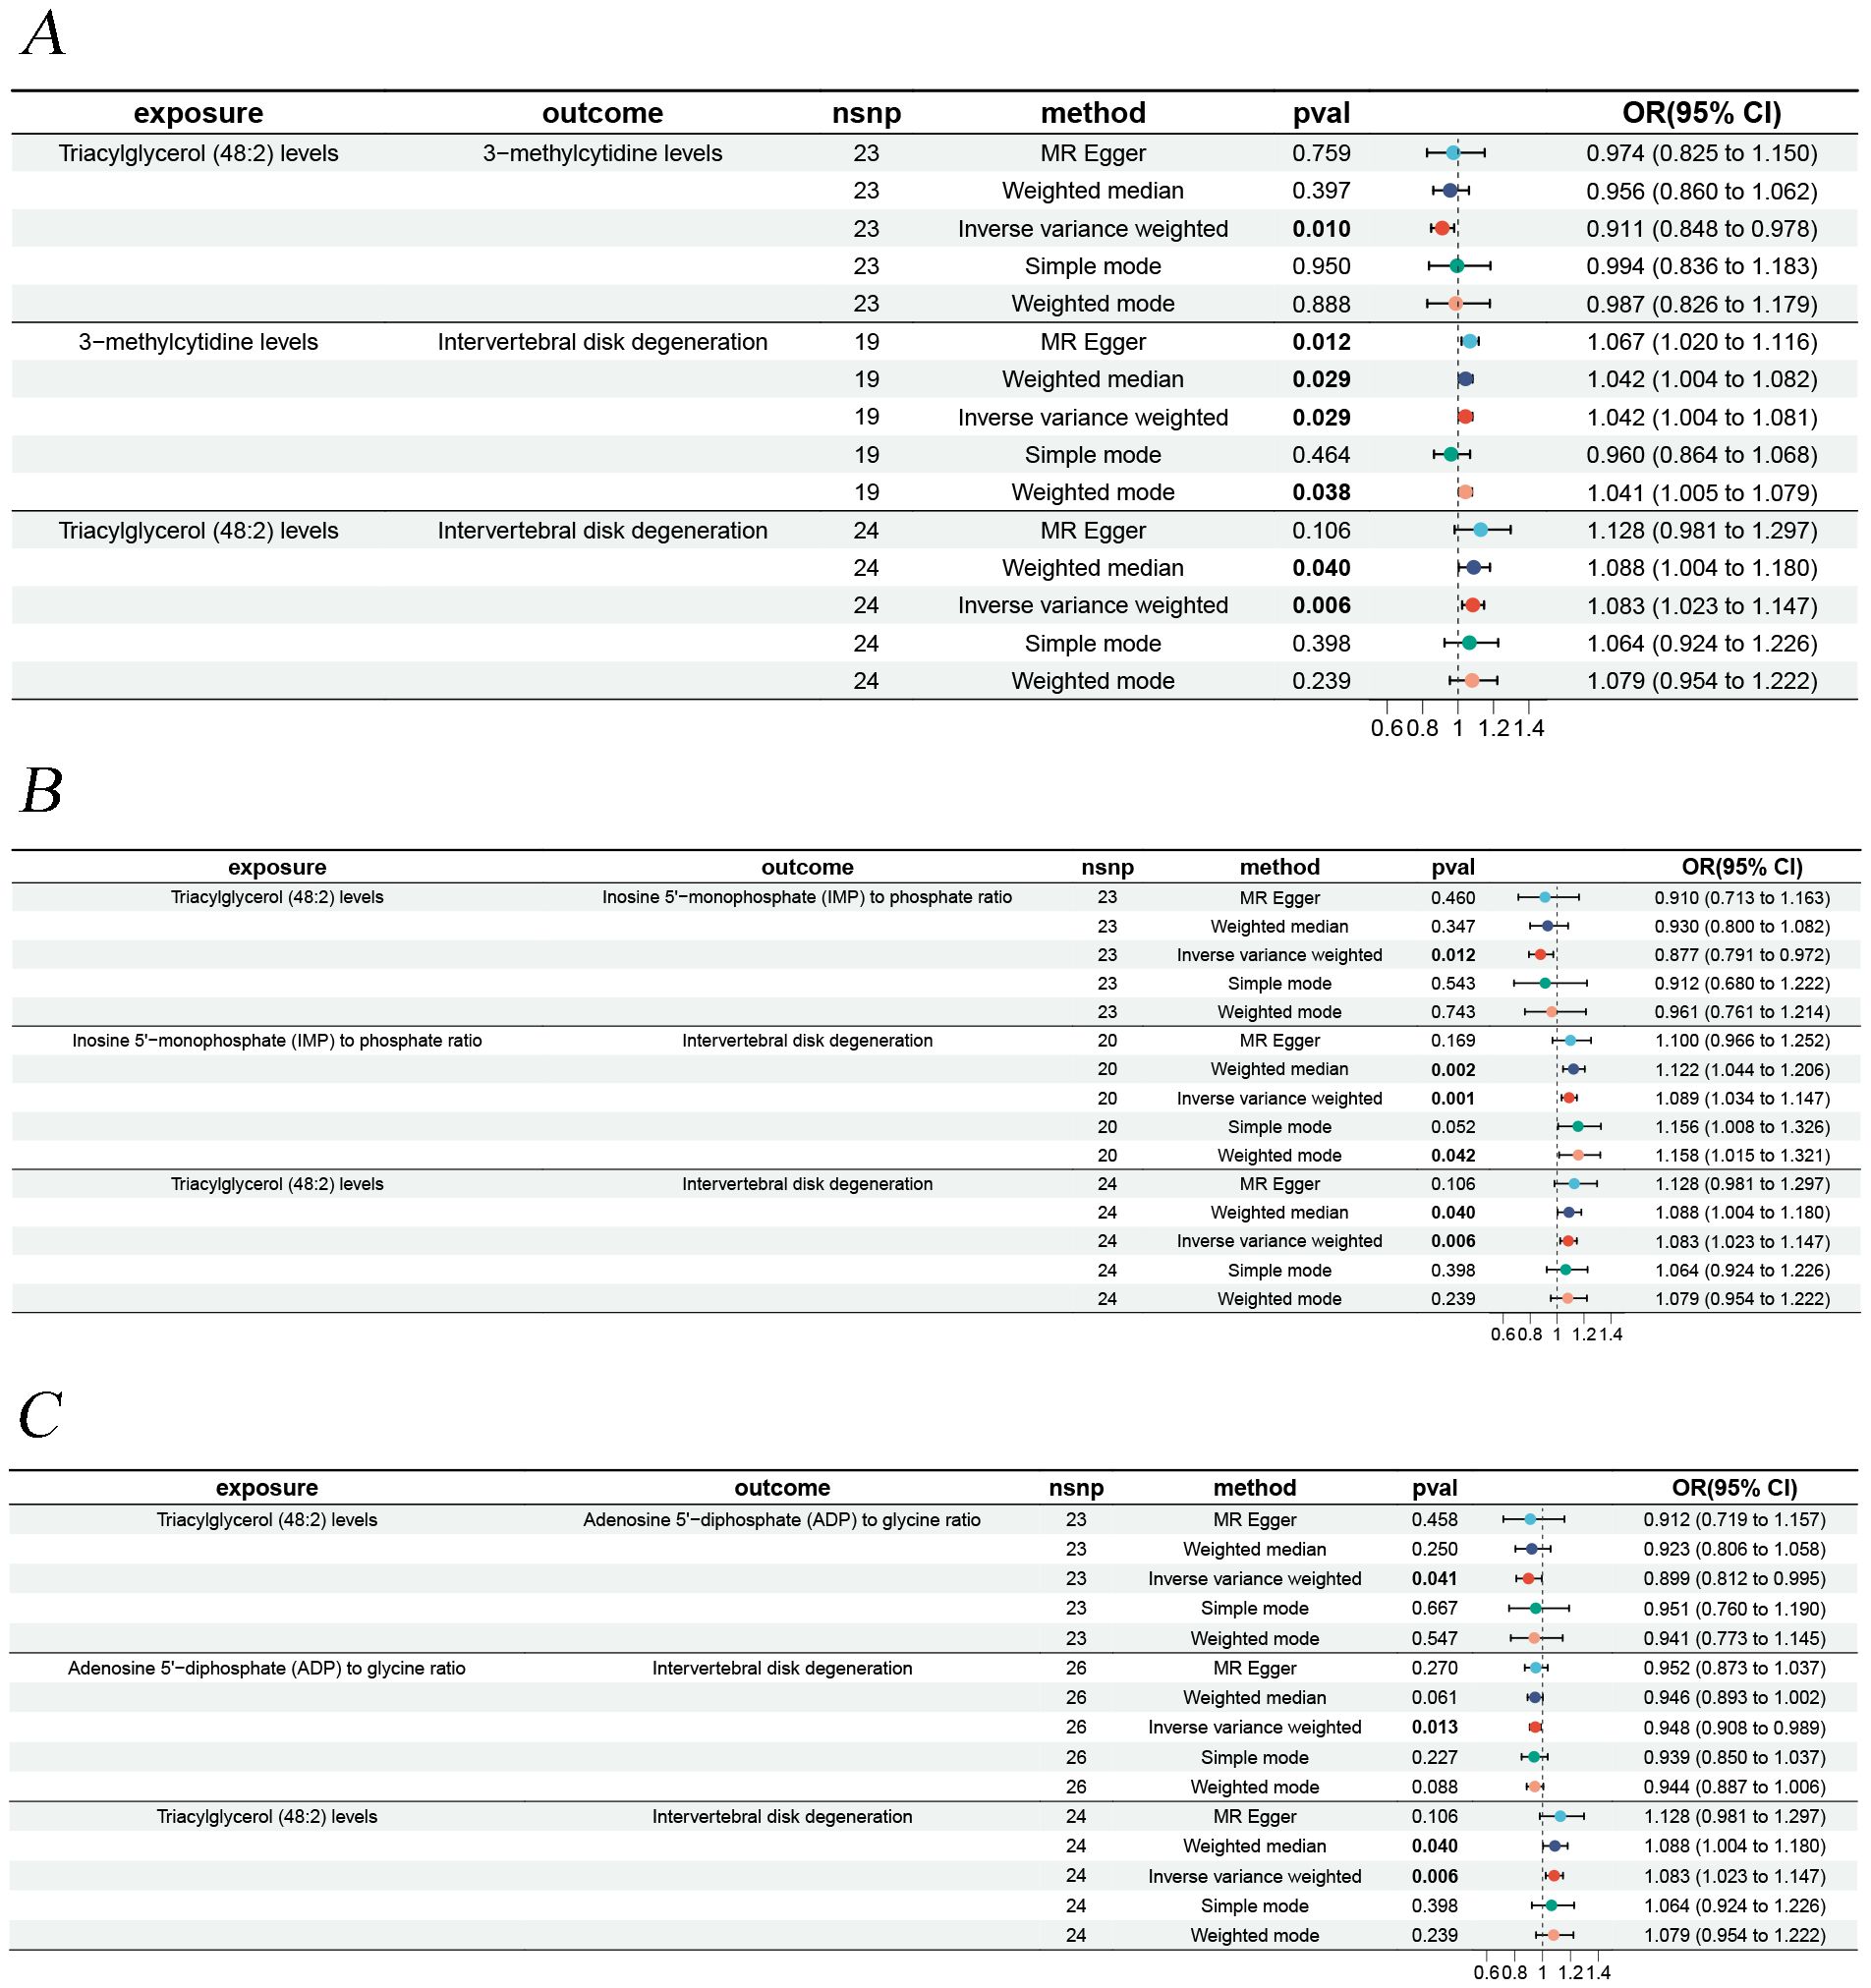
Figure 2. Forest plots illustrating the mediation analysis. (A) Triacylglycerol (48:2) levels impact on IVDD is mediated through 3-methylcytidine levels. (B) Triacylglycerol (48:2) levels impact on IVDD is mediated through inosine 5’-monophosphate (IMP) to phosphate ratio. (C) Triacylglycerol (48:2) levels impact on IVDD is mediated through adenosine 5’-diphosphate (ADP) to glycine ratio.
Sensitivity analysis
Sensitivity analyses revealed some MR findings were heterogeneous (Tables 4, 5; Supplementary Table 4). The heterogeneity arises from the intrinsic nature of MR (35). When a gene is located on the same chromosome, it exhibits correlation without adhering to patterns of genetic independence in variation. Furthermore, IVs derived from various unit of analysis, studies, populations, etc., are probably displaying heterogeneity, which can impact the outcomes of MR analyses. The pleiotropy assessment disclosed instances of horizontal pleiotropy among certain liposomes and metabolites in relation to IVDD analysis (Tables 4, 5; Supplementary Table 4). This suggests that segments of the IVs influence the outcomes through additional factors. However, the existing methodologies do not facilitate a comprehensive examination of the specific traits of every SNP. Consequently, we incorporated only those liposomes and metabolites that cleared the pleiotropy test in the following intermediary analysis (Table 6). Thus, the findings of this study maintain a high level of credibility. The leave-one-out test also indicated the reliability of the results (Supplementary Figures S1–S3).
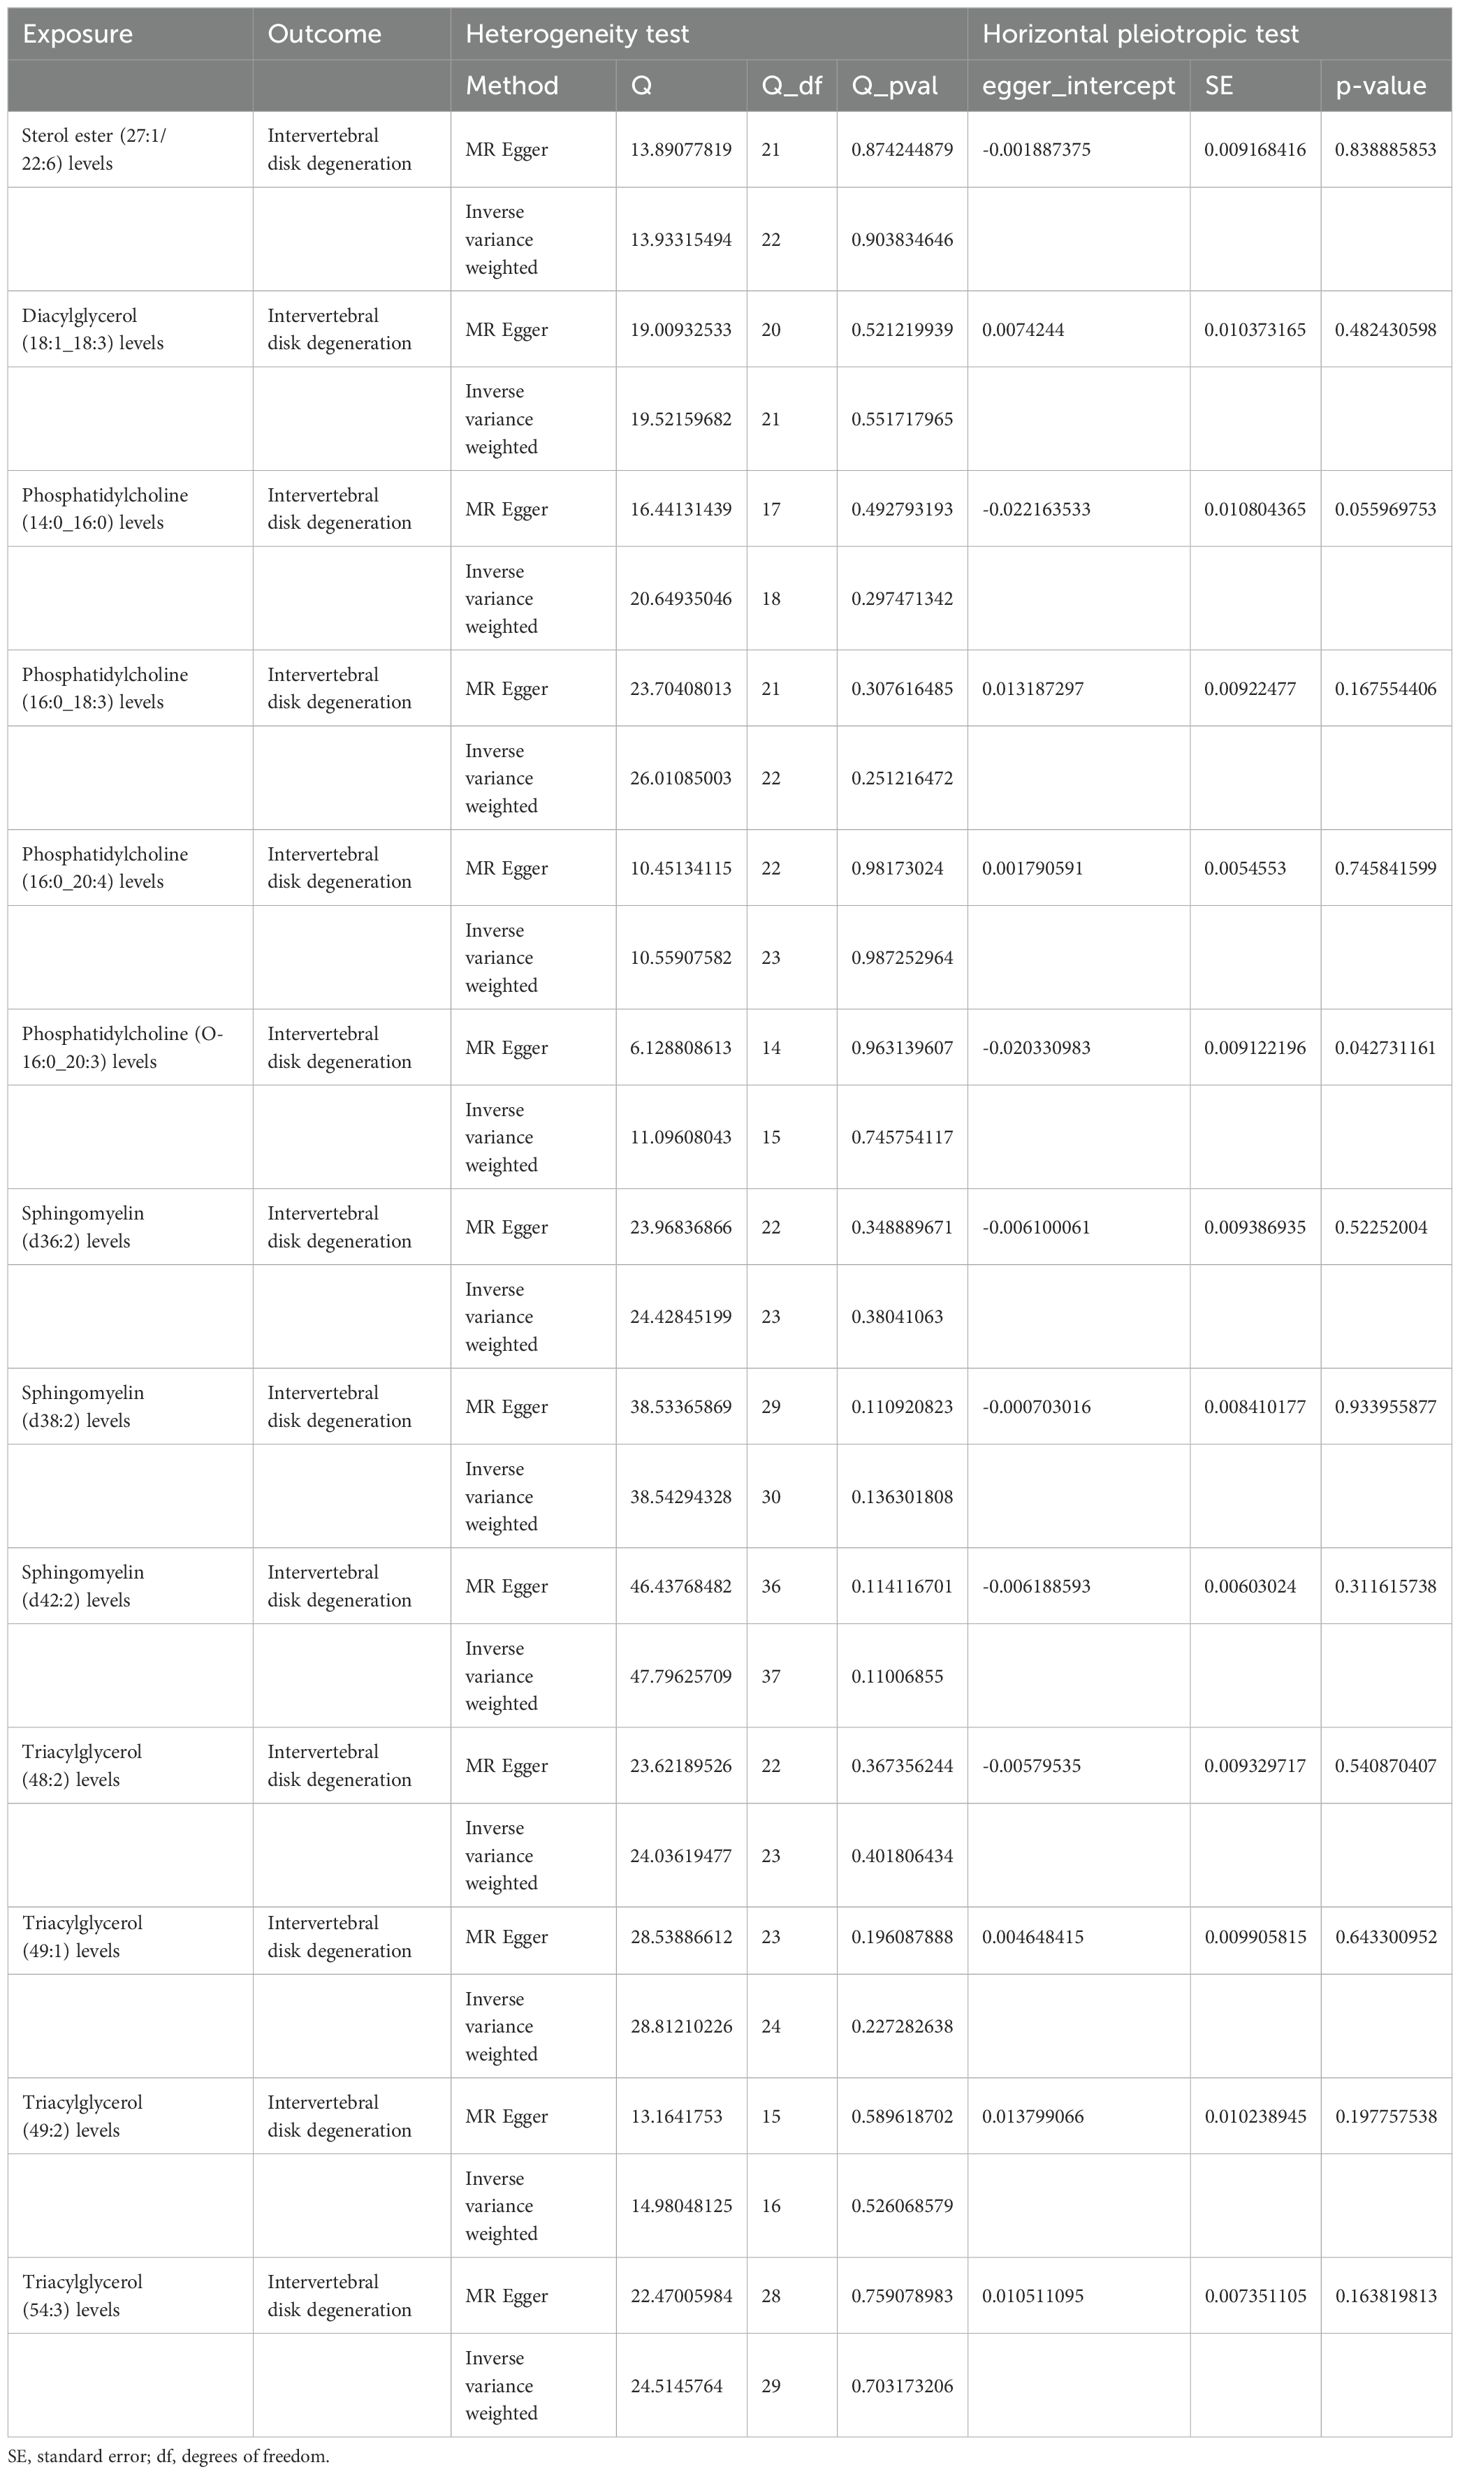
Table 4. The result of heterogeneity and horizontal pleiotropic test of liposomes on intervertebral disk degeneration.
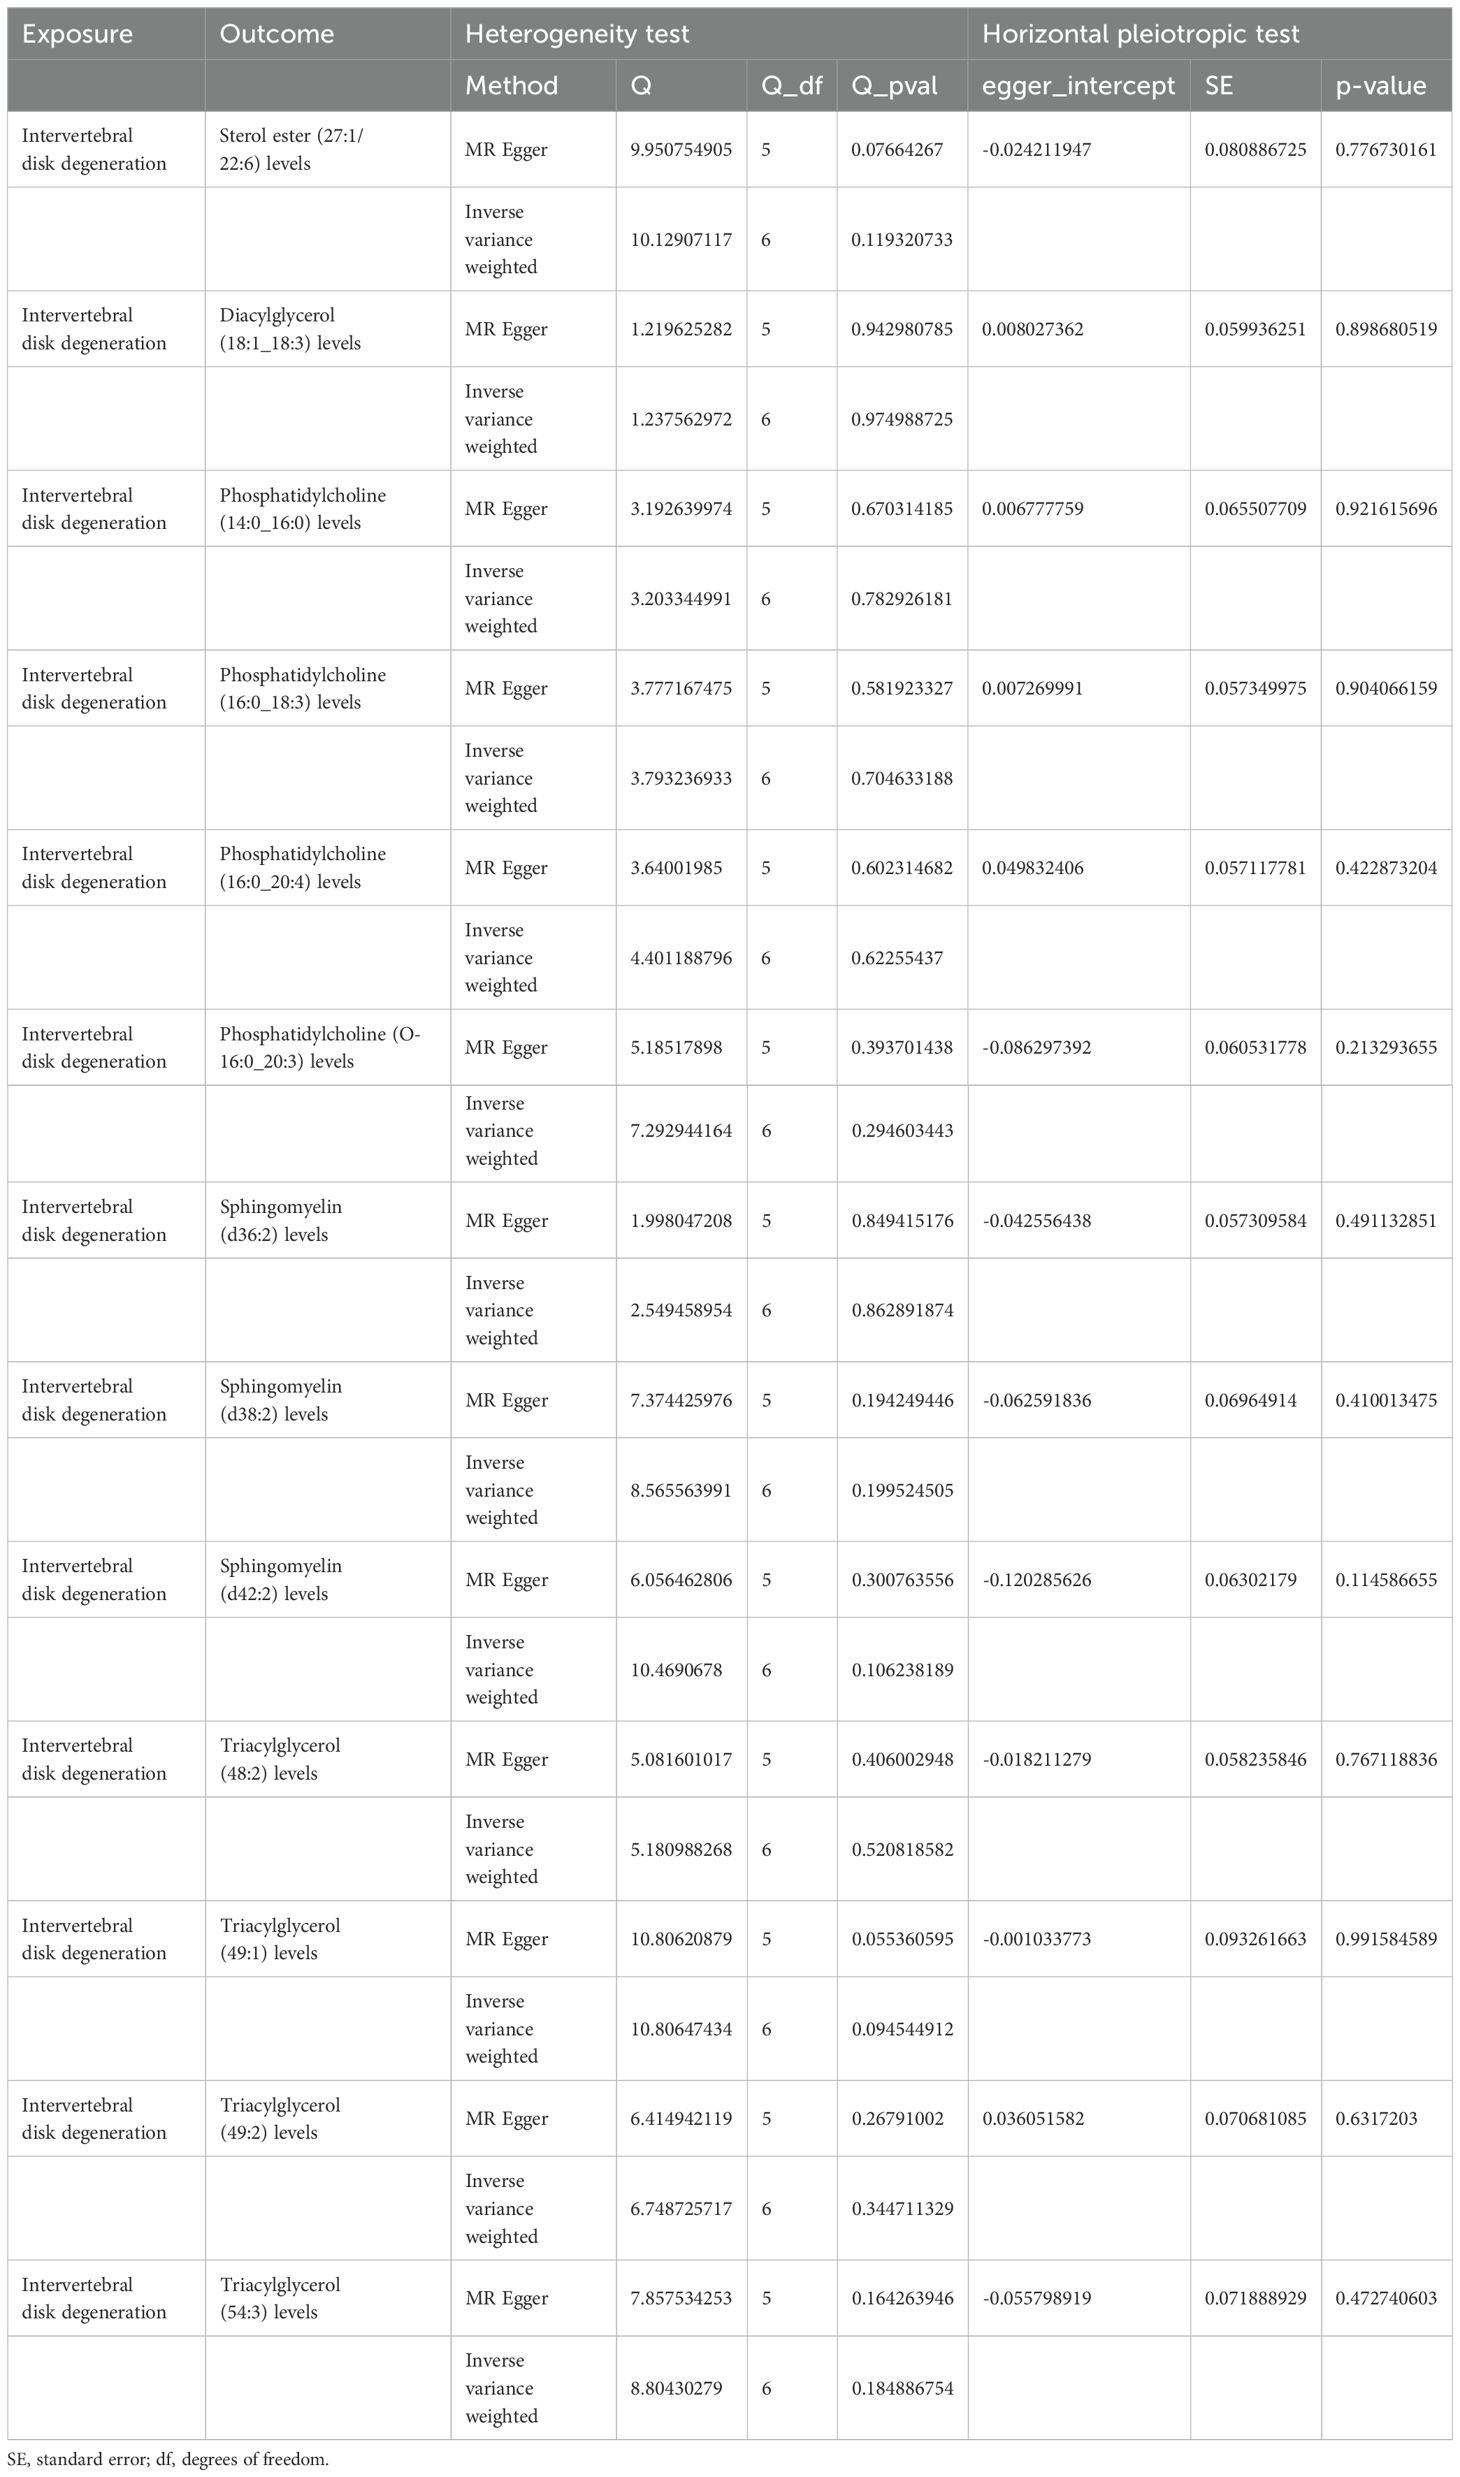
Table 5. The result of heterogeneity and horizontal pleiotropic test of intervertebral disk degeneration on liposomes.
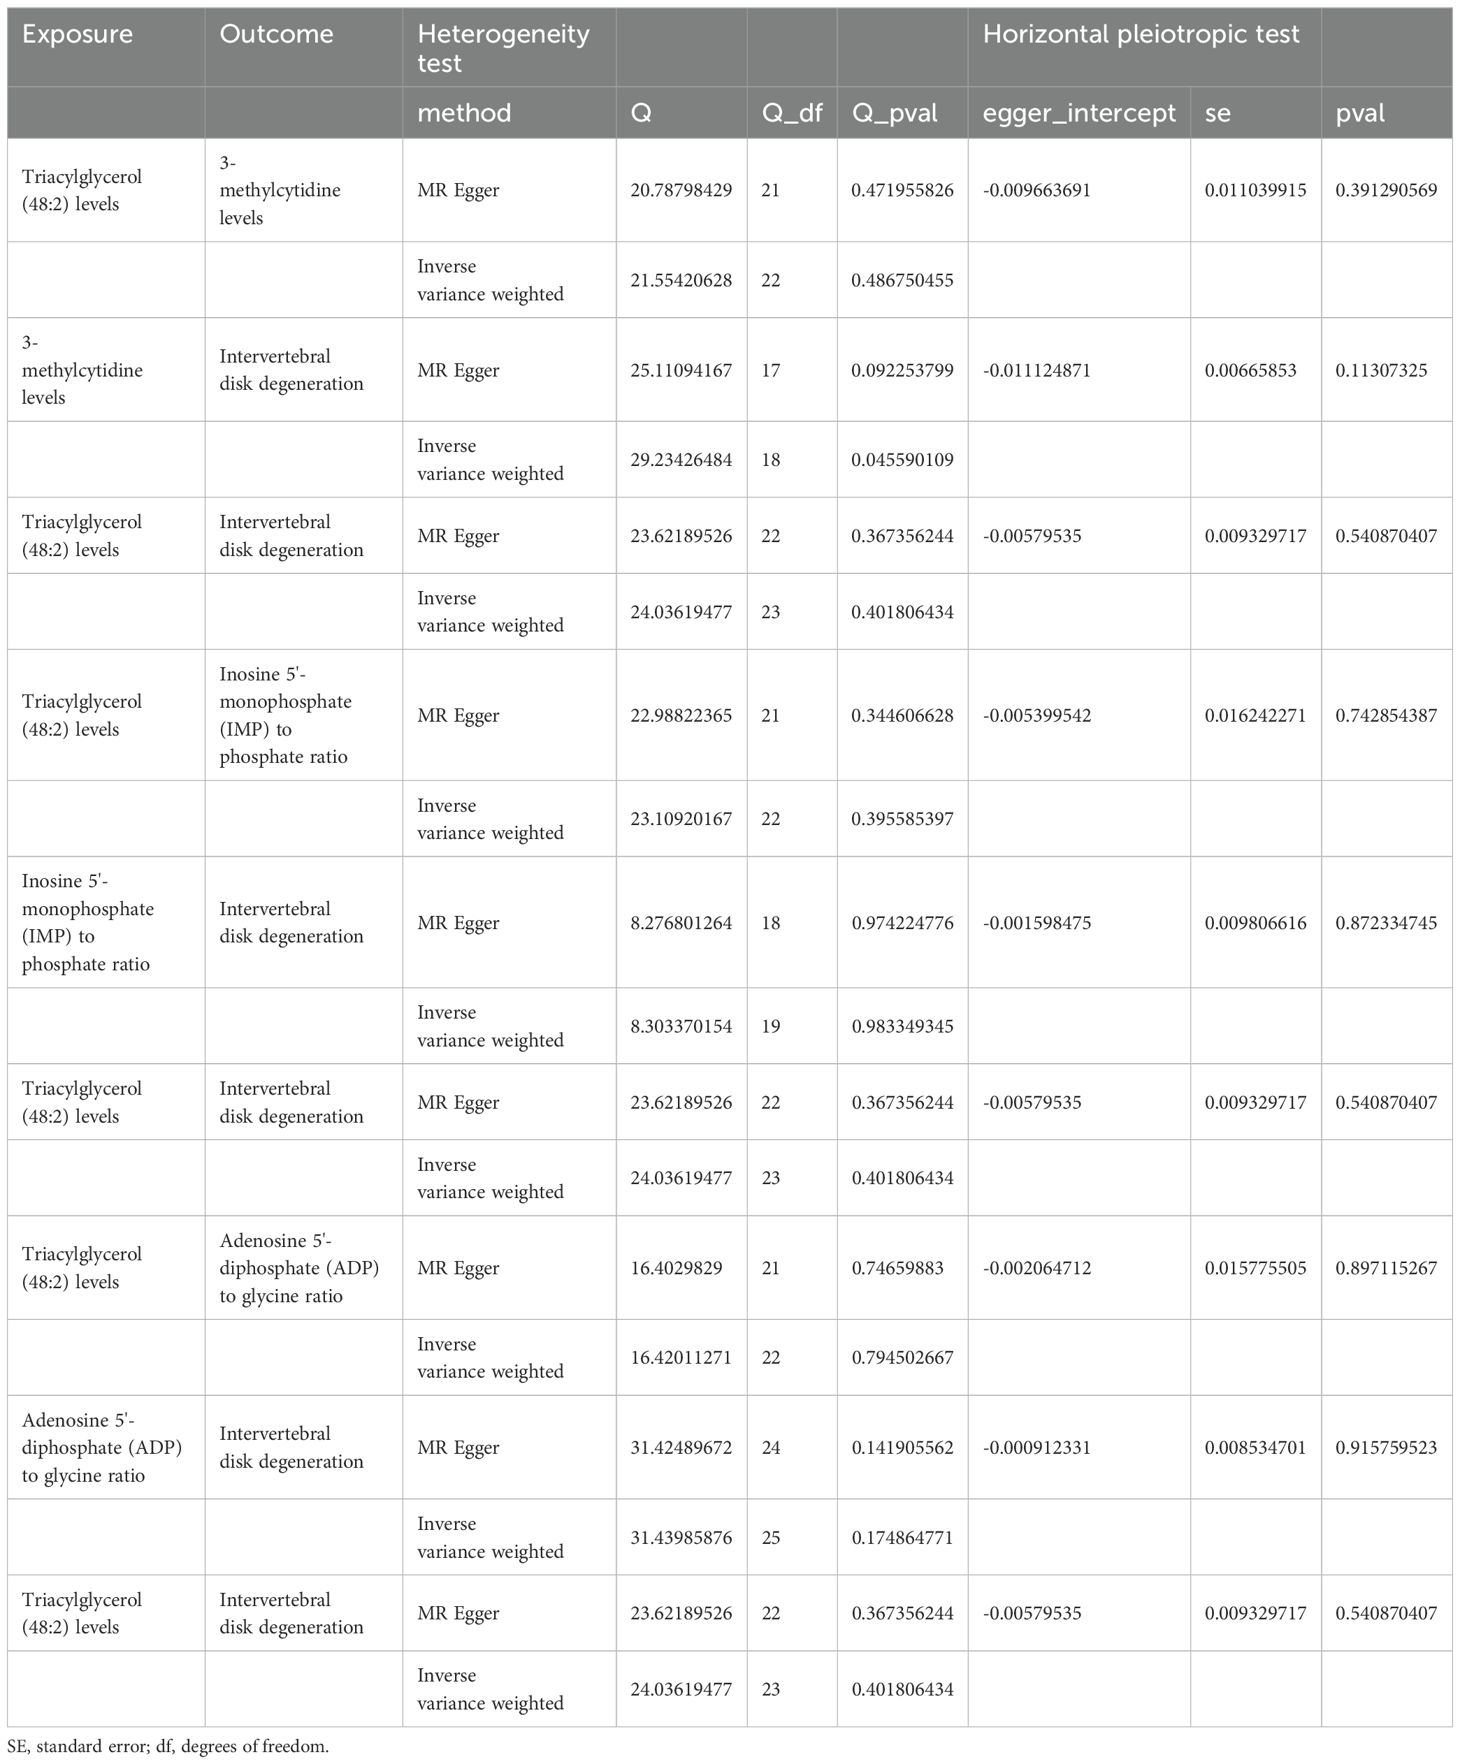
Table 6. The result of heterogeneity and horizontal pleiotropic test of 3 mediated relationships.
Discussion
This research explored the causality between liposomes, metabolites, and the risk of IVDD through MR analysis. We identified 13 liposomes (diacylglycerol (18:1_18:3) levels, phosphatidylcholine (14:0_16:0) levels, triacylglycerol (48:2) levels, etc.) and 79 metabolites (α-hydroxyisocaproic acid levels, butyrylpropionic acid levels, N-methyltaurine levels, etc.) might be linked to IVDD risk. Mediation analyses showed that triacylglycerol (48:2) levels could influence IVDD risk through three metabolites (3-methylcytidine levels, IMP to phosphate ratio, ADP to glycine ratio).
IVD is an avascular soft tissue structure situated in the intervertebral space. It is made up of the cartilaginous endplate, AF, and NP. IVDD, one of the most prevalent health issues worldwide, is considered to be a critical factor contributing to back and neck problems (36). Reduced levels of HDL and increased levels of TGs and LDL are the hallmarks of dyslipidemia. Lipid metabolism displays critical physiological functions in our body. Disorders of lipid metabolism can lead to obesity, hyperlipidemia, and hypercholesterolemia (37). A large-scale early cohort study involving 928 participants in the Wakayama Spine Study has revealed a possible link between disorders of lipid metabolism and IVDD (5). Zhang et al. found that clinically, age, BMI, and serum TGs were increased in the IVDD group by comparing IVDD grades with obesity-related elements in 128 volunteers and even once age and BMI are taken into account, TGs remain a significant risk factor for IVDD (38). Moreover, cell culture studies revealed that hypertriglyceridemia mediates disc cell apoptosis and matrix catabolism mainly through the MAPK signaling pathway, especially the ERK pathway (38). One of the risk factors for atherosclerosis is elevated blood TC. The four pairs of lumbar arteries and the central sacral artery are among the branch arteries of the abdominal aorta that may become blocked by atherosclerosis, which supplies blood to the lumbar spine. This obstruction further affects the blood supply to the IVD (39). Kauppila et al. found that advanced atherosclerotic manifestations of the aorta, particularly narrowing of the segmental arterial foramina above and below the IVDs, were associated with elevated IVDD grades, as assessed by routine autopsy of 86 lumbosacral spinal plain films and the corresponding abdominal aorta (39). The segmental arterioles’ stenosis was associated with elevated IVDD grades (40). High TGs play an essential function in IVDD development. Nevertheless, the underlying mechanisms still need to be completed. It is exciting that the present MR analysis identified three possible intermediary factors between TGs and IVDD.
IMP is a purine nucleotide essential to living organisms and enables animals to perceive fresh flavors (41–43). Zhang et al. found that oral administration of IMP to mice promoted the exogenous fatty acid uptake and conversion to TGs and enhanced the phosphorylation of liver IMP-activated protein kinase, resulting in adipose tissue hyperplasia (44). Obesity and being overweight are risk factors for lumbar radiculopathy and sciatica in both men and women, with a dose-response relationship, according to a meta-analysis that included data from 26 clinical investigations (45). Likewise, comparable findings were obtained by a recent meta-analysis that included ten cohort studies (46). This is consistent with our results. The results of the present mediated MR analysis suggest that TG levels cause a decrease in the IMP to phosphate ratio, which may be related to the negative feedback regulation caused by IMP facilitating the uptake and conversion of exogenous fatty acids to TGs.
ADP is an important signaling molecule that mediates various responses in cardiovascular, nervous, and other systems. Besides normal physiological processes, purinergic signaling facilitates numerous pathophysiological procedures, ranging from cell multiplication, polarization, cell motility, apoptosis, necrosis, vessel reshaping, and acute and chronic inflammation (47). Inflammation is strongly associated with the formation of thrombi, and platelets are vital mediators. ATP and ADP signaling have a crucial function in platelet activation. ADP triggers platelet aggregation via activation of P2Y1 and P2Y12 (48). Platelet activation and aggregation facilitate the attenuation of vascular rupture and bleeding in localized inflammatory areas, alleviating the ischemic and hypoxic conditions of tissues. Extracellular adenosine is also known as a “safety signal,” which inhibits the hypoxia-induced inflammatory response in ischemia and reperfusion (49). The conversion of extracellular ATP to adenosine is core to attenuating aseptic inflammation during ischemia/reperfusion injury. Experimental studies have shown that increasing the ATP catabolism to adenosine effectively attenuates tissue damage and aseptic inflammation in ischemia and reperfusion (50, 51).
Furthermore, some experimental studies have demonstrated the protective effects of adenosine signaling in ischemia and reperfusion models, e.g., adenosine or its analogs decrease the releasing of harmful oxidative metabolites from neutrophils after occupying specific receptors on neutrophils (52). Grenz et al. performed repetitive and nontraumatic occlusion of renal arteries in each adenosine receptor gene-targeted mouse. Then, Renal vascular A2B adenosine receptors protect the kidney against ischemia, as shown by measurements of certain parameters of renal function (53). The branches of the lumbar arteries, which begin at the base of the abdominal aorta, sustain the corpus lumborum. Nevertheless, arterial sclerosis usually occurs first in the lowest branches, leading to stenosis or occlusion of the lumbar artery segments (54, 55). As a result, some inflammation and damage caused by ischemia occurs. However, whether ADP can play a protective role against vertebral ischemic injury needs to be verified by more in-depth studies.
From a molecular biology perspective, the relationship between TG and IVDD can be explored at several levels. First, certain genes associated with TG metabolism may show aberrant expression in patients with IVDD, and such changes may affect disc cell metabolism and function by affecting TG synthesis or catabolism. For example, lipoprotein lipase and lipoprotein lipase-related protein play key roles in TG metabolism (56, 57), and their reduced expression in patients with IVDD may lead to TG accumulation, which affects intracellular lipid homeostasis and, consequently, disc health. Second, signaling pathways related to TG metabolism may be altered in IVDD, affecting cell proliferation, differentiation, and apoptosis. For example, the insulin signaling pathway plays an important role in regulating lipid metabolism and glucose metabolism, and its abnormalities may affect energy metabolism and anabolism of intervertebral disc cells, leading to degenerative changes (58). In addition, high TG levels may trigger cellular stress responses, such as endoplasmic reticulum stress, which affect disc cell function (59). Endoplasmic reticulum stress leads to the unfolded protein response, which activates the expression of a variety of stress-related genes and affects the balance of protein synthesis and degradation in cells, and prolonged endoplasmic reticulum stress may lead to cellular dysfunction and degeneration (60). TG accumulation may also trigger an inflammatory response, which may further exacerbate IVDD development. TG and its metabolites may affect the development of IVDD through the activation of inflammation-related signaling pathways, such as the NF-κB pathway, promoting the release of inflammatory factors, triggering an inflammatory response in the disc tissue, and further damaging the structure and function of the disc (61). Abnormal TG metabolism may also affect the synthesis and degradation of the disc’s extracellular matrix, leading to degenerative changes in the intervertebral disc. For example, matrix metalloproteinases (MMPs) play an important role in degenerative disc disease (62), and abnormal TG metabolism may affect the activity of MMPs, leading to degradation of the disc matrix and affecting disc stability and elasticity (63). Oxidative stress is also a key factor in the relationship between TG and IVDD. High TG levels may trigger oxidative stress (64), leading to damage and degenerative changes in intervertebral disc cells. Oxidative stress disrupts the intracellular antioxidant balance, leading to lipid peroxidation, protein oxidation, and DNA damage, which can further affect disc cell function and disc integrity (65, 66). Finally, genes associated with metabolic syndrome may play a role in IVDD, and these genes may affect both TG metabolism and disc health. For example, PPARγ (peroxisome proliferator-activated receptor γ) plays a key role in lipid metabolism and inflammatory responses, and aberrant expression of PPARγ may affect both TG metabolism and inflammatory responses in the intervertebral discs, which may contribute to the development of IVDD (67–69). By exploring the above molecular biological mechanisms, we can gain a deeper understanding of the relationship between TG and IVDD and provide a theoretical basis for future therapeutic strategies.
Study strengths and limitations
This analysis has two strengths. First, it is the first study to investigate the relationship between liposomes and metabolites and the risk of IVDD using large-scale GWAS data, which eliminates confounders and reverse causality. This is highly beneficial in obtaining a thorough understanding of the relationship between liposomes and metabolites and the IVDD risk. Secondly, the bias was reduced through employing a two-sample study design, which involved using separate datasets for exposures and outcomes data, ensuring no intersection between the two sets of data. Nevertheless, there are certain aspects of this research that could be enhanced. Initially, the bulk of the data for this study was sourced from publicly accessible online databases; however, due to variations in platforms and geographic areas, some data might exhibit heterogeneity and may not entirely substitute for traditional research methods. Secondly, the IVDD data utilized in this study lacked specific details about the study subject, preventing a subgroup analysis based on various regions or gender. Consequently, the study outcomes might be limited in their applicability to populations from certain regions or specific genders. Finally, this study focused on analyzing causality from a genetic perspective, and the precise underlying mechanisms need to be explored in the future through necessary laboratory tests.
Conclusion
Our comprehensive MR analysis identified 13 liposomes and 79 metabolites, which may have possible causal links to IVDD. Additionally, we discovered three intermediary associations between liposomes and IVDD. These metabolites and liposomes will be useful for IVDD mechanistic research as well as clinical diagnostics for prognosis and risk assessment.
Data availability statement
The original contributions presented in the study are included in the article/Supplementary Material. Further inquiries can be directed to the corresponding authors.
Author contributions
D-QC: Conceptualization, Writing – original draft. Z-QQ: Validation, Writing – original draft. W-BX: Data curation, Software, Writing – original draft. K-YX: Formal analysis, Writing – original draft. N-KS: Visualization, Writing – original draft. H-YS: Formal analysis, Writing – original draft. J-YF: Formal analysis, Writing – original draft. G-XL: Funding acquisition, Supervision, Writing – review & editing. GR: Funding acquisition, Supervision, Writing – review & editing.
Funding
The author(s) declare financial support was received for the research, authorship, and/or publication of this article. This study received financial support from the Natural Science Foundation of Fujian Province (Grant Number: 2021J05282), Xiamen Municipal Bureau of Science and Technology (Grant Number: 3502Z20224033) and Xiamen Science and Technology Program (No. 3502Z20224ZD1003).
Acknowledgments
We express gratitude to the GWAS catalog and FinnGen database for providing relevant genetic data.
Conflict of interest
The authors declare that the research was conducted in the absence of any commercial or financial relationships that could be construed as a potential conflict of interest.
Publisher’s note
All claims expressed in this article are solely those of the authors and do not necessarily represent those of their affiliated organizations, or those of the publisher, the editors and the reviewers. Any product that may be evaluated in this article, or claim that may be made by its manufacturer, is not guaranteed or endorsed by the publisher.
Supplementary material
The Supplementary Material for this article can be found online at: https://www.frontiersin.org/articles/10.3389/fendo.2024.1403523/full#supplementary-material
References
1. Yi J, Zhou Q, Huang J, Niu S, Ji G, Zheng T. Lipid metabolism disorder promotes the development of intervertebral disc degeneration. BioMed Pharmacother. (2023) 166:115401. doi: 10.1016/j.biopha.2023.115401
2. Raj PP. Intervertebral disc: anatomy-physiology-pathophysiology-treatment. Pain Pract. (2008) 8:18–44. doi: 10.1111/j.1533-2500.2007.00171.x
3. Zhang W, Sun T, Li Y, Yang M, Zhao Y, Liu J, et al. Application of stem cells in the repair of intervertebral disc degeneration. Stem Cell Res Ther. (2022) 13:70. doi: 10.1186/s13287-022-02745-y
4. Mohd Isa IL, Mokhtar SA, Abbah SA, Fauzi MB, Devitt A, Pandit A. Intervertebral disc degeneration: biomaterials and tissue engineering strategies toward precision medicine. Adv Healthc Mater. (2022) 11:e2102530. doi: 10.1002/adhm.202102530
5. Teraguchi M, Yoshimura N, Hashizume H, Muraki S, Yamada H, Oka H, et al. Metabolic syndrome components are associated with intervertebral disc degeneration: the wakayama spine study. PloS One. (2016) 11:e0147565. doi: 10.1371/journal.pone.0147565
6. Huang Z, Chen J, Su Y, Guo M, Chen Y, Zhu Y, et al. Impact of dyslipidemia on the severity of symptomatic lumbar spine degeneration: A retrospective clinical study. Front Nutr. (2022) 9:1033375. doi: 10.3389/fnut.2022.1033375
7. Zhang Y, Zhao Y, Wang M, Si M, Li J, Hou Y, et al. Serum lipid levels are positively correlated with lumbar disc herniation–a retrospective study of 790 Chinese patients. Lipids Health Dis. (2016) 15:80. doi: 10.1186/s12944-016-0248-x
8. Curic G. Intervertebral disc and adipokine leptin-loves me, loves me not. Int J Mol Sci. (2020) 22:375. doi: 10.3390/ijms22010375
9. Walsh TP, Arnold JB, Evans AM, Yaxley A, Damarell RA, Shanahan EM. The association between body fat and musculoskeletal pain: a systematic review and meta-analysis. BMC Musculoskelet Disord. (2018) 19:233. doi: 10.1186/s12891-018-2137-0
10. Liu C, Gao X, Lou J, Li H, Chen Y, Chen M, et al. Aberrant mechanical loading induces annulus fibrosus cells apoptosis in intervertebral disc degeneration via mechanosensitive ion channel Piezo1. Arthritis Res Ther. (2023) 25:117. doi: 10.1186/s13075-023-03093-9
11. Urban JP, Roberts S. Degeneration of the intervertebral disc. Arthritis Res Ther. (2003) 5:120–30. doi: 10.1186/ar629
12. Liuke M, Solovieva S, Lamminen A, Luoma K, Leino-Arjas P, Luukkonen R, et al. Disc degeneration of the lumbar spine in relation to overweight. Int J Obes (Lond). (2005) 29:903–8. doi: 10.1038/sj.ijo.0802974
13. Francisco V, Pino J, González-Gay MÁ, Lago F, Karppinen J, Tervonen O, et al. A new immunometabolic perspective of intervertebral disc degeneration. Nat Rev Rheumatol. (2022) 18:47–60. doi: 10.1038/s41584-021-00713-zIF:33.7
14. Ruiz-Fernández C, Francisco V, Pino J, Mera A, González-Gay MA, Gómez R, et al. Molecular relationships among obesity, inflammation and intervertebral disc degeneration: are adipokines the common link? Int J Mol Sci. (2019) 20:2030. doi: 10.3390/ijms20082030
15. Hu S, Shao Z, Zhang C, Chen L, Mamun AA, Zhao N, et al. Chemerin facilitates intervertebral disc degeneration via TLR4 and CMKLR1 and activation of NF-kB signaling pathway. Aging (Albany NY). (2020) 12:11732–53. doi: 10.18632/aging.103339
16. Heindel JJ, Newbold R, Schug TT. Endocrine disruptors and obesity. Nat Rev Endocrinol. (2015) 11:653–61. doi: 10.1038/nrendo.2015.163
17. Singla P, Bardoloi A, Parkash AA. Metabolic effects of obesity: A review. World J Diabetes. (2010) 1:76–88. doi: 10.4239/wjd.v1.i3.76
18. Ouchi N, Parker JL, Lugus JJ, Walsh K. Adipokines in inflammation and metabolic disease. Nat Rev Immunol. (2011) 11:85–97. doi: 10.1038/nri2921
19. Ottensmann L, Tabassum R, Ruotsalainen SE, Gerl MJ, Klose C, Widén E, et al. Genome-wide association analysis of plasma lipidome identifies 495 genetic associations. Nat Commun. (2023) 14:6934. doi: 10.1038/s41467-023-42532-8
20. NaPier Z, Kanim LEA, Arabi Y, Salehi K, Sears B, Perry M, et al. Omega-3 fatty acid supplementation reduces intervertebral disc degeneration. Med Sci Monit. (2019) 25:9531–7. doi: 10.12659/MSM.918649
21. Zheng J, Baird D, Borges MC, Bowden J, Hemani G, Haycock P, et al. Recent developments in mendelian randomization studies. Curr Epidemiol Rep. (2017) 4:330–45. doi: 10.1007/s40471-017-0128-6
22. Zhu T, Goodarzi MO. Causes and consequences of polycystic ovary syndrome: insights from mendelian randomization. J Clin Endocrinol Metab. (2022) 107:e899–911. doi: 10.1210/clinem/dgab757
23. Boef AG, Dekkers OM, le Cessie S. Mendelian randomization studies: a review of the approaches used and the quality of reporting. Int J Epidemiol. (2015) 44:496–511. doi: 10.1093/ije/dyv071
24. Lawlor DA, Harbord RM, Sterne JA, Timpson N, Davey Smith G. Mendelian randomization: using genes as instruments for making causal inferences in epidemiology. Stat Med. (2008) 27:1133–63. doi: 10.1002/sim.3034
25. Hartwig FP, Davies NM, Hemani G, Davey Smith G. Two-sample Mendelian randomization: avoiding the downsides of a powerful, widely applicable but potentially fallible technique. Int J Epidemiol. (2016) 45:1717–26. doi: 10.1093/ije/dyx028
26. Ma XY, Liu HM, Lv WQ, Qiu C, Xiao HM, Deng HW. A bi-directional Mendelian randomization study of the sarcopenia-related traits and osteoporosis. Aging (Albany NY). (2022) 14:5681–98. doi: 10.18632/aging.204145
27. Chen Y, Lu T, Pettersson-Kymmer U, Stewart ID, Butler-Laporte G, Nakanishi T, et al. Genomic atlas of the plasma metabolome prioritizes metabolites implicated in human diseases. Nat Genet. (2023) 55:44–53. doi: 10.1038/s41588-022-01270-1
28. Burgess S, Butterworth A, Thompson SG. Mendelian randomization analysis with multiple genetic variants using summarized data. Genet Epidemiol. (2013) 37:658–65. doi: 10.1002/gepi.21758
29. Bowden J, Davey Smith G, Haycock PC, Burgess S. Consistent estimation in mendelian randomization with some invalid instruments using a weighted median estimator. Genet Epidemiol. (2016) 40:304–14. doi: 10.1002/gepi.21965
30. Bowden J, Davey Smith G, Burgess S. Mendelian randomization with invalid instruments: effect estimation and bias detection through Egger regression. Int J Epidemiol. (2015) 44:512–25. doi: 10.1093/ije/dyv080
31. Burgess S, Thompson SG. Interpreting findings from Mendelian randomization using the MR-Egger method. Eur J Epidemiol. (2017) 32:377–89. doi: 10.1007/s10654-017-0255-x
32. Niu PP, Song B, Wang X, Xu YM. Serum uric acid level and multiple sclerosis: A mendelian randomization study. Front Genet. (2020) 11:254. doi: 10.3389/fgene.2020.00254
33. Yavorska OO, Burgess S. MendelianRandomization: an R package for performing Mendelian randomization analyses using summarized data. Int J Epidemiol. (2017) 46:1734–9. doi: 10.1093/ije/dyx034
34. Yan H, Zhao S, Huang HX, Xie P, Cai XH, Qu YD, et al. Systematic Mendelian randomization study of the effect of gut microbiome and plasma metabolome on severe COVID-19. Front Immunol. (2023) 14:1211612. doi: 10.3389/fimmu.2023.1211612
35. Lewis RG, Simpson B, Genetics, Autosomal Dominant. StatPearls. Treasure Island (FL: StatPearls Publishing (2023).
36. Fan C, Chu G, Yu Z, Ji Z, Kong F, Yao L, et al. The role of ferroptosis in intervertebral disc degeneration. Front Cell Dev Biol. (2023) 11:1219840. doi: 10.3389/fcell.2023.1219840
37. Liu HH, Li JJ. Aging and dyslipidemia: a review of potential mechanisms. Ageing Res Rev. (2015) 19:43–52. doi: 10.1016/j.arr.2014.12.001
38. Zhang X, Chen J, Huang B, Wang J, Shan Z, Liu J, et al. Obesity mediates apoptosis and extracellular matrix metabolic imbalances via MAPK pathway activation in intervertebral disk degeneration. Front Physiol. (2019) 10:1284. doi: 10.3389/fphys.2019.01284
39. Kauppila LI. Atherosclerosis and disc degeneration/low-back pain–a systematic review. Eur J Vasc Endovasc Surg. (2009) 37(6):661–70. doi: 10.1016/j.ejvs.2009.02.006
40. Kauppila LI, Penttilä A, Karhunen PJ, Lalu K, Hannikainen P. Lumbar disc degeneration and atherosclerosis of the abdominal aorta. Spine (Phila Pa 1976). (1994) 19:923–9. doi: 10.1097/00007632-199404150-00010
41. Chaudhari N, Roper SD. Molecular and physiological evidence for glutamate (umami) taste transduction via a G protein-coupled receptor. Ann N Y Acad Sci. (1998) 855:398–406. doi: 10.1111/j.1749-6632.1998.tb10598.x
42. Kurihara K, Kashiwayanagi M. Physiological studies on umami taste. J Nutr. (2000) 30:931S–4S. doi: 10.1093/jn/130.4.931S
43. Kinnamon SC. Umami taste transduction mechanisms. Am J Clin Nutr. (2009) 90:753S–5S. doi: 10.3945/ajcn.2009.27462K
44. Zhang B, Xu Y, Liu J, Wu C, Zhao X, Zhou L, et al. Oral Intake of Inosine 5’-Monophosphate in Mice Promotes the Absorption of Exogenous Fatty Acids and Their Conversion into Triglycerides though Enhancing the Phosphorylation of Adenosine 5’-Monophosphate-Activated Protein Kinase in the Liver, Leading to Lipohyperplasia. Int J Mol Sci. (2023) 24:14588. doi: 10.3390/ijms241914588
45. Shiri R, Lallukka T, Karppinen J, Viikari-Juntura E. Obesity as a risk factor for sciatica: a meta-analysis. Am J Epidemiol. (2014) 179:929–37. doi: 10.1093/aje/kwu007
46. Zhang TT, Liu Z, Liu YL, Zhao JJ, Liu DW, Tian QB. Obesity as a risk factor for low back pain: A meta-analysis. Clin Spine Surg. (2018) 31:22–7. doi: 10.1097/BSD.0000000000000468
47. Loukovaara S, Sahanne S, Jalkanen S, Yegutkin GG. Increased intravitreal adenosine 5’-triphosphate, adenosine 5’-diphosphate and adenosine 5’-monophosphate levels in patients with proliferative diabetic retinopathy. Acta Ophthalmol. (2015) 93:67–73. doi: 10.1111/aos.12507
48. Eltzschig HK, Sitkovsky MV, Robson SC. Purinergic signaling during inflammation. N Engl J Med. (2012) 367:2322–33. doi: 10.1056/NEJMra1205750
49. Grenz A, Homann D, Eltzschig HK. Extracellular adenosine: a safety signal that dampens hypoxia-induced inflammation during ischemia. Antioxid Redox Signal. (2011) 15:2221–34. doi: 10.1089/ars.2010.3665
50. Hart ML, Gorzolla IC, Schittenhelm J, Robson SC, Eltzschig HK. SP1-dependent induction of CD39 facilitates hepatic ischemic preconditioning. J Immunol. (2010) 184:4017–24. doi: 10.4049/jimmunol.0901851
51. Grenz A, Zhang H, Hermes M, Eckle T, Klingel K, Huang DY, et al. Contribution of E-NTPDase1 (CD39) to renal protection from ischemia-reperfusion injury. FASEB J. (2007) 21:2863–73. doi: 10.1096/fj.06-7947com
52. Cronstein BN, Daguma L, Nichols D, Hutchison AJ, Williams M. The adenosine/neutrophil paradox resolved: human neutrophils possess both A1 and A2 receptors that promote chemotaxis and inhibit O2 generation, respectively. J Clin Invest. (1990) 85:1150–7. doi: 10.1172/JCI114547
53. Grenz A, Osswald H, Eckle T, Yang D, Zhang H, Tran ZV, et al. The reno-vascular A2B adenosine receptor protects the kidney from ischemia. PloS Med. (2008) 5:e137. doi: 10.1371/journal.0050137
54. Kauppila LI, McAlindon T, Evans S, Wilson PW, Kiel D, Felson DT. Disc degeneration/back pain and calcification of the abdominal aorta. A 25-year follow-up study in Framingham. Spine (Phila Pa 1976). (1997) 22:1642–7. doi: 10.1097/00007632-199707150-00023
55. Kauppila LI. Prevalence of stenotic changes in arteries supplying the lumbar spine. A postmortem angiographic study 140 subjects Ann Rheum Dis. (1997) 56:591–5. doi: 10.1136/ard.56.10.591
56. Mead JR, Irvine SA, Ramji DP. Lipoprotein lipase: structure, function, regulation, and role in disease. J Mol Med (Berl). (2002) 80:753–69. doi: 10.1007/s00109-002-0384-9
57. Beisiegel U, Weber W, Ihrke G, Herz J, Stanley KK. The LDL-receptor-related protein, LRP, is an apolipoprotein E-binding protein. Nature. (1989) 341:162–4. doi: 10.1038/341162a0
58. Akhtar A, Sah SP. Insulin signaling pathway and related molecules: Role in neurodegeneration and Alzheimer’s disease. Neurochem Int. (2020) 135:104707. doi: 10.1016/j.neuint.2020.104707
59. Mollica MP, Lionetti L, Putti R, Cavaliere G, Gaita M, Barletta A. From chronic overfeeding to hepatic injury: role of endoplasmic reticulum stress and inflammation. Nutr Metab Cardiovasc Dis. (2011) 21:222–30. doi: 10.1016/j.numecd.2010.10.012
60. Chen X, Shi C, He M, Xiong S, Xia X. Endoplasmic reticulum stress: molecular mechanism and therapeutic targets. Signal Transduct Target Ther. (2023) 8:352. doi: 10.1038/s41392-023-01570-w
61. Lu Y, Qie D, Yang F, Wu J. LncRNA MEG3 aggravates adipocyte inflammation and insulin resistance by targeting IGF2BP2 to activate TLR4/NF-κB signaling pathway. Int Immunopharmacol. (2023) 121:110467. doi: 10.1016/j.intimp.2023.110467
62. Glaeser JD, Salehi K, Kanim LEA, NaPier Z, Kropf MA, Cuéllar JM, et al. NF-κB inhibitor, NEMO-binding domain peptide attenuates intervertebral disc degeneration. Spine J. (2020) 20:1480–91. doi: 10.1016/j.spinee.2020.04.025
63. Kozakova M, Morizzo C, Goncalves I, Natali A, Nilsson J, Palombo C. Cardiovascular organ damage in type 2 diabetes mellitus: the role of lipids and inflammation. Cardiovasc Diabetol. (2019) 18:61. doi: 10.1186/s12933-019-0865-6
64. Li T, Guo W, Zhou Z. Adipose triglyceride lipase in hepatic physiology and pathophysiology. Biomolecules. (2021) 12:57. doi: 10.3390/biom12010057
65. Wang Y, Cheng H, Wang T, Zhang K, Zhang Y, Kang X. Oxidative stress in intervertebral disc degeneration: Molecular mechanisms, pathogenesis and treatment. Cell Prolif. (2023) 56:e13448. doi: 10.1111/cpr.13448
66. Yang RZ, Xu WN, Zheng HL, Zheng XF, Li B, Jiang LS, et al. Involvement of oxidative stress-induced annulus fibrosus cell and nucleus pulposus cell ferroptosis in intervertebral disc degeneration pathogenesis. J Cell Physiol. (2021) 236(4):2725–39. doi: 10.1002/jcp.30039
67. Cheng P, Wei HZ, Chen HW, Wang ZQ, Mao P, Zhang HH. DNMT3a-mediated methylation of PPARγ promote intervertebral disc degeneration by regulating the NF-κB pathway. J Cell Mol Med. (2024) 28:e18048. doi: 10.1111/jcmm.18048
68. Liu Y, Qu Y, Liu L, Zhao H, Ma H, Si M, et al. PPAR-γ agonist pioglitazone protects against IL-17 induced intervertebral disc inflammation and degeneration via suppression of NF-κB signaling pathway. Int Immunopharmacol. (2019) 72:138–47. doi: 10.1016/j.intimp.2019.04.012
Keywords: intervertebral disk degeneration, causality, liposome, metabolite, Mendelian randomization
Citation: Chen D-Q, Que Z-Q, Xu W-B, Xiao K-Y, Sun N-K, Song H-Y, Feng J-Y, Lin G-X and Rui G (2024) Nucleotide polymorphism-based study utilizes human plasma liposomes to discover potential therapeutic targets for intervertebral disc disease. Front. Endocrinol. 15:1403523. doi: 10.3389/fendo.2024.1403523
Received: 20 March 2024; Accepted: 24 July 2024;
Published: 15 August 2024.
Edited by:
Sidong Yang, The University of Queensland, AustraliaReviewed by:
Joe Kodama, University of Maryland, United StatesHongfei Xiang, The Affiliated Hospital of Qingdao University, China
Copyright © 2024 Chen, Que, Xu, Xiao, Sun, Song, Feng, Lin and Rui. This is an open-access article distributed under the terms of the Creative Commons Attribution License (CC BY). The use, distribution or reproduction in other forums is permitted, provided the original author(s) and the copyright owner(s) are credited and that the original publication in this journal is cited, in accordance with accepted academic practice. No use, distribution or reproduction is permitted which does not comply with these terms.
*Correspondence: Gang Rui, cmVpZ2FuZ0AxNjMuY29t; Guang-Xun Lin, bGluZ3Vhbmd4dW5AaG90bWFpbC5jb20=
†These authors have contributed equally to this work