 Yutong Chen
 Yanwei Zhang
- Department of Anesthesiology, Shanghai Ninth People’s Hospital, Shanghai Jiao Tong University School of Medicine, Shanghai, China
Purpose: This research aimed to assess the correlation between the Adjusted Body Shape Index (ABSI) and the presence of abdominal aortic calcification (AAC) among middle-aged and older American adults.
Methods: Employing a cross-sectional design, this study analyzed data from the 2013-2014 National Health and Nutrition Examination Survey (NHANES), focusing on 3077 participants aged 40 and above. AAC detection was conducted using dual-energy X-ray absorptiometry (DXA). ABSI was determined based on waist circumference (WC), weight, and height data. The association between ABSI and AAC was examined through multiple linear regression, smoothed curve analysis, threshold effect evaluation, subgroup analysis, and interaction testing.
Results: The study encompassed 3077 individuals aged 40 and above. Findings indicated a noteworthy positive relationship between ABSI and AAC when adjusting various covariates. Analysis of threshold effects identified a K-point at 0.0908, showing no significant effect to its left but a significant effect to its right. Further, subgroup and interaction analyses highlighted the ABSI-AAC connection specifically within different age groups and among individuals with diabetes.
Conclusion: Higher ABSI was correlated with higher AAC score.
1 Introduction
Vascular calcification is characterized by the accumulation of calcium salts in the blood vessel walls, leading to stiffness and loss of elasticity. It is established that the calcification of coronary arteries is a predictor for the risk of cardiovascular diseases and mortality (1). Despite the commonality of calcification in vascular areas beyond the coronary arteries, the prognostic value of such calcifications has been less explored. Notably, the abdominal aorta is among the first vessels to experience calcification, typically before the coronary arteries (2, 3). The incidence of AAC is around one-third in individuals between 45 to 54 years of age and escalates to as much as 90% in those 75 years and older. For elderly patients with type 2 diabetes(T2DM) or chronic kidney disease (CKD) requiring dialysis, prevalence figures range from 84% to 97%. The link between AAC and cardiovascular events is well-documented. In individuals aged 45 to 84 years, AAC has been shown to independently correlate with cardiovascular disease mortality and is more strongly related to total mortality compared to coronary artery calcification (4). Severe AAC in older white women has been closely linked to an increased risk of atherosclerotic disease events and decreased long-term survival (5). Furthermore, AAC has been identified as an independent predictor for myocardial infarction and cardiovascular events (6). Particularly in populations with a high prevalence of AAC, such as older adults and individuals with chronic kidney disease, the presence of AAC significantly heightens the risk of future cardiovascular events and suggests a poorer prognosis. Highlighting the importance of AAC is crucial for clinicians to effectively assess and manage the cardiovascular risk of their patients (7).
Obesity has escalated into a widespread chronic condition worldwide. Data from 2015 indicate that around 603.7 million adults worldwide are classified as obese. Since 1980, obesity rates have doubled in over 70 countries and continue to rise elsewhere. A high BMI is linked to over 4 million deaths annually on a global scale, with cardiovascular diseases accounting for the majority of these fatalities (8). The global healthcare cost of obesity is estimated at $2 trillion (9). Notably, the location of body fat accumulation is variably linked to obesity-related health outcomes, with metabolic complications of obesity showing a direct association with the extent of abdominal fat (10). Although the World Health Organization (WHO) uses BMI to assess general obesity, there is no consensus on how to assess the distribution of body fat. ABSI is independent of BMI (11), and complements the optimal BMI by effectively risk stratifying between underweight, obese, and normal-weight and overweight BMI categories (12). The ABSI estimates both visceral abdominal fat and general overall adiposity and is a better predictor of premature mortality (13).
While the link between Body Mass Index (BMI) and the risk of cardiovascular disease has been the subject of considerable research, studies focusing on the ABSI are notably less common. The relationship between ABSI and AAC particularly lacks emphasis in existing research. This investigation seeks to delve into the possible correlation between ABSI and AAC, drawing upon data from NHANES. It aims to enrich the framework for evaluating cardiovascular disease risk by incorporating insights into the intricate interplay between body fat distribution and cardiovascular health. Moreover, by uncovering the potential connection between ABSI and AAC, this study contributes to a deeper comprehension of obesity’s impact on the cardiovascular system. Such insights are crucial for informing the development of future clinical practices and public health initiatives.
2 Methods
2.1 Study population
NHANES is a cross-sectional analysis aimed at gathering essential health status data and information, employing a stratified, multi-stage probability sampling method within the non-institutionalized demographic. The National Center for Health Statistics (NCHS) is responsible for executing the survey. NCHS’s ethical review committee has approved the study protocol, and all involved participants provided written informed consent. For this research, the 2013 to 2014 NHANES dataset was utilized, selected specifically because it was the only survey period to AAC measurements. Initially, 10,175 individuals were screened in this survey. The study excluded 1514 participants due to the absence of waist circumference data, 21 participants for lacking BMI data, and 5563 participants for missing AAC data. Consequently, 3077 participants were ultimately included in this analysis (Figure 1).
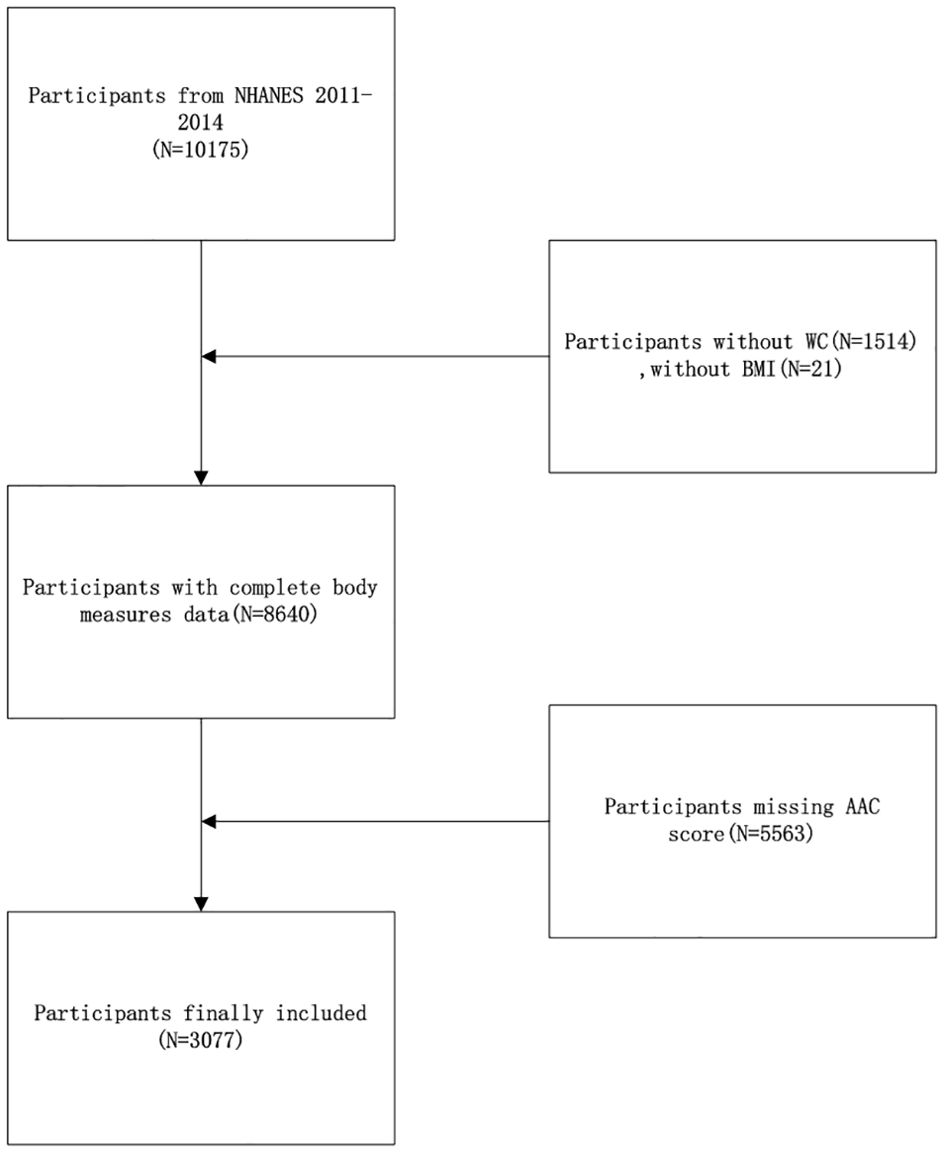
Figure 1. Flow chart showing the NHANES participants’ selection.
2.2 ABSI
ABSI is designed to be a dimensionless index. Although the absolute value of the ABSI is not a direct measure of obesity, it can be used in statistical analyses to compare the relative risk of abdominal obesity between different individuals or groups. ABSI was calculated by the following equal:
2.3 Measurement of AAC
AAC was assessed using dual-energy X-ray absorptiometry (DXA). During the 2013-2014 NHANES cycle, lateral DXA scans of the thoracolumbar spine were conducted on participants aged 40 and above at the Mobile Examination Center (MEC). Individuals were excluded from DXA scanning if they were pregnant, had used a radiographic contrast agent (e.g., barium) within the last seven days, reported a weight over 450 pounds, or had scoliosis treated with Harrington rods. The scans utilized a Hologic Discovery Model A densitometer, produced by Hologic, Inc., based in Marlborough, Massachusetts, operating on Apex 3.2 software. For evaluating AAC, the AAC24 rating system was employed, dividing the anterior and posterior aorta walls into four segments each, located in front of the lumbar vertebrae from L1 to L4. These eight segments allow for the visual identification of aortic calcification as white spots or lines across the aorta’s walls. Calcification scoring is detailed as follows: a score of 0 indicates no calcification; 1 signifies calcification occupying a third or less of the segment’s aortic wall; 2 denotes calcification extending over a third but under two-thirds of the wall; and 3 reflects more than two-thirds coverage. Each anterior and posterior aortic wall is scored independently, leading to a potential range of 0 to 6 per lumbar vertebra and a cumulative possible score ranging from 0 to 24. Additionally, the AAC8 scale was applied to quantify the total calcification length along the anterior and posterior walls of the aorta across vertebrae L1 to L4. The scoring criteria are as follows: 0 for no observable calcification; 1 if total calcification length is up to one vertebral bone height; 2 for length surpassing one but not two vertebral heights; 3 for calcification extending beyond two but under three vertebral heights; and a score of 4 is assigned if the calcification length exceeds three vertebral bone heights.
2.4 Covariates
In this study, we included multiple characteristics as covariates for analysis, including age, gender, race, education level, income level (measured by the Poverty Income Ratio, PIR), smoking history, frequency of alcohol intake, diabetes, and the presence of hypertension. Diabetes and hypertension were based on participants’ self-reported responses to the questions, “Doctor told you have diabetes” and “Ever told you had high blood pressure” These data, along with the analytical methods, were obtained from the publicly available NHANES database, which is widely used for research purposes.
2.5 Statistical analysis
In this research, the application of NHANES sampling weights was meticulously adhered to for all statistical analyses, aligning with the CDC’s guidelines and acknowledging the intricacies of the survey’s multi-stage, complex sampling design. Statistical evaluations were conducted utilizing EmpowerStats software (version 4.2) and the R statistical package (version 4.2), ensuring rigorous analysis. Participants were divided into three groups of equal size based on their ABSI scores, and disparities in demographic attributes were examined using chi-square tests for categorical variables and t-tests for continuous variables. To assess the link between ABSI and AAC, a multivariate linear regression model was employed. Additionally, a weighted smoothing curve-fitting method alongside a threshold effect analysis was utilized to investigate the non-linear dynamics of the ABSI-AAC relationship. Subgroup analyses and interaction tests were further implemented to delve into the specifics of this association across different demographics. The threshold for deeming results statistically significant was established at a two-tailed p-value of less than 0.05.
3 Results
3.1 Baseline characteristics
Table 1 outlines the demographic characteristics of the study participants, who were segmented into three groups based on tertiles of their ABSI. The study included 3077 adults aged 40 years and above. The mean age of the participants was 57.36 ± 11.50 years, with a gender distribution of 48.20% male and 51.80% female. The thresholds for the ABSI tertiles were identified as 0.08102 and 0.08489. Comparing the higher to the lower ABSI group reveals several notable differences: the high ABSI group had an older average age, a greater percentage of male participants, a higher likelihood of being non-Hispanic white, a lower Poverty Income Ratio (PIR), a lower educational attainment level, a higher proportion of current smokers, and a higher prevalence of individuals with diabetes and hypertension.
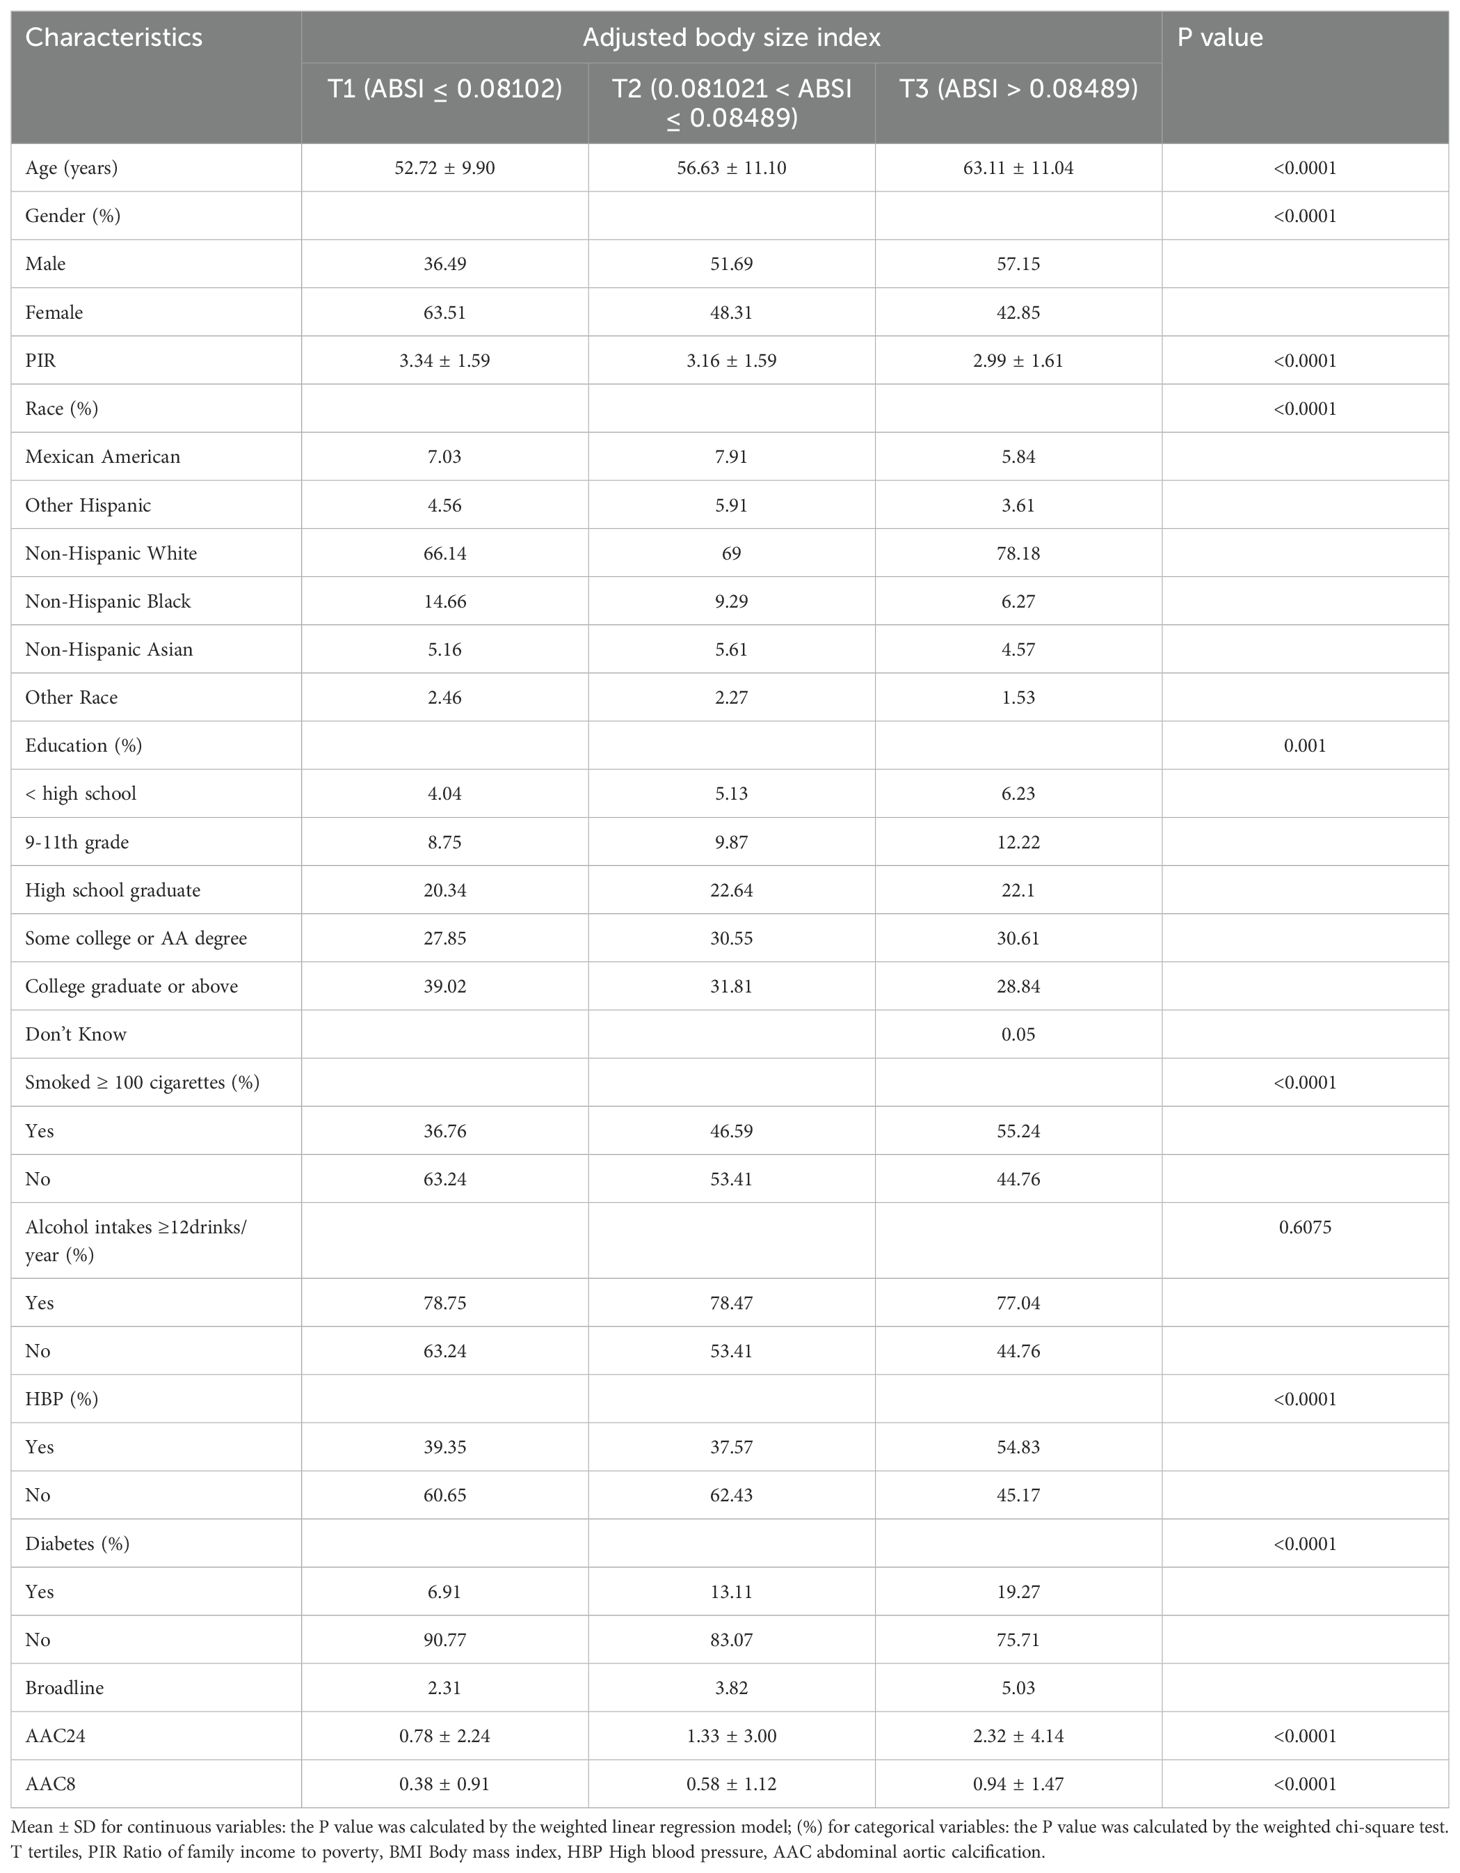
Table 1. Weighted characteristics of the study population based on ABSI tertiles.
3.2 Relationship between ABSI and AAC
Table 2 presents the findings from the multifactor regression analysis, illustrating the relationship between the ABSI and AAC scores. In the unadjusted model, ABSI exhibited a strong positive correlation with AAC24, with a coefficient [β=154.34, (confidence interval: 129.66, 179.02)], indicating a significant association. This significant positive correlation persisted in Model 2, even after adjusting for gender, age, and race [β=48.01, (22.06, 73.96)]. In Model 3, which accounted for all covariates, each unit increase in ABSI corresponded to a 26.62point increase in the AAC24 score [β=26.62, (0.42, 52.82), p=0.0465]. Moreover, a positive correlation between ABSI and AAC8 scores was consistently observed across all models. Specifically, in Model 1, the correlation coefficient was β=56.46 (47.33, 65.58); in Model 2, it was β=19.51 (9.83, 29.19); and in Model 3, it was β=11.69 (1.93, 21.46) with a p-value of 0.0190, indicating statistical significance. Despite dividing ABSI into tertiles and testing for trends with AAC, no significant trend emerged. However, further exploration through smoothed curve fitting and threshold effect analysis revealed a nonlinear relationship between ABSI and AAC, identifying a critical threshold (K-point) at 0.0908 (Figure 2). This analysis underscores the complexity of the relationship between ABSI and AAC. The left and right side effects of AAC24 at the K-points were 5.42 (-23.08, 33.93) 0.7093, and 289.22 (146.25, 432.18) < 0.0001, respectively; AAC8 had 4.59 (-6.04, 15.22) 0.3976 and 99.68 (46.35, 153.01) 0.0003 left- and right-side effects at the K-points, respectively, with log-likelihood-ratio tests of less than 0.001 (Table 3).

Table 2. Associations between ABSI and AAC.
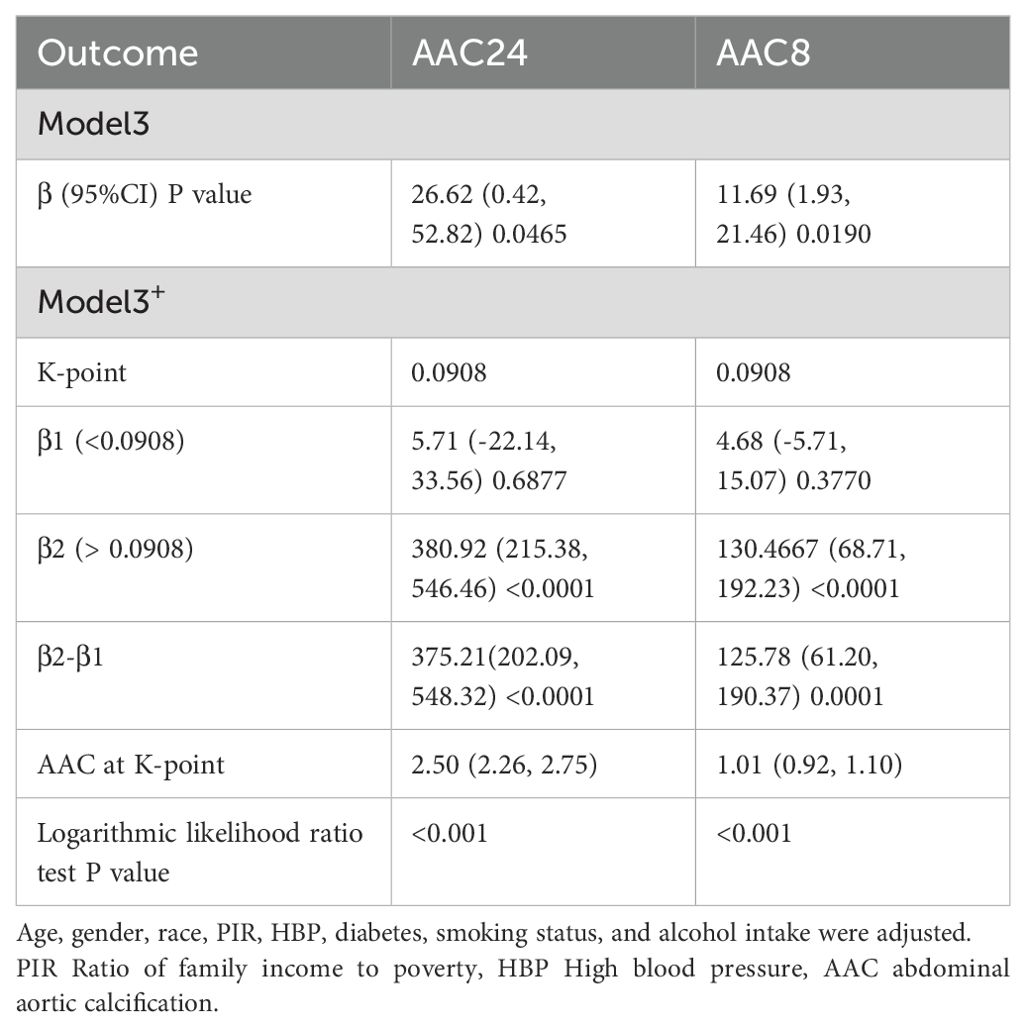
Table 3. Threshold effect analysis of WWI on severe AAC.
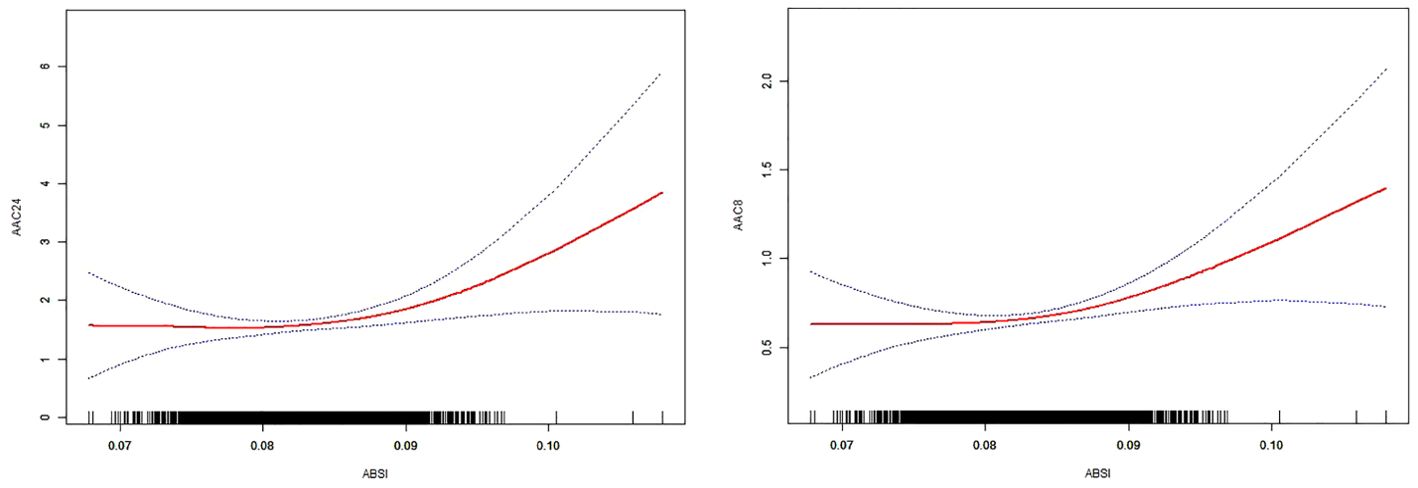
Figure 2. The solid red line represents the smooth curve fit between the variables. The 95% confidence interval derived from the fit is shown by blue bands.
We conducted subgroup analyses by subgroups of age, sex, race, smoking, alcohol consumption, HBP, and diabetes mellitus to explore the relationship between ABSI and AAC in different populations (Table 4). After adjusting for covariates, significant differences in the relationship between ABSI and AAC were found in subgroups with different ages and diabetes status.
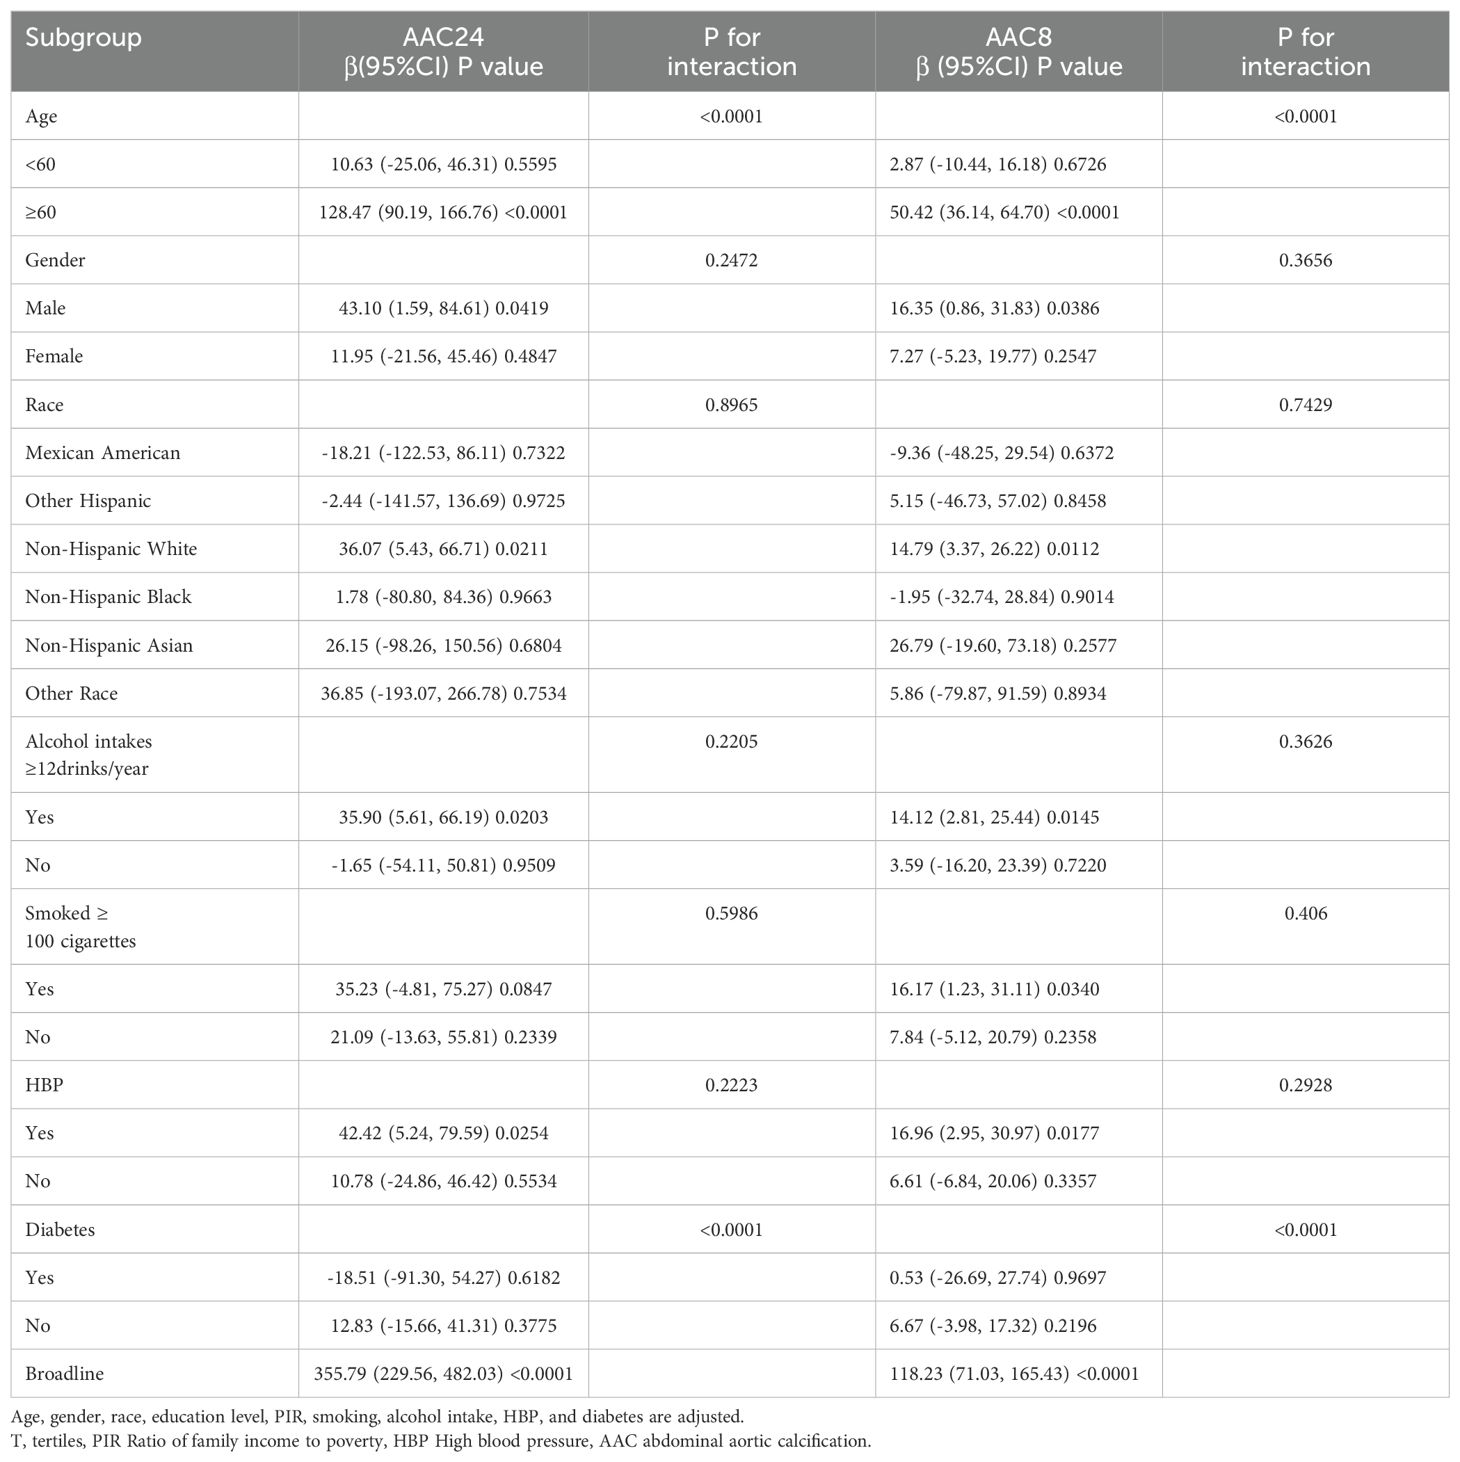
Table 4. Subgroup analysis of the associations between ABSI and cognitive function.
4 Discussion
This research examined the correlation between ABSI and AAC among 3077 middle-aged and elderly individuals in the United States. The results of the study showed that both AAC24 and AAC8 maintained a significant positive correlation with ABSI, and the two were nonlinearly correlated with a K-point of 0.0908, with a non-significant correlation to the left of the K-point and a significant positive correlation to the right of the K-point. This positive correlation suggests that as the ABSI increases, the AAC also increases, especially after the K-point, which may suggest the potential value of the ABSI in assessing the risk of cardiovascular disease.
This investigation marks a pioneering effort to probe the relationship between ABSI and AAC. Traditional reliance on BMI for obesity assessment has been challenged by BMI’s limited capacity to distinguish between different types of body fat and its strong correlation with waist circumference, underscoring BMI’s inadequacies in obesity diagnosis. The recognition of central obesity as a crucial element in cardiovascular risk evaluation led to the creation of ABSI. Since its introduction in 2012, ABSI has been linked to a range of diseases and metabolic disorders, with elevated ABSI values signaling a heightened risk of premature mortality in the broader population (11). ABSI’s effectiveness in detecting visceral and muscle-reducing obesity in overweight or obese adults with Type 2 Diabetes Mellitus (T2DM) underscores its superiority over BMI in predicting diabetes and chronic kidney disease (CKD) in certain populations (14, 15). The direct relationship between ABSI and cardiovascular risk, as well as its stronger correlation with mortality (overall, cardiovascular, and cancer), highlights its potential as a predictor of cardiovascular events (16–18). Our results suggest that individuals with a higher ABSI may have more abdominal fat accumulation, which is associated with increased AAC scores. Abdominal fat is considered a metabolically active tissue that secretes a variety of inflammatory factors and hormones, which may be one of the mechanisms that promote atherosclerosis (19). Thus, ABSI could offer a straightforward and accessible measure for clinicians to identify middle-aged and older adults at elevated risk of developing AAC and subsequent cardiovascular diseases. Furthermore, the determination of K-points offers a clinical benchmark, suggesting potential thresholds for intensified monitoring and intervention efforts.
The positive correlation between ABSI and AAC may involve complex biological mechanisms. The systemic inflammatory state induced by obesity is a key factor in the promotion of atherosclerosis and vascular calcification (20, 21). Inflammatory mediators released from adipose tissue, such as tumor necrosis factor α (TNF-α) and interleukin 6 (IL-6), exacerbate inflammatory responses in the vascular wall, which further contribute to the calcification process (20, 22). At the same time, obesity is closely related to insulin resistance and T2DM (23), and these pathological states raise the risk of vascular calcification by increasing calcium salt deposition in vascular smooth muscle cells (24–26). In addition, obesity is strongly associated with abnormalities of lipid metabolism, such as hypertriacylglycerolemia and high low-density lipoprotein (LDL) cholesterol levels (27, 28). These abnormalities have been suggested to be the major contributing factors to both atherosclerosis and vascular calcification (29). Obesity also leads to an increase in oxidative stress (30), which may disrupt vascular endothelial function and promote inflammatory responses as well as the migration and proliferation of vascular smooth muscle cells, all of which are critical aspects of the calcification process (31). Hormonal imbalances induced by obesity, such as altered levels of lipofuscin and leptin, also have a direct or indirect effect on vascular calcification. Of these, leptin may promote calcification due to its proinflammatory properties (32–34). Whereas lipocalin, which has anti-inflammatory effects, is reduced in obese individuals and may increase the risk of calcification (35–37). Vitamin D deficiency is more common in obese individuals (38, 39), and vitamin D is essential for calcium and phosphorus metabolism and maintenance of vascular health. Its deficiency may promote vascular calcification through various mechanisms (40–42). In summary, inflammation, insulin resistance and diabetes mellitus, abnormal lipid metabolism, oxidative stress, adipose-related hormone imbalances, and vitamin D deficiency constitute a complex network of interactions that together drive the progression of vascular calcification.
Subgroup analyses and interaction tests revealed significant modifications in the relationship between the ABSI and AAC by age and diabetes status. Specifically, a more pronounced positive correlation between ABSI and AAC was evident among participants aged 60 years and older. This finding implies that central obesity’s impact on cardiovascular disease (CVD) risk escalates with advancing age. Such a trend could be attributed to a blend of age-associated biological changes, including genetic and potentially epigenetic factors, environmental influences like diabetes mellitus and chronic kidney disease, and the propensity of vascular smooth muscle cells to adopt an osteogenic phenotype — key contributors to age-dependent vascular calcification (43). Furthermore, processes inherent to the aging phenomenon, such as cellular senescence, autophagy, the emission of extracellular vesicles, and oxidative stress, play pivotal roles in facilitating vascular calcification (44). Additionally, within the diabetes subgroups, a notable correlation between ABSI and AAC was observed among patients with borderline blood glucose levels. However, this association might indicate statistical variance arising from the smaller sample sizes of the subgroups under examination.
This study utilized data collected by NHANES between 2013 and 2014 and included 3,077 adults aged 40 years and older as study participants. This large and diverse sample makes our findings more representative and generalizable. Methodologically, we employed sophisticated statistical analysis techniques, such as multivariate linear regression, smooth curve fitting, threshold effect analysis, subgroup analysis, and interaction test, to delve into the interactions between ABSI and AAC. This methodology was utilized to ensure the accuracy and reliability of the study results. This study pays special attention to the potential association between ABSI and AAC that has not been fully explored, providing a new perspective for understanding the link between obesity and cardiovascular disease risk.
However, this study also has some limitations. As a cross-sectional study, it failed to establish a causal relationship between ABSI and AAC, although it revealed a correlation between the two. Future studies may need to employ prospective or interventional designs to explore this relationship in depth. Additionally, the data sources relied upon for this study were limited to NHANES data from 2013 to 2014, which may not fully reflect current population health status and trends. Finally, although this study considered multiple covariates, it may have still missed other potential variables, such as lifestyle and dietary habits, which may also influence the relationship between ABSI and AAC.
Data availability statement
The original contributions presented in the study are included in the article/supplementary material. Further inquiries can be directed to the corresponding author.
Ethics statement
The studies involving humans were approved by National Center for Health Statistics (NCHS) Institutional Review Board. The studies were conducted in accordance with the local legislation and institutional requirements. The participants provided their written informed consent to participate in this study.
Author contributions
YC: Investigation, Validation, Formal analysis, Software, Resources, Supervision, Methodology, Writing – review & editing. YZ: Writing – original draft, Software, Resources, Methodology, Investigation, Formal analysis, Data curation, Conceptualization. YD: Writing – original draft, Software, Resources, Project administration, Methodology, Investigation, Funding acquisition, Formal analysis. SJ: Writing – review & editing, Visualization, Validation, Supervision.
Funding
The author(s) declare that no financial support was received for the research, authorship, and/or publication of this article.
Acknowledgments
We are grateful to the participants of this study for their invaluable contributions and to NHANES for the data that enabled our research. Special thanks go to our colleagues at the Department of Anesthesiology, Shanghai Ninth People’s Hospital, for their support, particularly to SJ, for his leadership and guidance. This work was completed without specific funding, and we appreciate the resources provided by our affiliations.
Conflict of interest
The authors declare that the research was conducted in the absence of any commercial or financial relationships that could be construed as a potential conflict of interest.
Publisher’s note
All claims expressed in this article are solely those of the authors and do not necessarily represent those of their affiliated organizations, or those of the publisher, the editors and the reviewers. Any product that may be evaluated in this article, or claim that may be made by its manufacturer, is not guaranteed or endorsed by the publisher.
References
1. Budoff MJ, Shaw LJ, Liu ST, Weinstein SR, Tseng PH, Flores FR, et al. Long-term prognosis associated with coronary calcification: observations from a registry of 25,253 patients. J Am Coll Cardiol. (2007) 49:1860–70. doi: 10.1016/j.jacc.2006.10.079
2. Strong JP, Malcom GT, McMahan CA, Tracy RE, Newman WP III, Herderick EE, et al. Prevalence and extent of atherosclerosis in adolescents and young adults: implications for prevention from the Pathobiological Determinants of Atherosclerosis in Youth Study. Jama. (1999) 281:727–35. doi: 10.1001/jama.281.8.727
3. Allam AH, Thompson RC, Eskander MA, Mandour Ali MA, Sadek A, Rowan CJ, et al. Is coronary calcium scoring too late? Total body arterial calcium burden in patients without known CAD and normal MPI. J Nucl Cardiol. (2018) 25:1990–8. doi: 10.1007/s12350-017-0925-9
4. Criqui MH, Denenberg JO, McClelland RL, Allison MA, Ix JH, Guerci A, et al. Abdominal aortic calcium, coronary artery calcium, and cardiovascular morbidity and mortality in the Multi-Ethnic Study of Atherosclerosis. Arteriosclerosis thrombosis Vasc Biol. (2014) 34:1574–9. doi: 10.1161/ATVBAHA.114.303268
5. Lewis JR, Schousboe JT, Lim WH, Wong G, Wilson KE, Zhu K, et al. Long-term atherosclerotic vascular disease risk and prognosis in elderly women with abdominal aortic calcification on lateral spine images captured during bone density testing: a prospective study. J Bone Mineral Res. (2018) 33:1001–10. doi: 10.1002/jbmr.3405
6. Bolland MJ, Wang TK, van Pelt NC, Horne AM, Mason BH, Ames RW, et al. Abdominal aortic calcification on vertebral morphometry images predicts incident myocardial infarction. J Bone Mineral Res. (2010) 25:505–12. doi: 10.1359/jbmr.091005
7. Leow K, Szulc P, Schousboe JT, Kiel DP, Teixeira-Pinto A, Shaikh H, et al. Prognostic value of abdominal aortic calcification: a systematic review and meta-analysis of observational studies. J Am Heart Assoc. (2021) 10:e017205. doi: 10.1161/JAHA.120.017205
8. Collaborators GO. Health effects of overweight and obesity in 195 countries over 25 years. New Engl J Med. (2017) 377:13–27. doi: 10.1056/NEJMoa1614362
9. Tremmel M, Gerdtham U-G, Nilsson PM, Saha S. Economic burden of obesity: a systematic literature review. Int J Environ Res Public Health. (2017) 14:435. doi: 10.3390/ijerph14040435
10. Hill JH, Solt C, Foster MT. Obesity associated disease risk: the role of inherent differences and location of adipose depots. Hormone Mol Biol Clin Invest. (2018) 33:20180012. doi: 10.1515/hmbci-2018-0012
11. Krakauer NY, Krakauer JC. A new body shape index predicts mortality hazard independently of body mass index. PloS One. (2012) 7:e39504. doi: 10.1371/journal.pone.0039504
12. Christakoudi S, Tsilidis KK, Muller DC, Freisling H, Weiderpass E, Overvad K, et al. A Body Shape Index (ABSI) achieves better mortality risk stratification than alternative indices of abdominal obesity: results from a large European cohort. Sci Rep. (2020) 10:14541. doi: 10.1038/s41598-020-71302-5
13. Lee DY, Lee MY, Sung KC. Prediction of mortality with a body shape index in young Asians: comparison with body mass index and waist circumference. Obesity. (2018) 26:1096–103. doi: 10.1002/oby.22193
14. Bawadi H, Abouwatfa M, Alsaeed S, Kerkadi A, Shi ZJN. Body shape index is a stronger predictor of diabetes. Nutrients. (2019) 11(5):1018. doi: 10.3390/nu11051018
15. Kim B, Kim G, Kim E, Park J, Isobe T, Sakae T, et al. The a body shape index might be a stronger predictor of chronic kidney disease than BMI in a senior population. Int J Environ Res Public Health. (2021) 18(24):12874. doi: 10.3390/ijerph182412874
16. Corbatón-Anchuelo A, Krakauer JC, Serrano-García I, Krakauer NY, Martínez-Larrad MT, Serrano-Ríos M, et al. A body shape index (ABSI) and Hip Index (HI) Adjust waist and hip circumferences for body mass index, but only ABSI predicts high cardiovascular risk in the spanish caucasian population. Met Syndrome and Relat Dis. (2021) 19(6):352–7. doi: 10.1089/met.2020.0129
17. Dhana K, Kavousi M, Ikram MA, Tiemeier HW, Hofman A, Franco OH. Body shape index in comparison with other anthropometric measures in prediction of total and cause-specific mortality. J Epidemiol Community Health. (2016) 70(1):90–6. doi: 10.1136/jech-2014-205257
18. Ji M, Zhang S, An R. Effectiveness of A Body Shape Index (ABSI) in predicting chronic diseases and mortality: A systematic review and meta-analysis. Obesity Rev. (2018) 19(5):737–59. doi: 10.1111/obr.12666
19. Jensky NE, Criqui MH, Wright CM, Wassel CL, Alcaraz JE, Allison MA. The association between abdominal body composition and vascular calcification. Obesity. (2011) 19(12):2418–24. doi: 10.1038/oby.2011.70
20. Rohm TV, Meier DT, Olefsky JM, Donath MY. Inflammation in obesity, diabetes, and related disorders. Immunity. (2022) 55(1):31–55. doi: 10.1016/j.immuni.2021.12.013
21. Shao J-S, Cheng S-L, Sadhu J, Towler DA. Inflammation and the osteogenic regulation of vascular calcification: a review and perspective. Hypertension. (2010) 55(3):579–92. doi: 10.1161/HYPERTENSIONAHA.109.134205
22. Bessueille L, Magne DJC, Sciences ML. Inflammation: a culprit for vascular calcification in atherosclerosis and diabetes. Cell Mol Life Sci. (2015) 72(13):2475–89. doi: 10.1007/s00018-015-1876-4
23. Klein S, Gastaldelli A, Yki-Järvinen H, Scherer P. Why does obesity cause diabetes? Cell Metabol. (2022) 34(1):11–20. doi: 10.1016/j.cmet.2021.12.012
24. Ghosh S, Luo D, He W, Chen J, Su X, Huang H. Diabetes and calcification: The potential role of anti-diabetic drugs on vascular calcification regression. Pharmacol Res. (2020) 158:104861. doi: 10.1016/j.phrs.2020.104861
25. Rutter MK, Massaro JM, Hoffmann U, O’Donnell CJ, Fox CS. Fasting glucose, obesity, and coronary artery calcification in community-based people without diabetes. Diabetes Care. (2012) 35(9):1944–50. doi: 10.2337/dc11-1950
26. Schinzari F, Tesauro M, Bertoli A, Valentini A, Veneziani A, Campia U, et al. Calcification biomarkers and vascular dysfunction in obesity and type 2 diabetes: influence of oral hypoglycemic agents. Am J Physiol Endocrinol Metabol. (2019) 317(4):E658–E66. doi: 10.1152/ajpendo.00204.2019
27. Zheng Z-G, Zhu S-T, Cheng H-M, Zhang X, Cheng G, Thu PM, et al. Discovery of a potent SCAP degrader that ameliorates HFD-induced obesity, hyperlipidemia and insulin resistance via an autophagy-independent lysosomal pathway. Autophagy. (2021) 17(7):1592–613. doi: 10.1080/15548627.2020.1757955
28. Banerjee S, Bagheri M, Sandfort V, Ahlman MA, Malayeri AA, Bluemke DA, et al. Vascular calcification in patients with large-vessel vasculitis compared to patients with hyperlipidemia. Semin Arthritis rheum. (2019) 48:1068–73. doi: 10.1016/j.semarthrit.2018.09.001
29. Xian JZ, Lu M, Fong F, Qiao R, Patel NR, Abeydeera D, et al. Statin effects on vascular calcification: microarchitectural changes in aortic calcium deposits in aged hyperlipidemic mice. Arterioscler Thromb Vascul Biol. (2021) 41(4):e185–e92. doi: 10.1161/ATVBAHA.120.315737
30. Ahmed B, Sultana R, Greene MW. Adipose tissue and insulin resistance in obese. Biomed Pharmacother. (2021) 137:111315. doi: 10.1016/j.biopha.2021.111315
31. Kwaifa IK, Bahari H, Yong YK, Noor SM. Endothelial dysfunction in obesity-induced inflammation: molecular mechanisms and clinical implications. Biomolecules. (2020) 10(2):291. doi: 10.3390/biom10020291
32. Chai S, Chen Y, Xin S, Yuan N, Liu Y, Sun J, et al. Positive association of leptin and artery calcification of lower extremity in patients with type 2 diabetes mellitus: a pilot study. Front Endocrinol. (2021) 12:583575. doi: 10.3389/fendo.2021.583575
33. Szulc P, Amri EZ, Varennes A, Panaia-Ferrari P, Fontas E, Goudable J, et al. Positive association of high leptin level and abdominal aortic calcification in men―The prospective MINOS study. Circulation J. (2018) 82(12):2954–61. doi: 10.1253/circj.CJ-18-0517
34. Zeadin M, Butcher M, Werstuck G, Khan M, Yee CK, Shaughnessy SG, et al. Effect of leptin on vascular calcification in apolipoprotein E–deficient mice. Arterioscl Thromb Vascul Biol. (2009) 29(12):2069–75. doi: 10.1161/ATVBAHA.109.195255
35. Xiao X, Liu Y-Z, Cheng Z-B, Sun J-X, Shao Y-D, Qu S-L, et al. Adipokines in vascular calcification. Clinica Chimica Acta. (2021) 516:15–26. doi: 10.1016/j.cca.2021.01.009
36. Qasim A, Mehta NN, Tadesse MG, Wolfe ML, Rhodes T, Girman C, et al. Adipokines, insulin resistance, and coronary artery calcification. J Am Coll Cardiol. (2008) 52(3):231–6. doi: 10.1016/j.jacc.2008.04.016
37. Register TC, Divers J, Bowden DW, Carr JJ, Lenchik L, Wagenknecht LE, et al. Relationships between serum adiponectin and bone density, adiposity and calcified atherosclerotic plaque in the African American-Diabetes Heart Study. The Journal of Clinical Endocrinology & Metabolism. (2013) 98(5):1916–22. doi: 10.1210/jc.2012-4126
38. Sergeev IN. Vitamin D status and vitamin D-dependent apoptosis in obesity. Nutrients. (2020) 12(5):1392. doi: 10.3390/nu12051392
40. Harahap IA, Landrier J-F, Suliburska J. Interrelationship between vitamin D and calcium in obesity and its comorbid conditions. Nutrients. (2022) 14(15):3187. doi: 10.3390/nu14153187
41. Kim J-K, Park MJ, Song YR, Kim HJ, Kim SG. Vitamin D: a possible modifying factor linking obesity to vascular calcification in hemodialysis patients. Nutrition & metabolism. (2017) 14:1–9. doi: 10.1186/s12986-017-0181-7
42. Carmo LS, Burdmann EA, Fessel MR, Almeida YE, Pescatore LA, Farias-Silva E, et al. Expansive vascular remodeling and increased vascular calcification response to cholecalciferol in a murine model of obesity and insulin resistance. Arteriosclerosis, thrombosis, and vascular biology. (2019) 39(2):200–11. doi: 10.1161/ATVBAHA.118.311880
43. Sutton NR, Malhotra R, St. Hilaire C, Aikawa E, Blumenthal RS, Gackenbach G, et al. Molecular mechanisms of vascular health: insights from vascular aging and calcification. Arteriosclerosis, thrombosis, and vascular biology. (2023) 43(1):15–29. doi: 10.1161/ATVBAHA.122.317332
Keywords: adjusted body size index, cognitive function, cross-sectional survey, elderly, NHANES
Citation: Chen Y, Ding Y, Jin S and Zhang Y (2024) Association between a body shape index and cognitive impairment among US older adults aged 40 years and above from a cross-sectional survey of the NHANES 2011-2014. Front. Endocrinol. 15:1411701. doi: 10.3389/fendo.2024.1411701
Received: 03 April 2024; Accepted: 29 August 2024;
Published: 23 September 2024.
Edited by:
Changhee Jung, University of Ulsan, Republic of KoreaReviewed by:
Atinuke Agunloye, University of Ibadan, NigeriaTheodoros Androutsakos, National and Kapodistrian University of Athens, Greece
Copyright © 2024 Chen, Ding, Jin and Zhang. This is an open-access article distributed under the terms of the Creative Commons Attribution License (CC BY). The use, distribution or reproduction in other forums is permitted, provided the original author(s) and the copyright owner(s) are credited and that the original publication in this journal is cited, in accordance with accepted academic practice. No use, distribution or reproduction is permitted which does not comply with these terms.
*Correspondence: Shanliang Jin, amluc2hhbmxpYW5nMTg5OEAxNjMuY29t; Yanwei Zhang, NDM0MzI4OTA5QHFxLmNvbQ==