Abstract
Background:
The stress hyperglycemia ratio (SHR) has emerged as a potential prognostic indicator for various critical illnesses. However, its role in determining outcomes in patients with atrial fibrillation (AF) within the intensive care unit (ICU) remains unclear. This study aimed to elucidate the association between SHR and all-cause mortality in this clinical setting.
Methods:
We conducted a retrospective cohort study utilizing data from a large, retrospective database. Critically ill patients with documented AF were stratified based on quartiles of SHR. The primary outcome was 365-day all-cause mortality, with secondary outcomes including 90-day and 28-day mortality. COX proportional hazards models adjusted for confounders and Kaplan-Meier curve analyses were used to explore the relationship between SHR and mortality.
Results:
2,679 patients with critical AF were enrolled in the final study. Among the patients studied, those in the highest SHR quartiles exhibited an increased risk of 365-day all-cause mortality (HR:1.32, 95%CI=1.06-1.65). Notably, in subgroup analyses, the prognostic value of SHR was particularly pronounced in patients with hypertension. Sensitivity analyses confirmed the persistence of these findings after excluding cohorts with malignant tumors, and heart failure.
Conclusions:
Our research discerns a positive association between SHR and all-cause mortality in critically ill patients with AF, highlighting the significance of acute glycemic dysregulation on patient outcomes. Longer follow-up is still needed in the future to study the association between SHR and all-cause mortality in critically ill patients with AF.
Introduction
Atrial fibrillation (AF), a substantial challenge in the field of cardiovascular treatment, affects approximately 60 million people globally (1). In recent years, the incidence of AF has been climbing steadily due to an aging population and increased awareness of the condition (2). As the most prevalent sustained cardiac arrhythmia, AF significantly heightens the risks of stroke, heart failure, and all-cause mortality (3–5). Evidence gathered from several countries asserts that the incidence of AF in the intensive care unit (ICU) hovers around one-sixth, and patients with AF experience a higher propensity for ischemic, thromboembolic, and severe bleeding events compared to non-AF patients (2). Given the high incidence and mortality of AF in critically ill ICU patients, pinpointing modifiable prognostic factors that can guide management decisions is critically important.
Among the myriad physiological changes occurring in critically ill patients, stress hyperglycemia ratio (SHR) is a widespread and consequential response, notably within the cardiology field (6, 7). A recent prospective cohort study from Asia involving 5,562 patients with acute coronary syndrome, with a two-year follow-up, discovered a J-shaped association between SHR and in-hospital cardiogenic death (8). Furthermore, a nationwide study from the United States similarly demonstrated that SHR was associated with all-cause mortality and cardiovascular mortality among patients with diabetes or prediabetes (9). Additionally, researchers have dissected the multifaceted roles of SHR, suggesting its involvement in both metabolic dysregulation and inflammatory pathways, potentially exacerbating cardiovascular complications (10, 11). Despite the emerging recognition of the prognostic relationship between SHR and adverse cardiovascular events such as myocardial infarction and heart failure, its direct association with the prognosis of patients with AF remains to be established (6, 12, 13).
Our study endeavors to bridge this knowledge gap by meticulously evaluating the impact of SHR on all-cause mortality among patients with AF admitted to the ICU. This investigation elucidates the role of SHR as a prognostic biomarker, enhancing clinicians’ understanding of patient stratification and management in the context of critical AF care.
Methods
Data source and study population
We conducted a retrospective cohort analysis using clinical data extracted from the Medical Information Mart for Intensive Care IV (MIMIC IV) database. MIMIC is an expansive, publicly available database containing de-identified health-related information of over 50,000 patients admitted to the ICU of the Beth Israel Deaconess Medical Center from 2008 to 2019. The author Fuqiang Liu was granted access to utilize this dataset (Record ID: 50081635). A total of 50,920 patients were initially included in our study. The inclusion criteria were: (1) Patients who were admitted to the ICU for the first time; (2) Patients aged 18 years or older. Exclusion criteria were as follows: (1) ICU stay shorter than 24 hours (n=10,856); (2) Absence of glucose data or hemoglobin A1c (HbA1c) levels (n=32774) at admission; (3) Patients without diagnosed with AF according to ICD-9 and ICD-10 codes (n=4614). Ultimately, a cohort of 2,679 patients were integrated into the study and were stratified according to SHR quartiles. The flowchart depicting the selection process of the study subjects is illustrated in Figure 1.
Figure 1
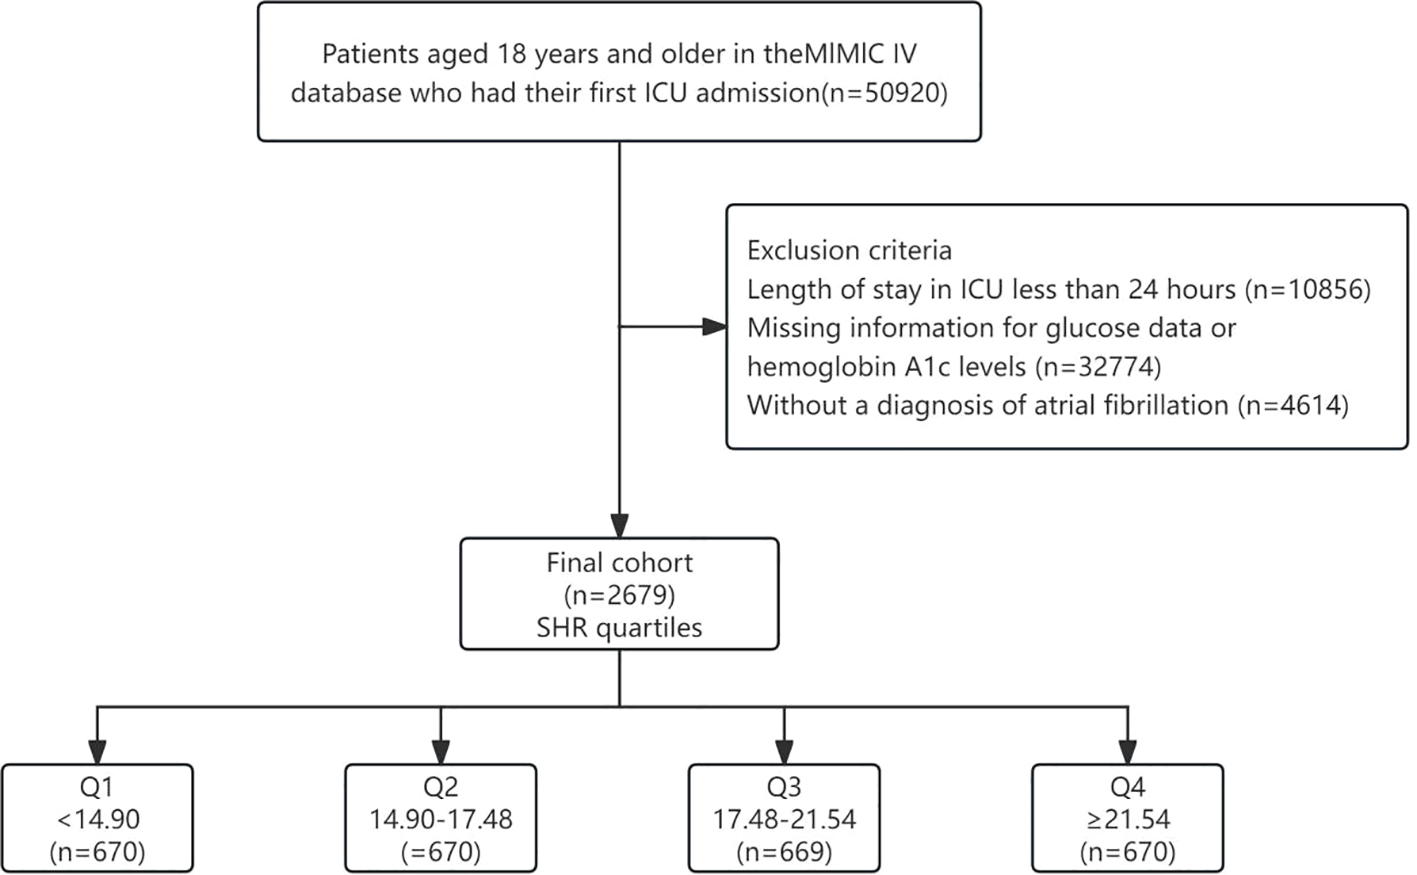
Flowchart of our study. SHR, Stress Hyperglycemia Ratio.
Study variables
The primary exposure variable, SHR, was calculated by collecting admission blood glucose levels and HbA1c, using the formula: SHR = Admission blood glucose (mmol/L)/[(1.59 × HbA1c) - 2.59]. The primary outcome was defined as the all-cause mortality within 365 days following discharge. Secondary outcomes included all-cause mortality at 28 days and 90 days of discharge.
Covariates
Demographic data, laboratory test results, and comorbidity information were extracted from the MIMIC-IV database using PostgreSQL (version 14.5). Demographics included age, gender, and weight. Laboratory tests encompassed measurements such as white blood cell (WBC), red blood cell (RBC), platelet, hemoglobin, red cell distribution width (RDW), hematocrit, sodium, potassium, chloride, anion gap, prothrombin time (PT), partial thromboplastin time (PTT), international normalized ratio (INR), urea nitrogen, and creatinine. Disease severity scoring systems, including SOFA, APS III, SAPS II, OASIS, and SIRS, were also incorporated into covariate analyses. Comorbidities considered in the study comprised conditions like hypertension, diabetes, chronic obstructive pulmonary disease (COPD), diabetes, heart failure, myocardial infarction (MI), stroke, hyperlipidemia, chronic kidney disease (CKD), malignant tumors, mechanical ventilation (MV), and vasoactive drugs.
For the management of missing values, continuous variables with more than 20% missing data were discarded. In contrast, for those with a smaller proportion of missing data, imputation was performed using the random forest method (R software, “missForest” package). Variables with missing information included in this study are shown in Supplementary Table 1.
Statistical analyses
For categorical data, baseline variables were presented as frequencies and percentages, and differences were compared using the Chi-square test. Continuous variables were represented by means and standard deviations (SD), with differences evaluated using T-tests or one-way ANOVA as appropriate. Kaplan-Meier (KM) curves were used to compare mortality differences between various SHR groups, with the log-rank test employed for differential analyses. To quantify the relationship between SHR and all-cause mortality at 365 days, as well as at 28 and 90 days, COX proportional hazards regression analyses were utilized. Prior to using COX regression analyses, we tested the proportional risk assumption for the study variables using Schoenfeld residual plots, as well as calculating variance inflation factors (VIFs) to exclude variables with VIFs greater than 5. Adjustments for covariates were made in three models including Model 1 (unadjusted), Model 2 (adjusted for age, gender, and weight), and Model 3 (further adjusted for WBC, RBC, platelet, RDW, sodium, phosphate, anion gap, PT, PTT, SOFA, and history of hypertension, heart failure, COPD, MI, hyperlipidemia, MV, and vasoactive drugs), results are expressed as hazard ratios (HR) and 95% confidence intervals (95%CI). Restricted cubic splines (RCS) were employed to describe the dose-response relationship between SHR and mortality, with spline graphs created to visually delineate these relationships. Moreover, subgroup analyses were conducted to explore the influence of primary demographic and clinical characteristics on the potential effect. Finally, sensitivity analyses were performed to assess the robustness of our results by excluding patients with malignant tumors, and heart failure from the cohort.
All analyses were carried out using the R software (version 4.1.3, R Foundation for Statistical Computing, Vienna, Austria). A two-tailed P-value less than 0.05 was considered statistically significant.
Results
Baseline characteristics
Table 1 provides a detailed exposition of the baseline characteristics of the 2,679 patients, stratified by SHR quartiles (Q1<14.90, 14.90≤Q2<17.48, 17.48≤Q3<21.54, 21.54≤Q4). The mean age of the participants was 74.15 years, and males constituted 61.52% of the population. Patients in the higher SHR quartiles tended to exhibit greater body weight, along with elevated levels of WBC, hemoglobin, hematocrit, anion gap, PTT, urea nitrogen, creatinine, and higher APS III, OASIS, and SIRS. Additionally, a higher proportion of patients in the upper SHR quartiles suffered from diabetes and MI and underwent MV treatment. Lengths of hospital stay, lengths of ICU stay, hospital mortality, ICU mortality, as well as 28-day, 90-day, and 365-day all-cause mortality were also highest in Q4. However, no significant differences were observed between groups about age, gender, RBC, platelet, RDW, sodium, phosphate, PT, INR, SOFA, SAPS II, or in patients with hypertension, COPD, heart failure, stroke, CKD, malignant tumors, and use of vasoactive drugs.
Table 1
| Total (n = 2679) | SHR quartiles | |||||
|---|---|---|---|---|---|---|
| Q1 (n = 670) | Q2 (n = 670) | Q3 (n = 669) | Q4 (n = 670) | P-value | ||
| Age, years | 74.15 ± 10.49 | 74.21 ± 10.67 | 74.49 ± 10.55 | 74.50 ± 10.38 | 73.39 ± 10.33 | 0.168 |
| Gender, n (%) | 0.876 | |||||
| male | 1648 (61.52) | 408 (60.90) | 421 (62.84) | 408 (60.99) | 411 (61.34) | |
| female | 1031 (38.48) | 262 (39.10) | 249 (37.16) | 261 (39.01) | 259 (38.66) | |
| Weight, kg | 85.00 ± 24.14 | 82.83 ± 24.07 | 86.36 ± 23.63 | 85.19 ± 24.88 | 85.63 ± 23.88 | 0.045 |
| WBC, K/µL | 12.81 ± 5.89 | 12.31 ± 6.51 | 12.72 ± 5.58 | 12.73 ± 5.47 | 13.49 ± 5.88 | 0.003 |
| RBC, m/µL | 3.55 ± 0.64 | 3.52 ± 0.59 | 3.58 ± 0.63 | 3.55 ± 0.66 | 3.56 ± 0.67 | 0.379 |
| Platelet, K/µL | 183.35 ± 78.41 | 179.25 ± 73.59 | 181.86 ± 76.43 | 182.05 ± 76.92 | 190.21 ± 85.91 | 0.060 |
| Hemoglobin, g/dL | 10.66 ± 1.86 | 10.46 ± 1.72 | 10.77 ± 1.80 | 10.68 ± 1.88 | 10.74 ± 2.02 | 0.008 |
| RDW, % | 14.70 ± 2.02 | 14.77 ± 2.00 | 14.57 ± 1.97 | 14.72 ± 2.04 | 14.75 ± 2.09 | 0.267 |
| Hematocrit, % | 32.25 ± 5.45 | 31.71 ± 5.07 | 32.52 ± 5.24 | 32.34 ± 5.56 | 32.43 ± 5.86 | 0.028 |
| Sodium, mmol/L | 138.30 ± 3.88 | 138.32 ± 3.82 | 138.54 ± 3.29 | 138.29 ± 3.96 | 138.07 ± 4.37 | 0.168 |
| Potassium, mmol/L | 4.31 ± 0.50 | 4.31 ± 0.49 | 4.29 ± 0.47 | 4.30 ± 0.53 | 4.32 ± 0.51 | 0.656 |
| Chloride, mmol/L | 104.80 ± 5.18 | 105.05 ± 5.25 | 105.31 ± 4.53 | 104.83 ± 4.94 | 104.03 ± 5.83 | <0.001 |
| Anion gap, mmol/L | 13.51 ± 3.27 | 13.16 ± 3.36 | 13.22 ± 3.04 | 13.38 ± 3.16 | 14.28 ± 3.38 | <0.001 |
| PT, sec | 15.78 ± 5.55 | 15.97 ± 5.73 | 15.79 ± 5.50 | 15.68 ± 5.67 | 15.69 ± 5.30 | 0.770 |
| PTT, sec | 38.87 ± 17.14 | 39.60 ± 18.05 | 38.00 ± 16.24 | 37.83 ± 15.15 | 40.06 ± 18.81 | 0.035 |
| INR | 1.45 ± 0.55 | 1.46 ± 0.54 | 1.45 ± 0.55 | 1.44 ± 0.60 | 1.43 ± 0.50 | 0.894 |
| Urea nitrogen, mg/dL | 24.92 ± 17.27 | 24.18 ± 17.73 | 23.07 ± 15.21 | 23.78 ± 15.24 | 28.63 ± 19.91 | <0.001 |
| Creatinine, mg/dL | 1.28 ± 1.04 | 1.24 ± 1.01 | 1.20 ± 0.92 | 1.26 ± 1.03 | 1.42 ± 1.19 | <0.001 |
| SOFA | 5.15 ± 3.14 | 5.08 ± 3.04 | 4.97 ± 3.04 | 5.17 ± 3.23 | 5.37 ± 3.24 | 0.122 |
| APS III | 43.38 ± 18.90 | 42.55 ± 19.92 | 40.46 ± 17.22 | 43.87 ± 18.48 | 46.65 ± 19.37 | <0.001 |
| SAPS II | 39.25 ± 11.97 | 39.39 ± 12.40 | 38.24 ± 11.58 | 39.35 ± 11.91 | 40.01 ± 11.94 | 0.054 |
| OASIS | 32.83 ± 7.77 | 32.32 ± 7.66 | 32.02 ± 7.47 | 33.43 ± 7.77 | 33.56 ± 8.07 | <0.001 |
| SIRS | 2.61 ± 0.90 | 2.51 ± 0.89 | 2.55 ± 0.93 | 2.63 ± 0.89 | 2.76 ± 0.86 | <0.001 |
| Hypertension, n (%) | 0.178 | |||||
| no | 1298 (48.45) | 310 (46.27) | 327 (48.81) | 314 (46.94) | 347 (51.79) | |
| yes | 1381 (51.55) | 360 (53.73) | 343 (51.19) | 355 (53.06) | 323 (48.21) | |
| COPD, n (%) | 0.266 | |||||
| no | 2476 (92.42) | 614 (91.64) | 626 (93.43) | 625 (93.42) | 611 (91.19) | |
| yes | 203 (7.58) | 56 (8.36) | 44 (6.57) | 44 (6.58) | 59 (8.81) | |
| Diabetes, n (%) | <0.001 | |||||
| no | 1737 (64.84) | 418 (62.39) | 493 (73.58) | 457 (68.31) | 369 (55.07) | |
| yes | 942 (35.16) | 252 (37.61) | 177 (26.42) | 212 (31.69) | 301 (44.93) | |
| Heart failure, n (%) | 0.078 | |||||
| no | 1542 (57.56) | 395 (58.96) | 392 (58.51) | 398 (59.49) | 357 (53.28) | |
| yes | 1137 (42.44) | 275 (41.04) | 278 (41.49) | 271 (40.51) | 313 (46.72) | |
| MI, n (%) | <0.001 | |||||
| no | 2309 (86.19) | 602 (89.85) | 607 (90.60) | 575 (85.95) | 525 (78.36) | |
| yes | 370 (13.81) | 68 (10.15) | 63 (9.40) | 94 (14.05) | 145 (21.64) | |
| Stroke, n (%) | 0.297 | |||||
| no | 2276 (84.96) | 558 (83.28) | 563 (84.03) | 577 (86.25) | 578 (86.27) | |
| yes | 403 (15.04) | 112 (16.72) | 107 (15.97) | 92 (13.75) | 92 (13.73) | |
| Hyperlipidemia, n (%) | 0.001 | |||||
| no | 1225 (45.73) | 275 (41.04) | 311 (46.42) | 294 (43.95) | 345 (51.49) | |
| yes | 1454 (54.27) | 395 (58.96) | 359 (53.58) | 375 (56.05) | 325 (48.51) | |
| CKD, n (%) | 0.821 | |||||
| no | 2102 (78.46) | 528 (78.81) | 530 (79.10) | 527 (78.77) | 517 (77.16) | |
| yes | 577 (21.54) | 142 (21.19) | 140 (20.90) | 142 (21.23) | 153 (22.84) | |
| Malignant tumors, n (%) | 0.345 | |||||
| no | 2251 (84.02) | 570 (85.07) | 563 (84.03) | 548 (81.91) | 570 (85.07) | |
| yes | 428 (15.98) | 100 (14.93) | 107 (15.97) | 121 (18.09) | 100 (14.93) | |
| MV, n (%) | 0.026 | |||||
| no | 275 (10.27) | 77 (11.49) | 82 (12.24) | 65 (9.72) | 51 (7.61) | |
| yes | 2404 (89.73) | 593 (88.51) | 588 (87.76) | 604 (90.28) | 619 (92.39) | |
| Vasoactive drugs, n (%) | 0.235 | |||||
| no | 1113 (41.55) | 278 (41.49) | 257 (38.36) | 289 (43.20) | 289 (43.13) | |
| yes | 1566 (58.45) | 392 (58.51) | 413 (61.64) | 380 (56.80) | 381 (56.87) | |
| LOS of hospital, day | 12.33 ± 10.38 | 12.31 ± 12.44 | 11.63 ± 9.38 | 11.92 ± 8.64 | 13.47 ± 10.58 | 0.007 |
| LOS of ICU, day | 4.62 ± 5.84 | 4.15 ± 5.81 | 4.29 ± 5.64 | 4.76 ± 5.70 | 5.27 ± 6.13 | 0.002 |
| Hospital mortality, n (%) | <0.001 | |||||
| no | 2448 (91.38) | 618 (92.24) | 632 (94.33) | 611 (91.33) | 587 (87.61) | |
| yes | 231 (8.62) | 52 (7.76) | 38 (5.67) | 58 (8.67) | 83 (12.39) | |
| ICU mortality, n (%) | 0.008 | |||||
| no | 2540 (94.81) | 640 (95.52) | 649 (96.87) | 626 (93.57) | 625 (93.28) | |
| yes | 139 (5.19) | 30 (4.48) | 21 (3.13) | 43 (6.43) | 45 (6.72) | |
| 28-day mortality, n (%) | <0.001 | |||||
| no | 2376 (88.69) | 602 (89.85) | 617 (92.09) | 593 (88.64) | 564 (84.18) | |
| yes | 303 (11.31) | 68 (10.15) | 53 (7.91) | 76 (11.36) | 106 (15.82) | |
| 90-day mortality, n (%) | <0.001 | |||||
| no | 2244 (83.76) | 565 (84.33) | 595 (88.81) | 559 (83.56) | 525 (78.36) | |
| yes | 435 (16.24) | 105 (15.67) | 75 (11.19) | 110 (16.44) | 145 (21.64) | |
| 365-day mortality, n (%) | <0.001 | |||||
| no | 2095 (78.20) | 525 (78.36) | 559 (83.43) | 528 (78.92) | 483 (72.09) | |
| yes | 584 (21.80) | 145 (21.64) | 111 (16.57) | 141 (21.08) | 187 (27.91) | |
Baseline characteristics of participants by SHR quartiles.
SHR, Stress Hyperglycemia Ratio; WBC, White Blood Cell; RBC, Red Blood Cell; RDW, Red cell Distribution Width; PT, Prothrombin Time; PTT, Partial Thromboplastin Time; INR, International Normalized Ratio; SOFA, Sequential Organ Failure Assessment. APS III, Acute Physiology Score III; SAPS II, Simplified Acute Physiology Score; OASIS, Oxford Acute Severity of Illness Score; SIRS, Systemic Inflammatory Response Syndrome; COPD, Chronic Obstructive Pulmonary Disease; MI, Myocardial Infarction; CKD, Chronic Kidney Disease; MV, Mechanical Ventilation; LOS, Length of Stay.
Continuous variables are expressed as mean (SD) and categorical variables are expressed as frequency (percentage).
Table 2 outlines the baseline characteristics at 365 days for both survival and non-survival cohorts. There were 2,095 in the survivor group and 584 in the non-survivor group. The non-survival group typically exhibited higher values of SHR, age, proportion of female, platelet, RDW, anion gap, PT, PTT, INR, urea nitrogen, creatinine, and higher SOFA, APS III, SAPS II, and OASIS. Survivors often had higher levels of hemoglobin, and chloride, and higher rates of MV and use of vasoactive drugs. Additionally, survivors also tended to have higher body weight and a greater prevalence of hypertension and hyperlipidemia. Lower incidences of COPD, heart failure, malignant tumors, CKD, and stroke were observed among survivors.
Table 2
| Total (n = 2679) | survival (n = 2095) | Non-survival (n = 584) | P-value | |
|---|---|---|---|---|
| SHR | 19.08 ± 6.82 | 18.78 ± 6.43 | 20.17 ± 8.00 | <0.001 |
| Age, years | 74.15 ± 10.49 | 72.87 ± 10.08 | 78.71 ± 10.65 | <0.001 |
| Gender, n (%) | <0.001 | |||
| male | 1648 (61.52) | 1354 (64.63) | 294 (50.34) | |
| female | 1031 (38.48) | 741 (35.37) | 290 (49.66) | |
| Weight, kg | 85.00 ± 24.14 | 86.90 ± 23.24 | 78.20 ± 26.04 | <0.001 |
| WBC, K/µL | 12.81 ± 5.89 | 12.87 ± 5.44 | 12.62 ± 7.29 | 0.452 |
| RBC, m/µL | 3.55 ± 0.64 | 3.55 ± 0.62 | 3.55 ± 0.71 | 0.809 |
| Platelet, K/µL | 183.35 ± 78.41 | 179.17 ± 74.86 | 198.32 ± 88.48 | <0.001 |
| Hemoglobin, g/dL | 10.66 ± 1.86 | 10.71 ± 1.81 | 10.51 ± 2.02 | 0.036 |
| RDW, % | 14.70 ± 2.02 | 14.42 ± 1.73 | 15.72 ± 2.59 | <0.001 |
| Hematocrit, % | 32.25 ± 5.45 | 32.23 ± 5.29 | 32.32 ± 5.98 | 0.740 |
| Sodium, mmol/L | 138.30 ± 3.88 | 138.25 ± 3.52 | 138.51 ± 4.95 | 0.225 |
| Potassium, mmol/L | 4.31 ± 0.50 | 4.31 ± 0.46 | 4.30 ± 0.63 | 0.960 |
| Chloride, mmol/L | 104.80 ± 5.18 | 105.22 ± 4.77 | 103.30 ± 6.19 | <0.001 |
| Anion gap, mmol/L | 13.51 ± 3.27 | 13.02 ± 3.03 | 15.27 ± 3.48 | <0.001 |
| PT, sec | 15.78 ± 5.55 | 15.29 ± 4.47 | 17.55 ± 8.11 | <0.001 |
| PTT, sec | 38.87 ± 17.14 | 37.88 ± 15.92 | 42.42 ± 20.57 | <0.001 |
| INR | 1.45 ± 0.55 | 1.40 ± 0.42 | 1.62 ± 0.83 | <0.001 |
| Urea nitrogen, mg/dL | 24.92 ± 17.27 | 22.47 ± 14.96 | 33.68 ± 21.61 | <0.001 |
| Creatinine, mg/dL | 1.28 ± 1.04 | 1.18 ± 0.93 | 1.63 ± 1.33 | <0.001 |
| SOFA | 5.15 ± 3.14 | 5.02 ± 3.05 | 5.61 ± 3.42 | <0.001 |
| APS III | 43.38 ± 18.90 | 40.95 ± 18.07 | 52.10 ± 19.26 | <0.001 |
| SAPS II | 39.25 ± 11.97 | 38.04 ± 11.75 | 43.58 ± 11.77 | <0.001 |
| OASIS | 32.83 ± 7.77 | 32.03 ± 7.56 | 35.71 ± 7.83 | <0.001 |
| SIRS | 2.61 ± 0.90 | 2.59 ± 0.89 | 2.67 ± 0.91 | 0.051 |
| Hypertension, n (%) | <0.001 | |||
| no | 1298 (48.45) | 962 (45.92) | 336 (57.53) | |
| yes | 1381 (51.55) | 1133 (54.08) | 248 (42.47) | |
| COPD, n (%) | 0.002 | |||
| no | 2476 (92.42) | 1954 (93.27) | 522 (89.38) | |
| yes | 203 (7.58) | 141 (6.73) | 62 (10.62) | |
| Diabetes, n (%) | 0.215 | |||
| no | 1737 (64.84) | 1371 (65.44) | 366 (62.67) | |
| yes | 942 (35.16) | 724 (34.56) | 218 (37.33) | |
| Heart failure, n (%) | <0.001 | |||
| no | 1542 (57.56) | 1261 (60.19) | 281 (48.12) | |
| yes | 1137 (42.44) | 834 (39.81) | 303 (51.88) | |
| MI, n (%) | 0.855 | |||
| no | 2309 (86.19) | 1807 (86.25) | 502 (85.96) | |
| yes | 370 (13.81) | 288 (13.75) | 82 (14.04) | |
| Malignant tumors, n (%) | 0.001 | |||
| no | 2251 (84.02) | 1786 (85.25) | 465 (79.62) | |
| yes | 428 (15.98) | 309 (14.75) | 119 (20.38) | |
| CKD, n (%) | <0.001 | |||
| no | 2102 (78.46) | 1705 (81.38) | 397 (67.98) | |
| yes | 577 (21.54) | 390 (18.62) | 187 (32.02) | |
| Stroke, n (%) | <0.001 | |||
| no | 2276 (84.96) | 1816 (86.68) | 460 (78.77) | |
| yes | 403 (15.04) | 279 (13.32) | 124 (21.23) | |
| Hyperlipidemia, n (%) | 0.003 | |||
| no | 1225 (45.73) | 926 (44.20) | 299 (51.20) | |
| yes | 1454 (54.27) | 1169 (55.80) | 285 (48.80) | |
| MI, n (%) | 0.796 | |||
| no | 2307 (86.11) | 1806 (86.21) | 501 (85.79) | |
| yes | 372 (13.89) | 289 (13.79) | 83 (14.21) | |
| MV, n (%) | 0.020 | |||
| no | 275 (10.27) | 200 (9.55) | 75 (12.84) | |
| yes | 2404 (89.73) | 1895 (90.45) | 509 (87.16) | |
| Vasoactive drugs, n (%) | <0.001 | |||
| no | 1113 (41.55) | 824 (39.33) | 289 (49.49) | |
| yes | 1566 (58.45) | 1271 (60.67) | 295 (50.51) |
Baseline characteristics of survivor and non-survivor groups.
SHR, Stress Hyperglycemia Ratio; WBC, White Blood Cell; RBC, Red Blood Cell; RDW, Red cell Distribution Width; PT, Prothrombin Time; PTT, Partial Thromboplastin Time; INR, International Normalized Ratio; SOFA, Sequential Organ Failure Assessment. APS III, Acute Physiology Score III; SAPS II, Simplified Acute Physiology Score; OASIS, Oxford Acute Severity of Illness Score; SIRS, Systemic Inflammatory Response Syndrome; MI, Myocardial Infarction; COPD, Chronic Obstructive Pulmonary Disease; CKD, Chronic Kidney Disease; MV, Mechanical Ventilation.
Continuous variables are expressed as mean (SD) and categorical variables are expressed as frequency (percentage).
Association between SHR and mortality in critically ill patients with AF
KM curve analyses revealed that there were statistically significant differences in 365-day all-cause mortality among patients stratified by quartiles of SHR (log-rank P<0.001), with significantly lower mortality rates in the Q1, Q2, and Q3 quartiles compared with Q4 (Figure 2). A similar statistical significance was observed between SHR quartiles in terms of 90-day and 28-day all-cause mortality (Supplementary Figure 1).
Figure 2
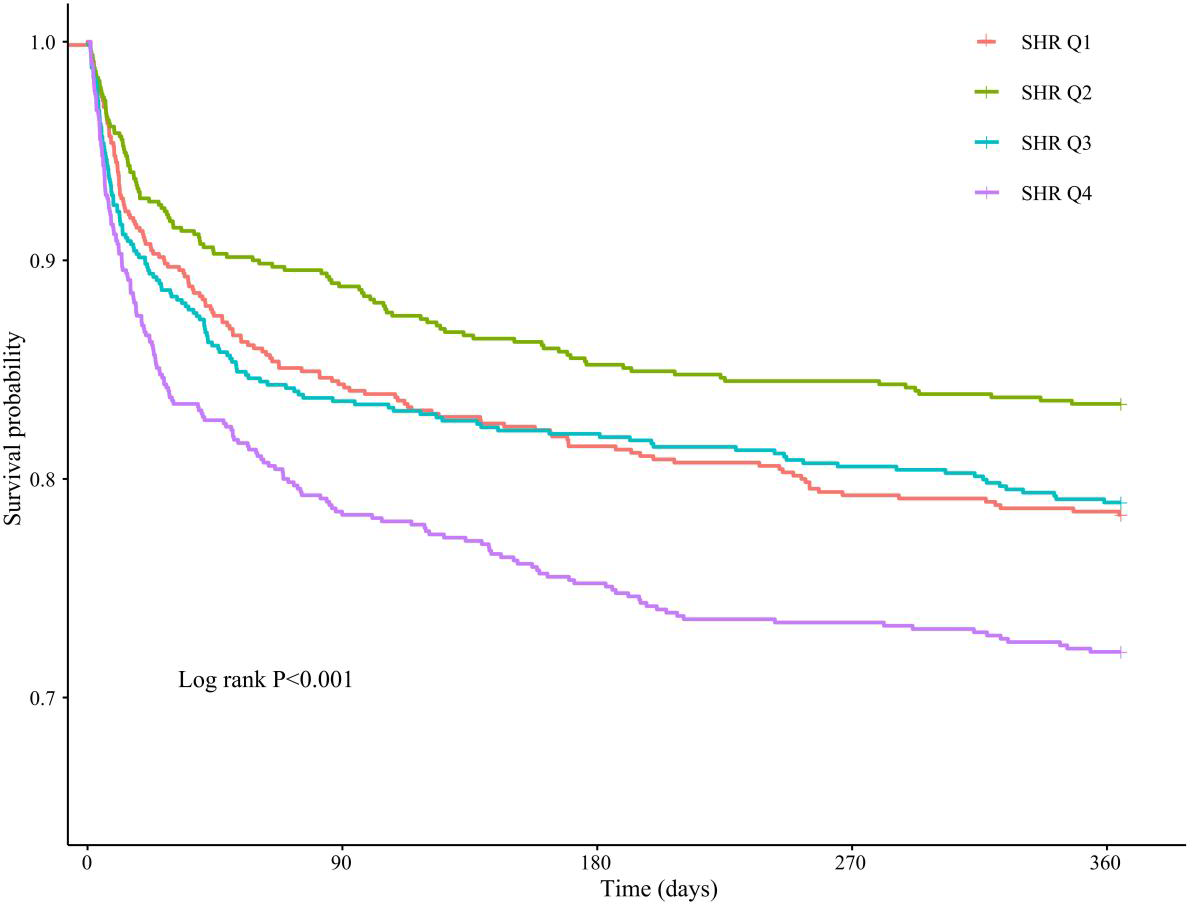
KM analysis between SHR quartiles and 365-day all-cause mortality in critically ill patients with AF.
In Table 3, the relationship between SHR and the 365-day all-cause mortality among critically ill patients with AF was evaluated using a multivariate COX proportional hazards model. In the fully adjusted model, for each unit increase in SHR, the risk of 365-day all-cause mortality increased by 3% (HR=1.03; 95%CI: 1.02-1.04; P < 0.001). When divided by quartiles of SHR and taking Q1 as the reference, the risk was significantly lower in Q2 (HR=0.74; 95%CI: 0.58-0.95; P = 0.019), not significantly different in Q3 (HR=0.98; 95CI: 0.78-1.24; P = 0.885), and significantly higher in Q4 (HR=1.36; 95%CI: 1.09-1.68; P = 0.006), demonstrating a significant trend across the quartiles (P for trend < 0.001). Additionally, in studies of SHR with 28-day and 90-day all-cause mortality, a similar pattern was observed where an increase in SHR levels was associated with an increased all-cause mortality (Supplementary Table 2).
Table 3
| Model 1 | Model 2 | Model 3 | ||||
|---|---|---|---|---|---|---|
| HR (95%CI) | P-value | HR (95%CI) | P-value | HR (95%CI) | P-value | |
| SHR | 1.03(1.02,1.04) | <0.001 | 1.03(1.02,1.04) | <0.001 | 1.02(1.01,1.03) | 0.002 |
| SHR quartiles | ||||||
| Q1 | Ref | Ref | Ref | |||
| Q2 | 0.74(0.58,0.95) | 0.019 | 0.75(0.59,0.96) | 0.023 | 0.81(0.63,1.04) | 0.099 |
| Q3 | 0.98(0.78,1.24) | 0.885 | 0.97(0.77,1.23) | 0.811 | 1.02(0.81,1.29) | 0.875 |
| Q4 | 1.36(1.09,1.68) | 0.006 | 1.40(1.12,1.74) | 0.003 | 1.32(1.06,1.65) | 0.015 |
| P for trend | <0.001 | <0.001 | 0.006 | |||
Association between SHR and 365-d all-cause mortality in critically ill patients with AF.
Model 1: no adjusted.
Model 2: adjusted for age, gender, weight, WBC, RBC, and platelet.
Model 3: adjusted for age, gender, weight, WBC, RBC, platelet, RDW, sodium, phosphorus, anion gap, PT, PTT, SOFA, hypertension, heart failure, COPD, MI, hyperlipidemia, MV, and vasoactive drug.
HR, Hazard Ratio; CI, Confidence Interval; Ref, Reference.
Treating SHR as a continuous variable, the RCS model revealed its relationship with all-cause mortality within 365 days. After adjusting for confounders, the 365-day all-cause mortality increased with increasing levels of SHR, although this trend was decreasing at the outset but did not constitute statistical significance (P for non-linear>0.05) (Figure 3). However, in the studies of 28-day and 90-day all-cause mortality, a non-linear positive association between SHR and mortality was observed (P for non-linear<0.05) (Supplementary Figure 2).
Figure 3
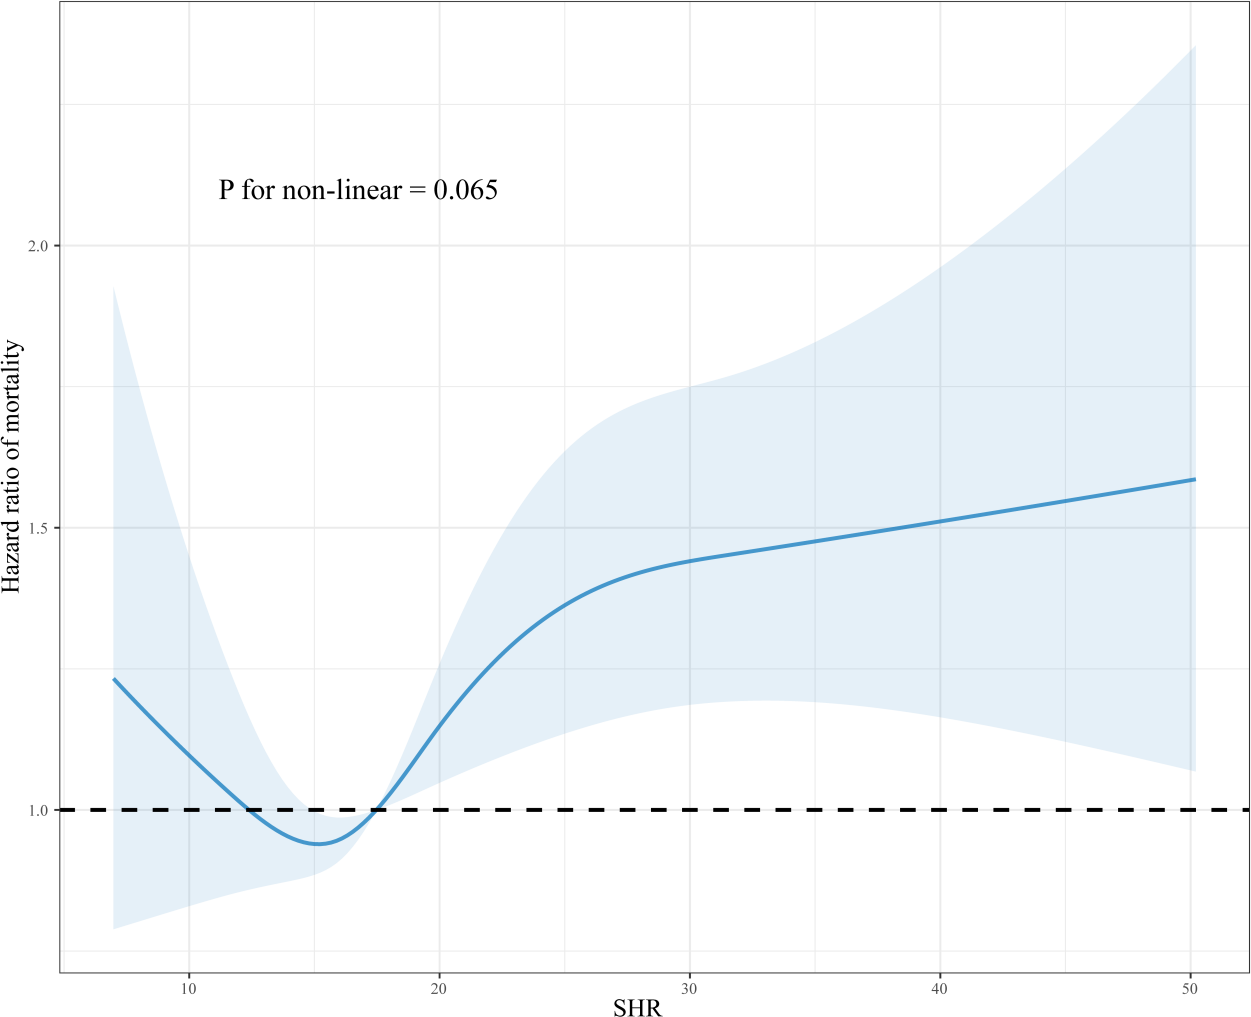
Dose-response association between SHR and 365-day all-cause mortality in critically ill patients with AF. RCS was adjusted for age, gender, weight, WBC, RBC, platelet, RDW, sodium, phosphorus, anion gap, PT, PTT, SOFA, hypertension, heart failure, COPD, MI, hyperlipidemia, MV, and vasoactive drugs.
Subgroup analyses
Figure 4 presents a subgroup analysis investigating the relationship between SHR and 365-day all-cause mortality among critically ill patients with different characteristics, as well as whether the characteristic alters this relationship. Although HRs vary across different patient subgroups, there is a general positive association between SHR and 365-day all-cause mortality. Interactions revealed that age, gender, body weight, heart failure, MI, and the use of vasoactive drugs do not affect this association. Conversely, hypertension significantly interacts with SHR, influencing the impact on mortality.
Figure 4
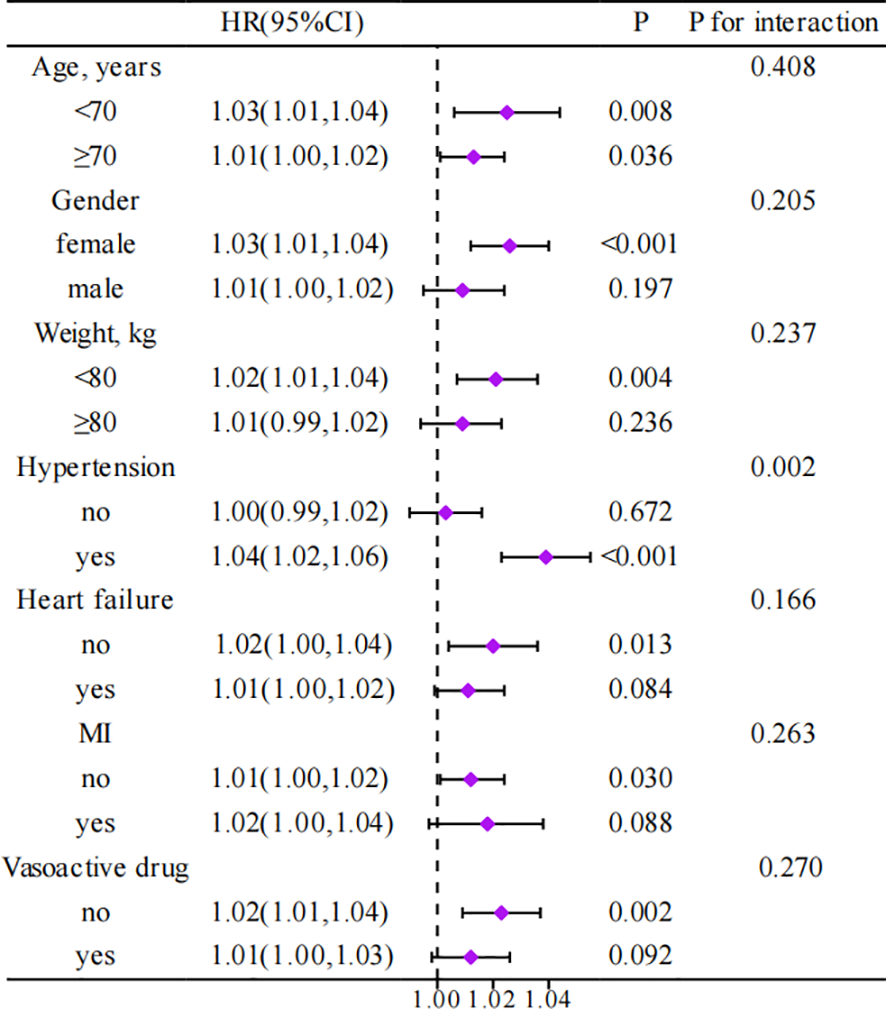
Association between different characteristics of SHR and 365-day all-cause mortality in critically ill patients with AF. HR, Hazard Ratio; CI, Confidence Interval; MI, Myocardial Infarction.
Sensitivity analyses
The sensitivity analyses were conducted to clarify the robustness of the relationship between SHR and the 365-day all-cause mortality among critically ill patients with AF after excluding those with malignant tumors. The results persistently indicated that higher SHR levels are significantly associated with an increased risk of mortality. Furthermore, the analyses were extended by excluding patients with heart failure, and the findings consistently demonstrated a positive association between SHR and 365-day all-cause mortality among critically ill patients with AF (Supplementary Tables 3-4).
Discussion
To our knowledge, this is the first study to explore the relationship between SHR and all-cause mortality in critically ill patients with AF. Our findings indicate a positive association between SHR and all-cause mortality, with higher SHR levels associated with increased mortality at 365 days, 90 days, and 28 days.
In recent years, as the incidence of diabetes has continued to rise, SHR has garnered increasing attention from researchers. SHR has been proven in the cardiovascular field to be a strong predictor of patient mortality. Zeng et al. reported a significant association between SHR and all-cause mortality in patients with acute coronary syndrome over a median follow-up of 2.1 years, with the highest tertile of SHR increasing the risk of death by 80% (14). Additionally, Qing et al. documented patients with acute decompensated heart failure at the highest SHR range had significantly increased risks of all-cause and cardiovascular mortality (6). SHR has also been shown to predict outcomes effectively in diseases such as stroke, aortic stenosis, and diabetes (6, 15, 16). Consistent with previous studies, our research, after adjusting for potential confounders, found that higher SHR is associated with increased all-cause mortality in critically ill patients with AF.
Although our study did not further elucidate the mechanisms underlying the association between SHR and all-cause mortality in critically ill patients with AF, we consider several factors that may play an important role. Firstly, SHR has been found to exacerbate the inflammatory cascade, increase oxidative stress, and impair vascular function, all of which significantly impact patient prognosis (17–19). AF itself is associated with systemic inflammation and thrombosis, and the resultant dysregulation caused by the overlay of high SHR states may exacerbate the risk of death (20, 21). In addition, higher blood sugar levels can alter ionic currents, leading to further cardiac arrhythmia and an increase in mortality (22). Finally, higher levels of SHR can adversely affect cardiomyocyte function and myocardial energy production, leading to aggravated AF and an increased risk of death (23, 24). Biologically, glycosylation end products formed by hyperglycemia may lead to fibrosis and increased atrial stiffness (25). In addition, stress hyperglycemia also induces an adrenergic response, which is associated with left atrial dilatation (26). Whereas, increased atrial stiffness and left atrial remodeling may be the main factors contributing to the development of atrial fibrillation (27). In addition, AF itself may have potential feedback effects on SHR.AF may lead to increased cardiac load and altered cardiac function, and these changes may indirectly affect blood glucose levels and SHR by affecting metabolic pathways and insulin signaling (28).
The results of our subgroup analyses offered deeper insight into the prognostic significance of SHR among patients with various characteristics. Interestingly, the predictive value of SHR differed between hypertensive and non-hypertensive groups. In critically ill AF patients with hypertension, the impact of SHR on all-cause mortality was more pronounced, suggesting an increased need to focus on patients with concomitant hypertension. Additionally, our sensitivity analyses confirmed the robustness of this association. By excluding patients with malignant tumors, and heart failure, we ascertained that the observed relationship was not unduly influenced by these conditions, which could independently affect SHR and survival outcomes.
Our study utilized a large and well-characterized database to reveal the association between SHR and all-cause mortality in critically ill patients with AF. Nonetheless, several limitations should be considered when interpreting our results. Firstly, as we utilized the MIMIC-IV database, analyses were limited to pre-collected data. Despite adjusting for multiple variables, residual confounding factors not included in the database may affect our findings. Secondly, the MIMIC-IV database reflects a single-center experience, potentially limiting the generalizability of our findings to broader populations and healthcare systems. Patients treated at Beth Israel Deaconess Medical Center may not fully represent the demographic or clinical variability of other regions or nations. Thirdly, SHR was calculated based on admission glucose concentration and HbA1c, which could entail measurement biases, and future studies should consider multiple measurements and calculations of SHR, including the variability of SHR in their scope. Fourth, Since the study focuses on ICU patients, the applicability of this indicator to outpatient settings is limited. For ICU patients, SHR is highly relevant, but its utility in outpatient care is minimal. Future research should explore the applicability of SHR in other clinical settings or develop alternative methods for assessing stress hyperglycemia in outpatient populations. In addition, further exploration of interventions to reduce SHR is necessary for special populations.
Conclusion
In summary, this study highlights the prognostic potential of SHR in critically ill patients with AF, unveiling a positive association between SHR and all-cause mortality and simultaneously underscoring the particularities within the hypertensive population. Our results lay the groundwork for future prospective studies and clinical trials.
Statements
Data availability statement
The raw data supporting the conclusions of this article will be made available by the authors, without undue reservation.
Ethics statement
The studies involving humans were approved by Institutional Review Boards (IRBs) of the Massachusetts Institute of Technology (MIT) and Beth Israel Deaconess Medical Center (BIDMC). The studies were conducted in accordance with the local legislation and institutional requirements. The participants provided their written informed consent to participate in this study.
Author contributions
LL: Writing – original draft. ZZ: Writing – original draft. KY: Writing – original draft. WZ: Writing – original draft. JP: Writing – original draft. YL: Writing – original draft. ZT: Writing – original draft. FL: Writing – original draft. SL: Writing – review & editing.
Funding
The author(s) declare financial support was received for the research, authorship, and/or publication of this article. This study was supported by the Qin Chuang yuan Traditional Chinese Medicine Innovation Research and Development Transformation Project (No.2022-QCYZH-022), the Key Basic Natural Science Foundation of Shaanxi Province (No. 2022JZ-47), and the Natural Science Foundation of Shaanxi Province (No.2023-YBSF-653).
Acknowledgments
We express our gratitude to the staff and administrators of the MIMIC database for providing access to their invaluable dataset, which made this research possible.
Conflict of interest
The authors declare that the research was conducted in the absence of any commercial or financial relationships that could be construed as a potential conflict of interest.
Publisher’s note
All claims expressed in this article are solely those of the authors and do not necessarily represent those of their affiliated organizations, or those of the publisher, the editors and the reviewers. Any product that may be evaluated in this article, or claim that may be made by its manufacturer, is not guaranteed or endorsed by the publisher.
Supplementary material
The Supplementary Material for this article can be found online at: https://www.frontiersin.org/articles/10.3389/fendo.2024.1412159/full#supplementary-material
References
1
Elliott AD Middeldorp ME Van Gelder IC Albert CM Sanders P . Author Correction: Epidemiology and modifiable risk factors for atrial fibrillation. Nat Rev Cardiol. (2023) 20:429. doi: 10.1038/s41569-023-00834-w
2
Kornej J Borschel CS Benjamin EJ Schnabel RB . Epidemiology of atrial fibrillation in the 21st century: novel methods and new insights. Circ Res. (2020) 127:4–20. doi: 10.1161/CIRCRESAHA.120.316340
3
Saleh K Haldar S . Atrial fibrillation: a contemporary update. Clin Med (Lond). (2023) 23:437–41. doi: 10.7861/clinmed.2023-23.5.Cardio2
4
Lip GYH Proietti M Potpara T Mansour M Savelieva I Tse HF et al . Atrial fibrillation and stroke prevention: 25 years of research at EP Europace journal. Europace. (2023) 25:1–38. doi: 10.1093/europace/euad226
5
Piccini JP . Atrial fibrillation and heart failure: too much talk and not enough action. JACC Clin Electrophysiol. (2023) 9:581–2. doi: 10.1016/j.jacep.2023.03.003
6
Zhou Q Yang J Wang W Shao C Hua X Tang YD . The impact of the stress hyperglycemia ratio on mortality and rehospitalization rate in patients with acute decompensated heart failure and diabetes. Cardiovasc Diabetol. (2023) 22:189. doi: 10.1186/s12933-023-01908-2
7
Huang H Liu J Li Q Qiao L Chen S Kang Y et al . Relationship between stress hyperglycemia and worsening heart failure in patients with significant secondary mitral regurgitation. Atherosclerosis. (2023) 394:117306. doi: 10.1016/j.atherosclerosis.2023.117306
8
Yang J Zheng Y Li C Gao J Meng X Zhang K et al . The impact of the stress hyperglycemia ratio on short-term and long-term poor prognosis in patients with acute coronary syndrome: insight from a large cohort study in Asia. Diabetes Care. (2022) 45:947–56. doi: 10.2337/dc21-1526
9
Ding L Zhang H Dai C Zhang A Yu F Mi L et al . The prognostic value of the stress hyperglycemia ratio for all-cause and cardiovascular mortality in patients with diabetes or prediabetes: insights from NHANES 2005-2018. Cardiovasc Diabetol. (2024) 23:84. doi: 10.1186/s12933-024-02172-8
10
Gonzalez P Lozano P Ros G Solano F . Hyperglycemia and oxidative stress: an integral, updated and critical overview of their metabolic interconnections. Int J Mol Sci. (2023) 24(11):9352. doi: 10.3390/ijms24119352
11
An Y Xu BT Wan SR Ma XM Long Y Xu Y et al . The role of oxidative stress in diabetes mellitus-induced vascular endothelial dysfunction. Cardiovasc Diabetol. (2023) 22:237. doi: 10.1186/s12933-023-01965-7
12
Gao S Huang S Lin X Xu L Yu M . Prognostic implications of stress hyperglycemia ratio in patients with myocardial infarction with nonobstructive coronary arteries. Ann Med. (2023) 55:990–9. doi: 10.1080/07853890.2023.2186479
13
Karakasis P Stalikas N Patoulias D Pamporis K Karagiannidis E Sagris M et al . Prognostic value of stress hyperglycemia ratio in patients with acute myocardial infarction: A systematic review with Bayesian and frequentist meta-analysis. Trends Cardiovasc Med. (2023) 15:14. doi: 10.1016/j.tcm.2023.11.006
14
Zeng G Song Y Zhang Z Xu J Liu Z Tang X et al . Stress hyperglycemia ratio and long-term prognosis in patients with acute coronary syndrome: A multicenter, nationwide study. J Diabetes. (2023) 15:557–68. doi: 10.1111/1753-0407.13400
15
Peng Z Song J Li L Guo C Yang J Kong W et al . Association between stress hyperglycemia and outcomes in patients with acute ischemic stroke due to large vessel occlusion. CNS Neurosci Ther. (2023) 29:2162–70. doi: 10.1111/cns.14163
16
Hu X Feng D Zhang Y Wang C Chen Y Niu G et al . Prognostic effect of stress hyperglycemia ratio on patients with severe aortic stenosis receiving transcatheter aortic valve replacement: a prospective cohort study. Cardiovasc Diabetol. (2024) 23:73. doi: 10.1186/s12933-024-02160-y
17
Zhao M Wang S Zuo A Zhang J Wen W Jiang W et al . HIF-1alpha/JMJD1A signaling regulates inflammation and oxidative stress following hyperglycemia and hypoxia-induced vascular cell injury. Cell Mol Biol Lett. (2021) 26:40. doi: 10.1186/s11658-021-00283-8
18
Smith L Yang L Hamer M . Handgrip strength, inflammatory markers, and mortality. Scand J Med Sci Sports. (2019) 29:1190–6. doi: 10.1111/sms.13433
19
Pal K Molnar AA Hutanu A Szederjesi J Branea I Timar A et al . Inflammatory biomarkers associated with in-hospital mortality in critical COVID-19 patients. Int J Mol Sci 23. (2022) 23(18):10423. doi: 10.3390/ijms231810423
20
Dobrev D Heijman J Hiram R Li N Nattel S . Inflammatory signalling in atrial cardiomyocytes: a novel unifying principle in atrial fibrillation pathophysiology. Nat Rev Cardiol. (2023) 20:145–67. doi: 10.1038/s41569-022-00759-w
21
Ding WY Protty MB Davies IG Lip GYH . Relationship between lipoproteins, thrombosis, and atrial fibrillation. Cardiovasc Res. (2022) 118:716–31. doi: 10.1093/cvr/cvab017
22
Spartalis M Pantelidis P Kontogiannis C Paschou SA Spartalis E Iliopoulos DC et al . The complex relationship between diabetes and cardiac arrhythmias: pathophysiology and mechanisms. Curr Pharm Des. (2022) 28:2129–30. doi: 10.2174/1381612828666220720095433
23
Diaz-Juarez J Suarez JA Dillmann WH Suarez J . Mitochondrial calcium handling and heart disease in diabetes mellitus. Biochim Biophys Acta Mol Basis Dis. (2021) 1867:165984. doi: 10.1016/j.bbadis.2020.165984
24
El Hadi H Vettor R Rossato M . Cardiomyocyte mitochondrial dysfunction in diabetes and its contribution in cardiac arrhythmogenesis. Mitochondrion. (2019) 46:6–14. doi: 10.1016/j.mito.2019.03.005
25
Zelniker TA Jarolim P Scirica BM Braunwald E Park JG Das S et al . Biomarker of collagen turnover (C-terminal telopeptide) and prognosis in patients with non- ST -elevation acute coronary syndromes. J Am Heart Assoc. (2019) 8:e011444. doi: 10.1161/JAHA.118.011444
26
Wang A Green JB Halperin JL Piccini JPSR . Atrial fibrillation and diabetes mellitus: JACC review topic of the week. J Am Coll Cardiol. (2019) 74:1107–15. doi: 10.1016/j.jacc.2019.07.020
27
Pan L Li Z Li C Dong X Hidru TH Liu F et al . Stress hyperglycemia ratio and neutrophil to lymphocyte ratio are reliable predictors of new-onset atrial fibrillation in patients with acute myocardial infarction. Front Cardiovasc Med. (2022) 9:1051078. doi: 10.3389/fcvm.2022.1051078
28
Fluca AL Pani B Janjusevic M Zwas DR Abraham Y Calligaris M et al . Unraveling the relationship among insulin resistance, IGF-1, and amyloid-beta 1-40: Is the definition of type 3 diabetes applicable in the cardiovascular field? Life Sci. (2024) 352:122911. doi: 10.1016/j.lfs.2024.122911
Summary
Keywords
stress hyperglycemia ratio, atrial fibrillation, mortality, critical illness, prognosis, intensive care unit
Citation
Liu L, Zhu Z, Yu K, Zhang W, Pu J, Lv Y, Tang Z, Liu F and Liu S (2024) Association between stress hyperglycemia ratio and all-cause mortality in critically ill patients with atrial fibrillation: insights from a MIMIC-IV study. Front. Endocrinol. 15:1412159. doi: 10.3389/fendo.2024.1412159
Received
04 April 2024
Accepted
05 August 2024
Published
23 August 2024
Volume
15 - 2024
Edited by
Lei Ye, University of Alabama at Birmingham, United States
Reviewed by
Yu Jiang, University of Alabama at Birmingham, United States
Xiangqin He, Augusta University, United States
Kaili Hao, University of Alabama at Birmingham, United States
Updates
Copyright
© 2024 Liu, Zhu, Yu, Zhang, Pu, Lv, Tang, Liu and Liu.
This is an open-access article distributed under the terms of the Creative Commons Attribution License (CC BY). The use, distribution or reproduction in other forums is permitted, provided the original author(s) and the copyright owner(s) are credited and that the original publication in this journal is cited, in accordance with accepted academic practice. No use, distribution or reproduction is permitted which does not comply with these terms.
*Correspondence: Shasha Liu, 18149369221@163.com
Disclaimer
All claims expressed in this article are solely those of the authors and do not necessarily represent those of their affiliated organizations, or those of the publisher, the editors and the reviewers. Any product that may be evaluated in this article or claim that may be made by its manufacturer is not guaranteed or endorsed by the publisher.