 Ying Yang
 Ting-ting Wang
 Hu-ai Xie1,2
 Pan Li
- 1College of Pharmacy, Chongqing Medical University, Chongqing, China
- 2Chongqing Key Research Laboratory for Drug Metabolism, Chongqing Medical University, Chongqing, China
Insulin resistance, a key factor in the development of type 2 diabetes mellitus (T2DM), is defined as a defect in insulin-mediated control of glucose metabolism in tissues such as liver, fat and muscle. Insulin resistance is a driving force behind various metabolic diseases, such as T2DM, hyperlipidemia, hypertension, coronary heart disease and fatty liver. Therefore, improving insulin sensitivity can be considered as an effective strategy for the prevention and treatment of these complex metabolic diseases. Cell-based models are extensively employed for the study of pathological mechanisms and drug screening, particularly in relation to insulin resistance in T2DM. Currently, numerous methods are available for the establishment of in vitro insulin resistance models, a comprehensive review of these models is required and can serve as an excellent introduction or understanding for researchers undertaking studies in this filed. This review examines and discusses the primary methods for establishing and evaluating insulin resistance cell models. Furthermore, it highlights key issues and suggestions on cell selection, establishment, evaluation and drug screening of insulin resistance, thereby providing valuable references for the future research efforts.
1 Introduction
Insulin resistance, defined as a defect in insulin-mediated control of glucose metabolism in tissues such as liver, fat and muscle, is a significant contributor to the development of type 2 diabetes mellitus (T2DM) and cardiovascular disease, particularly in the context of obesity and metabolic syndrome (1–3). Nowadays, it is now widely recognized that insulin resistance is typically characterized by impaired GLUT4 function in muscle and adipose tissue, as well as an inability to suppress hepatic glucose output (1, 4). In conditions of insulin resistance, the release of glucose from the liver (hepatic glucose output), and glucose uptake/utilization into muscle and fat (where it is stored as glycogen) are both inhibited, even in the presence of normal or elevated levels of both exogenous and endogenous insulin (4–6).
Up to now, a multitude of potential pathogenic factors and the related pathogenesis of insulin resistance have been proposed, including genetics, obesity, aging, exercise, diet, etc. (7–9). Among these factors, diet-induced metabolic dysfunction plays a significant role in the development of insulin resistance currently (10). Diets high in calories, characterized by an excessive intake of carbohydrates and fats and a low dietary fiber consumption, can predispose individuals to insulin resistance (11, 12). Mechanistically, several mainstream or classical pathological mechanisms of insulin resistance have gained widespread recognition, including oxidative stress, inflammatory response, insulin signal disorder, endoplasmic reticulum stress, as well as mitochondrial dysfunction (13–15). These conditions can be induced by the excessive intake of carbohydrates (such as glucose) or fats (especially for saturated fatty acids), the chronic insulin exposure, and the inflammatory factors such as tumor necrosis factor alpha (TNF-α) (11–13, 16, 17). The representative mechanisms of insulin resistance have been described in Figure 1 (mainly including insulin resistance caused by high glucose, high insulin and free fatty acids). In recent years, the pathogenesis of insulin resistance has remained a hot issue in metabolic disease research. Notably, the studies by James and colleagues have demonstrated that mitochondrial oxidative stress can cause insulin resistance without disrupting oxidative phosphorylation, and the elevated mitochondrial ceramide levels augment mitochondrial membrane permeability and apoptosis, leading to insulin resistance (15, 18, 19). In addition, growing evidence suggests a close relationship between gut microbial dysbiosis and insulin resistance, as is found that individuals with low bacterial gene counts exhibited higher insulin resistance, dyslipidemia, and inflammation compared to those with higher bacterial gene counts (20, 21). Taken together, these findings provide new insights into the pathogenesis of insulin resistance.
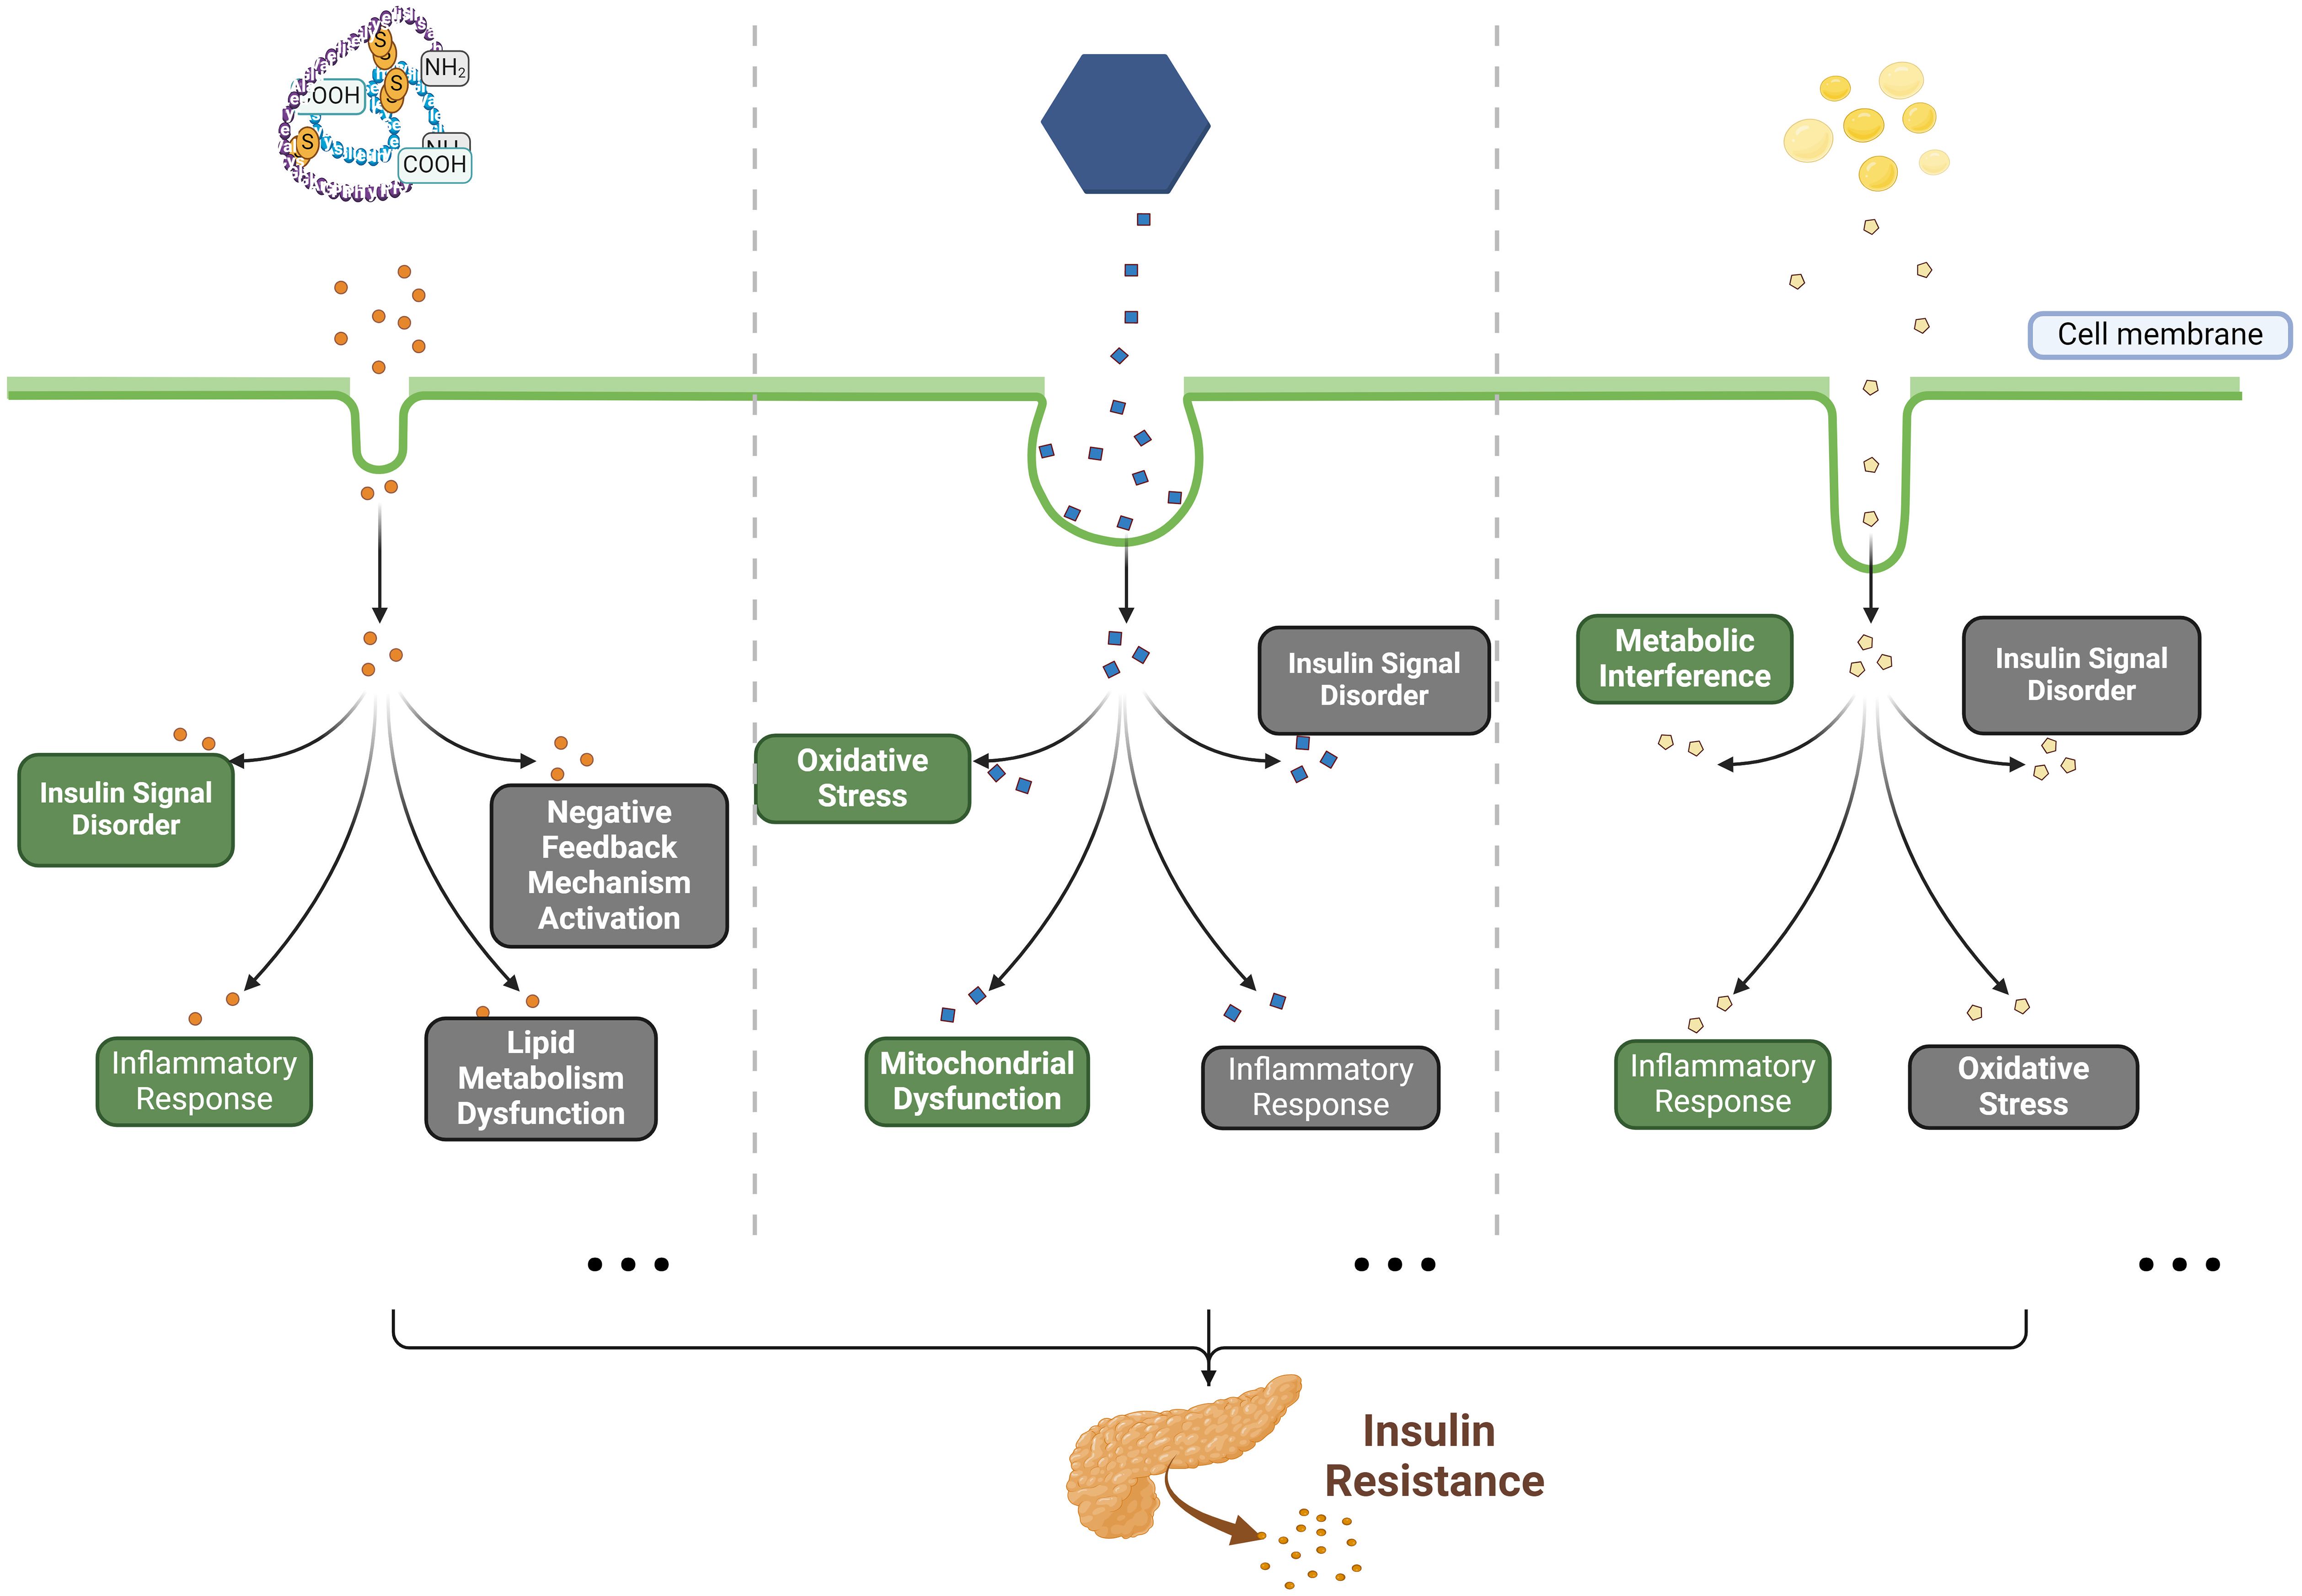
Figure 1. The classical pathogenesis of insulin resistance caused by HCI, HCG and FFAs. Briefly, in previous studies, high concentrations of insulin (HCI), glucose (HCG) and free fatty acids (FFAs) have been identified as the primary substrates for inducing in vitro insulin resistance. Mechanistically, HCI disrupts insulin signaling by activating negative feedback mechanisms, impairing lipid metabolism, as well as inducing inflammatory responses; HCG interferes with insulin signaling and impairs glucose metabolism through inducing oxidative stress, mitochondrial dysfunction, and inflammatory responses; FFAs (such as palmitic acid) affect glucose metabolism by causing metabolic disturbances and dysfunction of insulin signaling, while also promoting oxidative stress and inflammatory responses.
Nevertheless, the molecular mechanisms contributing to insulin resistance still remain incompletely understood, and it is critical and necessary to establish insulin resistance models for mechanism study or drug screening. While animal models, primarily using rats and mice, have been pivotal in insulin resistance research due to its biological resemblance to human, the characteristics of animal study limit its application, such as the lengthy feeding cycles, high costs, complex procedures, and ethical considerations. In contrast, cell culture is highly desirable due to its accessibility and affordability. It serves as a valuable tool for studying mechanisms, conducting bio-activity screening, and assessing toxicity. Cell-based screening studies offer several advantages over animal studies. For instance, it is easier to control due to the fewer influencing factors, including lower individual differences and less impact from environmental or geographical variations, thereby enhancing the reproducibility in the experimental process. Additionally, cell studies are convenient, rapid, and cost-effective, making them an attractive alternative to animal research.
In previous insulin resistance-associated studies (22–24) cell-based investigations have been commonly employed for drug screening and mechanistic exploration. Numerous methods are available for the establishment of in vitro insulin resistance models in published data, a comprehensive review of these models is required and can serve as an excellent introduction or understanding for researchers undertaking studies in this filed. Therefore, our current review aims to provide an exhaustive overview and appraisal of the published in vitro insulin resistance models. Meanwhile, this review also presents guidelines for the comprehensive process of constructing these cell models, including the selection of cell lines, the induction conditions, and the evaluation methods. Such comprehensive guidance may serve as a valuable reference for future research in this area.
2 Data sources
We conducted a literature search using databases such as PUBMED, GOOGLE SCHOLAR, and WEB of SCIENCE, utilizing keywords such as “insulin resistance” or “insulin resistance and cell models”. Subsequently, we systematically reviewed and summarized the literature retrieved from these databases (up to 1 Nov 2024).
3 Overview and appraisal
3.1 Cell lines for insulin resistance
The liver, muscle and adipose tissue are universally acknowledged as the primary tissues sensitive to insulin. Consequently, in vitro models of insulin resistance are typically generated using cell lines derived from these tissues. This review provides a comprehensive summary of the cell lines utilized, with an in-depth elaboration on each.
3.1.1 Liver
3.1.1.1 HepG2 cell
The human hepatoma cell line, HepG2, is a widely utilized model for hepatic cells and has been employed in diverse research areas ranging from oncogenesis to the investigation of substance-induced liver phenotypes. Originating from human liver cancer, HepG2 cells present numerous typical characteristics of liver cells, such as the ability to express a variety of liver-related enzymes and transport proteins. Concurrently, HepG2 cell line maintains the insulin response mechanisms of hepatocytes, making it as an ideal model for studying insulin resistance in liver cells (25, 26).
Over the past decade, a review of published references reveals that the HepG2 cell line is the most commonly used model for studying the pathological mechanisms and conducting drug screening related to insulin resistance (a total of 1381 papers in PUBMED searching, using the keywords “HepG2 cells, insulin resistance”). For instance, studies using HepG2 cells have demonstrated that early growth response proteins-2 (Egr2) enhances insulin resistance via JAK2/STAT3/SOCS-1 pathway (27), PKM2 may promote hepatic insulin resistance via STAT3 pathway (28), and ASGR1 is a potential intervention target for improving systemic insulin resistance (29). Furthermore, the HepG2 cell line is increasingly being used in drug screening for insulin resistance (30–32), with some studies exclusively employing it as an in vitro model (33–35).
Despite the HepG2 cell line becoming a widely utilized choice in research due to its accessibility, robust adaptability and stability in vitro, it presents certain limitations when employed for insulin resistance studies. Originating from tumor cells, HepG2 cells show distinct characteristics compared to normal liver cells, which may lead to abnormal activation of signal pathways or gene mutations, thus hindering the establishment of accurate insulin resistance models. For example, the inhibition of FOXK1 expression in hepatocellular carcinoma cells reduces cellular aerobic glycolysis and cell viability by impeding the transduction of the AKT/mTOR signaling pathway, a function distinct from that of Foxk1/2 in normal liver cells (36). Alterations in the transforming growth factor-beta (TGF-β) signaling pathway in HepG2 cells may influence inflammation, fibrogenesis, and immunomodulation compared to normal liver cells (37, 38). Furthermore, HepG2 cells are less differentiated than primary hepatocytes, lacking some typical hepatocyte functions and metabolic characteristics, which can exacerbate the probing defects in HepG2 cells (such as showing a weaker insulin sensitivity than primary hepatocytes) (39–41). These factors should be carefully considered when selecting HepG2 cell line, especially for studying pharmacological mechanisms. Additionally, the basal expression or activity of these genes in HepG2 cells should be taken into account in gene knockdown or overexpression experiments.
3.1.1.2 L02 cell
The human hepatocyte L02 cells (L02) are also frequently employed in the development of hepatic insulin resistance models in vitro (a total of 43 papers in PUBMED searching, using the keywords “L02 cells, insulin resistance”). As a normal human liver cell line, L02 cells bear closer resemblance to actual liver cells in terms of cellular characteristics and functions, including metabolic pathways, physiological enzyme levels and gene expression patterns. Hence using L02 cell line can accurately mirror the mechanisms of hepatocyte insulin resistance under both physiological and pathological conditions (42, 43). Meanwhile, a study indicates that L02 cell line shows a slightly narrower toxicity threshold (assessed by CCK8 assay), making it more stable and sensitive than HepG2 cells in assessing drug-induced liver injury (44). In previous studies, L02 cell line has been used to validate that curcumin ameliorates bisphenol A-induced insulin resistance by inhibiting the JNK pathway (45), to demonstrate that mitochondrial oxidative stress-induced hepatic insulin resistance can be mitigated by sphingosine 1-phosphate (46), as well as to assess the effects and mechanism of substances such as pterostilbene and Annexin A1 on hepatic insulin resistance (47, 48). Furthermore, we observed that L02 and HepG2 cell models are frequently used in conjunction for the activity screening of anti-insulin resistance (49–51).
We also note that, the establishment of an insulin resistance model in vitro using L02 cells may take longer time compared to HepG2 cells, and regardless of whether it is induced by HCI, FFAs or other agents, the induction period typically spans 24-72 h (49, 51, 52). Meanwhile, based on our experience and feedback from other research groups, L02 cells are highly sensitive to environmental factors such as temperature, composition of the culture medium and pH levels. In addition, L02 cell line shows a slower growth rate compared to HepG2 cells.
3.1.1.3 Primary hepatocyte
Primary hepatocytes are typically procured from the livers of animals, such as rats and mice, due to the scarcity of human liver tissue and ethical considerations. These cells are extracted directly from liver tissues, offering superior physiological relevance, robust metabolizing enzyme activity and validated gene expression in comparison to cell lines (53–56). Primary hepatocytes are often employed in conjunction with in vivo insulin resistance models to explore the pathogenesis of insulin resistance, screen for drug activity, and elucidate pharmacological mechanisms (a total of 656 papers in PUBMED searching, using the keywords “primary hepatocytes, insulin resistance”). For instance, primary hepatocytes have been employed to assess the impact of Inositol polyphosphate multikinase on FFAs-induced insulin resistance (57), to evaluate the role of chemotactic eicosanoid LTB4 in dexamethasone-induced insulin resistance (58), as well as to determine the insulin sensitization effect of short-term curcumin gavage in a rapid dexamethasone-induced insulin resistance (59).
Despite the recognized benefits of employing primary hepatocytes, their application appears to be less prevalent than that of hepatic cell lines, particularly in pharmacological mechanism investigations. This discrepancy may be ascribed to the complexities involved in obtaining and culturing primary hepatocytes, as well as the inherent variability derived from different individual sources, which consequently affects the high reproducibility. Additionally, primary cells from animals (such as rats or mice) have species-specific physiological differences compared with human cells, making it difficult to extrapolate the results to humans.
3.1.2 Muscle
3.1.2.1 C2C12 cell
The C2C12 cell line is derived from mouse myoblasts and has the capacity to differentiate into mature muscle tubes under specific culture conditions. C2C12 cells exhibit physiological characteristics akin to skeletal muscle cells, including the expression of myosin heavy chains and the formation of sarcomeres. Thus it has been utilized extensively as an in vitro model in understanding metabolic disease progression, including insulin resistance (60). In previous studies, C2C12 cells appear to be the most frequently used cell type for in vitro construction of muscle insulin resistance models (a total of 666 papers in PUBMED searching, using the key words “C2C12 cells, insulin resistance”). The findings that mangiferin ameliorates insulin resistance by activating the PPARα pathway (61), resveratrol enhances PA-induced insulin resistance via the DDIT4/mTOR pathway (62), and downregulation of lipin-1 induces insulin resistance by elevating intracellular ceramide accumulation (63), were all derived from the experiments using insulin resistance C2C12 cell models.
A comprehensive review of studies on the C2C12 cell line underscores its considerable importance in pharmaceutical and biomedical research, attributable to its expression of glucose transporter (GLUT)-4 and other characteristics that bear a striking resemblance to those of human skeletal muscle cells (60). While it is acknowledged that C2C12 cells possess the capability to differentiate into myotubes, it is imperative to recognize that their differentiation might not be entirely analogous to that of actual skeletal muscle cells. Incompletely differentiated cells may manifest diminished GLUT4 expression, frequently in conjunction with modifications in the expression or activity of pivotal proteins within the insulin signaling pathway (64, 65). Considering that glucose uptake serves as a “gold standard” for evaluating insulin resistance during drug screening, C2C12 cells might present certain limitations due to their suboptimal responsiveness to insulin-stimulated glucose uptake, thereby necessitating the employment of L6 cells as an alternative (66). Additionally, the C2C12 cell line demonstrates resistance to both gene transfection and viral transduction, thereby constraining its application in pertinent cellular molecular biology research (67).
3.1.2.2 L-6 myoblast
L-6 myoblasts (L6 cells), a type of rat skeletal muscle myoblast cell, are extensively utilized in research pertaining to muscle development, diseases, and metabolic disorders. Their capacity to differentiate into mature myotubes under controlled in vitro conditions, coupled with their robust insulin sensitivity, makes them ideal for constructing in vitro models of muscle insulin resistance (68, 69). In previous studies (a total of 477 papers in PUBMED searching, using the key words “L6 cells, insulin resistance”), L6 cells have been employed to explore the role of NF-κB activation in the development of insulin resistance (70), to study the mechanism of HM-chromanone in alleviating obesity-related insulin resistance (71), and to assess the impact of metformin on attenuating insulin resistance (72).
Skeletal muscle serves as a crucial target tissue for insulin action within the body, playing an instrumental role in the regulation of blood glucose. L6 cells, which serve as a model for skeletal muscle cells, are intimately associated with the mechanism of insulin resistance. L6 cell line can effectively simulate the response of skeletal muscle cells to insulin in vivo. It also exhibits a GLUT expression profile similar to fully differentiated mammalian muscle cells, demonstrating high levels of GLUT4 (the sole insulin-dependent glucose transporter in skeletal muscle) and comparatively low expression of GLUT1 and GLUT3, which results in a low basal glucose uptake rate but a pronounced response to insulin stimulation (66, 73). Furthermore, the highest expression level of GLUT4 is observed in L6 cells stimulated with insulin, surpassing that of C2C12 and HMSC cells (66). And meanwhile, the sensitivity of mitochondrial respiration in L6 cells to mitochondrial poisons is analogous to that observed in primary muscle fibers, indicating that the L6 cells embody the requisite metabolic characteristics necessary for exploring the role of mitochondria in insulin resistance (74). Taken together, these evidence suggest that L6 cells show a heightened sensitivity to insulin.
Although both C2C12 and L6 cells have been frequently utilized in previous studies to establish insulin resistance models in vitro, a recent study using transcriptomics and metabolomics highlights significant differences between the two different skeletal muscle models. It is found that the L6 cells show the highest expression levels of glucose transporter and mitochondrial electron transfer genes, coupled with superior insulin-stimulated glucose uptake and oxidation capacity, which renders L6 cells particularly suitable for investigations into glucose metabolism and mitochondrial function (66). Conversely, C2C12 cells with mRNAs encoding for actin and myosin are significantly enriched, have higher glucose oxidation capacity than L6 cells; meanwhile, C2C12 cell line shows a similar to the differentiated muscle tissue in myofibrillar content and glycogen storage, making it more suitable for exercise/stress response studies (66). In addition, the mechanisms through which FFAs induce insulin resistance differ between these two cell types. For example, evidence suggests that the myocellular abundance of caveolin-enriched domains (CEM) located at the plasma membrane is significantly higher in L6 cells compared to C2C12 cells, which leads to the distinct mechanisms of “PA-ceramide”-induced insulin resistance observed in both cell types (ectopic accumulation of ceramide in response to oversupply of PA may underlie the development of insulin resistance in skeletal muscle) (75–77). Taken together, our present understanding suggests that L6 cells may be a more appropriate cell line for the establishment of skeletal muscle insulin resistance in vitro. However, the differences of utilizing these two cell types for the construction of an insulin-resistant cell model, particularly in relation to functionality and underlying mechanisms, still need further exploration.
3.1.3 Adipose
3.1.3.1 3T3-L1 Cell Line
The 3T3-L1 cell line, a well-established preadipose cell line derived from murine Swiss 3T3 cells, is frequently employed in studies investigating adipocyte differentiation and insulin resistance (78, 79). Upon full differentiation, 3T3-L1 cells display essential characteristics of mature adipocytes, including lipid accumulation and the expression of adipogenic transcription factors such as PPARγ and C/EBPα (79–81). Adipocytes play a crucial role in glucose uptake and insulin response, which contributes to the progression towards insulin resistance (82–84).
3T3-L1 cells are the most commonly used cell model for adipocyte insulin resistance research, including basic molecular mechanism studies and drug screening (2151 papers in PUBMED searching using “3T3-L1 cells, insulin resistance” as key words). In recent years, 3T3-L1 cells are employed in studies about insulin resistance, such as assessing the effect of phenethyl isothiocyanate on H2O2-induced insulin resistance (85), exploring the role of endogenous CSE/H2 S system in TNF-α-induced insulin resistance (86), and evaluating the activities and mechanisms of natural products (geniposide or baicalin) in improving insulin resistance (87, 88). Notably, comparing to the freshly isolated cells, 3T3-L1 cell line is easier to culture and can tolerate a greater number of passages and offers a homogeneous cell population, which exhibits a homogenous response following treatments and changes in experimental conditions (79, 89). However, the 3T3-L1 cell model has some limitations in establishing insulin resistance. For example, the initial subculture necessitates a minimum duration of two weeks for adipogenic differentiation (90). Moreover, when confluent or extensively passaged, 3T3-L1 cells lose their ability to differentiate into adipocytes and become difficult to transfect (79, 91).
3.1.3.2 SGBS Cell Line
The Simpson-Golabi-Behmel syndrome cell line (SGBS) is a human cell model derived from preadipocytes of a patient diagnosed with Simpson-Golabi-Behmel syndrome, and it has been extensively utilized in research to study adipocyte biology and metabolic functions (82, 92). Initially isolated from subcutaneous adipose tissue, SGBS cells demonstrate a high capacity for adipogenic differentiation and exhibit key characteristics (such as gene expression profile and metabolic functionality) of mature adipocytes (including primary human adipocytes) (82, 93, 94). Therefore, SGBS cell lie serves as an ideal model for investigating human adipocyte differentiation, insulin resistance, and metabolic disorders. In recent years, SGBS cells have been applied to insulin resistance research (a total of 41 papers in PUBMED searching, using the key words “SGBS cells, insulin resistance”). By using SGBS cells model, it was found that N-Methylpyridinium can attenuate TNF-α-mediated insulin resistance and inflammation (95), Interferon-gamma alters adipocyte phenotype and impairs response to insulin and adiponectin release (96), and miR-146a regulates systemic and adipocyte insulin sensitivity via downregulation of NPR3 (97). However, SGBS cells also present limitations in establishing in vitro models of insulin resistance. The growth and differentiation capacity of SGBS cells in long-term culture can be easily affected by the environmental factors such as oxygen concentration and culture medium composition, which may potentially compromise the reproducibility and complexity of the experiments (98). Additionally, in contrast to primary cells, SGBS cells show a reduced sensitivity to apoptosis-inducing stimuli under certain conditions, which may limit their effectiveness in studying adipocyte biology under stress (98).
Overall, the 3T3-L1 and SGBS cell lines are the mainly used adipocytes for establishing in vitro cell models. However, several considerations should be taken into account when deciding between these two cell lines. In chronic insulin stimulated-insulin resistance model, the basal and insulin-stimulated glucose uptake is more profoundly affected in insulin resistant 3T3-L1 cells compared to SGBS cells (82). While both cell lines can be induced to insulin resistance by using FFAs, insulin, and TNF-α (discussed further in the subsequent sections), a study indicates that SGBS cell line is more sensitive than 3T3-L1 to insulin signaling disruptions induced by FFAs such as PA, because it shows a more pronounced recovery of Akt phosphorylation in response to insulin stimulation and a closer resemblance to human primary cells in signaling responses (99). In addition, studies suggest that, fully differentiated SGBS cells, rather than 3T3-L1 cells, present a more similar morphology, transcript level, and biochemical function to the primary omental adipocytes associated with obesity-induced metabolic disorder (79, 100, 101). Interestingly, it is found that SGBS cells not only show white adipocyte functionality but also possess the ability to differentiate into brown or beige adipocytes, providing a valuable platform for exploring the browning process in human fat tissue (82).
3.2 Induction conditions for insulin resistance
In previous studies, the most commonly used methods for inducing insulin resistance include high concentrations of insulin (HCI) (102, 103), high concentrations of glucose (HCG) (104, 105), and high levels of FFAs (106, 107), alongside other inducers like dexamethasone (108, 109), glucosamine (GlcN) (110, 111), uric acid (UA) (112), and pro-inflammatory cytokines such as tumor necrosis factor-α (TNF-α) (113, 114). Each method has its unique advantages and limitations in replicating various aspects of insulin resistance. In this Review, we primarily focus on the three most commonly used substrates, including HCI, HCG and FFAs, which are frequently employed to establish in vitro insulin resistance in recent publications.
3.2.1 High concentration of insulin
Using HCI to impair insulin signaling and cause insulin transduction dysfunction in vitro is a generally employed method for establishing insulin resistance cell model (82, 115, 116). Mechanistically, HCI triggers the preferential internalization and degradation of kinase-competent insulin receptors, resulting in a population of receptors with multiple functional abnormalities accumulated on the cell surface. And this process reduces the number of insulin receptors, with the extent of reduction directly proportional to the levels of insulin and the duration of stimulation (117, 118). Hepatic cells, primarily HepG2 cells (119, 120), adipocytes such as 3T3-L1 cells, SGBS cells and primary adipocytes (121–125), as well as muscle cells like C2C12 (126, 127), are frequently employed to establish an insulin resistance model via HCI in vitro. In these studies, exposure times typically range from 24 to 48 hours and concentrations vary from 100 to 1,000 nM. These conditions have been documented to decrease glucose uptake and downregulate or inhibit key insulin signaling proteins such as IRS1 and GLUTs (82, 115, 122, 128–130).
Chronic hyperinsulinemia is a primary contributor to the exacerbation and initiation of insulin resistance, leading to the development of overt T2DM. Numerous studies have demonstrated the efficacy of chronic insulin exposure in the induction of insulin resistance models in vitro (82). In previous studies, Fan et al. employed a concentration of 100 nM insulin for 36h to induce insulin resistance and studied the beneficial effect of ginsenoside-Rg1 on glucose metabolism in HepG2 cells (129). Similarly, Vlavcheski et al. exposed L6 cells to 100 nM insulin for 24h to induce insulin resistance cell model and explored the potential effect of resveratrol against insulin resistance in muscle cells (115). Nevertheless, there are still many limitations in HCI induction. For example, HCI induction does not fully replicate the multifactorial nature of insulin resistance in vivo, where additional factors like lipotoxicity and inflammation also play a significant role (131). Meanwhile, evidence indicates that the effect triggered by HCI may be temporary, with cells potentially reverting to their original insulin sensitivity levels upon cessation of the insulin treatment, which poses challenges for conducting long-term studies or experiments that necessitate a consistent state of insulin resistance (132, 133). Furthermore, under physiological conditions, insulin secretion is meticulously regulated, dynamically adjusting in response to various factors such as blood glucose levels (134, 135). However, the HCI observed in vitro significantly deviates from physiological states in terms of insulin secretion regulation, mechanism of action, and overall metabolic environment, failing to accurately represent the physiological state. In conclusion, these limitations of HCI-based construction of insulin resistance and their induced outcomes should be taken into consideration in future research.
3.2.2 High concentration of glucose
Excessive glucose (relevant for hyperglycemia) can induce serine/threonine phosphorylation of IRS protein at multiple sites, which impedes the binding affinity of IRS to insulin receptor and suppresses the activation of PI3K/AKT pathway-mediated glucose metabolism (131). Meanwhile, it has been noted that HCG also activates the MAPK and NFκB pathways, both of which play a significant role in the development of insulin resistance (136, 137). Previous studies have used a variety of cell lines, including HepG2 cells, 3T3-L1 cells, L6 cells, and primary hepatocytes, to induce insulin resistance in vitro using HCG (35, 138–140). In published data, the induction of insulin resistance in cells is typically achieved by exposing them to glucose concentrations between 25 mM and 60 mM over a period of 24 to 48h (139–143). For instance, Zhang et al. established the insulin resistance model by exposing cells to 25 mM glucose and discovered that Epigallocatechin gallate ameliorated insulin resistance by modulating inflammation and oxidative stress in HepG2 cells (104). Luo et al. treated C2C12 cells with 60 mM glucose for 5 days to explore the underlying mechanisms of HCG-induced insulin resistance (144).
HCG-induced insulin resistance model, replicating the hyperglycemia observed in diabetic patients, is employed to investigate the mechanisms of insulin resistance and anti-insulin resistance drug screening in vitro. It is also known that HCG can induce cell damage, called glucose toxicity. Cellular responses to high glucose are numerous, and HCG induction can inflict cellular damage by compromising cell membrane integrity or hastening ROS-mediated stress responses, further impair mitochondrial function, resulting in cellular damage and apoptosis (145, 146). Therefore, cell viability should be considered when constructing an insulin resistance model, particularly for drug screening and evaluation purposes. This aspect is not consistently addressed in published studies, which will be elaborated upon in our subsequent evaluation section. Furthermore, it is significant to ensure that the glucose concentration should be physiologically appropriate. As is described in a few studies, more than 30 mmol/L glucose has been used to represent the hyperglycaemia condition (142, 147, 148). However, we recommend that glucose levels should not exceed 25-30 mmol/L to mimic the diabetic conditions accurately. Levels above 30 mmol/L (600 mg/dL), accompanied by serum osmolality >320 mOsm/kg, induce signs and symptoms related to the hyperosmolar hyperglycemic state. Treating cells with such high glucose concentrations is not pathophysiologically relevant, rendering the findings from these experiments meaningless.
3.2.3 Free fatty acids
FFAs, primarily consisting of PA and oleic acid (OA), are widely recognized as crucial pathogenic factors in insulin resistance and the development of T2DM (42, 149). Although the mechanisms underlying how obesity and FFAs-induced insulin resistance remain incompletely understood, mainstream views suggest that excessive FFAs can lead to dysfunction in gluconeogenesis and glycogen synthesis by increasing the level of intracellular phosphorylated glycogen synthase, down-regulating the phosphorylation of protein kinase B (p-AKT), reducing the expression of glycogen synthase, and inhibiting the insulin signal pathway (132, 150, 151). Concurrently, FFAs-induced oxidative stress and inflammatory response play important roles in insulin resistance development. FFAs produce low-grade inflammation through activation of nuclear factor-kappa B (NF-κB), leading to the release of the pro-inflammatory factors and activation of oxidative stress-activated signaling pathways in the liver and skeletal muscle (152, 153). Therefore, FFAs can also be utilized as inducers for modeling insulin resistance, particularly in replicating obesity-induced insulin resistance in vitro.
From previous studies, the induced concentrations of FFA (main PA) typically range from 100 µM to 1,000 µM, with exposure periods spanning between 6 and 48h (106, 107, 154). As is shown that, Wu et al. simulated obesity-induced hepatic insulin resistance using 0.25 mM PA and examined the positive impact of apigenin on alleviating PA-induced insulin resistance in HepG2 cells (106). Lei et al. treated HepG2 cells with 1 mM FFAs (mixture, OA and PA in a ratio of 2:1) for 24 h to induce the insulin resistance model and evaluated the anti-insulin resistance effect of vaccarin (a natural product) (155). Furthermore, FFAs such as OA or linoleate, can also induce insulin resistance; but the mechanisms and effects of this insulin resistance differ from those induced by PA (156). A review of existing literature reveals that PA is more commonly used in vitro for the creation of insulin resistance models compared to other free fatty acids such as OA (as was determined by a search of 1082 papers using the keyword “palmitic acid, insulin resistance” in PUBMED and 591 papers using “oleic acid, insulin resistance.” In previous studies, OA appears to facilitate the in vitro development of a lipid-accumulating cell model. Interestingly, it was found that low dose of OA or linoleate has a protective effect against PA-induced cytotoxicity and insulin resistance (157–159). Therefore, this protective effect of OA should be noted when using mixed FFAs (such as a mixture of PA and OA) to induce insulin resistance models in vitro. Meanwhile, it is suggested that the cell viability should also be considered when evaluating the models of insulin resistance caused by FFAs due to their cytotoxicity (160, 161).
3.2.4 Other inducers
Over the past decades, although the causal relationship between inflammation and insulin resistance is not completely understood, a large number of animal and human studies have strongly suggested that chronic inflammation in adipose tissue plays an important role in the development and progression of obesity-related insulin resistance (162, 163). Pro-inflammatory cytokines such as TNF-α are widely used in insulin resistance cell models. TNF-α is mainly produced by adipocytes and peripheral tissues, which induce localized inflammation through reactive oxygen species (ROS) generation and transcription-mediated signaling pathways. In addition, TNF-α inhibits insulin signaling by increasing serine phosphorylation of IRS-1, thereby reducing the ability of IRS-1 to transmit downstream signals. This inhibition leads to a decrease in GLUT4 translocation and glucose uptake, resulting in insulin resistance (164–166). TNF-α is commonly used at concentrations of 10 to 50 ng/mL for 24 to 48h (147, 167). The advantage of this approach is that it closely mimics the pro-inflammatory environment associated with obesity-related metabolic disorders. However, the broad effects of cytokines can lead to unintended cellular responses, complicating data interpretation.
Uric acid (UA) is another agent associated with insulin resistance, particularly in liver cells (168, 169). Concentrations of UA ranging from 600 to 1,000 µM were applied for 24 to 48h (51, 168). UA-induced insulin resistance models are especially useful for studying the effects of hyperuricemia on insulin signaling, lipid metabolism, and inflammation in hepatic cells. Experimental evidence demonstrates that UA exposure elevates serine phosphorylation of IRS-1 while simultaneously reducing phosphorylation of AKT, resulting in impaired translocation of the glucose transporter GLUT4 and subsequently diminishing cellular glucose uptake (112, 170). Additionally, UA activates the NLRP3 inflammasome and promotes the secretion of pro-inflammatory cytokines, driving chronic inflammatory responses. This sustained inflammation within adipose tissue and other target organs further disrupts insulin signaling pathways, thereby exacerbating insulin resistance (171). However, the use of high concentrations of UA can lead to oxidative stress, potentially compromising cell viability (172).
Glucosamine (GlcN), a precursor of the hexosamine biosynthetic pathway, is known to induce insulin resistance in peripheral tissues and has been utilized extensively for this purpose both in vivo and in vitro (173, 174). The mechanism by which GlcN induces insulin resistance involves depletion of intracellular ATP, impairment of insulin signaling, and inhibition of GLUT4 translocation (175, 176). Typically, GlcN is employed at concentrations around 18 mM, with exposure durations ranging from 18 to 24 hours (110, 155). While GlcN-induced models are beneficial for investigating the metabolic effects of alterations in glucose metabolism in insulin resistance, it is important to note that the mechanisms underlying GlcN-induced insulin resistance do not entirely align with those induced by hyperglycemia. This is because the two differ in specific metabolic pathways and may not fully replicate the comprehensive pathophysiology of insulin resistance (176, 177).
3.3 Evaluation for insulin resistance
In pathological conditions, insulin resistance results in diminished glucose uptake and utilization. This is evident in the decreased glucose intake and glycogen synthesis, as well as the accelerated gluconeogenesis (6, 131). Consequently, phenotypic alterations linked to insulin resistance have been employed to assess insulin resistance models and have become the benchmark for evaluating the efficacy of anti-insulin resistance drugs. Here, we detail the prevalent methods used to evaluate insulin resistance.
3.3.1 Glucose uptake
It is widely recognized that in states of insulin resistance, glucose uptake or utilization in insulin-sensitive tissues such as the liver, muscle, or fat is markedly diminished in response to insulin stimulation. Therefore, the glucose uptake appears to be the “gold standard” for evaluation of insulin resistance or drug screening in vitro. In previous studies, two methodologies were employed to detect glucose uptake in vitro.
3.3.1.1 Glucose oxidase-peroxidase assay
The glucose oxidase-peroxidase (GOD-POD) assay is widely employed for determining cellular glucose uptake, which is based on Trinder reaction principle (178, 179). Briefly, glucose is converted to gluconic acid and hydrogen peroxide by glucose oxidase (GOD), followed by peroxidase (POD) catalyzing hydrogen peroxide and inducing the formation of quinone imines from the chromogenic material (4-aminoantipyrine). The color intensity of quinone imines is proportional to the glucose concentration, allowing for measurement and calculation via absorbance. As demonstrated in most previous studies, celluar glucose uptake can be calculated with a formula: the glucose uptake equals the difference between the glucose content of the detection solution and the residual glucose content in the medium (128, 180, 181). The GOD-POD assay is characterized by its simplicity and convenient operation, making it the convenient method for studying glucose uptake of cells.
3.3.1.2 Fluorescently labeled glucose
Fluorescently labeled glucose uptake assay, such as2-(N-(7-Nitrobenz-2-oxa-1,3-diazole-4-yl) amino)-2-deoxy-D-glucose (2-NBDG) fluorescently labeled glucose, enables direct monitoring of glucose uptake in living cells and tissue (182, 183). Published data delineate two categories of detection and evaluation methods for monitoring and assessing glucose uptake in cells. The distinction of these two methods lies in the presence or absence of insulin stimulation before measuring glucose uptake. As previous studies described, 100 nM insulin was used to induce IR in HepG2 cells, and in order to evaluate the model or anti-IR activity, a 2-NBDG assay was performed to detect glucose uptake following stimulation of the cells with 100 nM insulin for 30 min (184, 185). Another report introduced an identical method as described above, albeit without insulin stimulation. Instead, it directly detected cellular glucose uptake after exposing them to fluorescent-labeled glucose for 30min (186). Generally, 2NBDG glucose uptake assay is widely used in most studies due to its convenience. However, a recent study has found that the excess glucose nor pharmacological inhibition of GLUT1 impacted 2NBDG uptake in myeloma cells or primary splenocytes, suggesting the 2NBDG uptake in the cellular uptake of 2NBDG may not be a reliable measure of glucose transport, as it is facilitated by an unidentified mechanism (187). Notably, the generalizability of 2NBDG to other tissue cells and the defined mechanisms still need further investigation, which should also be addressed in future studies
In addition, with the development of interdisciplinary fields such as physics, chemistry, and biology, other fluorescent labeled glucose have been also introduced for determining glucose uptake, including FITC-labeled-glucose analog (188), near-infrared fluorescent glucose tracer (Glc-SiR-CO2H) (189), radiolabeled 3-O-methylglucose (190) etc. And these methodologies are referenced by evaluation system of 2-NBDG labeling as described above, and can proficiently oversee glucose uptake in living cells and provide monitoring images.
It is important to note that, according to published data, when it comes to investigating glucose uptake in insulin resistant cells, relative quantification methods are frequently used. The normalization for relative quantification can better reflect the overall glucose uptake of cells with or without treatment. For cell study, it is well-known that cell number or viability plays an important role in the evaluation of metabolic indexes in vitro, especially in studies of insulin resistance. However, this factor is not always clearly addressed in previous studies, leading to unnecessary misunderstandings of the results (191–193). As we described, the HCG, HCI, FFAs as well as inflammatory factors such as TNF-α, can impair cell viability and even cause apoptosis in various cell lines (145, 146, 194–196). Without doubt, the glucose uptake is positively correlated with cell number or viability. If the inducers (such as HCI, HCG and FFAs) cause a reduction or increase of cell number, the corresponding glucose uptake/consumption will also change. To eliminate the interference caused by cell apoptosis, the normalization of uptake ratio should be used to evaluate insulin resistance. It can be done using the formula to normalize glucose uptake as described (128, 141, 186): normalization glucose uptake=glucose uptake/cell viability (MTT, CCK8), as MTT or CCK8 can relatively reflect the condition of cells.
3.3.1.3 Radiolabeled glucose
Radiolabeled glucose uptake assays, such as [3H]-2-deoxy-D-glucose or 3-O-[Methyl-3H] glucose, have been used to study glucose metabolism in vivo at the molecular level (151, 190, 197–199). Radiolabeling with glucose analogues is the gold standard for measuring glucose uptake, with selectivity for tissue, high cellular uptake, affinity for glucose transporters, retention, and good interaction with hexokinase (200). These analogues are reliable tracers that enter cells through the same transport mechanisms as glucose (201). However, their radioactivity and procedural complexity limit their use, requiring careful experimental design and safety precautions.
3.3.2 GLUT4 translocation assay
GLUT4 is predominantly sequestered in intracellular GLUT4 storage vesicles (GSVs). Insulin initiates the brisk repositioning of GSVs from the trans-Golgi network (TGN) and/or endosomes to the plasma membrane (PM), where fusion occurs, thereby enhancing glucose uptake (202). Studies have shown that overexpression of GLUT4 could improve insulin resistance and insulin action in diabetic mice, indicating that GLUT4 translocation plays a crucial role in whole-body glucose homeostasis (203, 204). Currently, endogenous GLUT4 translocation has been used as an in vitro readout, and the widely used methods include immunofluorescence/immunoblotting (analysis of the extracted PM protein) (205, 206) and tracer assay. Among these methods, GLUT4 trafficking assays rely heavily on the overexpression of tagged GLUT4 (207–209). However, GLUT4 overexpression can alter insulin sensitivity and kinase activities in an insulin resistance context, which limits its use in studies involving genetic or pharmacological manipulation with endogenous GLUT4. Significantly, recent research has made significant strides in understanding the mechanisms of GLUT4 translocation and localization. Tucker’s team developed antibodies that target the external surface epitopes of endogenous GLUT4, providing a robust method for detecting and quantifying transport-competent endogenous GLUT4 in the PM (210). James’ laboratory established an imaging-based assay to evaluate endogenous GLUT4 trafficking in cultured murine and human adipocytes (211). This innovative approach offers a more precise depiction of the localization and behavior of endogenous GLUT4 with heightened sensitivity, making it more suitable for refining insulin resistance models that necessitate physiological intervention. Meanwhile, it overcomes the limitations of traditional assays that depend on the overexpression of GLUT4 reporter constructs, which may confer protection against insulin resistance and exhibit resistance to genetic perturbations and induced insulin resistance treatment (211).
3.3.3 Glycogen assay
In vivo, excessive glucose (after fully consumed by the body) can be converted into glycogen, which is stored in the liver and muscle cells as liver glycogen and muscle glycogen, respectively. Hepatic insulin resistance can increase the hepatic glucose production, decrease glycogen synthesis, and eventually raise blood glucose level (212, 213). Consequently, glycogen is used as an indicator for insulin resistance evaluation in liver and muscle cells in vitro, and the glycogen content in these cells can be directly measured using glycogen assay kits. For instance, one study explored the anti-insulin resistance activity of lrisin (a natural product) in 10 ng/ml TNF-α -induced HepG2 cells. The glycogen was detected after stimulating cells with 100 nM insulin, the reduction of glycogen in TNF-α-induced HepG2 and the increase of glycogen in lrisin-treated cells were used to evaluate insulin resistance model and anti-insulin resistance activity of lrisin, respectively (214). Moreover, Lei et al. induced insulin resistance in HepG2 cells by incubating them with 5000 nM insulin for 24h; subsequent glycogen content measurement revealed a significant decrease of glycogen synthesis in insulin resistance group (155). However, several studies have raised concerns about the reliability of glycogen content as a readout of insulin resistance. For example, it was found that, no obvious changes in the insulin-stimulated glycogen synthesis were exhibited by HepG2 cells, suggesting HepG2 cells may show a lack of sensitivity to the increase in glycogen synthesis induced by insulin stimulation (215). In adult skeletal muscle, it should be noted that, although there is no significant change in overall glycogen synthesis in response to insulin stimulation, the basal expression levels of key enzymes for glycogen synthesis, such as AKT and GSK3, are lower in L6 cells compared to C2C12 cells (66). These differences highlight the importance of considering cell type-specific factors when using glycogen as a readout for insulin resistance.
3.3.4 Lipolysis markers
Lipolysis, the process whereby triglycerides in adipocytes are metabolized into glycerol and FFAs, is integral to the physiological modulation of insulin resistance and insulin signaling, and it is hormonally regulated by catecholamines, glucagon and cortisol (216). These hormones can activate protein kinase A (PKA) in a cAMP dependent manner, subsequently stimulating key enzymes such as hormone-sensitive lipase, thereby promoting adipocyte lipid breakdown and leading to the release of FFA or glycerol into the bloodstream (217, 218). In metabolic disorders (including obesity and type 2 diabetes), adipose tissue frequently exhibits elevated basal lipolysis, which leads to chronically high FFA levels or ectopic lipid deposition, and further impairing insulin signaling both in the liver and skeletal muscle (219). The accumulation of FFAs and their subsequent metabolites, such as diacylglycerol and ceramides, can inhibit IRS and disrupt the PI3K/Akt signaling pathway via activating protein kinase C (PKC), ultimately reducing insulin-mediated glucose uptake (220, 221). Therefore, numerous recent studies have employed lipolysis markers as the readouts of insulin sensitivity (218, 222–224). For example, Zhao et al. reported that metformin and resveratrol inhibit hypoxia-induced lipolysis by preserving PDE3B activity and blocking the cAMP/PKA/HSL signaling pathway, which prevents muscle insulin resistance by decreasing DAG deposition and suppressing PKCθ activation (222). Similarly, Jiang et al. showed that Astragaloside IV ameliorates insulin resistance in TNF-α-induced 3T3L1 adipocytes by dose-dependently suppressing lipolysis (224). In addition, lipolysis activity can be quantified by measuring the release of glycerol into the medium. Briefly, samples are cultured under conditions that regulate lipolysis, such as exposure to isoproterenol or insulin. The released glycerol is then quantified using either colorimetric or fluorescent detection methods (225).
Nevertheless, a recent clinical study suggests that lipolysis does not invariably impair insulin signaling, because the FFAs produced in response to metabolic demands can serve as crucial energy sources (220). Moreover, tissue sensitivity to the accumulation of FFAs is not entirely same certain tissues are more vulnerable to the detrimental effects of FFAs, whereas others demonstrate a higher tolerance (226). Although inhibition of lipolysis shows a beneficial effect on improving insulin sensitivity, excessive suppression of lipolysis could potentially disrupt metabolic homeostasis due to inadequate energy supply (219). Overall, strategies aimed at managing insulin resistance through lipolysis necessitate a nuanced approach that considers both systemic and localized metabolic effects.
3.3.5 protein synthesis
There is no doubt that protein synthesis significantly contributes to the physiological modulation of insulin signaling and insulin resistance. Under normal insulin signaling conditions, activation of the insulin receptor triggers the IRS and PI3K-AKT signaling pathways, which facilitates glucose uptake, glycogen synthesis and protein synthesis (118). While in pathological conditions such as type 2 diabetes and hyperinsulinemia, chronic high insulin levels can lead to excessive mechanistic target of rapamycin complex 1 (mTORC1) activation, thereby increasing the burden of protein synthesis, disrupting ER homeostasis, as well as triggering the unfolded protein response. Initially, unfolded protein response (UPR) functions as a protective mechanism via suppressing protein synthesis to alleviate ER stress. However, persistent activation causes ER dysfunction and further exacerbates insulin resistance (227). Evidence have indicated that pretreating cells with protein synthesis inhibitors (such as cycloheximide), can alleviate insulin resistance caused by glucocorticoids (dexamethasone) or high-glucose environments, suggesting the significant role of protein synthesis load in insulin sensitivity (228). In recent years, the measurement of protein synthesis has been performed in studies associated with insulin resistance (229–231). Gao et al. found that major urinary protein 1 (MUP1) alleviates chemically induced ER stress and subsequent insulin resistance by inhibiting protein synthesis (232). Similarly, Marshall et al. demonstrated that the inhibition of mRNA synthesis with actinomycin D or 5,6-dichloro-1-beta-D-ribofuranosylbenzimidazole (DRB) fully protects adipocytes from glucose-induced insulin resistance (233). Methodologically, the quantitative protein synthesis can be assessed using experiments such as the [3H]-leucine incorporation assay. In this process, cells are incubated with radiolabelled leucine, followed by the precipitation of the protein and the removal of any unincorporated leucine. Subsequently, the degree to which the leucine has been incorporated into the newly synthesized protein is then quantified (225).
Nevertheless, the regulation of protein synthesis has a relatively limited impact on other components of the insulin signaling pathway, such as the expression and trafficking of IRS-1 or the GLUT4 transporter protein (234). This specificity can be also observed under high insulin concentrations, where protein synthesis is stimulated but has a minimal effect on glucose transporter proteins, leading to reduced insulin sensitivity rather than generalized insulin resistance (228, 230). Moreover, mRNA synthesis inhibitors (such as actinomycin D) partially prevent glucocorticoid-induced desensitization of the glucose transport system by inhibiting short-lived protein synthesis but do not significantly affect overall insulin responsiveness (235). Therefore, although protein synthesis regulation shows a beneficial role in alleviating ER burden and modulating insulin sensitivity, it fails to reflect a comprehensive state of cellular insulin resistance (232, 236).
3.3.6 Insulin signal pathway indicators
Abnormalities within the insulin signaling pathway represent both the cause and consequence of insulin resistance. The functionality of this pathway is reflected in the expression levels and activities of its key components, including the insulin receptor, IRS, glucose transporters, and other associated signaling molecules. In particular, the phosphorylated status and activation of IRS downstream regulators are crucial indicators of pathway engagement and response to insulin stimulation (132, 237). Key signaling molecules in the canonical insulin signaling pathway, from the receptor to downstream effectors involved in glucose uptake, inhibition of lipolysis, protein synthesis and glycogen synthesis, include the insulin receptor, IRS, PI3K, AKT, and GLUT4 transporters (50, 51). The canonical insulin signaling pathway has been shown in Figure 2. The activation of these nodes is often assessed by phosphorylation of specific sites (such as IRS1 Ser 307, AKT Thr 308, and Ser 473), which are essential markers of pathway engagement upon insulin stimulation (237, 238).
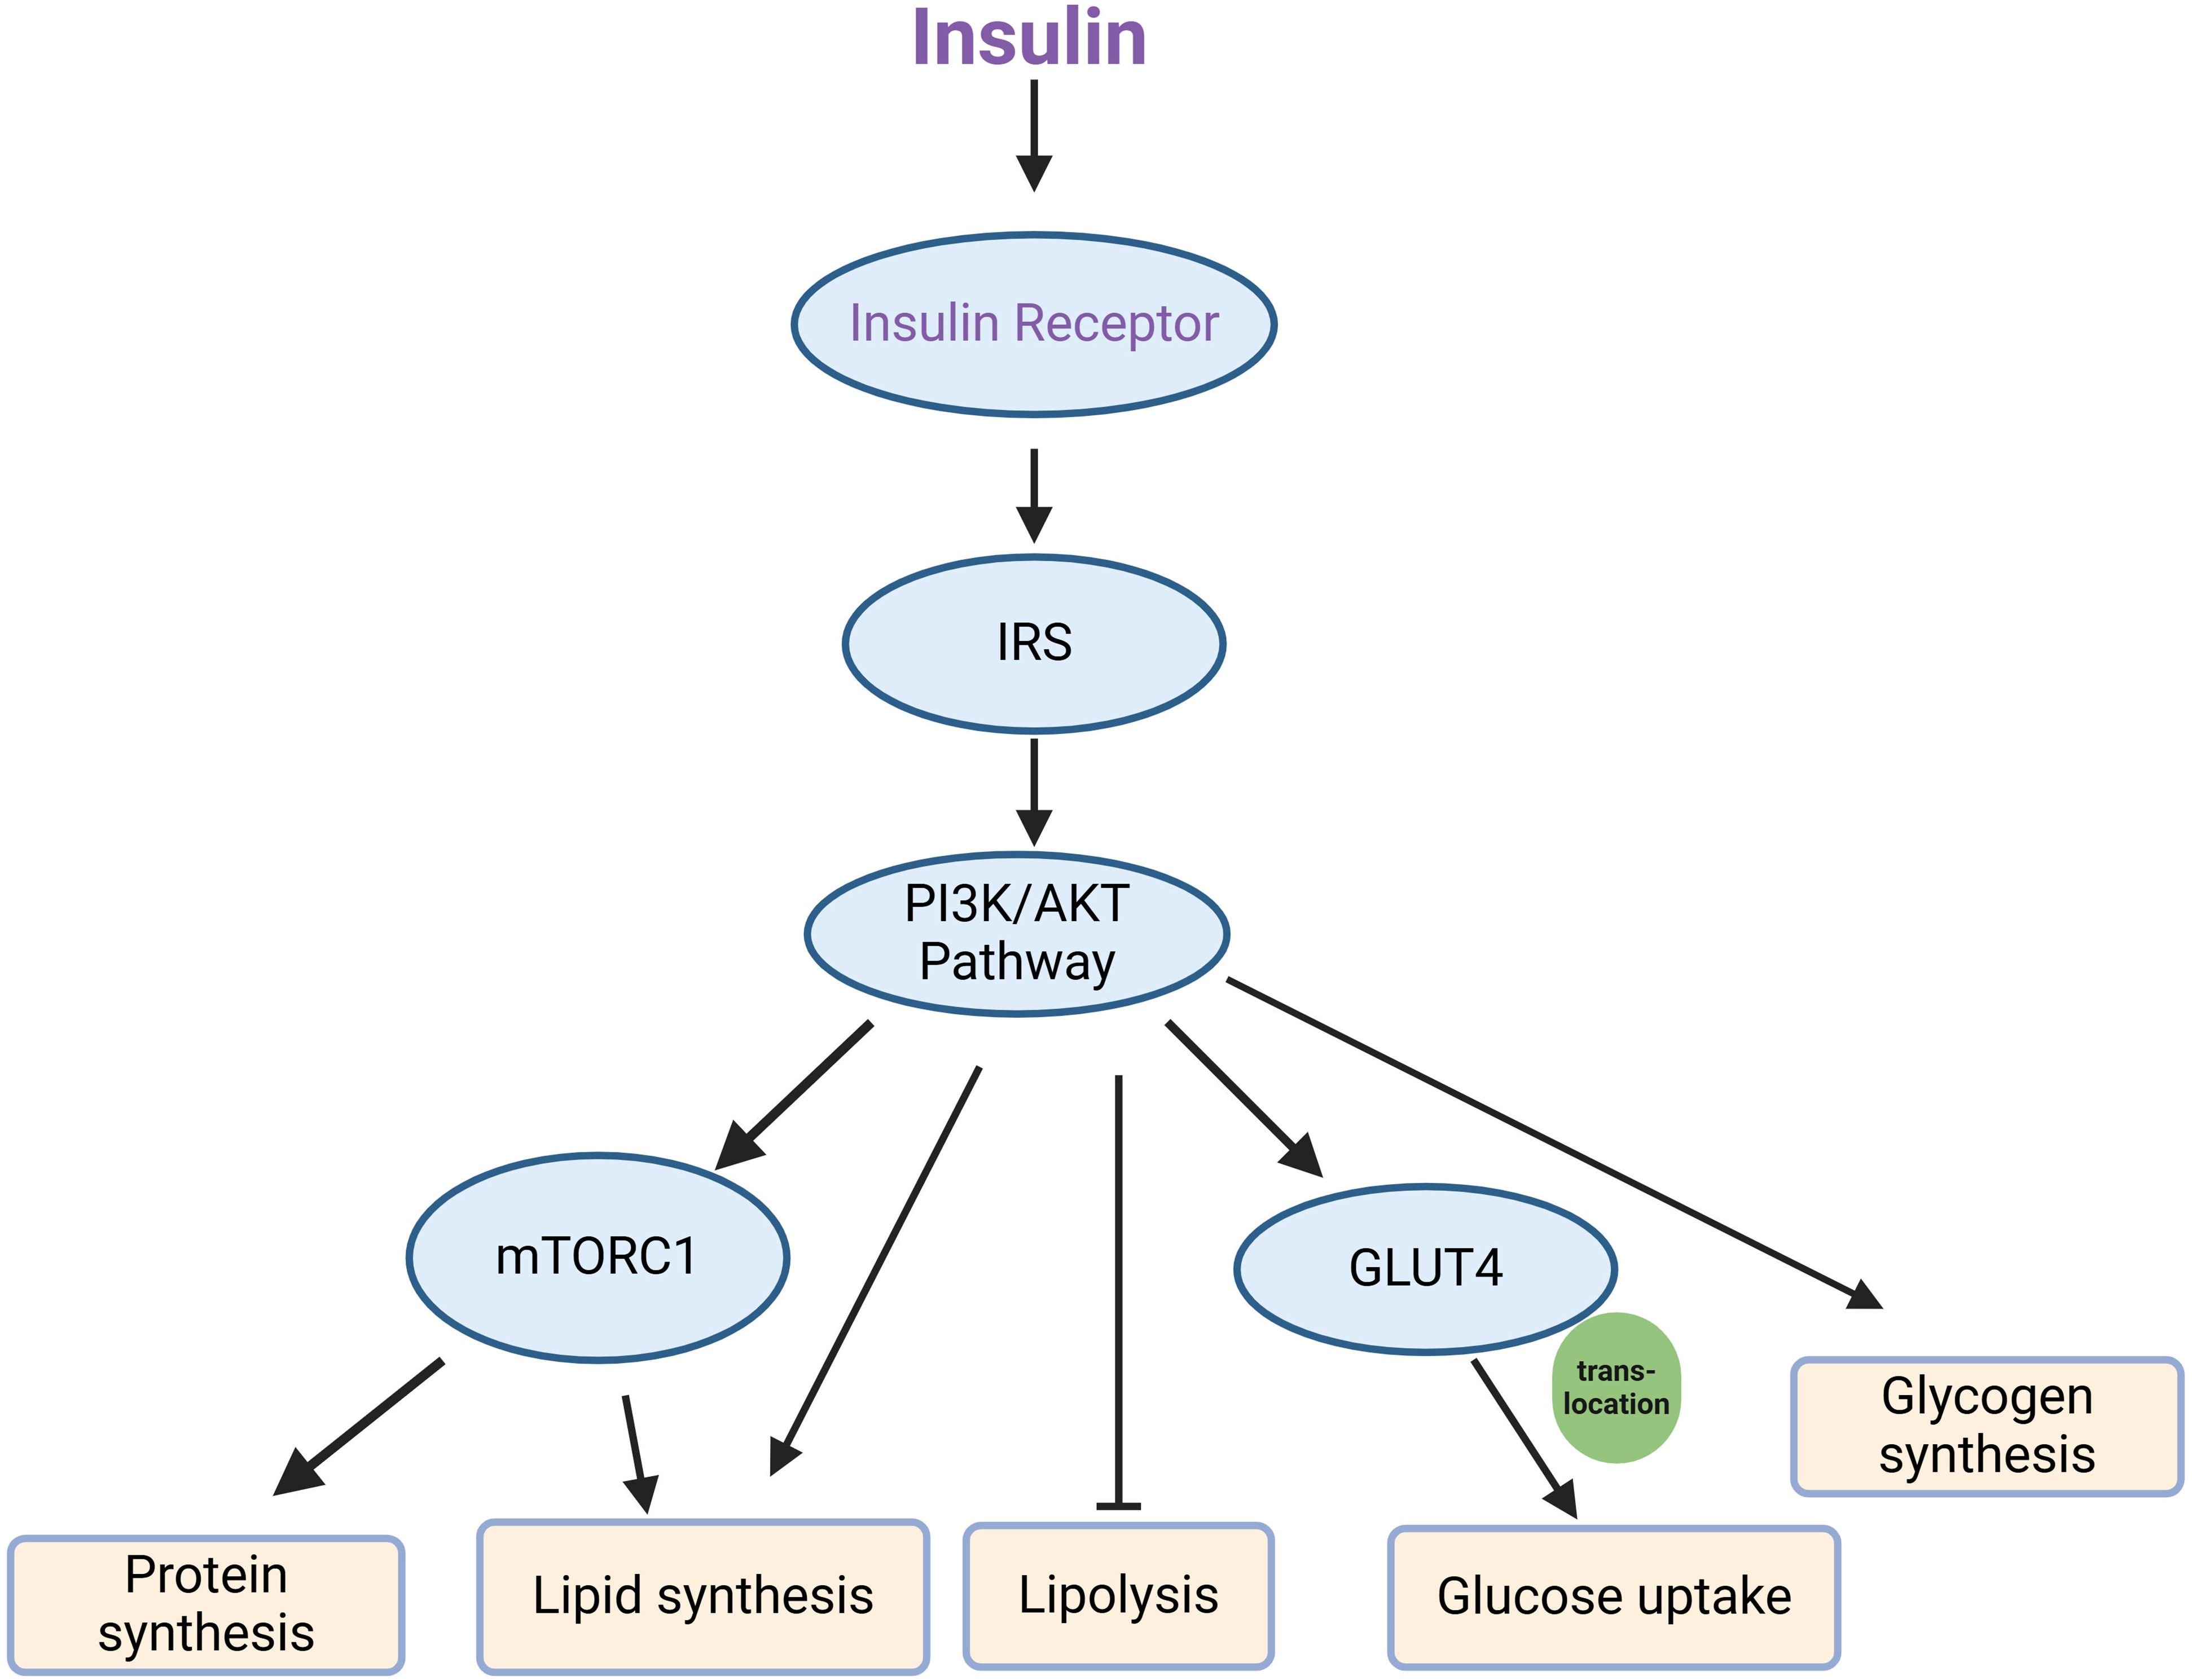
Figure 2. Key components of the canonical insulin signaling pathway. Upon insulin binding, the insulin receptor is activated, leading to the phosphorylation of IRS (insulin receptor substrate), which then engages the PI3K/AKT signaling pathway. This pathway subsequently activates several downstream effectors, including mTORC1 and GLUT4. mTORC1 mediates processes such as protein synthesis and lipid synthesis, while also inhibiting lipolysis. Simultaneously, GLUT4 translocates to the cell membrane, facilitating glucose uptake, and the pathway promotes glycogen synthesis.
However, relying solely on the detection of these molecular markers as indicators of insulin resistance, often assessed through western blot or qRT-PCR analysis, may not always be rigorous. Some studies on mechanisms of drug action measured the expression levels of these proteins but failed to evaluate more direct indicators of insulin resistance, such as glucose tolerance or insulin-stimulated glucose uptake. Thus, a more comprehensive assessment is need to accurately reflect the presence and severity of insulin resistance (239, 240).
There is also an ongoing discussion about defective signaling in insulin resistance, especially regarding receptor availability and pathway redundancy. The “spare receptor hypothesis” suggests that, in some insulin-resistant phenotypes, partial signaling through the available receptors may suffice for certain metabolic responses, even when phosphorylation of key signaling nodes is reduced (132, 241). This hypothesis suggests that not all insulin-resistant phenotypes can be attributed solely to diminished phosphorylation of critical signaling components, and that additional approaches to assess insulin sensitivity that go beyond phosphorylation status are nedded.
4 Conclusion
Cell culture, a fundamental tool in modern biological sciences, provides a crucial platform for exploring biological processes. It has been pivotal in studying the pathogenesis of diabetes and insulin resistance, as well as in identifying potential therapeutic interventions for these conditions. Therefore, the development and assessment of insulin resistance cell models are paramount, particularly for preliminary screening of anti-insulin resistance agents. Through comprehensive investigation and reflection, we recommend that several factors and details be carefully considered during the experimental process, including the main selection of cell lines, induction methods and evaluation metrics for insulin resistance (show in Table 1). Such considerations will ultimately aid in the clinical diagnosis and treatment of diseases linked to insulin resistance.
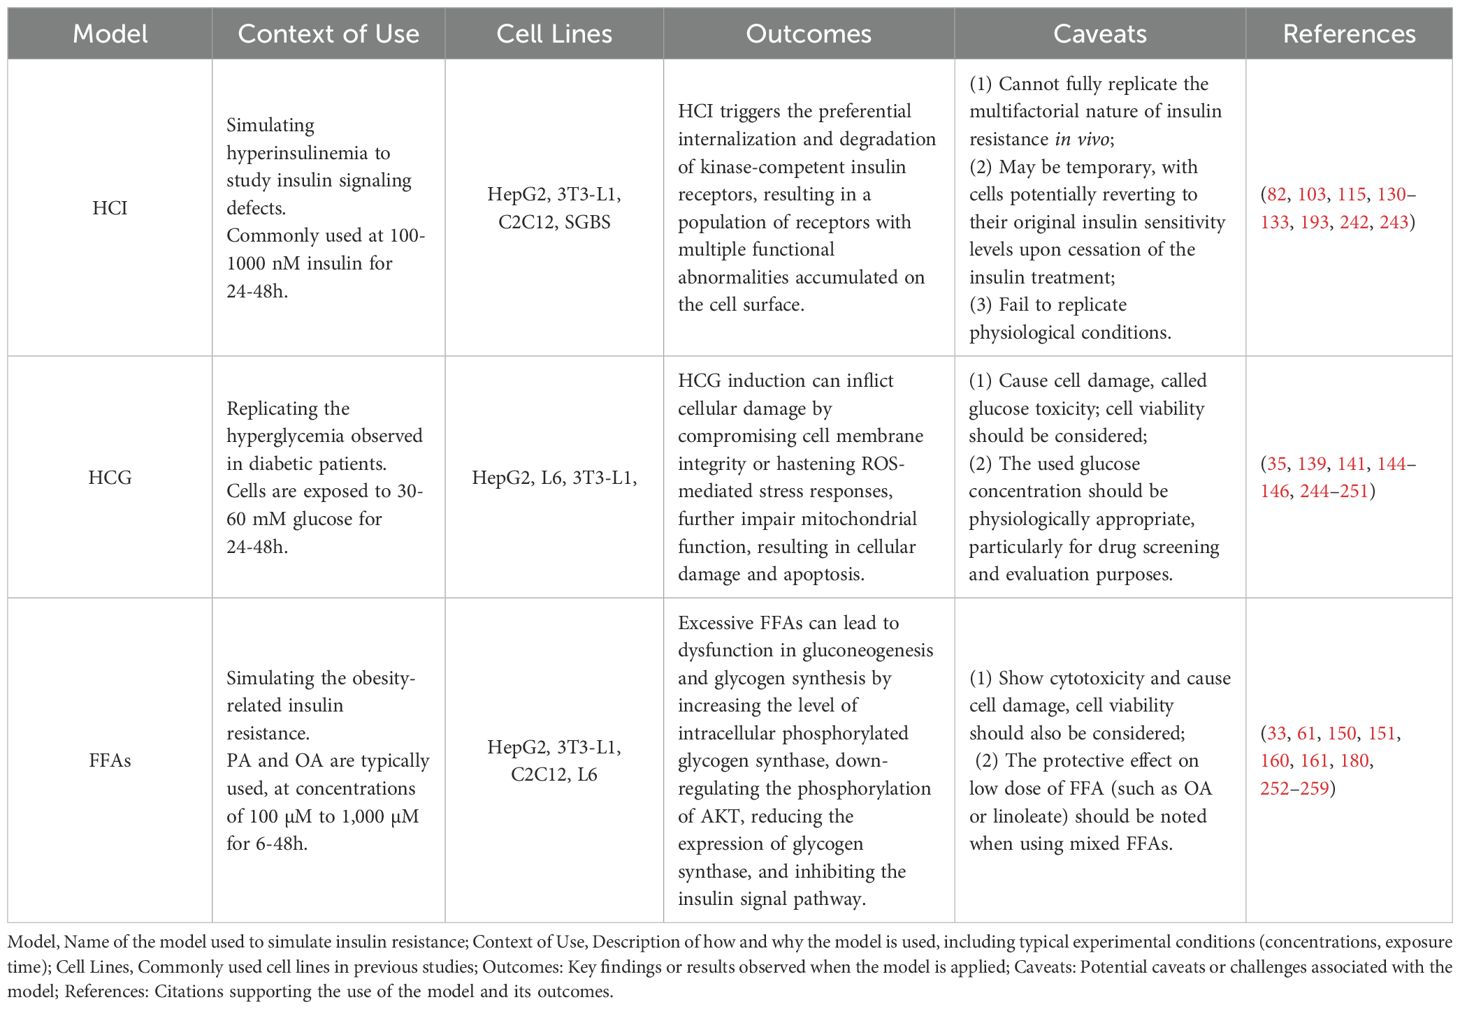
Table 1. Information of the representative methods for in vitro insulin resistance cell model.
Author contributions
YY: Data curation, Writing – original draft. TW: Data curation, Writing – original draft, Writing – review & editing. HX: Data curation, Writing – original draft. PH: Data curation, Writing – original draft. PL: Funding acquisition, Writing – original draft, Writing – review & editing.
Funding
The author(s) declare financial support was received for the research, authorship, and/or publication of this article. This work was supported by National Natural Science Foundation of China (Grant No. 82104469), Natural Science Foundation of Chongqing (NO. cstc2021jcyj-bshX0161) and Scientific and Technological Research Program of Chongqing Municipal Education Commission (KJQN202100417).
Conflict of interest
The authors declare that the research was conducted in the absence of any commercial or financial relationships that could be construed as a potential conflict of interest.
Publisher’s note
All claims expressed in this article are solely those of the authors and do not necessarily represent those of their affiliated organizations, or those of the publisher, the editors and the reviewers. Any product that may be evaluated in this article, or claim that may be made by its manufacturer, is not guaranteed or endorsed by the publisher.
References
1. James DE, Stockli J, Birnbaum MJ. The aetiology and molecular landscape of insulin resistance. Nat Rev Mol Cell Biol. (2021) 22:751–71. doi: 10.1038/s41580-021-00390-6
2. Gallagher EJ, Leroith D, Karnieli E. Insulin resistance in obesity as the underlying cause for the metabolic syndrome. Mt Sinai J Med. (2010) 77:511–23. doi: 10.1002/msj.20212
3. Batista TM, Haider N, Kahn CR. Defining the underlying defect in insulin action in type 2 diabetes. Diabetologia. (2021) 64:994–1006. doi: 10.1007/s00125-021-05415-5
4. Klip A, McGraw TE, James DE. Thirty sweet years of GLUT4. J Biol Chem. (2019) 294:11369–81. doi: 10.1074/jbc.REV119.008351
5. Czech MP. Mechanisms of insulin resistance related to white, beige, and brown adipocytes. Mol Metab. (2020) 34:27–42. doi: 10.1016/j.molmet.2019.12.014
6. Lebovitz HE. Insulin resistance: definition and consequences. Exp Clin Endocrinol Diabetes. (2001) 109 Suppl 2:S135–48. doi: 10.1055/s-2001-18576
7. Brown AE, Walker M. Genetics of insulin resistance and the metabolic syndrome. Curr Cardiol Rep. (2016) 18:75. doi: 10.1007/s11886-016-0755-4
8. Volaco A, Cavalcanti AM, Filho RP, Precoma DB. Socioeconomic status: the missing link between obesity and diabetes mellitus? Curr Diabetes Rev. (2018) 14:321–26. doi: 10.2174/1573399813666170621123227
9. Toledo FG, Goodpaster BH. The role of weight loss and exercise in correcting skeletal muscle mitochondrial abnormalities in obesity, diabetes and aging. Mol Cell Endocrinol. (2013) 379:30–4. doi: 10.1016/j.mce.2013.06.018
10. Carmichael L, Keske MA, Betik AC, Parker L, Brayner B, Roberts-Thomson KM, et al. Is vascular insulin resistance an early step in diet-induced whole-body insulin resistance? Nutr Diabetes. (2022) 12:31. doi: 10.1038/s41387-022-00209-z
11. Papakonstantinou E, Oikonomou C, Nychas G, Dimitriadis GD. Effects of diet, lifestyle, chrononutrition and alternative dietary interventions on postprandial glycemia and insulin resistance. Nutrients. (2022) 14. doi: 10.3390/nu14040823
12. Harrison S, Couture P, Lamarche B. Diet quality, saturated fat and metabolic syndrome. Nutrients. (2020) 12. doi: 10.3390/nu12113232
13. Yaribeygi H, Farrokhi FR, Butler AE, Sahebkar A. Insulin resistance: Review of the underlying molecular mechanisms. J Cell Physiol. (2019) 234:8152–61. doi: 10.1002/jcp.27603
14. Li T, Ling J, Du X, Zhang S, Yang Y, Zhang L. Exploring the underlying mechanisms of fisetin in the treatment of hepatic insulin resistance via network pharmacology and in vitro validation. Nutr Metab (Lond). (2023) 20:51. doi: 10.1186/s12986-023-00770-z
15. Diaz-Vegas A, Madsen S, Cooke KC, Carroll L, Khor J, Turner N, et al. Mitochondrial electron transport chain, ceramide, and coenzyme Q are linked in a pathway that drives insulin resistance in skeletal muscle. Elife. (2023) 12. doi: 10.7554/eLife.87340
16. Ye J. Mechanisms of insulin resistance in obesity. Front Med. (2013) 7:14–24. doi: 10.1007/s11684-013-0262-6
17. Halle M, Berg A, Northoff H, Keul J. Importance of TNF-alpha and leptin in obesity and insulin resistance: a hypothesis on the impact of physical exercise. Exerc Immunol Rev. (1998) 4:77–94.
18. Fazakerley DJ, Minard AY, Krycer JR, Thomas KC, Stockli J, Harney DJ, et al. Mitochondrial oxidative stress causes insulin resistance without disrupting oxidative phosphorylation. J Biol Chem. (2018) 293:7315–28. doi: 10.1074/jbc.RA117.001254
19. Fazakerley DJ, Chaudhuri R, Yang P, Maghzal GJ, Thomas KC, Krycer JR, et al. Mitochondrial CoQ deficiency is a common driver of mitochondrial oxidants and insulin resistance. Elife. (2018) 7. doi: 10.7554/eLife.32111
20. Andoh A, Nishida A, Takahashi K, Inatomi O, Imaeda H, Bamba S, et al. Comparison of the gut microbial community between obese and lean peoples using 16S gene sequencing in a Japanese population. J Clin Biochem Nutr. (2016) 59:65–70. doi: 10.3164/jcbn.15-152
21. Li M, Chi X, Wang Y, Setrerrahmane S, Xie W, Xu H. Trends in insulin resistance: insights into mechanisms and therapeutic strategy. Signal Transduct Target Ther. (2022) 7:216. doi: 10.1038/s41392-022-01073-0
22. Wang Z, Bai Z, Yan J, Liu T, Li Y, Xu J, et al. Anti-diabetic effects of linarin from Chrysanthemi Indici Flos via AMPK activation. Chin Herb Med. (2022) 14:97–103. doi: 10.1016/j.chmed.2021.11.002
23. Miao L, Zhang X, Zhang H, Cheong MS, Chen X, Farag MA, et al. Baicalin ameliorates insulin resistance and regulates hepatic glucose metabolism via activating insulin signaling pathway in obese pre-diabetic mice. Phytomedicine. (2024) 124:155296. doi: 10.1016/j.phymed.2023.155296
24. Bao S, Wang X, Ma Q, Wei C, Nan J, Ao W. Mongolian medicine in treating type 2 diabetes mellitus combined with nonalcoholic fatty liver disease via FXR/LXR-mediated P2X7R/NLRP3/NF-kappaB pathway activation. Chin Herb Med. (2022) 14:367–75. doi: 10.1016/j.chmed.2022.06.003
25. Arzumanian VA, Kiseleva OI, Poverennaya EV. The curious case of the hepG2 cell line: 40 years of expertise. Int J Mol Sci. (2021) 22. doi: 10.3390/ijms222313135
26. Molinaro A, Becattini B, Solinas G. Insulin signaling and glucose metabolism in different hepatoma cell lines deviate from hepatocyte physiology toward a convergent aberrant phenotype. Sci Rep. (2020) 10:12031. doi: 10.1038/s41598-020-68721-9
27. Lu L, Ye X, Yao Q, Lu A, Zhao Z, Ding Y, et al. Egr2 enhances insulin resistance via JAK2/STAT3/SOCS-1 pathway in HepG2 cells treated with palmitate. Gen Comp Endocrinol. (2018) 260:25–31. doi: 10.1016/j.ygcen.2017.08.023
28. Li K, Zhang K, Wang H, Wu Y, Chen N, Chen J, et al. Hrd1-mediated ACLY ubiquitination alleviate NAFLD in db/db mice. Metabolism. (2021) 114:154349. doi: 10.1016/j.metabol.2020.154349
29. Yu X, Tao J, Wu Y, Chen Y, Li P, Yang F, et al. Deficiency of ASGR1 alleviates diet-induced systemic insulin resistance via improved hepatic insulin sensitivity. Diabetes Metab J. (2024) 48:802–15. doi: 10.4093/dmj.2023.0124
30. Yang S, Cao SJ, Li CY, Zhang Q, Zhang BL, Qiu F, et al. Berberine directly targets AKR1B10 protein to modulate lipid and glucose metabolism disorders in NAFLD. J Ethnopharmacol. (2024) 332:118354. doi: 10.1016/j.jep.2024.118354
31. Yang Y, Qiu W, Xiao J, Sun J, Ren X, Jiang L. Dihydromyricetin ameliorates hepatic steatosis and insulin resistance via AMPK/PGC-1alpha and PPARalpha-mediated autophagy pathway. J Transl Med. (2024) 22:309. doi: 10.1186/s12967-024-05060-7
32. Xiaomei YE, Xiaowei X, Kangrui Y, Dongming W, Dudu WU, Zhi C, et al. Astragaloside IV ameliorates insulin induced insulin resistance in HepG2 cells through reactive oxygen species mediated c-Jun N-terminal kinase pathway. J Tradit Chin Med. (2023) 43:60–7. doi: 10.19852/j.cnki.jtcm.2023.01.007
33. Zhao H, Zhai BW, Zhang MY, Huang H, Zhu HL, Yang H, et al. Phlorizin from Lithocarpus litseifolius [Hance] Chun ameliorates FFA-induced insulin resistance by regulating AMPK/PI3K/AKT signaling pathway. Phytomedicine. (2024) 130:155743. doi: 10.1016/j.phymed.2024.155743
34. Gao J, Zhang M, Zu X, Gu X, Hao E, Hou X, et al. Glucuronic acid metabolites of phenolic acids target AKT-PH domain to improve glucose metabolism. Chin Herb Med. (2023) 15:398–406. doi: 10.1016/j.chmed.2022.11.005
35. Ding X, Jian T, Wu Y, Zuo Y, Li J, Lv H, et al. Ellagic acid ameliorates oxidative stress and insulin resistance in high glucose-treated HepG2 cells via miR-223/keap1-Nrf2 pathway. BioMed Pharmacother. (2019) 110:85–94. doi: 10.1016/j.biopha.2018.11.018
36. Cui H, Gao Q, Zhang L, Han F, Wang L. Knockdown of FOXK1 suppresses liver cancer cell viability by inhibiting glycolysis. Life Sci. (2018) 213:66–73. doi: 10.1016/j.lfs.2018.10.018
37. Chen J, Zaidi S, Rao S, Chen JS, Phan L, Farci P, et al. Analysis of genomes and transcriptomes of hepatocellular carcinomas identifies mutations and gene expression changes in the transforming growth factor-beta pathway. Gastroenterology. (2018) 154:195–210. doi: 10.1053/j.gastro.2017.09.007
38. Chen J, Gingold JA, Su X. Immunomodulatory TGF-beta signaling in hepatocellular carcinoma. Trends Mol Med. (2019) 25:1010–23. doi: 10.1016/j.molmed.2019.06.007
39. Guengerich FP. Cytochrome P450 research and the journal of biological chemistry. J Biol Chem. (2019) 294:1671–80. doi: 10.1074/jbc.TM118.004144
41. Stanley LA, Wolf CR. Through a glass, darkly? HepaRG and HepG2 cells as models of human phase I drug metabolism. Drug Metab Rev. (2022) 54:46–62. doi: 10.1080/03602532.2022.2039688
42. Wan XD, Yang WB, Xia YZ, Wang JF, Lu T, Wang XM. Disruption of glucose homeostasis and induction of insulin resistance by elevated free fatty acids in human L02 hepatocytes. J Endocrinol Invest. (2009) 32:454–59. doi: 10.1007/BF03346485
43. Hu X, Yang T, Li C, Zhang L, Li M, Huang W, et al. Human fetal hepatocyte line, L-02, exhibits good liver function in vitro and in an acute liver failure model. Transplant Proc. (2013) 45:695–700. doi: 10.1016/j.transproceed.2012.09.121
44. Wu Y, Geng XC, Wang JF, Miao YF, Lu YL, Li B. The HepaRG cell line, a superior in vitro model to L-02, HepG2 and hiHeps cell lines for assessing drug-induced liver injury. Cell Biol Toxicol. (2016) 32:37–59. doi: 10.1007/s10565-016-9316-2
45. Geng S, Wang S, Zhu W, Xie C, Li X, Wu J, et al. Curcumin suppresses JNK pathway to attenuate BPA-induced insulin resistance in LO2 cells. BioMed Pharmacother. (2018) 97:1538–43. doi: 10.1016/j.biopha.2017.11.069
46. Fang H, Feng Q, Shi Y, Zhou J, Wang Q, Zhong L. Hepatic insulin resistance induced by mitochondrial oxidative stress can be ameliorated by sphingosine 1-phosphate. Mol Cell Endocrinol. (2020) 501:110660. doi: 10.1016/j.mce.2019.110660
47. Yu W, Fan L, Wang M, Cao B, Hu X. Pterostilbene improves insulin resistance caused by advanced glycation end products (AGEs) in hepatocytes and mice. Mol Nutr Food Res. (2021) 65:e2100321. doi: 10.1002/mnfr.202100321
48. Wu C, Qiu T, Yuan W, Shi Y, Yao X, Jiang L, et al. Annexin A1 inhibition facilitates NLRP3 inflammasome activation in arsenic-induced insulin resistance in rat liver. Environ Toxicol Pharmacol. (2022) 96:103981. doi: 10.1016/j.etap.2022.103981
49. Liu F, Zhu S, Ni L, Huang L, Wang K, Zhou Y. Dexmedetomidine alleviates insulin resistance in hepatocytes by reducing endoplasmic reticulum stress. Endocrine. (2020) 67:87–94. doi: 10.1007/s12020-019-02118-1
50. Yu Q, Liu Y, Wu Y, Chen Y. Dihydrocurcumin ameliorates the lipid accumulation, oxidative stress and insulin resistance in oleic acid-induced L02 and HepG2 cells. BioMed Pharmacother. (2018) 103:1327–36. doi: 10.1016/j.biopha.2018.04.143
51. Wan X, Xu C, Lin Y, Lu C, Li D, Sang J, et al. Uric acid regulates hepatic steatosis and insulin resistance through the NLRP3 inflammasome-dependent mechanism. J Hepatol. (2016) 64:925–32. doi: 10.1016/j.jhep.2015.11.022
52. Lu P, Chen X, Zhang Z, Zhang J, Yang Y, Liu Z, et al. Insulin upregulates betatrophin expression via PI3K/Akt pathway. Sci Rep. (2017) 7:5594. doi: 10.1038/s41598-017-06052-y
53. Vilas-Boas V, Cooreman A, Gijbels E, Van Campenhout R, Gustafson E, Ballet S, et al. Primary hepatocytes and their cultures for the testing of drug-induced liver injury. Adv Pharmacol. (2019) 85:1–30. doi: 10.1016/bs.apha.2018.08.001
54. Ramboer E, De Craene B, De Kock J, Vanhaecke T, Berx G, Rogiers V, et al. Strategies for immortalization of primary hepatocytes. J Hepatol. (2014) 61:925–43. doi: 10.1016/j.jhep.2014.05.046
55. Guillouzo A. Liver cell models in in vitro toxicology. Environ Health Perspect. (1998) 106 Suppl 2:511–32. doi: 10.1289/ehp.98106511
56. Gomez-Lechon MJ, Donato MT, Castell JV, Jover R. Human hepatocytes in primary culture: the choice to investigate drug metabolism in man. Curr Drug Metab. (2004) 5:443–62. doi: 10.2174/1389200043335414
57. Jung IR, Ahima RS, Kim SF. Inositol polyphosphate multikinase modulates free fatty acids-induced insulin resistance in primary mouse hepatocytes. J Cell Biochem. (2023) 124:1695–704. doi: 10.1002/jcb.30478
58. Li P, Oh DY, Bandyopadhyay G, Lagakos WS, Talukdar S, Osborn O, et al. LTB4 promotes insulin resistance in obese mice by acting on macrophages, hepatocytes and myocytes. Nat Med. (2015) 21:239–47. doi: 10.1038/nm.3800
59. Tian L, Zeng K, Shao W, Yang BB, Fantus IG, Weng J, et al. Short-term curcumin gavage sensitizes insulin signaling in dexamethasone-treated C57BL/6 mice. J Nutr. (2015) 145:2300–07. doi: 10.3945/jn.115.216853
60. Wong CY, Al-Salami H, Dass CR. C2C12 cell model: its role in understanding of insulin resistance at the molecular level and pharmaceutical development at the preclinical stage. J Pharm Pharmacol. (2020) 72:1667–93. doi: 10.1111/jphp.13359
61. Zhang Q, Kong X, Yuan H, Guan H, Li Y, Niu Y. Mangiferin improved palmitate-induced-insulin resistance by promoting free fatty acid metabolism in hepG2 and C2C12 cells via PPARalpha: mangiferin improved insulin resistance. J Diabetes Res. (2019) 2019:2052675. doi: 10.1155/2019/2052675
62. Pan X, Liu C, Wang X, Zhao M, Zhang Z, Zhang X, et al. Resveratrol improves palmitic acid−induced insulin resistance via the DDIT4/mTOR pathway in C2C12 cells. Mol Med Rep. (2023) 28. doi: 10.3892/mmr.2023.13068
63. Huang S, Huang S, Wang X, Zhang Q, Liu J, Leng Y. Downregulation of lipin-1 induces insulin resistance by increasing intracellular ceramide accumulation in C2C12 myotubes. Int J Biol Sci. (2017) 13:1–12. doi: 10.7150/ijbs.17149
64. Ariga M, Nedachi T, Katagiri H, Kanzaki M. Functional role of sortilin in myogenesis and development of insulin-responsive glucose transport system in C2C12 myocytes. J Biol Chem. (2008) 283:10208–20. doi: 10.1074/jbc.M710604200
65. Al-Khalili L, Chibalin AV, Kannisto K, Zhang BB, Permert J, Holman GD, et al. Insulin action in cultured human skeletal muscle cells during differentiation: assessment of cell surface GLUT4 and GLUT1 content. Cell Mol Life Sci. (2003) 60:991–98. doi: 10.1007/s00018-003-3001-3
66. Abdelmoez AM, Sardon PL, Smith J, Gabriel BM, Savikj M, Dollet L, et al. Comparative profiling of skeletal muscle models reveals heterogeneity of transcriptome and metabolism. Am J Physiol Cell Physiol. (2020) 318:C615–26. doi: 10.1152/ajpcell.00540.2019
67. Liang R, Dong W, Shen X, Peng X, Aceves AG, Liu Y. Modeling myotonic dystrophy 1 in C2C12 myoblast cells. J Vis Exp. (2016). doi: 10.3791/54078
68. Aas V, Bakke SS, Feng YZ, Kase ET, Jensen J, Bajpeyi S, et al. Are cultured human myotubes far from home? Cell Tissue Res. (2013) 354:671–82. doi: 10.1007/s00441-013-1655-1
69. Beguinot F, Kahn CR, Moses AC, Smith RJ. The development of insulin receptors and responsiveness is an early marker of differentiation in the muscle cell line L6. Endocrinology. (1986) 118:446–55. doi: 10.1210/endo-118-1-446
70. Xie F, Zhu J, Hou B, Wang Y, Meng F, Ren Z, et al. (2017) 64:685–93. doi: 10.1507/endocrj.EJ17-0012
71. Park JE, Han JS. A bioactive component of Portulaca Oleracea L. HM-chromanone improves palmitate-induced insulin resistance by inhibiting mTOR/S6K1 through activation AMPK pathway L6 Skeletal Muscle Cells Toxicol Res (Camb). (2022) 11:774–83. doi: 10.1093/toxres/tfac055
72. Wu W, Tang S, Shi J, Yin W, Cao S, Bu R, et al. Metformin attenuates palmitic acid-induced insulin resistance in L6 cells through the AMP-activated protein kinase/sterol regulatory element-binding protein-1c pathway. Int J Mol Med. (2015) 35:1734–40. doi: 10.3892/ijmm.2015.2187
73. Ojuka EO. Role of calcium and AMP kinase in the regulation of mitochondrial biogenesis and GLUT4 levels in muscle. Proc Nutr Soc. (2004) 63:275–78. doi: 10.1079/PNS2004339
74. Fazakerley DJ, Holman GD, Marley A, James DE, Stockli J, Coster AC. Kinetic evidence for unique regulation of GLUT4 trafficking by insulin and AMP-activated protein kinase activators in L6 myotubes. J Biol Chem. (2010) 285:1653–60. doi: 10.1074/jbc.M109.051185
75. Coen PM, Dube JJ, Amati F, Stefanovic-Racic M, Ferrell RE, Toledo FG, et al. Insulin resistance is associated with higher intramyocellular triglycerides in type I but not type II myocytes concomitant with higher ceramide content. Diabetes. (2010) 59:80–8. doi: 10.2337/db09-0988
76. Bajpeyi S, Myrland CK, Covington JD, Obanda D, Cefalu WT, Smith SR, et al. Lipid in skeletal muscle myotubes is associated to the donors' insulin sensitivity and physical activity phenotypes. Obes (Silver Spring). (2014) 22:426–34. doi: 10.1002/oby.20556
77. Mahfouz R, Khoury R, Blachnio-Zabielska A, Turban S, Loiseau N, Lipina C, et al. Characterising the inhibitory actions of ceramide upon insulin signaling in different skeletal muscle cell models: a mechanistic insight. PloS One. (2014) 9:e101865. doi: 10.1371/journal.pone.0101865
78. Green H, Meuth M. An established pre-adipose cell line and its differentiation in culture. Cell. (1974) 3:127–33. doi: 10.1016/0092-8674(74)90116-0
79. Ruiz-Ojeda FJ, Ruperez AI, Gomez-Llorente C, Gil A, Aguilera CM. Cell models and their application for studying adipogenic differentiation in relation to obesity: A review. Int J Mol Sci. (2016) 17. doi: 10.3390/ijms17071040
80. Liao CH, Hung HC, Lai CN, Liao YH, Liu PT, Lu SM, et al. Carnosic acid and rosemary extract reversed the lipid accumulation induced by bisphenol A in the 3T3-L1 preadipocytes and C57BL/6J mice via SIRT1/FoxO1 pathway. Food Chem Toxicol. (2023) 179:113996. doi: 10.1016/j.fct.2023.113996
81. Zhong S, Du X, Gao J, Ji G, Liu Z. BMP8B activates both SMAD2/3 and NF-kappaB signals to inhibit the differentiation of 3T3-L1 preadipocytes into mature adipocytes. Nutrients. (2023) 16. doi: 10.3390/nu16010064
82. Rossi A, Eid M, Dodgson J, Davies G, Musial B, Wabitsch M, et al. In vitro characterization of the effects of chronic insulin stimulation in mouse 3T3-L1 and human SGBS adipocytes. Adipocyte. (2020) 9:415–26. doi: 10.1080/21623945.2020.1798613
83. Yudhani RD, Sari Y, Nugrahaningsih D, Sholikhah EN, Rochmanti M, Purba A, et al. In vitro insulin resistance model: A recent update. J Obes. (2023) 2023:1964732. doi: 10.1155/2023/1964732
84. Knutson VP, Balba Y. 3T3-L1 adipocytes as a cell culture model of insulin resistance. In Vitro Cell Dev Biol Anim. (1997) 33:77–81. doi: 10.1007/s11626-997-0025-2
85. Nagami M, Ito Y, Nagasawa T. Phenethyl isothiocyanate protects against H(2)O(2)-induced insulin resistance in 3T3-L1 adipocytes. Biosci Biotechnol Biochem. (2017) 81:2195–203. doi: 10.1080/09168451.2017.1372181
86. Huang CY, Yao WF, Wu WG, Lu YL, Wan H, Wang W. Endogenous CSE/H2 S system mediates TNF-alpha-induced insulin resistance in 3T3-L1 adipocytes. Cell Biochem Funct. (2013) 31:468–75. doi: 10.1002/cbf.2920
87. Zhao W, Pu M, Shen S, Yin F. Geniposide improves insulin resistance through AMPK-mediated Txnip protein degradation in 3T3-L1 adipocytes. Acta Biochim Biophys Sin (Shanghai). (2021) 53:160–69. doi: 10.1093/abbs/gmaa157
88. Zhu Z, Yu M, Xu M, Ji X, Zong X, Zhang Z, et al. Baicalin suppresses macrophage JNK-mediated adipose tissue inflammation to mitigate insulin resistance in obesity. J Ethnopharmacol. (2024) 332:118355. doi: 10.1016/j.jep.2024.118355
89. Poulos SP, Dodson MV, Hausman GJ. Cell line models for differentiation: preadipocytes and adipocytes. Exp Biol Med (Maywood). (2010) 235:1185–93. doi: 10.1258/ebm.2010.010063
90. Student AK, Hsu RY, Lane MD. Induction of fatty acid synthetase synthesis in differentiating 3T3-L1 preadipocytes. J Biol Chem. (1980) 255:4745–50. doi: 10.1016/S0021-9258(19)85559-X
91. Wolins NE, Quaynor BK, Skinner JR, Tzekov A, Park C, Choi K, et al. OP9 mouse stromal cells rapidly differentiate into adipocytes: characterization of a useful new model of adipogenesis. J Lipid Res. (2006) 47:450–60. doi: 10.1194/jlr.D500037-JLR200
92. Fischer-Posovszky P, Newell FS, Wabitsch M, Tornqvist HE. Human SGBS cells - a unique tool for studies of human fat cell biology. Obes Facts. (2008) 1:184–89. doi: 10.1159/000145784
93. Limoge F, Faivre L, Gautier T, Petit JM, Gautier E, Masson D, et al. Insulin response dysregulation explains abnormal fat storage and increased risk of diabetes mellitus type 2 in Cohen Syndrome. Hum Mol Genet. (2015) 24:6603–13. doi: 10.1093/hmg/ddv366
94. Geiger K, Leiherer A, Muendlein A, Stark N, Geller-Rhomberg S, Saely CH, et al. Identification of hypoxia-induced genes in human SGBS adipocytes by microarray analysis. PloS One. (2011) 6:e26465. doi: 10.1371/journal.pone.0026465
95. Quarta S, Scoditti E, Carluccio MA, Calabriso N, Santarpino G, Damiano F, et al. Coffee bioactive N-methylpyridinium attenuates tumor necrosis factor (TNF)-alpha-mediated insulin resistance and inflammation in human adipocytes. Biomolecules. (2021) 11. doi: 10.3390/biom11101545
96. Wentworth JM, Zhang JG, Bandala-Sanchez E, Naselli G, Liu R, Ritchie M, et al. Interferon-gamma released from omental adipose tissue of insulin-resistant humans alters adipocyte phenotype and impairs response to insulin and adiponectin release. Int J Obes (Lond). (2017) 41:1782–89. doi: 10.1038/ijo.2017.180
97. Roos J, Dahlhaus M, Funcke JB, Kustermann M, Strauss G, Halbgebauer D, et al. miR-146a regulates insulin sensitivity via NPR3. Cell Mol Life Sci. (2021) 78:2987–3003. doi: 10.1007/s00018-020-03699-1
98. Keuper M, Dzyakanchuk A, Amrein KE, Wabitsch M, Fischer-Posovszky P. THP-1 macrophages and SGBS adipocytes - A new human in vitro model system of inflamed adipose tissue. Front Endocrinol (Lausanne). (2011) 2:89. doi: 10.3389/fendo.2011.00089
99. Molonia MS, Quesada-Lopez T, Speciale A, Muscara C, Saija A, Villarroya F, et al. In vitro effects of cyanidin-3-O-glucoside on inflammatory and insulin-sensitizing genes in human adipocytes exposed to palmitic acid. Chem Biodivers. (2021) 18:e2100607. doi: 10.1002/cbdv.202100607
100. Reitman ML. Of mice and men - environmental temperature, body temperature, and treatment of obesity. FEBS Lett. (2018) 592:2098–107. doi: 10.1002/1873-3468.13070
101. Wang P, Mariman E, Renes J, Keijer J. The secretory function of adipocytes in the physiology of white adipose tissue. J Cell Physiol. (2008) 216:3–13. doi: 10.1002/jcp.21386
102. Gu L, Ding X, Wang Y, Gu M, Zhang J, Yan S, et al. Spexin alleviates insulin resistance and inhibits hepatic gluconeogenesis via the FoxO1/PGC-1alpha pathway in high-fat-diet-induced rats and insulin resistant cells. Int J Biol Sci. (2019) 15:2815–29. doi: 10.7150/ijbs.31781
103. Song H, Huang Q, Zhang Y, Shen X. Wheat germ peptide improves glucose metabolism and insulin resistance in HepG2 hepatocytes via regulating SOCS3/IRS1/Akt pathway. Nutr Res. (2023) 120:135–44. doi: 10.1016/j.nutres.2023.10.005
104. Zhang Q, Yuan H, Zhang C, Guan Y, Wu Y, Ling F, et al. Epigallocatechin gallate improves insulin resistance in HepG2 cells through alleviating inflammation and lipotoxicity. Diabetes Res Clin Pract. (2018) 142:363–73. doi: 10.1016/j.diabres.2018.06.017
105. Song Z, Wang H, Zhu L, Han M, Gao Y, Du Y, et al. Curcumin improves high glucose-induced INS-1 cell insulin resistance via activation of insulin signaling. Food Funct. (2015) 6:461–69. doi: 10.1039/c4fo00608a
106. Wu L, Guo T, Deng R, Liu L, Yu Y. Apigenin ameliorates insulin resistance and lipid accumulation by endoplasmic reticulum stress and SREBP-1c/SREBP-2 pathway in palmitate-induced hepG2 cells and high-fat diet-fed mice. J Pharmacol Exp Ther. (2021) 377:146–56. doi: 10.1124/jpet.120.000162
107. Sun YN, Yang ZX, Ren FZ, Fang B. FGF19 alleviates palmitate-induced atrophy in C2C12 cells by inhibiting mitochondrial overload and insulin resistance. Int J Biol Macromol. (2020) 158:401–07. doi: 10.1016/j.ijbiomac.2020.04.186
108. Ma JZ, Yang LX, Shen XL, Qin JH, Deng LL, Ahmed S, et al. Effects of traditional chinese medicinal plants on anti-insulin resistance bioactivity of DXMS-induced insulin resistant hepG2 cells. Nat Prod Bioprospect. (2014) 4:197–206. doi: 10.1007/s13659-014-0028-0
109. Liu HJ, Zhang CY, Song F, Xiao T, Meng J, Zhang Q, et al. A novel partial agonist of peroxisome proliferator-activated receptor gamma with excellent effect on insulin resistance and type 2 diabetes. J Pharmacol Exp Ther. (2015) 353:573–81. doi: 10.1124/jpet.115.223107
110. Yan J, Wang C, Jin Y, Meng Q, Liu Q, Liu Z, et al. Catalpol ameliorates hepatic insulin resistance in type 2 diabetes through acting on AMPK/NOX4/PI3K/AKT pathway. Pharmacol Res. (2018) 130:466–80. doi: 10.1016/j.phrs.2017.12.026
111. Bailey CJ, Turner SL. Glucosamine-induced insulin resistance in L6 muscle cells. Diabetes Obes Metab. (2004) 6:293–98. doi: 10.1111/j.1462-8902.2004.00350.x
112. Yuan H, Hu Y, Zhu Y, Zhang Y, Luo C, Li Z, et al. Metformin ameliorates high uric acid-induced insulin resistance in skeletal muscle cells. Mol Cell Endocrinol. (2017) 443:138–45. doi: 10.1016/j.mce.2016.12.025
113. Lu F, Cai Q, Zafar MI, Cai L, Du W, Jian L, et al. 4-Hydroxyisoleucine improves hepatic insulin resistance by restoring glycogen synthesis in vitro. Int J Clin Exp Med. (2015) 8:8626–33.
114. Gao J, Guo K, Du M, Mao X. Bovine alpha-lactalbumin-derived peptides attenuate TNF-alpha-induced insulin resistance and inflammation in 3T3-L1 adipocytes through inhibiting JNK and NF-kappaB signaling. Food Funct. (2022) 13:2323–35. doi: 10.1039/d1fo01217g
115. Vlavcheski F, Den Hartogh DJ, Giacca A, Tsiani E. Amelioration of high-insulin-induced skeletal muscle cell insulin resistance by resveratrol is linked to activation of AMPK and restoration of GLUT4 translocation. Nutrients. (2020) 12. doi: 10.3390/nu12040914
116. Shamshoum H, Vlavcheski F, MacPherson R, Tsiani E. Rosemary extract activates AMPK, inhibits mTOR and attenuates the high glucose and high insulin-induced muscle cell insulin resistance. Appl Physiol Nutr Metab. (2021) 46:819–27. doi: 10.1139/apnm-2020-0592
117. Williams JF, Olefsky JM. Defective insulin receptor function in down-regulated HepG2 cells. Endocrinology. (1990) 127:1706–17. doi: 10.1210/endo-127-4-1706
118. Kolb H, Kempf K, Rohling M, Martin S. Insulin: too much of a good thing is bad. BMC Med. (2020) 18:224. doi: 10.1186/s12916-020-01688-6
119. Xu F, Wang N, Li G, Tian D, Shi X. ANGPTL8/betatrophin improves glucose tolerance in older mice and metabolomic analysis reveals its role in insulin resistance in hepG2 cells. Diabetes Metab Syndr Obes. (2021) 14:4209–21. doi: 10.2147/DMSO.S330700
120. Liu Z, Kuang W, Xu X, Li D, Zhu W, Lan Z, et al. Putative identification of components in Zengye Decoction and their effects on glucose consumption and lipogenesis in insulin-induced insulin-resistant HepG2 cells. J Chromatogr B Analyt Technol BioMed Life Sci. (2018) 1073:145–53. doi: 10.1016/j.jchromb.2017.12.019
121. Gutierrez-Rodelo C, Arellano-Plancarte A, Hernandez-Aranda J, Landa-Galvan HV, Parra-Mercado GK, Moreno-Licona NJ, et al. Angiotensin II inhibits insulin receptor signaling in adipose cells. Int J Mol Sci. (2022) 23. doi: 10.3390/ijms23116048
122. Chang E, Choi JM, Park SE, Rhee EJ, Lee WY, Oh KW, et al. Adiponectin deletion impairs insulin signaling in insulin-sensitive but not insulin-resistant 3T3-L1 adipocytes. Life Sci. (2015) 132:93–100. doi: 10.1016/j.lfs.2015.02.013
123. Garvey WT, Olefsky JM, Marshall S. Insulin induces progressive insulin resistance in cultured rat adipocytes. Sequential effects at receptor multiple postreceptor sites. Diabetes. (1986) 35:258–67. doi: 10.2337/diab.35.3.258
124. Li S, Bouzar C, Cottet-Rousselle C, Zagotta I, Lamarche F, Wabitsch M, et al. Resveratrol inhibits lipogenesis of 3T3-L1 and SGBS cells by inhibition of insulin signaling and mitochondrial mass increase. Biochim Biophys Acta. (2016) 1857:643–52. doi: 10.1016/j.bbabio.2016.03.009
125. Wang Z, Lv J, Zhang R, Zhu Y, Zhu D, Sun Y, et al. Co-culture with fat cells induces cellular insulin resistance in primary hepatocytes. Biochem Biophys Res Commun. (2006) 345:976–83. doi: 10.1016/j.bbrc.2006.04.173
126. Mussig K, Fiedler H, Staiger H, Weigert C, Lehmann R, Schleicher ED, et al. Insulin-induced stimulation of JNK and the PI 3-kinase/mTOR pathway leads to phosphorylation of serine 318 of IRS-1 in C2C12 myotubes. Biochem Biophys Res Commun. (2005) 335:819–25. doi: 10.1016/j.bbrc.2005.07.154
127. Chen A, Brar B, Choi CS, Rousso D, Vaughan J, Kuperman Y, et al. Urocortin 2 modulates glucose utilization and insulin sensitivity in skeletal muscle. Proc Natl Acad Sci U.S.A. (2006) 103:16580–85. doi: 10.1073/pnas.0607337103
128. Li LJ, Li GD, Wei HL, Chen J, Liu YM, Li F, et al. Insulin resistance reduces sensitivity to Cis-platinum and promotes adhesion, migration and invasion in HepG2 cells. Asian Pac J Cancer Prev. (2014) 15:3123–28. doi: 10.7314/apjcp.2014.15.7.3123
129. Fan X, Tao J, Zhou Y, Hou Y, Wang Y, Gu D, et al. Investigations on the effects of ginsenoside-Rg1 on glucose uptake and metabolism in insulin resistant HepG2 cells. Eur J Pharmacol. (2019) 843:277–84. doi: 10.1016/j.ejphar.2018.11.024
130. Zhou X, Wang LL, Tang WJ, Tang B. Astragaloside IV inhibits protein tyrosine phosphatase 1B and improves insulin resistance in insulin-resistant HepG2 cells and triglyceride accumulation in oleic acid (OA)-treated HepG2 cells. J Ethnopharmacol. (2021) 268:113556. doi: 10.1016/j.jep.2020.113556
131. Lee S, Park S, Choi CS. Insulin resistance: from mechanisms to therapeutic strategies. Diabetes Metab J. (2022) 46:15–37. doi: 10.4093/dmj.2021.0280
132. Saltiel AR, Kahn CR. Insulin signalling and the regulation of glucose and lipid metabolism. Nature. (2001) 414:799–806. doi: 10.1038/414799a
133. Samuel VT, Shulman GI. Mechanisms for insulin resistance: common threads and missing links. Cell. (2012) 148:852–71. doi: 10.1016/j.cell.2012.02.017
134. Tokarz VL, MacDonald PE, Klip A. The cell biology of systemic insulin function. J Cell Biol. (2018) 217:2273–89. doi: 10.1083/jcb.201802095
135. Sims EK, Carr ALJ, Oram RA, DiMeglio LA, Evans-Molina C. 100 years of insulin: celebrating the past, present and future of diabetes therapy. Nat Med. (2021) 27:1154–64. doi: 10.1038/s41591-021-01418-2
136. Bahniwal M, Little JP, Klegeris A. High glucose enhances neurotoxicity and inflammatory cytokine secretion by stimulated human astrocytes. Curr Alzheimer Res. (2017) 14:731–41. doi: 10.2174/1567205014666170117104053
137. Liu Z, Cao W. p38 mitogen-activated protein kinase: a critical node linking insulin resistance and cardiovascular diseases in type 2 diabetes mellitus. Endocr Metab Immune Disord Drug Targets. (2009) 9:38–46. doi: 10.2174/187153009787582397
138. Zhou W, Yang P, Liu L, Zheng S, Zeng Q, Liang H, et al. Transmembrane tumor necrosis factor-alpha sensitizes adipocytes to insulin. Mol Cell Endocrinol. (2015) 406:78–86. doi: 10.1016/j.mce.2015.02.023
139. Guru A, Issac PK, Saraswathi NT, Seshadri VD, Gabr GA, Arockiaraj J. Deteriorating insulin resistance due to WL15 peptide from cysteine and glycine-rich protein 2 in high glucose-induced rat skeletal muscle L6 cells. Cell Biol Int. (2021) 45:1698–709. doi: 10.1002/cbin.11608
140. Kothari V, Babu JR, Mathews ST. AMP activated kinase negatively regulates hepatic Fetuin-A via p38 MAPK-C/EBPbeta/E3 Ubiquitin Ligase Signaling pathway. PloS One. (2022) 17:e266472. doi: 10.1371/journal.pone.0266472
141. Hu X, Wang S, Xu J, Wang D, Chen Y, Yang G. Triterpenoid saponins from Stauntonia chinensis ameliorate insulin resistance via the AMP-activated protein kinase and IR/IRS-1/PI3K/Akt pathways in insulin-resistant HepG2 cells. Int J Mol Sci. (2014) 15:10446–58. doi: 10.3390/ijms150610446
142. Jiang B, Le L, Zhai W, Wan W, Hu K, Yong P, et al. Protective effects of marein on high glucose-induced glucose metabolic disorder in HepG2 cells. Phytomedicine. (2016) 23:891–900. doi: 10.1016/j.phymed.2016.05.004
143. Hwang S, Jeong Y, Hye Yang J, Li X, Lu Y, Son JK, et al. Pinusolide improves high glucose-induced insulin resistance via activation of AMP-activated protein kinase. Biochem Biophys Res Commun. (2013) 437:374–79. doi: 10.1016/j.bbrc.2013.06.084
144. Luo W, Ai L, Wang B, Zhou Y. High glucose inhibits myogenesis and induces insulin resistance by down-regulating AKT signaling. BioMed Pharmacother. (2019) 120:109498. doi: 10.1016/j.biopha.2019.109498
145. Rizwan H, Pal S, Sabnam S, Pal A. High glucose augments ROS generation regulates mitochondrial dysfunction and apoptosis via stress signalling cascades in keratinocytes. Life Sci. (2020) 241:117148. doi: 10.1016/j.lfs.2019.117148
146. Allen DA, Yaqoob MM, Harwood SM. Mechanisms of high glucose-induced apoptosis and its relationship to diabetic complications. J Nutr Biochem. (2005) 16:705–13. doi: 10.1016/j.jnutbio.2005.06.007
147. Park JE, Kang E, Han JS. HM-chromanone attenuates TNF-alpha-mediated inflammation and insulin resistance by controlling JNK activation and NF-kappaB pathway in 3T3-L1 adipocytes. Eur J Pharmacol. (2022) 921:174884. doi: 10.1016/j.ejphar.2022.174884
148. Esawie M, Louka M L, Hasanin AH, El-Kholy AA, Said Ali H. High-glucose-induced hyperosmolar stress sensitizes HepG2 cell lines to sorafenib. Gene. (2022) 844:146828. doi: 10.1016/j.gene.2022.146828
149. Boden G. Obesity, insulin resistance and free fatty acids. Curr Opin Endocrinol Diabetes Obes. (2011) 18:139–43. doi: 10.1097/MED.0b013e3283444b09
150. Rebrin K, Steil GM, Mittelman SD, Bergman RN. Causal linkage between insulin suppression of lipolysis and suppression of liver glucose output in dogs. J Clin Invest. (1996) 98:741–49. doi: 10.1172/JCI118846
151. Du K, Herzig S, Kulkarni RN, Montminy M. TRB3: a tribbles homolog that inhibits Akt/PKB activation by insulin in liver. Science. (2003) 300:1574–77. doi: 10.1126/science.1079817
152. Boden G. Fatty acid-induced inflammation and insulin resistance in skeletal muscle and liver. Curr Diabetes Rep. (2006) 6:177–81. doi: 10.1007/s11892-006-0031-x
153. Ragheb R, Shanab GML, Medhat AM, Seoudi DM, Adeli K, Fantus IG. Free fatty acid-induced muscle insulin resistance and glucose uptake dysfunction: evidence for PKC activation and oxidative stress-activated signaling pathways. Biochem Biophys Res Commun. (2009) 389:211–16. doi: 10.1016/j.bbrc.2009.08.106
154. Zhang M, Lei J, Wang Y, Zhang J, Liu D. Ethnopharmacology, phytochemistry and pharmacology of Benincasae Exocarpium: A review. Chin Herb Med. (2023) 15:15–26. doi: 10.1016/j.chmed.2022.10.001
155. Lei Y, Gong L, Tan F, Liu Y, Li S, Shen H, et al. Vaccarin ameliorates insulin resistance and steatosis by activating the AMPK signaling pathway. Eur J Pharmacol. (2019) 851:13–24. doi: 10.1016/j.ejphar.2019.02.029
156. Ritz-Laser B, Meda P, Constant I, Klages N, Charollais A, Morales A, et al. Glucose-induced preproinsulin gene expression is inhibited by the free fatty acid palmitate. Endocrinology. (1999) 140:4005–14. doi: 10.1210/endo.140.9.6953
157. Kwon B, Lee H, Querfurth HW. Oleate prevents palmitate-induced mitochondrial dysfunction, insulin resistance and inflammatory signaling in neuronal cells. Biochim Biophys Acta. (2014) 1843:1402–13. doi: 10.1016/j.bbamcr.2014.04.004
158. Teixeira FS, Pimentel LL, Vidigal SSMP, Azevedo-Silva J, Pintado ME, Rodriguez-Alcala LM. Differential lipid accumulation on hepG2 cells triggered by palmitic and linoleic fatty acids exposure. Molecules. (2023) 28. doi: 10.3390/molecules28052367
159. Yang W, Liu R, Xia C, Chen Y, Dong Z, Huang B, et al. Effects of different fatty acids on BRL3A rat liver cell damage. J Cell Physiol. (2020) 235:6246–56. doi: 10.1002/jcp.29553
160. Moravcova A, Cervinkova Z, Kucera O, Mezera V, Rychtrmoc D, Lotkova H. The effect of oleic and palmitic acid on induction of steatosis and cytotoxicity on rat hepatocytes in primary culture. Physiol Res. (2015) 64:S627–36. doi: 10.33549/physiolres.933224
161. Luo Y, Rana P, Will Y. Cyclosporine A and palmitic acid treatment synergistically induce cytotoxicity in HepG2 cells. Toxicol Appl Pharmacol. (2012) 261:172–80. doi: 10.1016/j.taap.2012.03.022
162. Bluher M. Adipose tissue inflammation: a cause or consequence of obesity-related insulin resistance? Clin Sci (Lond). (2016) 130:1603–14. doi: 10.1042/CS20160005
163. Ahmed B, Sultana R, Greene MW. Adipose tissue and insulin resistance in obese. BioMed Pharmacother. (2021) 137:111315. doi: 10.1016/j.biopha.2021.111315
164. Akash MSH, Rehman K, Liaqat A. Tumor necrosis factor-alpha: role in development of insulin resistance and pathogenesis of type 2 diabetes mellitus. J Cell Biochem. (2018) 119:105–10. doi: 10.1002/jcb.26174
165. Shoelson SE, Lee J, Goldfine AB. Inflammation and insulin resistance. J Clin Invest. (2006) 116:1793–801. doi: 10.1172/JCI29069
166. Wieser V, Moschen AR, Tilg H. Inflammation, cytokines and insulin resistance: a clinical perspective. Arch Immunol Ther Exp (Warsz). (2013) 61:119–25. doi: 10.1007/s00005-012-0210-1
167. Zhuang Y, Li M. MiRNA-27a mediates insulin resistance in 3T3-L1 cells through the PPARgamma. Mol Cell Biochem. (2022) 477:1107–12. doi: 10.1007/s11010-022-04367-7
168. He F, Wang M, Zhao H, Xie D, Lv J, Liu W, et al. Autophagy protects against high uric acid-induced hepatic insulin resistance. Mol Cell Endocrinol. (2022) 547:111599. doi: 10.1016/j.mce.2022.111599
169. Cassano V, Crescibene D, Hribal ML, Pelaia C, Armentaro G, Magurno M, et al. Uric acid and vascular damage in essential hypertension: role of insulin resistance. Nutrients. (2020) 12. doi: 10.3390/nu12092509
170. Zhi L, Yuzhang Z, Tianliang H, Hisatome I, Yamamoto T, Jidong C. High uric acid induces insulin resistance in cardiomyocytes in vitro and in vivo. PloS One. (2016) 11:e147737. doi: 10.1371/journal.pone.0147737
171. Yu W, Xie D, Yamamoto T, Koyama H, Cheng J. Mechanistic insights of soluble uric acid-induced insulin resistance: Insulin signaling and beyond. Rev Endocr Metab Disord. (2023) 24:327–43. doi: 10.1007/s11154-023-09787-4
172. Johnson RJ, Nakagawa T, Sanchez-Lozada LG, Shafiu M, Sundaram S, Le M, et al. Sugar, uric acid, and the etiology of diabetes and obesity. Diabetes. (2013) 62:3307–15. doi: 10.2337/db12-1814
173. Chen C, Cheng T, Chang C, Huang H, Lin S, Wu M, et al. Raloxifene ameliorates glucosamine-induced insulin resistance in ovariectomized rats. Biomedicines. (2021) 9. doi: 10.3390/biomedicines9091114
174. Zhu D, Wang Y, Du Q, Liu Z, Liu X. Cichoric acid reverses insulin resistance and suppresses inflammatory responses in the glucosamine-induced hepG2 cells. J Agric Food Chem. (2015) 63:10903–13. doi: 10.1021/acs.jafc.5b04533
175. Hresko RC, Heimberg H, Chi MM, Mueckler M. Glucosamine-induced insulin resistance in 3T3-L1 adipocytes is caused by depletion of intracellular ATP. J Biol Chem. (1998) 273:20658–68. doi: 10.1074/jbc.273.32.20658
176. Nelson BA, Robinson KA, Buse MG. Defective Akt activation is associated with glucose- but not glucosamine-induced insulin resistance. Am J Physiol Endocrinol Metab. (2002) 282:E497–506. doi: 10.1152/ajpendo.00438.2001
177. Nelson BA, Robinson KA, Buse MG. High glucose and glucosamine induce insulin resistance via different mechanisms in 3T3-L1 adipocytes. Diabetes. (2000) 49:981–91. doi: 10.2337/diabetes.49.6.981
178. Barham D, Trinder P. An improved colour reagent for the determination of blood glucose by the oxidase system. Analyst. (1972) 97:142–45. doi: 10.1039/an9729700142
179. Trinder P. Determination of blood glucose using an oxidase-peroxidase system with a non-carcinogenic chromogen. J Clin Pathol. (1969) 22:158–61. doi: 10.1136/jcp.22.2.158
180. Li M, Han Z, Bei W, Rong X, Guo J, Hu X. Oleanolic acid attenuates insulin resistance via NF-kappaB to regulate the IRS1-GLUT4 pathway in hepG2 cells. Evid Based Complement Alternat Med. (2015) 2015:643102. doi: 10.1155/2015/643102
181. Li Y, Shi Z, Yu X, Feng P, Wang X. Urotensin II-induced insulin resistance is mediated by NADPH oxidase-derived reactive oxygen species in HepG2 cells. World J Gastroenterol. (2016) 22:5769–79. doi: 10.3748/wjg.v22.i25.5769
182. Yoshioka K, Takahashi H, Homma T, Saito M, Oh KB, Nemoto Y, et al. A novel fluorescent derivative of glucose applicable to the assessment of glucose uptake activity of Escherichia coli. Biochim Biophys Acta. (1996) 1289:5–09. doi: 10.1016/0304-4165(95)00153-0
183. Yamada K, Saito M, Matsuoka H. Inagaki N. A real-time method Imaging glucose uptake single living Mamm Cells Nat Protoc. (2007) 2:753–62. doi: 10.1038/nprot.2007.76
184. Luo J, Wu N, Jiang B, Wang L, Wang S, Li X, et al. Marine Bromophenol Derivative 3,4-Dibromo-5-(2-bromo-3,4-dihydroxy-6-isopropoxymethyl benzyl)benzene-1,2-diol Protects Hepatocytes from Lipid-Induced Cell Damage and Insulin Resistance via PTP1B Inhibition. Mar Drugs. (2015) 13:4452–69. doi: 10.3390/md13074452
185. Liu Z, Liu T, Chen C, Li M, Wang Z, Chen R, et al. Fumosorinone, a novel PTP1B inhibitor, activates insulin signaling in insulin-resistance HepG2 cells and shows anti-diabetic effect in diabetic KKAy mice. Toxicol Appl Pharmacol. (2015) 285:61–70. doi: 10.1016/j.taap.2015.03.011
186. Liang G, Wang F, Song X, Zhang L, Qian Z, Jiang G. 3-Deoxyglucosone induces insulin resistance by impairing insulin signaling in HepG2 cells. Mol Med Rep. (2016) 13:4506–12. doi: 10.3892/mmr.2016.5081
187. D'Souza LJ, Wright SH, Bhattacharya D. Genetic evidence that uptake of the fluorescent analog 2NBDG occurs independently of known glucose transporters. PloS One. (2022) 17:e261801. doi: 10.1371/journal.pone.0261801
188. Su L, Wu R, Chen X, Hou W, Ruan BH. FITC-labeled d-glucose analog is suitable as a probe for detecting insulin-dependent glucose uptake. Bioorg Med Chem Lett. (2018) 28:3560–63. doi: 10.1016/j.bmcl.2018.09.027
189. Jo A, Sung J, Lee S, Nam H, Lee HW, Park J, et al. Near-IR fluorescent tracer for glucose-uptake monitoring in live cells. Bioconjug Chem. (2018) 29:3394–401. doi: 10.1021/acs.bioconjchem.8b00558
190. Yamamoto N, Ueda-Wakagi M, Sato T, Kawasaki K, Sawada K, Kawabata K, et al. Measurement of glucose uptake in cultured cells. Curr Protoc Pharmacol. (2015) 71:12–4. doi: 10.1002/0471141755.ph1214s71
191. Gao S, Guo Q, Qin C, Shang R, Zhang Z. Sea buckthorn fruit oil extract alleviates insulin resistance through the PI3K/akt signaling pathway in type 2 diabetes mellitus cells and rats. J Agric Food Chem. (2017) 65:1328–36. doi: 10.1021/acs.jafc.6b04682
192. Jin M, Shi G, Tang S, Nan-Qin, Qiao W, Duan H. Flavonoids from Tetrastigma obtectum enhancing glucose consumption in insulin-resistance HepG2 cells via activating AMPK. Fitoterapia. (2013) 90:240–46. doi: 10.1016/j.fitote.2013.07.024
193. Gao F, Jian L, Zafar MI, Du W, Cai Q, Shafqat RA, et al. 4-Hydroxyisoleucine improves insulin resistance in HepG2 cells by decreasing TNF-alpha and regulating the expression of insulin signal transduction proteins. Mol Med Rep. (2015) 12:6555–60. doi: 10.3892/mmr.2015.4298
194. Ni X, Sun Z, Hu G, Wang R. High concentration of insulin promotes apoptosis of primary cultured rat ovarian granulosa cells via its increase in extracellular HMGB1. Reprod Sci. (2015) 22:271–77. doi: 10.1177/1933719114549852
195. Ricchi M, Odoardi MR, Carulli L, Anzivino C, Ballestri S, Pinetti A, et al. Differential effect of oleic and palmitic acid on lipid accumulation and apoptosis in cultured hepatocytes. J Gastroenterol Hepatol. (2009) 24:830–40. doi: 10.1111/j.1440-1746.2008.05733.x
196. Beutler B, Bazzoni FTNF. apoptosis and autoimmunity: a common thread? Blood Cells Mol Dis. (1998) 24:216–30. doi: 10.1006/bcmd.1998.0187
197. Sheng CH, Du ZW, Song Y, Wu XD, Zhang YC, Wu M, et al. Human resistin inhibits myogenic differentiation and induces insulin resistance in myocytes. BioMed Res Int. (2013) 2013:804632. doi: 10.1155/2013/804632
198. Duehlmeier R, Hacker A, Widdel-Bigdely A, von Engelhardt W, Sallmann H. Insulin stimulates GLUT4 translocation in the semitendinosus muscle of Shetland ponies. Vet J. (2010) 184:176–81. doi: 10.1016/j.tvjl.2009.01.024
199. Pandey J, Dev K, Chattopadhyay S, Kadan S, Sharma T, Maurya R, et al. beta-sitosterol-D-glucopyranoside mimics estrogenic properties and stimulates glucose utilization in skeletal muscle cells. Molecules. (2021) 26. doi: 10.3390/molecules26113129
200. Perret P, Ghezzi C, Ogier L, Abbadi M, Morin C, Mathieu J, et al. Biological studies of radiolabeled glucose analogues iodinated in positions 3, 4 or 6. Nucl Med Biol. (2004) 31:241–50. doi: 10.1016/j.nucmedbio.2003.08.009
201. Henry C, Koumanov F, Ghezzi C, Mathieu JP, Hamant S, De Leiris J, et al. Experimental models, protocols, and reference values for evaluation of iodinated analogues of glucose. Nucl Med Biol. (1995) 22:875–85. doi: 10.1016/0969-8051(95)00036-w
202. Stockli J, Fazakerley DJ, James DE. GLUT4 exocytosis. J Cell Sci. (2011) 124:4147–59. doi: 10.1242/jcs.097063
203. Gibbs EM, Stock JL, McCoid SC, Stukenbrok HA, Pessin JE, Stevenson RW, et al. Glycemic improvement in diabetic db/db mice by overexpression of the human insulin-regulatable glucose transporter (GLUT4). J Clin Invest. (1995) 95:1512–18. doi: 10.1172/JCI117823
204. Tozzo E, Gnudi L, Kahn BB. Amelioration of insulin resistance in streptozotocin diabetic mice by transgenic overexpression of GLUT4 driven by an adipose-specific promoter. Endocrinology. (1997) 138:1604–11. doi: 10.1210/endo.138.4.5043
205. Wang X, Yu Q, Yue H, Zeng S, Cui F. Effect of intermittent hypoxia and rimonabant on glucose metabolism in rats: involvement of expression of GLUT4 in skeletal muscle. Med Sci Monit. (2015) 21:3252–60. doi: 10.12659/msm.896039
206. Mitsuhashi K, Senmaru T, Fukuda T, Yamazaki M, Shinomiya K, Ueno M, et al. Erratum to: Testosterone stimulates glucose uptake and GLUT4 translocation through LKB1/AMPK signaling in 3T3-L1 adipocytes. Endocrine. (2016) 52:402–03. doi: 10.1007/s12020-016-0864-2
207. Konrad D, Bilan PJ, Nawaz Z, Sweeney G, Niu W, Liu Z, et al. Need for GLUT4 activation to reach maximum effect of insulin-mediated glucose uptake in brown adipocytes isolated from GLUT4myc-expressing mice. Diabetes. (2002) 51:2719–26. doi: 10.2337/diabetes.51.9.2719
208. Govers R, Coster ACF, James DE. Insulin increases cell surface GLUT4 levels by dose dependently discharging GLUT4 into a cell surface recycling pathway. Mol Cell Biol. (2004) 24:6456–66. doi: 10.1128/MCB.24.14.6456-6466.2004
209. Karylowski O, Zeigerer A, Cohen A, McGraw TE. GLUT4 is retained by an intracellular cycle of vesicle formation and fusion with endosomes. Mol Biol Cell. (2004) 15:870–82. doi: 10.1091/mbc.e03-07-0517
210. Tucker DF, Sullivan JT, Mattia K, Fisher CR, Barnes T, Mabila MN, et al. Isolation of state-dependent monoclonal antibodies against the 12-transmembrane domain glucose transporter 4 using virus-like particles. Proc Natl Acad Sci U.S.A. (2018) 115:E4990–99. doi: 10.1073/pnas.1716788115
211. Diaz-Vegas A, Norris DM, Jall-Rogg S, Cooke KC, Conway OJ, Shun-Shion AS, et al. A high-content endogenous GLUT4 trafficking assay reveals new aspects of adipocyte biology. Life Sci Alliance. (2023) 6. doi: 10.26508/lsa.202201585
212. Li Y, Ding L, Hassan W, Abdelkader D, Shang J. Adipokines and hepatic insulin resistance. J Diabetes Res. (2013) 2013:170532. doi: 10.1155/2013/170532
213. Leclercq IA, Da Silva Morais A, Schroyen B, Van Hul N, Geerts A. Insulin resistance in hepatocytes and sinusoidal liver cells: mechanisms and consequences. J Hepatol. (2007) 47:142–56. doi: 10.1016/j.jhep.2007.04.002
214. Liu T, Shi C, Gao R, Sun H, Xiong X, Ding L, et al. Irisin inhibits hepatic gluconeogenesis and increases glycogen synthesis via the PI3K/Akt pathway in type 2 diabetic mice and hepatocytes. Clin Sci (Lond). (2015) 129:839–50. doi: 10.1042/CS20150009
215. Nagarajan SR, Paul-Heng M, Krycer JR, Fazakerley DJ, Sharland AF, Hoy AJ. Lipid and glucose metabolism in hepatocyte cell lines and primary mouse hepatocytes: a comprehensive resource for in vitro studies of hepatic metabolism. Am J Physiol Endocrinol Metab. (2019) 316:E578–89. doi: 10.1152/ajpendo.00365.2018
216. Raje V, Ahern KW, Martinez BA, Howell NL, Oenarto V, Granade ME, et al. Adipocyte lipolysis drives acute stress-induced insulin resistance. Sci Rep. (2020) 10:18166. doi: 10.1038/s41598-020-75321-0
217. He J, Xu C, Kuang J, Liu Q, Jiang H, Mo L, et al. Thiazolidinediones attenuate lipolysis and ameliorate dexamethasone-induced insulin resistance. Metabolism. (2015) 64:826–36. doi: 10.1016/j.metabol.2015.02.005
218. Sancar G, Liu S, Gasser E, Alvarez JG, Moutos C, Kim K, et al. FGF1 and insulin control lipolysis by convergent pathways. Cell Metab. (2022) 34:171–83. doi: 10.1016/j.cmet.2021.12.004
219. Delarue J, Magnan C. Free fatty acids and insulin resistance. Curr Opin Clin Nutr Metab Care. (2007) 10:142–48. doi: 10.1097/MCO.0b013e328042ba90
220. Hjelholt AJ, Charidemou E, Griffin JL, Pedersen SB, Gudiksen A, Pilegaard H, et al. Insulin resistance induced by growth hormone is linked to lipolysis and associated with suppressed pyruvate dehydrogenase activity in skeletal muscle: a 2 x 2 factorial, randomised, crossover study in human individuals. Diabetologia. (2020) 63:2641–53. doi: 10.1007/s00125-020-05262-w
221. Wang L, Zhang B, Huang F, Liu B, Xie Y. Curcumin inhibits lipolysis via suppression of ER stress in adipose tissue and prevents hepatic insulin resistance. J Lipid Res. (2016) 57:1243–55. doi: 10.1194/jlr.M067397
222. Zhao W, Li A, Feng X, Hou T, Liu K, Liu B, et al. Metformin and resveratrol ameliorate muscle insulin resistance through preventing lipolysis and inflammation in hypoxic adipose tissue. Cell Signal. (2016) 28:1401–11. doi: 10.1016/j.cellsig.2016.06.018
223. Park J, Jung TW, Chung YH, Park ES, Jeong JH. 1,2-Dilinoleoyl-sn-glycero-3-phosphocholine increases insulin sensitivity in palmitate-treated myotubes and induces lipolysis in adipocytes. Biochem Biophys Res Commun. (2020) 533:162–67. doi: 10.1016/j.bbrc.2020.09.019
224. Jiang B, Yang Y, Jin H, Shang W, Zhou L, Qian L, et al. Astragaloside IV attenuates lipolysis and improves insulin resistance induced by TNFalpha in 3T3-L1 adipocytes. Phytother Res. (2008) 22:1434–39. doi: 10.1002/ptr.2434
225. Tan S, Fisher-Wellman KH, Fazakerley DJ, Ng Y, Pant H, Li J, et al. Selective insulin resistance in adipocytes. J Biol Chem. (2015) 290:11337–48. doi: 10.1074/jbc.M114.623686
226. Morigny P, Houssier M, Mouisel E, Langin D. Adipocyte lipolysis and insulin resistance. Biochimie. (2016) 125:259–66. doi: 10.1016/j.biochi.2015.10.024
227. Kolb H, Kempf K, Martin S. Insulin and aging - a disappointing relationship. Front Endocrinol (Lausanne). (2023) 14:1261298. doi: 10.3389/fendo.2023.1261298
228. Garvey WT, Huecksteadt TP, Lima FB, Birnbaum MJ. Expression of a glucose transporter gene cloned from brain in cellular models of insulin resistance: dexamethasone decreases transporter mRNA in primary cultured adipocytes. Mol Endocrinol. (1989) 3:1132–41. doi: 10.1210/mend-3-7-1132
229. Kreutter DK, Andrews KM, Gibbs EM, Hutson NJ, Stevenson RW. Insulinlike activity of new antidiabetic agent CP 68722 in 3T3-L1 adipocytes. Diabetes. (1990) 39:1414–19. doi: 10.2337/diab.39.11.1414
230. Eckel J, Asskamp B, Reinauer H. Induction of insulin resistance in primary cultured adult cardiac myocytes. Endocrinology. (1991) 129:345–52. doi: 10.1210/endo-129-1-345
231. Chen Y, Lee M, Chang H, Hung P, Kao Y. 17 beta-estradiol stimulates resistin gene expression in 3T3-L1 adipocytes via the estrogen receptor, extracellularly regulated kinase, and CCAAT/enhancer binding protein-alpha pathways. Endocrinology. (2006) 147:4496–504. doi: 10.1210/en.2005-1655
232. Gao R, Wang H, Li T, Wang J, Ren Z, Cai N, et al. Secreted MUP1 that reduced under ER stress attenuates ER stress induced insulin resistance through suppressing protein synthesis in hepatocytes. Pharmacol Res. (2023) 187:106585. doi: 10.1016/j.phrs.2022.106585
233. Marshall S, Bacote V, Traxinger RR. Complete inhibition of glucose-induced desensitization of the glucose transport system by inhibitors of mRNA synthesis. Evidence for rapid turnover of glutamine:fructose-6-phosphate amidotransferase. J Biol Chem. (1991) 266:10155–61. doi: 10.1016/S0021-9258(18)99203-3
234. Turnbow MA, Keller SR, Rice KM, Garner CW. Dexamethasone down-regulation of insulin receptor substrate-1 in 3T3-L1 adipocytes. J Biol Chem. (1994) 269:2516–20. doi: 10.1016/S0021-9258(17)41975-2
235. Kawanaka K, Han DH, Gao J, Nolte LA, Holloszy JO. Development of glucose-induced insulin resistance in muscle requires protein synthesis. J Biol Chem. (2001) 276:20101–07. doi: 10.1074/jbc.M010599200
236. Marshall S. Kinetics of insulin action on protein synthesis in isolated adipocytes. Ability of glucose to selectively desensitize the glucose transport system without altering insulin stimulation of protein synthesis. J Biol Chem. (1989) 264:2029–36. doi: 10.1016/S0021-9258(18)94137-2
237. Martinez Baez A, Ayala G, Pedroza-Saavedra A, Gonzalez-Sanchez HM, Chihu Amparan L. Phosphorylation codes in IRS-1 and IRS-2 are associated with the activation/inhibition of insulin canonical signaling pathways. Curr Issues Mol Biol. (2024) 46:634–49. doi: 10.3390/cimb46010041
238. Wei Y, Zhou J, Yu H, Jin X. AKT phosphorylation sites of Ser473 and Thr308 regulate AKT degradation. Biosci Biotechnol Biochem. (2019) 83:429–35. doi: 10.1080/09168451.2018.1549974
239. Alaaeldin R, Abdel-Rahman IAM, Hassan HA, Youssef N, Allam AE, Abdelwahab SF, et al. Carpachromene ameliorates insulin resistance in hepG2 cells via modulating IR/IRS1/PI3k/akt/GSK3/foxO1 pathway. Molecules. (2021) 26. doi: 10.3390/molecules26247629
240. Liu M, Wang L, Li X, Wu Y, Yin F, Liu J. Trilobatin ameliorates insulin resistance through IRS-AKT-GLUT4 signaling pathway in C2C12 myotubes and ob/ob mice. Chin Med. (2020) 15:110. doi: 10.1186/s13020-020-00390-2
241. Saltiel AR. Insulin signaling in health and disease. J Clin Invest. (2021) 131. doi: 10.1172/JCI142241
242. Liu X, Wang K, Hou S, Jiang Q, Ma C, Zhao Q, et al. Insulin induces insulin receptor degradation in the liver through EphB4. Nat Metab. (2022) 4:1202–13. doi: 10.1038/s42255-022-00634-5
243. van Gerwen J, Shun-Shion AS, Fazakerley DJ. Insulin signalling and GLUT4 trafficking in insulin resistance. Biochem Soc Trans. (2023) 51:1057–69. doi: 10.1042/BST20221066
244. Cordero-Herrera I, Martin MA, Goya L, Ramos S. Cocoa flavonoids attenuate high glucose-induced insulin signalling blockade and modulate glucose uptake and production in human HepG2 cells. Food Chem Toxicol. (2014) 64:10–9. doi: 10.1016/j.fct.2013.11.014
245. Hu Y, Hou Z, Liu D, Yang X. Tartary buckwheat flavonoids protect hepatic cells against high glucose-induced oxidative stress and insulin resistance via MAPK signaling pathways. Food Funct. (2016) 7:1523–36. doi: 10.1039/c5fo01467k
246. Song J, Wang Q, Du M, Li T, Chen B, Mao X. Casein glycomacropeptide-derived peptide IPPKKNQDKTE ameliorates high glucose-induced insulin resistance in HepG2 cells via activation of AMPK signaling. Mol Nutr Food Res. (2017) 61. doi: 10.1002/mnfr.201600301
247. He S, Peng W, Zhou H. Combination treatment of deep sea water and fucoidan attenuates high glucose-induced insulin-resistance in hepG2 hepatocytes. Mar Drugs. (2018) 16. doi: 10.3390/md16020048
248. Achari AE, Jain SK. l-Cysteine supplementation increases insulin sensitivity mediated by upregulation of GSH and adiponectin in high glucose treated 3T3-L1 adipocytes. Arch Biochem Biophys. (2017) 630:54–65. doi: 10.1016/j.abb.2017.07.016
249. Zhang W, Lee J, Kim Y, Kim I, Han J, Lee S, et al. Effect of eriodictyol on glucose uptake and insulin resistance in vitro. J Agric Food Chem. (2012) 60:7652–58. doi: 10.1021/jf300601z
250. Ozcan U, Cao Q, Yilmaz E, Lee A, Iwakoshi NN, Ozdelen E, et al. Endoplasmic reticulum stress links obesity, insulin action, and type 2 diabetes. Science. (2004) 306:457–61. doi: 10.1126/science.1103160
251. Xia T, Duan W, Zhang Z, Fang B, Zhang B, Xu B, et al. Polyphenol-rich extract of Zhenjiang aromatic vinegar ameliorates high glucose-induced insulin resistance by regulating JNK-IRS-1 and PI3K/Akt signaling pathways. Food Chem. (2021) 335:127513. doi: 10.1016/j.foodchem.2020.127513
252. Chen L, Tang Z, Wang X, Ma H, Shan D, Cui S. PKM2 aggravates palmitate-induced insulin resistance in HepG2 cells via STAT3 pathway. Biochem Biophys Res Commun. (2017) 492:109–15. doi: 10.1016/j.bbrc.2017.08.025
253. She M, Hou H, Wang Z, Zhang C, Laudon M, Yin W. Melatonin rescues 3T3-L1 adipocytes from FFA-induced insulin resistance by inhibiting phosphorylation of IRS-1 on Ser307. Biochimie. (2014) 103:126–30. doi: 10.1016/j.biochi.2014.05.001
254. Garg R, Agarwal A, Katekar R, Goand UK, Singh N, Yadav S, et al. Pancreastatin inhibitor PSTi8 ameliorates insulin resistance by decreasing fat accumulation and oxidative stress in high-fat diet-fed mice. Amino Acids. (2023) 55:1587–600. doi: 10.1007/s00726-023-03332-y
255. Chen Y, Li Y, Wang Y, Wen Y, Sun C. Berberine improves free-fatty-acid-induced insulin resistance in L6 myotubes through inhibiting peroxisome proliferator-activated receptor gamma and fatty acid transferase expressions. Metabolism. (2009) 58:1694–702. doi: 10.1016/j.metabol.2009.06.009
256. Malik SA, Acharya JD, Mehendale NK, Kamat SS, Ghaskadbi SS. Pterostilbene reverses palmitic acid mediated insulin resistance in HepG2 cells by reducing oxidative stress and triglyceride accumulation. Free Radic Res. (2019) 53:815–27. doi: 10.1080/10715762.2019.1635252
257. Cusi K. Role of insulin resistance and lipotoxicity in non-alcoholic steatohepatitis. Clin Liver Dis. (2009) 13:545–63. doi: 10.1016/j.cld.2009.07.009
258. Wang M, Chen X, Zheng Z, Yu S, Zhou B, Liu Y, et al. Beneficial effect of ER stress preconditioning in protection against FFA-induced adipocyte inflammation via XBP1 in 3T3-L1 adipocytes. Mol Cell Biochem. (2020) 463:45–55. doi: 10.1007/s11010-019-03627-3
259. Mularczyk M, Bourebaba Y, Kowalczuk A, Marycz K, Bourebaba L. Probiotics-rich emulsion improves insulin signalling in Palmitate/Oleate-challenged human hepatocarcinoma cells through the modulation of Fetuin-A/TLR4-JNK-NF-kappaB pathway. BioMed Pharmacother. (2021) 139:111560. doi: 10.1016/j.biopha.2021.111560
Keywords: insulin resistance, type 2 diabetes mellitus, cell model, establishment and evaluation methods, drug screening
Citation: Yang Y, Wang T-t, Xie H-a, Hu PP and Li P (2024) Experimental cell models of insulin resistance: overview and appraisal. Front. Endocrinol. 15:1469565. doi: 10.3389/fendo.2024.1469565
Received: 25 July 2024; Accepted: 02 December 2024;
Published: 19 December 2024.
Edited by:
James Burchfield, The University of Sydney, AustraliaReviewed by:
Dougall Norris, University of New South Wales, AustraliaJonathan Scavuzzo, The University of Sydney, Australia
Copyright © 2024 Yang, Wang, Xie, Hu and Li. This is an open-access article distributed under the terms of the Creative Commons Attribution License (CC BY). The use, distribution or reproduction in other forums is permitted, provided the original author(s) and the copyright owner(s) are credited and that the original publication in this journal is cited, in accordance with accepted academic practice. No use, distribution or reproduction is permitted which does not comply with these terms.
*Correspondence: Pan Li, bGlwYW4yMDE5QGNxbXUuZWR1LmNu
†These authors have contributed equally to this work and share first authorship