 Xiaoli Lai1,2
 Tao Chen1*
- 1Department of Endocrinology and Metabolism, Longyan First Affiliated Hospital of Fujian Medical University, Longyan, China
- 2The Third Clinical Medical College, Fujian Medical University, Fuzhou, China
Background and aims: The serum uric acid (UA) to high-density lipoprotein cholesterol (HDL-C) ratio (UHR) is a novel biomarker that indicates inflammation and metabolic disorders. Also, it has been shown that UHR correlates with the risk of cardiovascular disease. Despite this, limited research exists on its prognostic significance. This study aimed to explore the association of UHR with all-cause and cardiovascular mortality in patients with diabetes or prediabetes.
Methods: This cohort study included 18,804 participants from the National Health and Nutrition Examination Survey (NHANES) 2005-2018 with diabetes or prediabetes aged 20 years or older, followed until December 31, 2019. Patients with diabetes or prediabetes were grouped according to quartiles of UHR, which was calculated as serum UA (mg/dL)/HDL-C (mg/dL). Kaplan-Meier survival analysis, multivariable Cox proportional hazards regression models, restricted cubic spline analysis, and threshold effects were performed to assess the association between baseline UHR and all-cause and cardiovascular mortality. Subgroup analysis and sensitivity analysis were also conducted.
Results: During a median follow-up of 80 months, a total of 2,748 (14.61%) deaths occurred, including 869 (4.63%) cardiovascular deaths. Kaplan-Meier survival analysis revealed that the highest quartile of UHR had the highest mortality rates. Multivariable Cox regression analysis indicated that individuals in the highest quartile of UHR had a significantly higher risk of all-cause mortality (HR: 1.24, 95% CI: 1.07-1.45) and cardiovascular mortality (HR: 1.56, 95% CI: 1.19-2.04) compared to those in the second quartile. A J-shaped association between UHR and both all-cause and cardiovascular mortality was observed, with threshold points of 13.73% and 9.39%, respectively. Specifically, when UHR was above the respective thresholds, the HRs of a 10% increment of UHR for all-cause mortality and cardiovascular mortality were 1.45 (95% CI: 1.31-1.61) and 1.38 (95% CI: 1.20-1.60). However, UHR below the threshold did not significantly correlate with mortality. Furthermore, subgroup analyses showed that the correlation of UHR with all-cause mortality was significantly modified by sex and age, with a persistent positive correlation observed in women and those aged < 60.
Conclusion: Higher UHR was correlated with increased all-cause and cardiovascular mortality in patients with diabetes or prediabetes.
1 Introduction
The prevalence of glucose metabolism disorders is increasing globally due to shifts in lifestyle and population aging, presenting a significant challenge to public health. According to the International Diabetes Federation (IDF), approximately 720 million people worldwide were prediabetic, and 537 million were diabetic in 2021, which is expected to reach 1 billion and 783 million people by 2045, respectively (1). Prediabetes, characterized as an intermediate state between normoglycemia and diabetes, has been proven to be correlated with the onset of diabetes and elevated risks of cardiovascular disease, chronic kidney disease, cancer, and other diseases, all of which pose a considerable health burden (2–7). Furthermore, cumulative evidence has indicated that both diabetes and prediabetes increase the risk of all-cause and cardiovascular death (3, 8). Thus, earlier identification and intervention of risk factors are essential to improve the prognosis of individuals with abnormal glucose metabolism.
Serum uric acid (UA) to high-density lipoprotein cholesterol (HDL-C) ratio (UHR), a novel inflammation and metabolic indicator, has gained attention in recent years (9). Zhou et al. (10, 11) reported that UHR is an effective marker for predicting insulin resistance (IR), irrespective of the presence of type 2 diabetes mellitus (T2DM). Several other studies have shown that elevated UHR is linked to metabolic diseases such as metabolic syndrome, non-alcoholic fatty liver disease, and prediabetes (12–17). Additionally, elevated UHR has been found to be associated with coronary artery disease, ischemic cardiomyopathy, and arterial stiffness (18–21). UHR could also predict adverse cardiovascular outcomes and all-cause mortality risk in patients with acute myocardial infarction (22). Furthermore, a high cumulative UHR has been connected with the incidence and progression of chronic kidney disease (23). Increasing evidence has suggested that UHR, as a simple and easily obtainable composite indicator, may hold predictive and prognostic value in clinical settings.
Abnormal glucose metabolism can often coexist with other metabolic disorders, such as UA metabolism disorders and dyslipidemia (24, 25). These interconnected metabolic disorders can mutually influence each other, increasing the risk of cardiovascular diseases and negatively impacting prognosis. Although previous studies have confirmed the predictive capabilities of UHR for metabolic diseases and its correlation with cardiovascular diseases, limited research has delved into the association of UHR with mortality risk. Therefore, this study aimed to explore the association of UHR with all-cause mortality and cardiovascular mortality in patients with diabetes or prediabetes.
2 Materials and methods
2.1 Study design and participants
This prospective cohort study utilized data from the National Health and Nutrition Examination Survey (NHANES), a research program funded by the Centers for Disease Control and Prevention, to evaluate Americans’ health and nutritional status. The survey employs a nationally representative sample design involving complex stratified, multistage, probability sampling and is carried out biennially. The studies involving human participants received approval from the Research Ethics Review Board of the National Center for Health Statistics (NCHS), and all participants provided written informed consent. Relevant data can be accessed at https://www.cdc.gov/nchs/nhanes/index.htm.
According to the 2024 diagnostic criteria from the American Diabetes Association (ADA) guideline (26), diabetes was defined as: (1) a fasting plasma glucose level ≥ 7.0 mmol/L; (2) a random plasma glucose level or 2-h post-load plasma glucose (75g oral glucose tolerance test) ≥ 11.1 mmol/L; (3) a glycosylated hemoglobin A1c (HbA1c) level ≥ 6.5%; (4) self-reported diabetes diagnosis; (5) use of antidiabetic medication. Prediabetes was defined as: (1) a fasting plasma glucose level of 5.6-6.9 mmol/L; (2) a random plasma glucose level or 2-h post-load plasma glucose (75g oral glucose tolerance test) of 7.8-11.0 mmol/L; (3) an HbA1c level of 5.7-6.4%; (4) self-reported diagnosis. A total of 70,190 individuals were reviewed during NHANES 2005-2018. Based on the diagnostic criteria above, 19,795 adults aged 20 years and older with diabetes or prediabetes were initially screened. After excluding participants lacking serum UA (n = 953), HDL-C (n = 5), and follow-up data (n = 34), 18,804 participants were ultimately included (Figure 1).
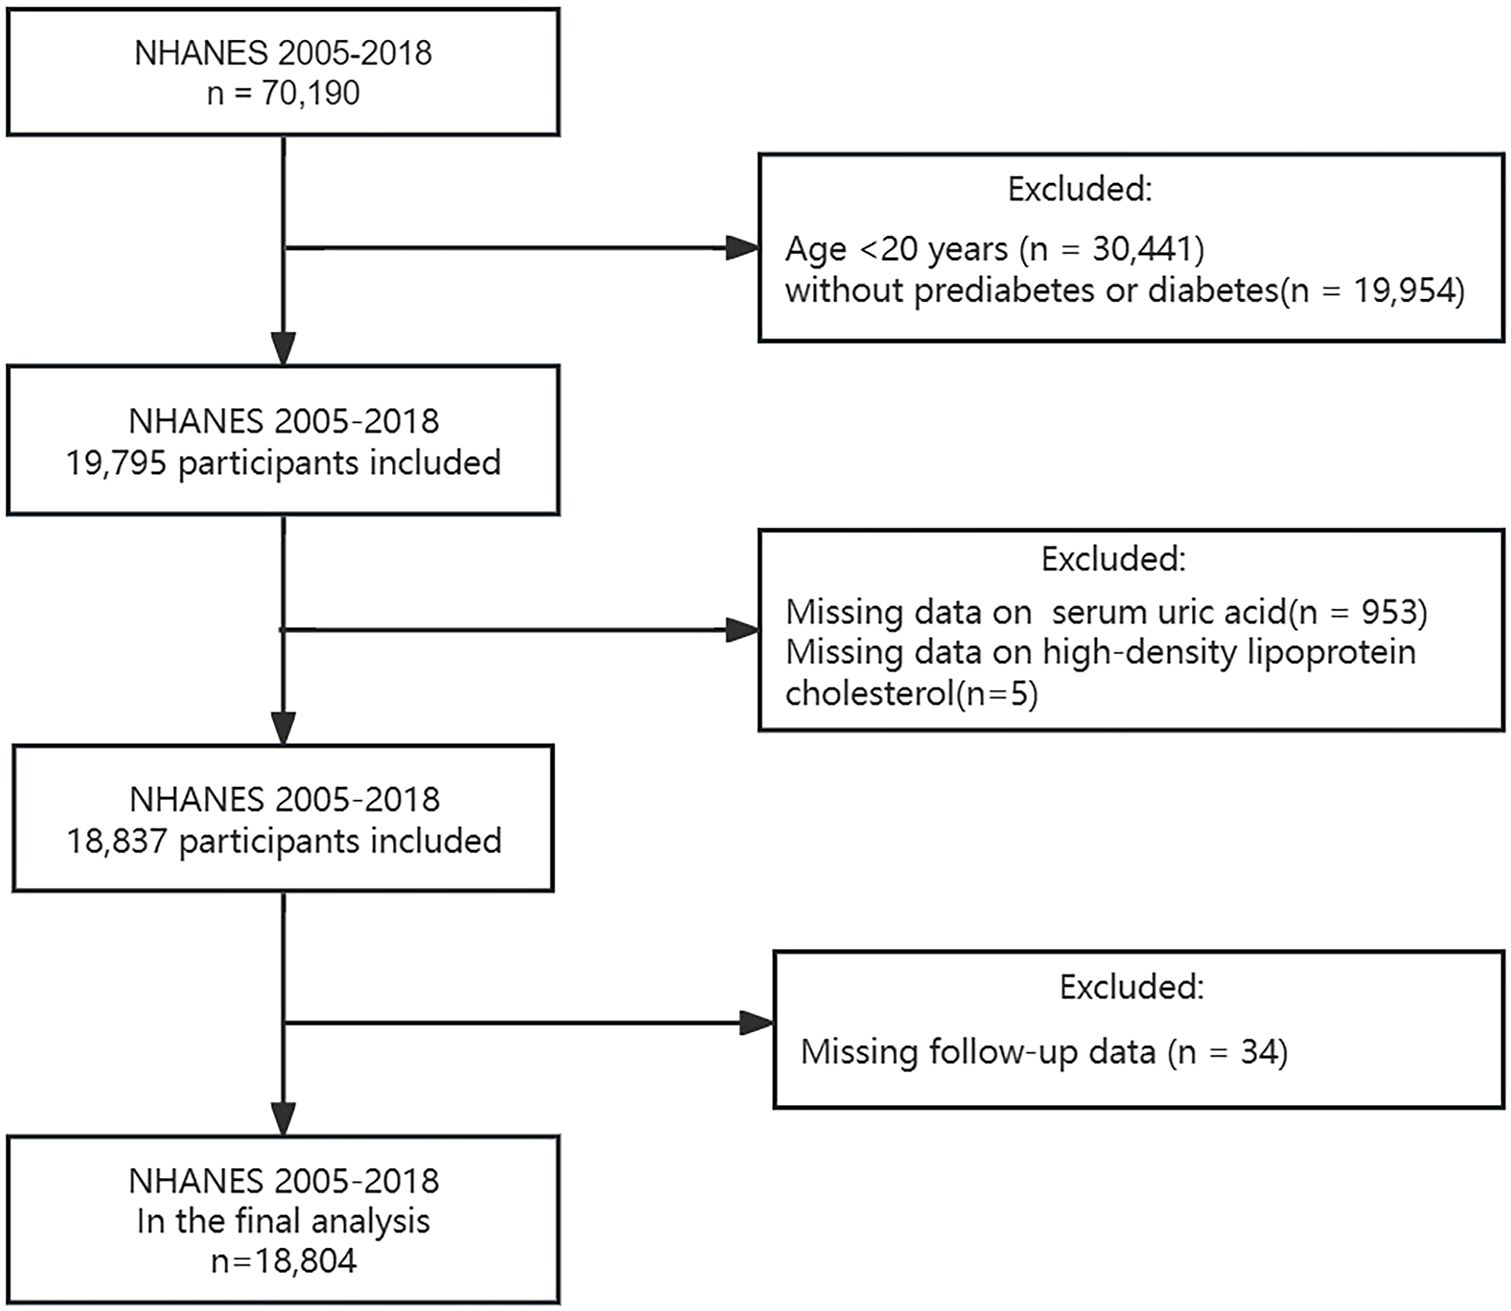
Figure 1. Flowchart of study participants selection.
2.2 Calculation of UHR
UHR was calculated as the ratio of serum UA (mg/dL) to HDL-C (mg/dL). Serum UA levels were determined using the timed endpoint method, while HDL-C levels were determined using the direct immunoassay method. For detailed guidelines on laboratory storage, measurement procedures, and quality control, please refer to the NHANES website. Participants were divided into four categories (Q1, Q2, Q3, and Q4) by quartile of UHR.
2.3 Outcome ascertainment
Mortality data was obtained from National Death Index (NDI) death certificate records provided by NCHS, and the International Statistical Classification of Diseases, 10th Revision (ICD-10) was used to identify death causes. Follow-up time was determined between the date of the baseline examination and death or December 31, 2019, whichever occurred first. The study outcomes were all-cause mortality and cardiovascular mortality. Cardiovascular deaths included death from heart disease (codes I00–I09, I11, I13, I20–I51) and cerebrovascular disease (codes I60-I69). For more detailed information on mortality data, please visit https://www.cdc.gov/nchs/data-linkage/mortality.htm.
2.4 Covariates
Based on prior experience, several potential confounding covariates were included in the present study. Demographic information included sex (male, female), age, race (non-Hispanic white, non-Hispanic black, other Hispanic, Mexican American, and others), educational level (less than high school, high school or GED, college or above), marital status (married/living with partner, living alone), family income-poverty ratio (PIR) (< 1.3, 1.3-3, ≥ 3) and body mass index (BMI) (< 18.5 kg/m2, 18.5-25 kg/m2, 25-30 kg/m2, ≥ 30 kg/m2). Lifestyle included smoking status (never, former, current) and alcohol intake (mild, moderate, heavy). Specifically, individuals who consumed three or more drinks per day for women and four or more drinks per day for men, with five or more binge drinking days per month, were classified as heavy alcohol drinkers; those who consumed two drinks per day for women and three drinks per day for men, with two binge drinking days per month, were classified as moderate alcohol drinkers. Those who did not meet the above criteria were considered mild alcohol drinkers. Comorbidities included cardiovascular disease, chronic kidney disease, hypertension, hyperlipidemia, and cancer. Cardiovascular disease refers to any one or combination of self-reported coronary heart disease, congestive heart failure, heart attack, angina, and stroke. Medication use included self-reported use of antidiabetic drugs, lipid-lowering drugs, and uric acid-lowering drugs in the past 30 days. In addition, HbA1c was also collected. Detailed information on covariates can be found on the NHANES website.
2.5 Statistical analysis
Exam sample weights were used in the current study as recommended by the NHANES guidelines. Baseline characteristics were described according to UHR quartiles. Continuous variables were expressed as mean ± standard error (SE), and differences between groups were compared using weighted one-way analysis of variance (ANOVA). Categorical variables were expressed as weighted percentages (%), and differences between groups were compared using weighted chi-square tests. The proportional hazards assumption was verified by examining Schoenfeld residuals, and there were no violations of this assumption. Variance inflation factor (VIF) was used to quantify multicollinearity between the adjusted covariates, and all VIFs were < 5. All-cause and cardiovascular deaths were assessed separately for subjects in the UHR quartiles using a weighted Kaplan-Meyer survival analysis. Risk tables were utilized to provide the probability of survival at different follow-up durations (at 50-month intervals). Three weighted Cox proportional risk models were conducted to calculate hazard ratios (HRs) and 95% confidence intervals (95% CI) for the relationship of UHR quartiles with all-cause and cardiovascular mortality. The median value of each UHR category was used as a continuous variable in the models, and linear trend tests were performed. Model 1 was unadjusted, while Model 2 was adjusted for age and sex. Model 3 was further adjusted for race, educational level, marital status, PIR, BMI, smoking status, alcohol intake, cardiovascular disease, chronic kidney disease, hypertension, hyperlipidemia, cancer, and HbA1c based on Model 2. A multiple imputation was used for missing covariates. The dose-response relationship of UHR with all-cause and cardiovascular mortality was additionally examined using restricted cubic spline (RCS) analysis. Node selection for the RCS curve was guided by minimizing the Akaike information criterion (AIC). In the case of a non-linear relationship, the two-piecewise Cox proportional hazards regression analyses were employed to estimate thresholds through threshold effects. Subgroup analyses were conducted based on age (< 60 years, ≥ 60 years), sex (male, female), BMI (< 18.5 kg/m2, 18.5-25 kg/m2, 25-30 kg/m2, ≥ 30 kg/m2), cardiovascular disease (yes, no), chronic kidney disease (yes, no), hypertension (yes, no), hyperlipidemia (yes, no), and diabetic condition (prediabetes, diabetes). Interaction terms were used among the subgroups to assess potential effect modification, followed by a likelihood ratio test. Finally, two sensitivity analyses were performed: (1) Participants who died within two years were excluded to reduce potential reverse causality bias; (2) To mitigate the confounding effects of medications, additional adjustments for glucose-lowering medications (yes, no), lipid-lowering medications (yes, no), and uric acid-lowering medications (yes, no) were made based on model 3. All analyses were performed using R (version 4.3.3) and EmpowerStats (version 4.2.0, www.empowerstats.com; X&Y Solutions, Inc. Boston MA). P < 0.05 was considered statistically significant.
3 Results
3.1 Baseline characteristics of participants
A total of 18,804 participants (weighted number 98,575,031) were eligible for the study, including 12,071 prediabetics and 6,733 diabetics with a mean age (± SE) of 54.27 ± 0.22 years. Among all the participants, 48.55% were females, and 51.45% were males. The mean (± SE) of serum UA was 5.68 ± 0.02 mg/dL, and the mean (± SE) of HDL-C was 51.01 ± 0.23 mg/dL. The mean (± SE) of UHR of the enrolled patients was 12.31 ± 0.07%, and the participants were classified according to the UHR quartiles: 0.67% ≤ Q1 ≤ 8.50%, 8.50% < Q2 ≤ 11.40%, 11.40% < Q3 ≤ 15.20%, and 15.20% < Q4 ≤ 80.00%. Weighted baseline characteristics are listed in Table 1. Compared to those with the lowest UHR quartile (Q1), those with the highest (Q4) were more likely to be younger, male, Non-Hispanic White, less educated, married/living with a partner, economically deprived, obese, former or current smokers, and mild or heavy alcohol drinkers. They also had higher serum UA and HbA1c levels and lower HDL-C levels. Notably, as the UHR quartiles (from Q1 to Q4) increased, the proportion of participants with comorbid cardiovascular disease (from 10.80% to 18.65%), chronic kidney disease (from 17.18% to 27.88%), hypertension (from 45.38% to 60.05%), and hyperlipidemia (from 72.30% to 92.90%) increased significantly. All variables, except for history of cancer, exhibited statistically significant variations across the four groups (all P < 0.05).
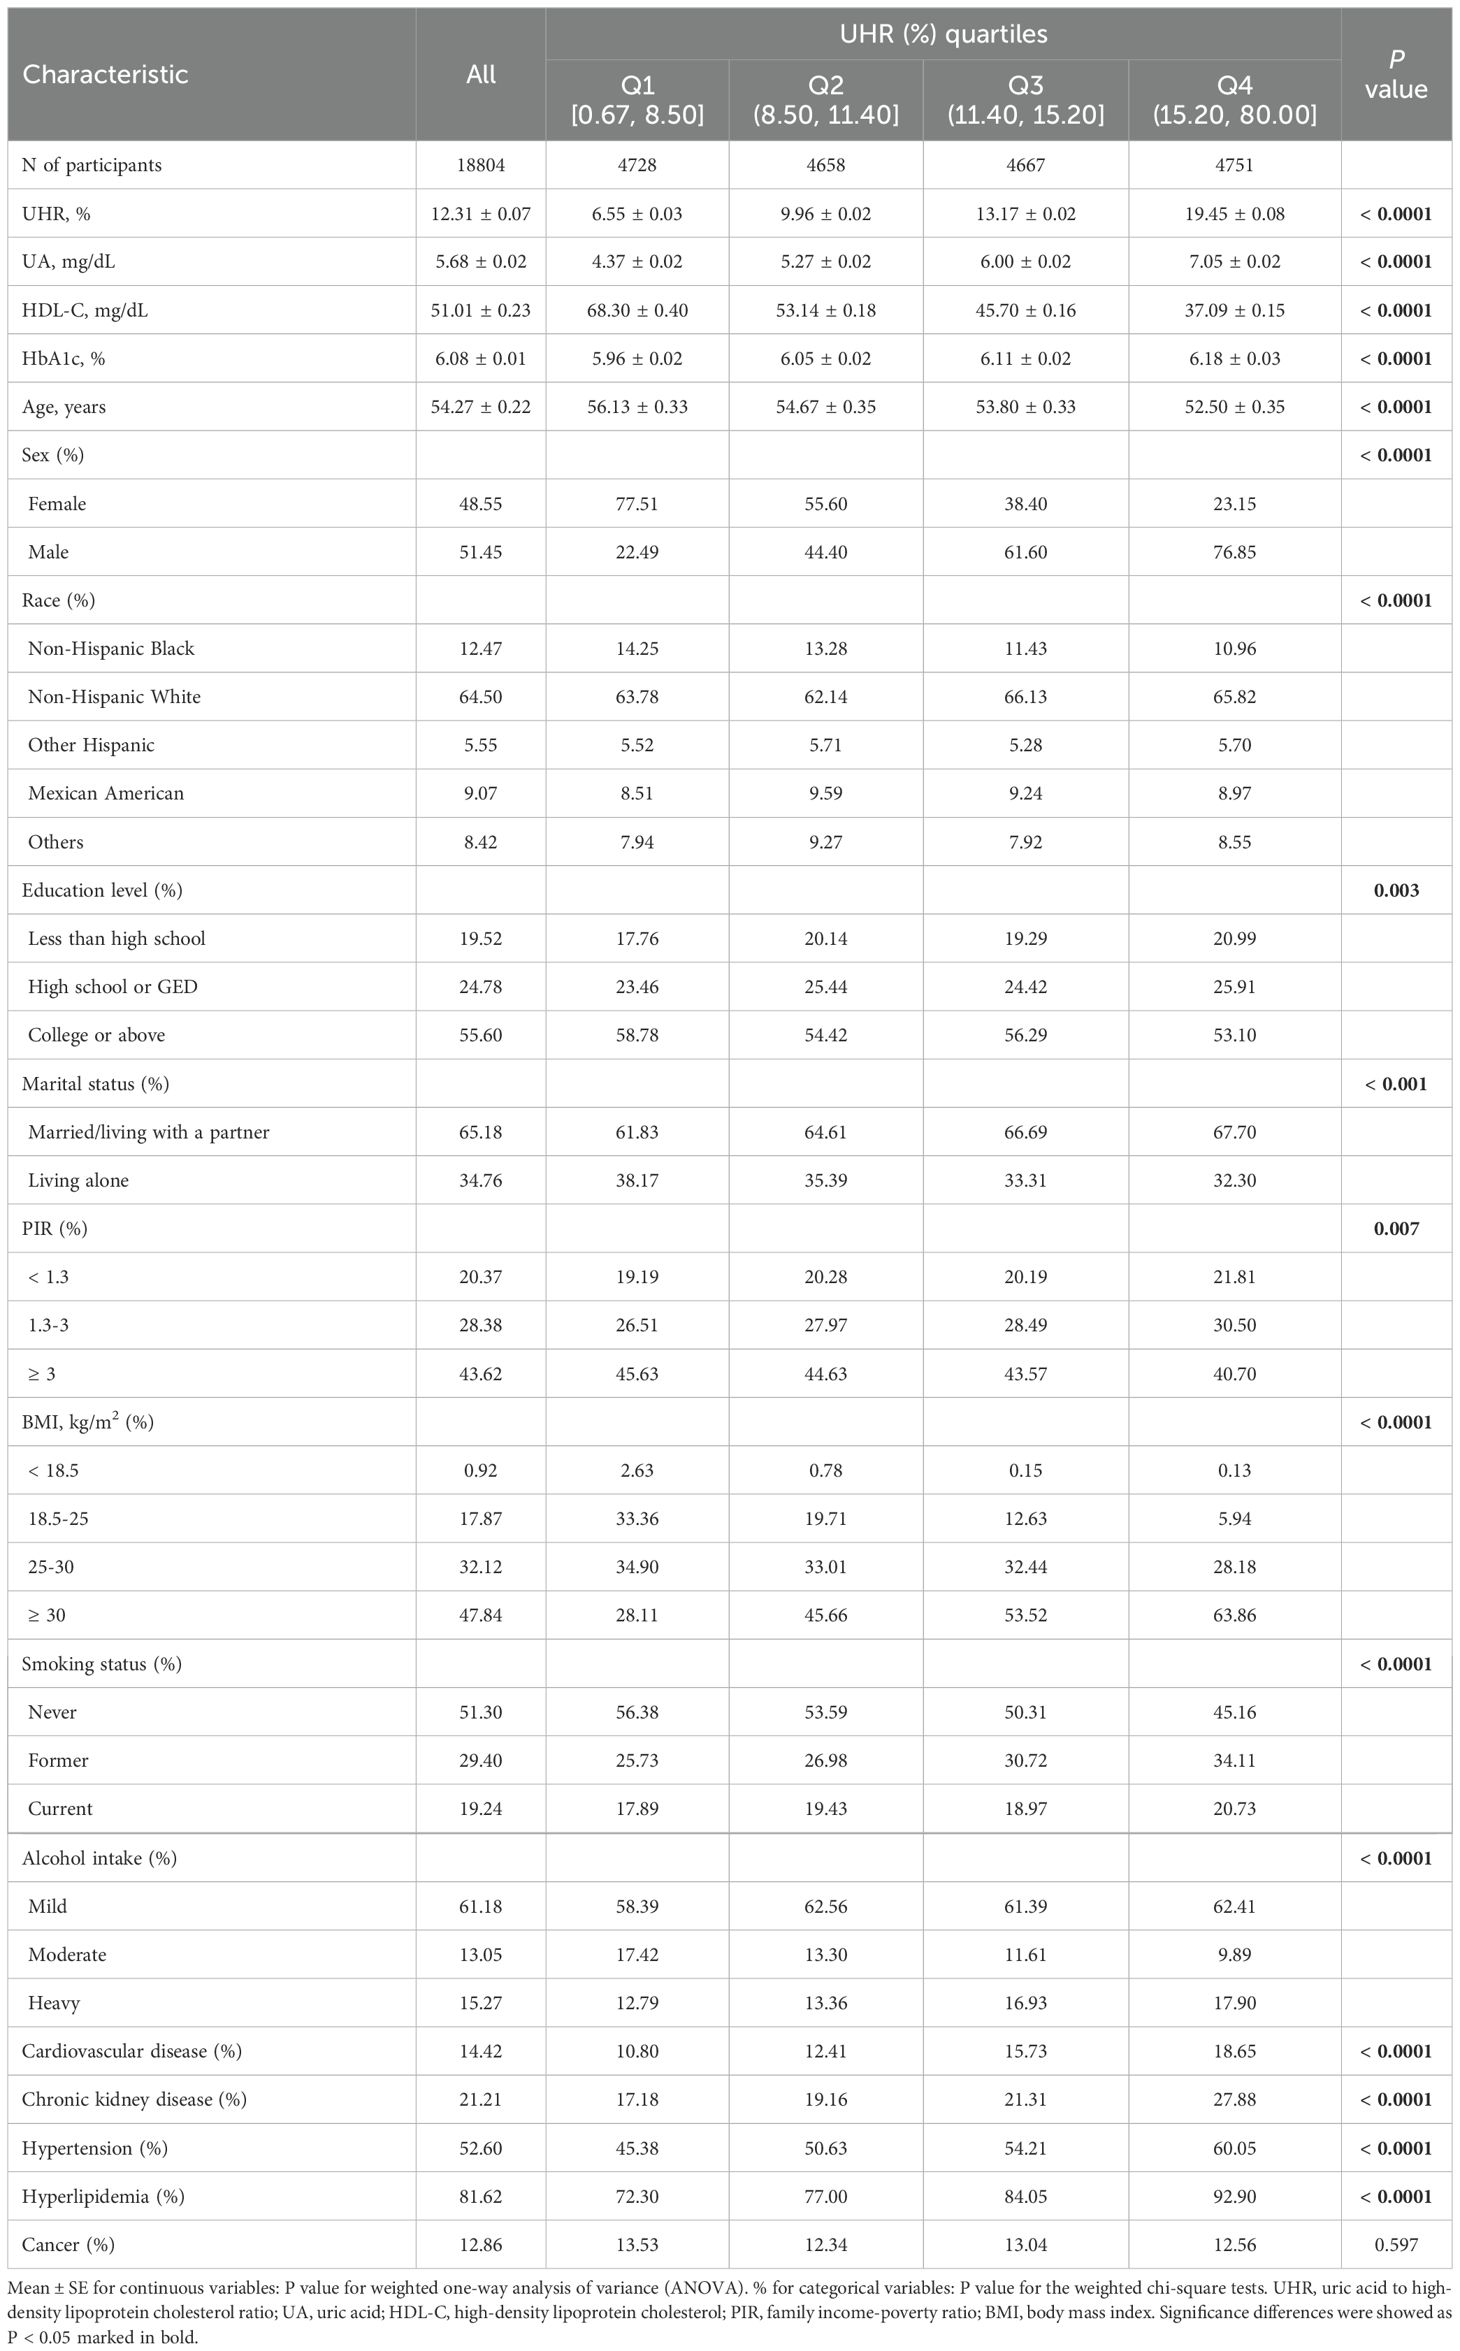
Table 1. Characteristics of participants according to UHR quartiles.
3.2 Association of UHR with all-cause and cardiovascular mortality
During a median follow-up time of 80 months, 2748 (14.61%) deaths occurred, including 869 (4.62%) cardiovascular deaths. The Kaplan-Meyer survival analysis is displayed in Figure 2. A significant reduction in individual survival was observed when UHR levels were between 15.20% and 80% (Q4) (P both < 0.0001). Three Cox regression models were constructed to analyze the association of UHR qualities with mortality, and the second quartile (Q2) was set as the reference group, as detailed in Table 2. The unadjusted model showed that individuals in the highest quartile of UHR (Q4) had higher all-cause mortality (HR: 1.34, 95% CI: 1.17-1.53, P < 0.0001) and cardiovascular mortality (HR: 1.78, 95% CI: 1.41-2.24, P < 0.0001) compared to those in the second quartile (Q2). After fully adjusting for confounders, participants in group Q4 exhibited a 24% increased risk of all-cause mortality (HR: 1.24, 95% CI: 1.07-1.45, P = 0.005) and a 56% increased risk of cardiovascular mortality (HR: 1.56, 95% CI: 1.19-2.04, P = 0.001) compared to those in the Q2 group.
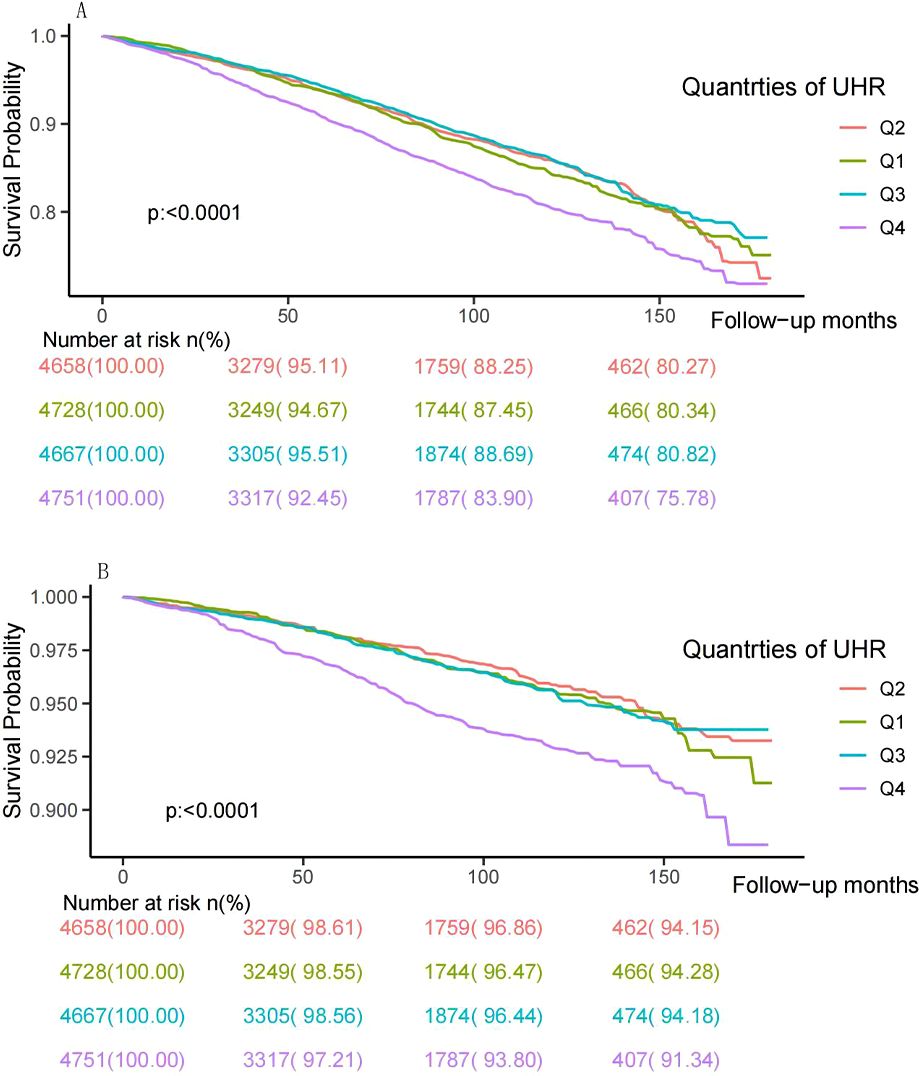
Figure 2. Kaplan–Meier survival curve and risk table for all-cause (A) and cardiovascular mortality (B) by UHR quartiles. UHR: uric acid to high-density lipoprotein cholesterol ratio.
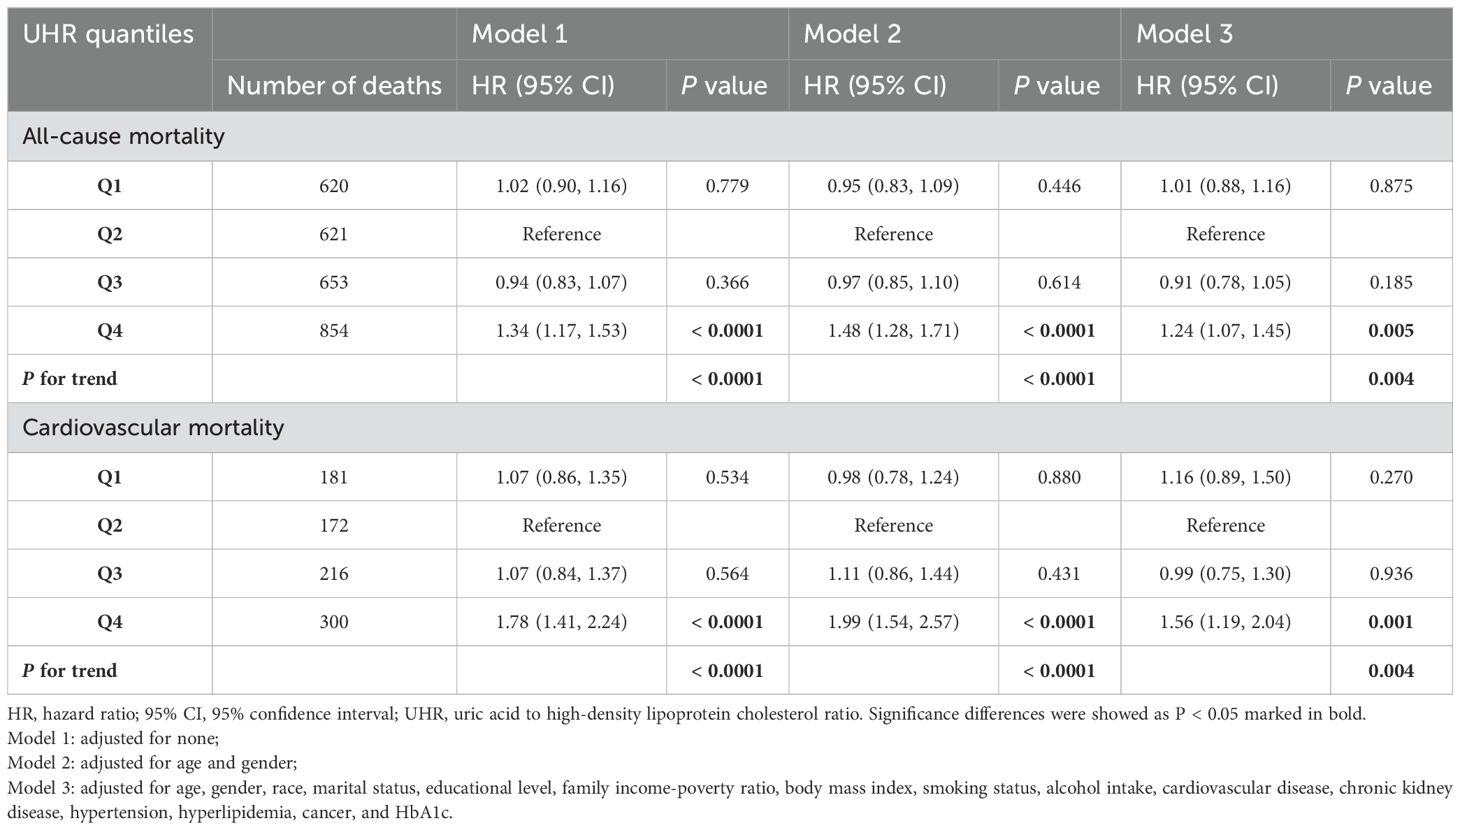
Table 2. Association between UHR and risks of mortality in patients with diabetes or prediabetes.
3.3 Non-linear relationships
To further investigate the association between UHR and mortality, the adjusted RCS curve was used to illustrate the dose-response relationship of UHR with all-cause mortality and cardiovascular mortality (Figure 3). Following comprehensive adjustments for demographics, lifestyle, comorbidities, and glycemic control, a J-shaped association was observed between UHR and all-cause and cardiovascular mortality (both P for non-linear < 0.0001). The two-piecewise Cox proportional hazards regression analyses (Table 3) indicated that the threshold points for all-cause mortality and cardiovascular mortality were 13.73% (P for log-likelihood ratio < 0.001) and 9.39% (P for log-likelihood ratio = 0.016), respectively. Notably, when UHR ≥ 13.73%, every 10% increase in UHR was associated with a 45% increase risk of all-cause mortality (HR: 1.45, 95% CI: 1.31-1.61, P < 0.0001). When UHR ≥ 9.39%, every 10% increase in UHR was associated with a 38% increase risk of cardiovascular mortality (HR: 1.38, 95% CI: 1.20-1.60, P < 0.0001). However, when UHR was below the threshold, there was not a significant association (P > 0.05).
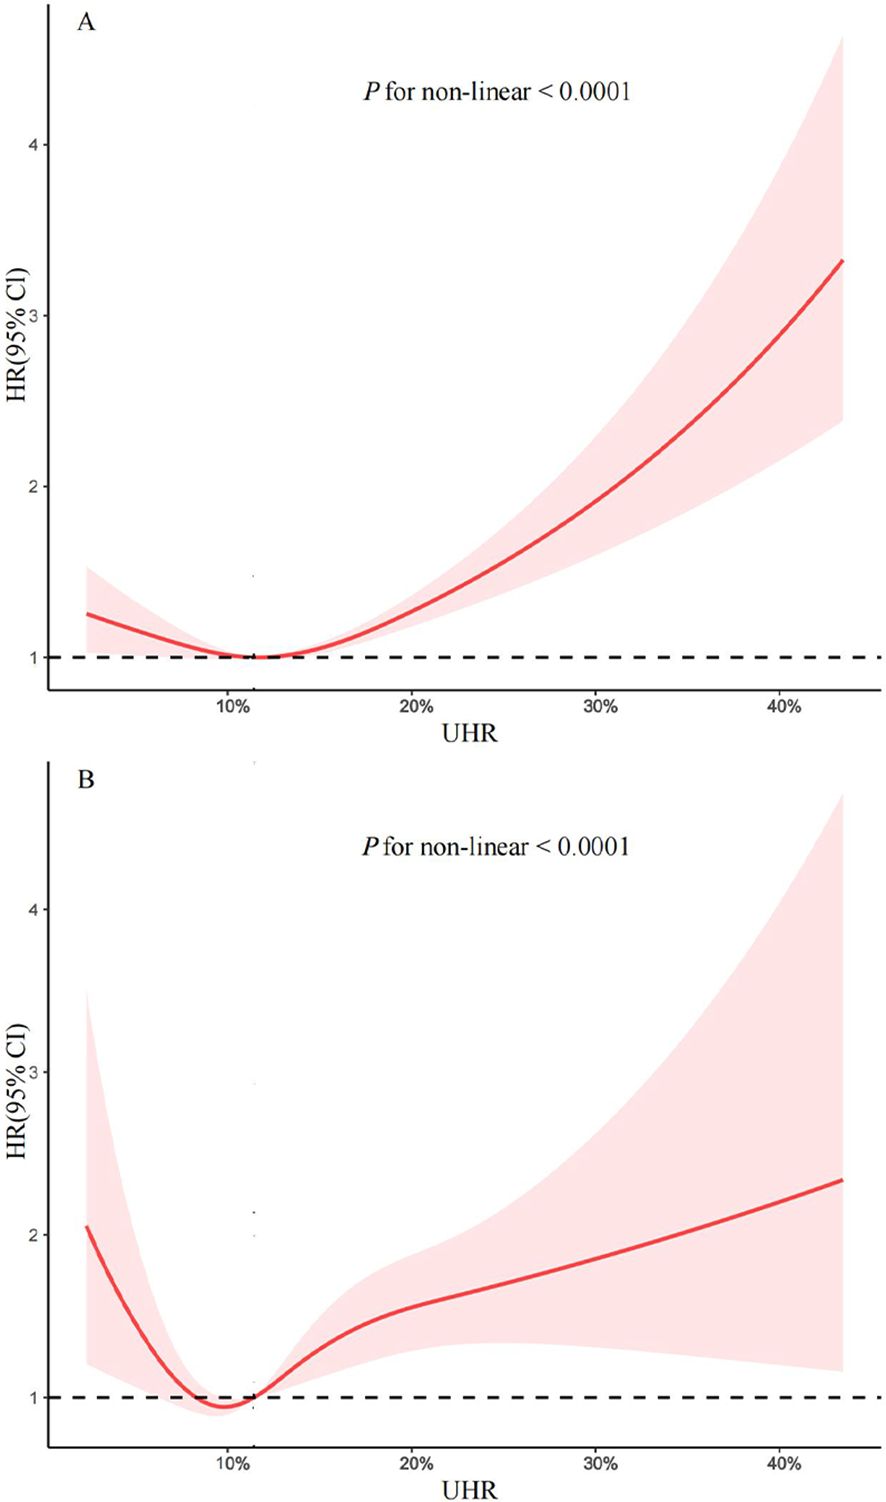
Figure 3. Restricted cubic spline for the association between UHR and all-cause (A) and cardiovascular mortality (B) in patients with diabetes and prediabetes. Adjusted for age, gender, race, marital status, educational level, family income-poverty ratio, body mass index, smoking status, alcohol intake, cardiovascular disease, chronic kidney disease, hypertension, hyperlipidemia, cancer, and HbA1c. The solid line and red area represent the hazard ratio and their corresponding 95% confidence interval, respectively. UHR: uric acid to high-density lipoprotein cholesterol ratio.
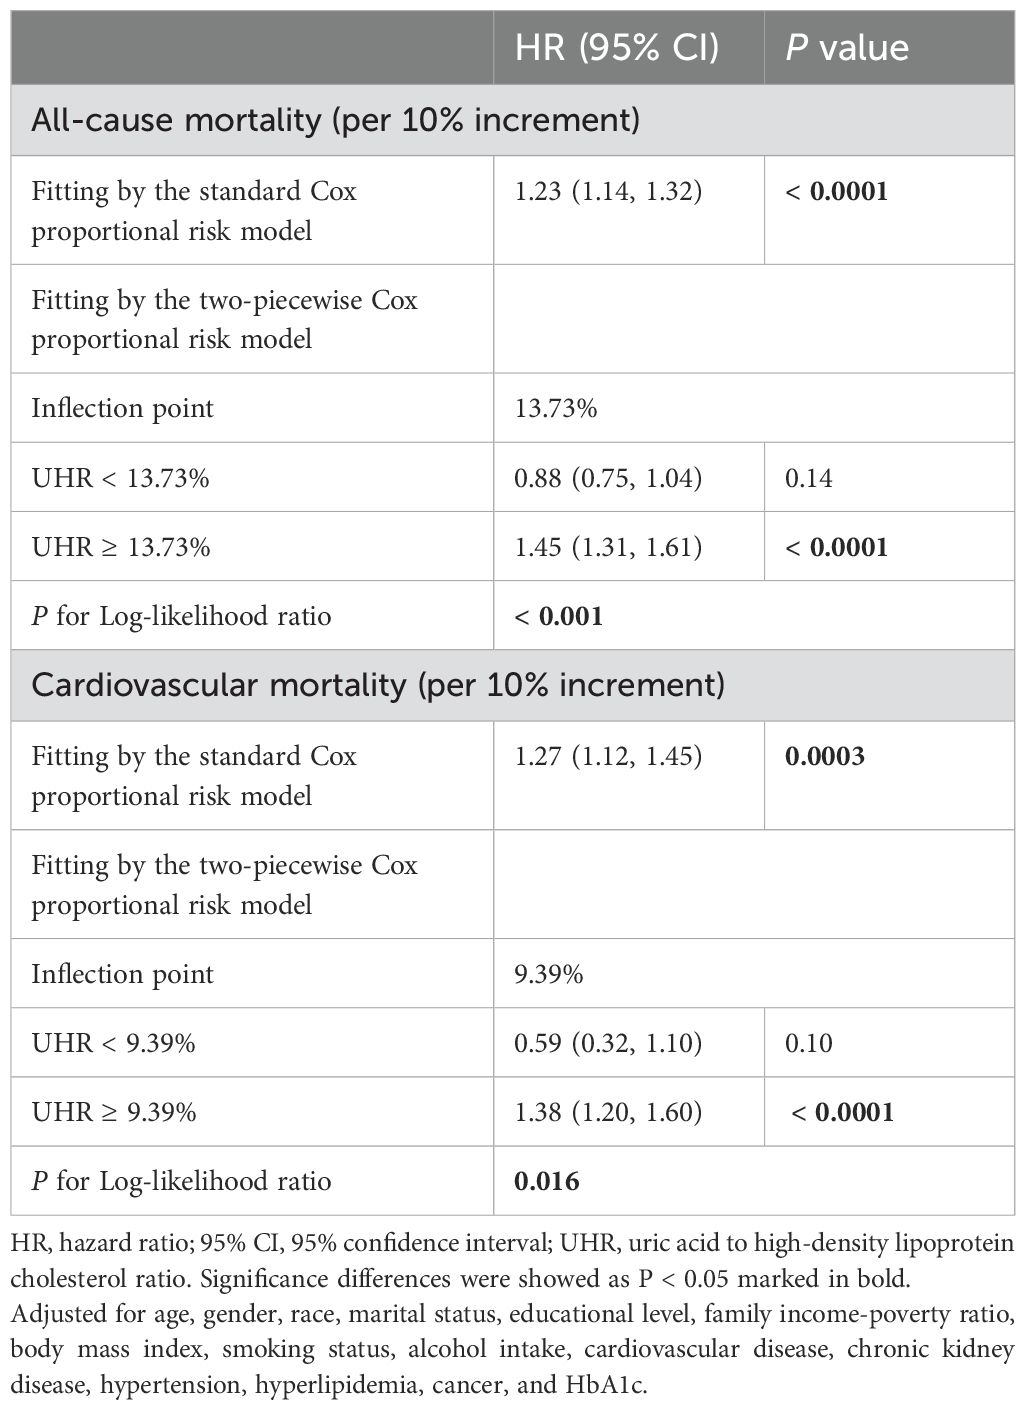
Table 3. Threshold effect analysis of UHR on all-cause and cardiovascular mortality in patients with diabetes or prediabetes.
3.4 Subgroup and sensitivity analyses
With lower UHR (all-cause mortality: < 13.73%, cardiovascular mortality: < 9.39%) as the reference group, the correlation between higher UHR (all-cause mortality: ≥ 13.73%, cardiovascular mortality: ≥ 9.39%) and mortality was analyzed in different subgroups (Tables 4, 5) according to age (< 60 years, ≥ 60 years), sex (male, female), BMI (< 18.5 kg/m2, 18.5-25 kg/m2, 25-30 kg/m2, ≥ 30 kg/m2), cardiovascular disease (yes, no), chronic kidney disease (yes, no), hypertension (yes, no), hyperlipidemia (yes, no), and diabetic condition (prediabetes, diabetes). There was no significant interaction effect between UHR and most stratified variables. However, the correlation of UHR with all-cause mortality was significantly modified by sex (P for interaction = 0.007) and age (P for interaction = 0.006), with a persistent positive correlation observed in women and those aged < 60. Specifically, each 10% increase in UHR was associated with a 31% increase in the risk of all-cause mortality in women (HR: 1.31, 95% CI: 1.13-1.53, P < 0.001) and a 35% increase in the risk of all-cause mortality among patients aged < 60 (HR: 1.35, 95% CI: 1.02-1.80, P = 0.036). In sensitivity analyses, weighted multivariable Cox regression analyses were performed excluding patients who died within two years of follow-up (n = 543) (Supplementary Table 1) or adjusting additionally for antidiabetic, lipid-lowering, and uric acid-lowering medications based on Model 3 (Supplementary Table 2), and the results were similar.
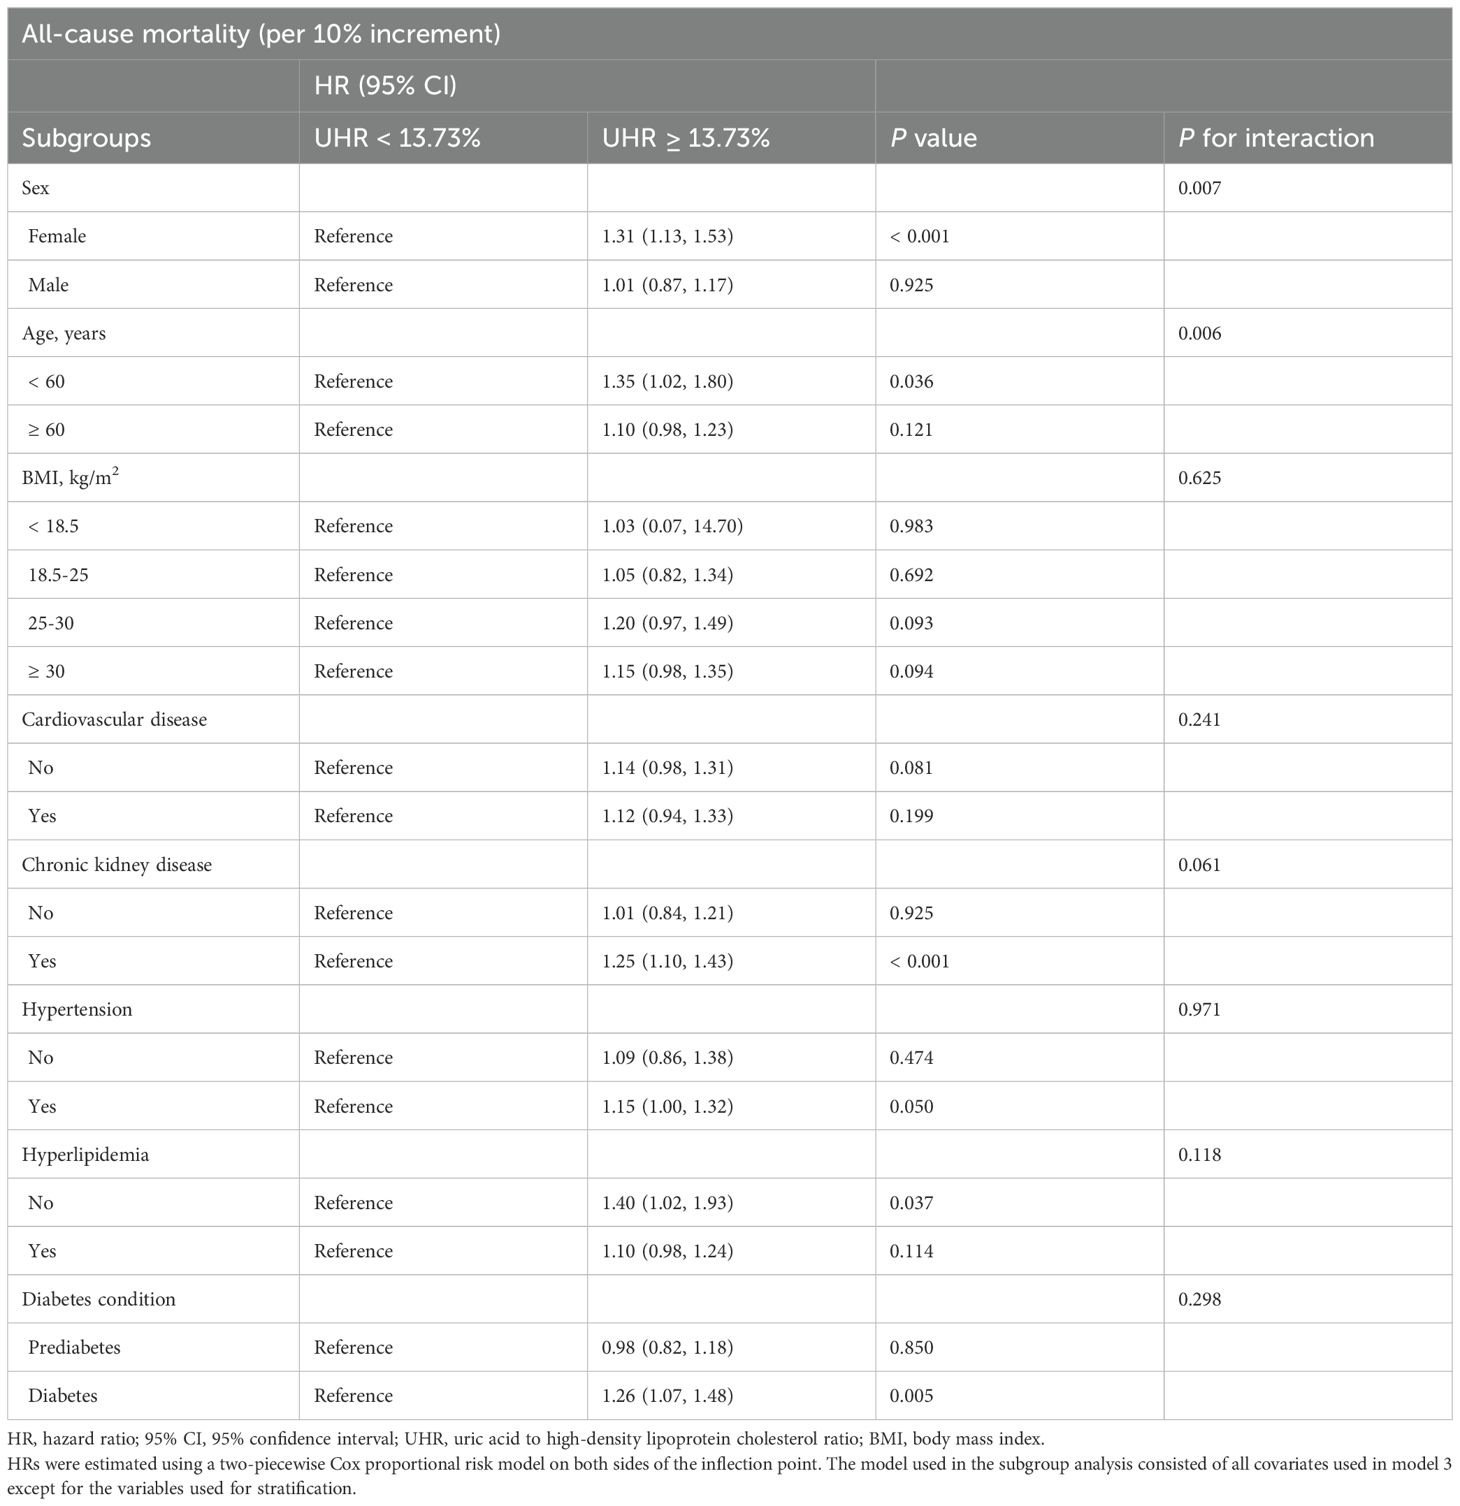
Table 4. Subgroup analyses of the association between the UHR and all-cause mortality.
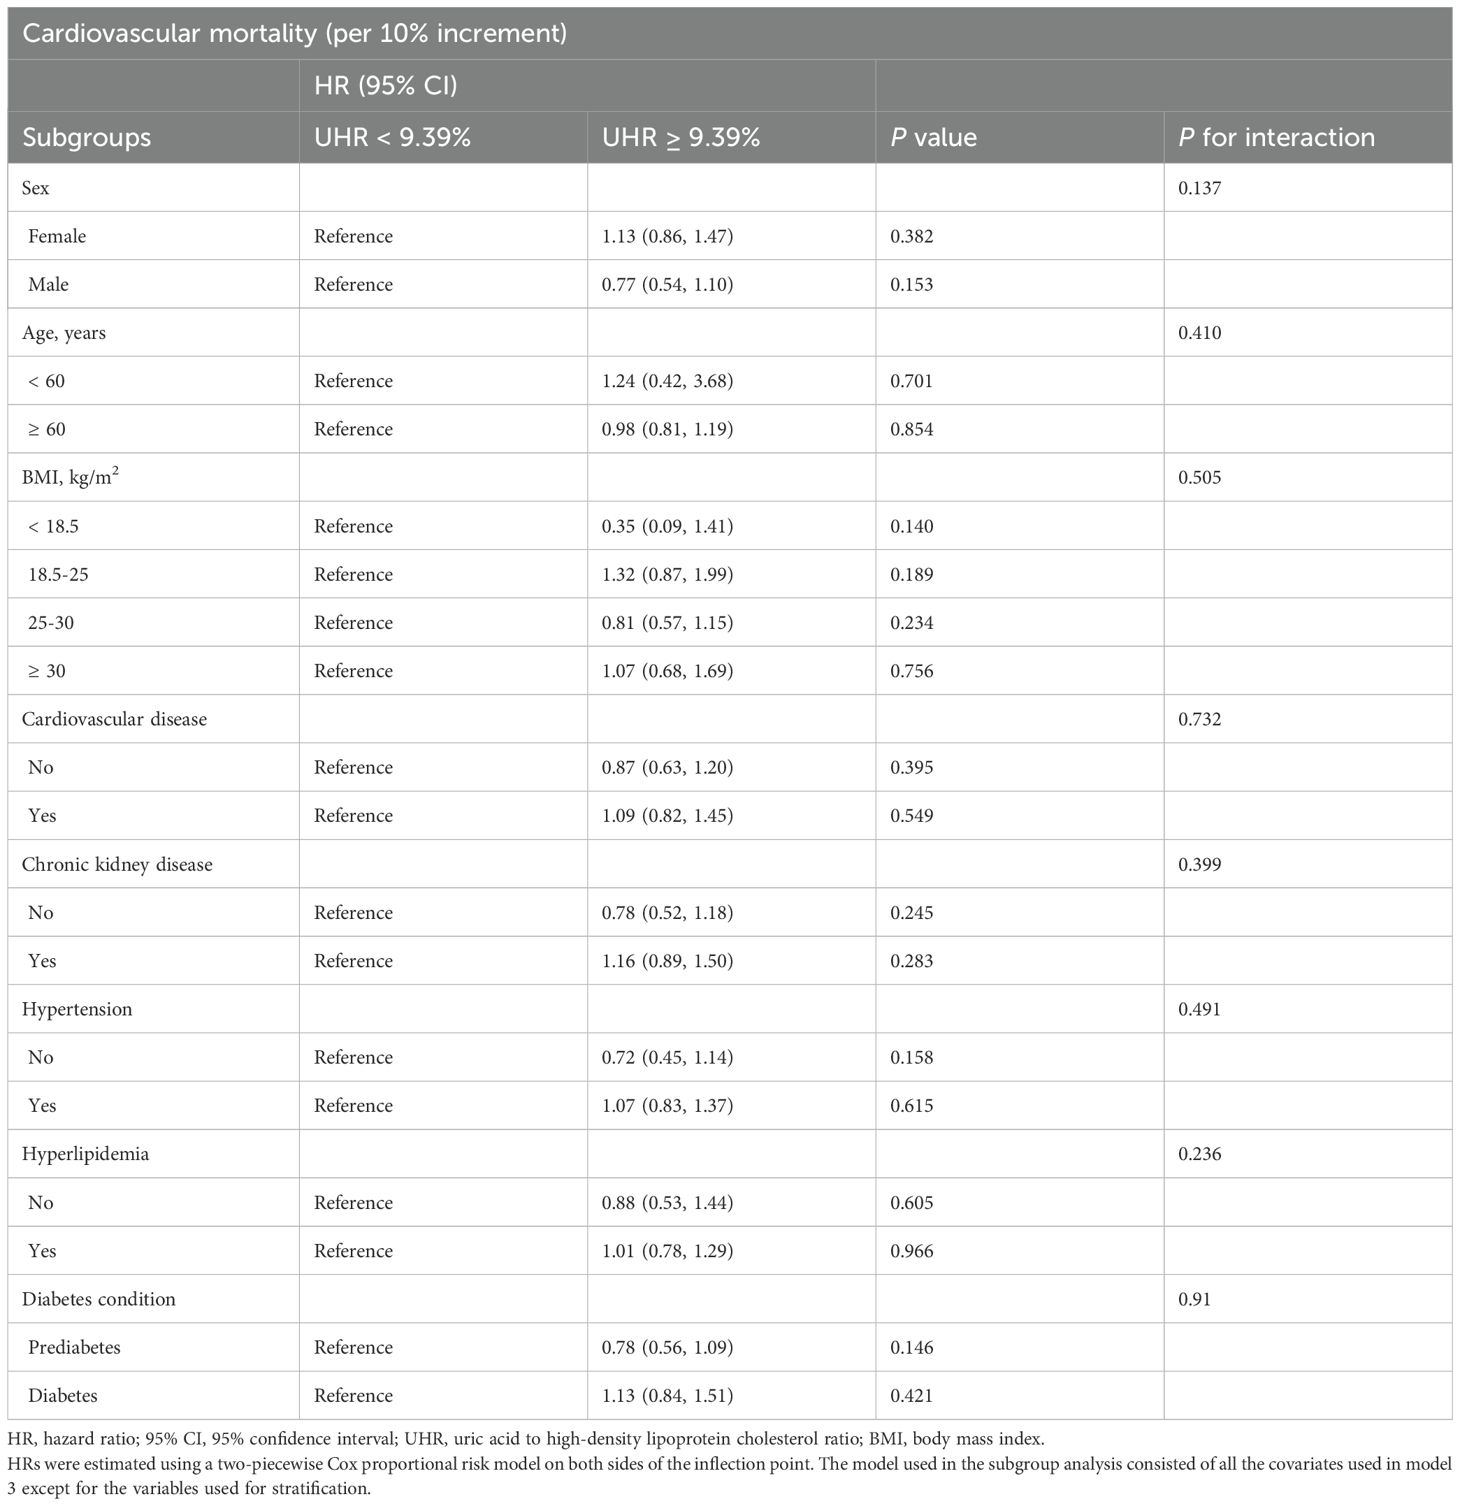
Table 5. Subgroup analyses of the association between the UHR and cardiovascular mortality.
4 Discussion
In this large prospective cohort study of American adults with diabetes or prediabetes, higher UHR was linked to an increased risk of all-cause and cardiovascular mortality. Importantly, these correlations remained significant even after accounting for various potential influencing factors such as demographics, lifestyle, comorbidities, glucose control status, and medication use. In addition, the study revealed a J-shaped association of UHR with the risk of all-cause and cardiovascular mortality, identifying the threshold points (all-cause mortality: 13.73%; cardiovascular mortality: 9.39%). Notably, a higher UHR (≥ threshold) was linked to elevated all-cause mortality in women and those aged < 60 compared to those with a lower UHR. The study underscored the benefits of appropriate management and intervention strategies for serum UA and HDL-C levels in patients with diabetes or prediabetes and the potential of UHR as a prognostic marker.
UA is a metabolite of purines, and hyperuricemia is linked to various adverse health outcomes like chronic kidney disease, cardiovascular disease, and metabolic syndrome (27). As an essential component of lipid metabolism, HDL-C benefits the cardiovascular system by having anti-inflammatory, antioxidant, and vasodilatory properties (28). Previous studies have shown that individuals with elevated serum UA levels and low HDL-C levels have a higher risk of all-cause and cardiovascular mortality in the general population (29, 30). However, this association seems to be more complex in individuals with abnormal glucose metabolism. Several studies examined the potential prognostic value of serum UA in T2DM, but the results have been inconsistent (31–33). Furthermore, a real-world cohort study found no statistically significant connection between HDL-C levels and all-cause and cardiovascular death in individuals with T2DM (34). Nevertheless, a prospective cohort study from the UK Biobank reported that this association may vary by lipoprotein particle size (35). These suggested that a single serum UA or HDL-C levels may not be a good predictor of prognosis for patients with T2DM. UHR, a recently proposed index, combines the cardiovascular risk factor (serum UA) and the cardioprotective factor (HDL-C), associated with inflammation and metabolic disorders. Recent studies have evaluated the clinical significance of UHR in patients with T2DM. Kocak et al. first proposed the UHR and found that it strongly predicted metabolic syndrome and poor glycemic control in T2DM (12). Kosekli et al. reported a significant increase in UHR in individuals with new-onset T2DM (36). Consistent with previous findings (12, 36), we discovered that higher UHR quartiles in diabetes or prediabetes were associated with higher HbA1c levels. Yan et al. explored the relationship between UHR and complications of T2DM in men and postmenopausal women, finding that UHR was positively related to cardiovascular disease and nephropathy but not to retinopathy (37). It is worth noting that individuals with elevated UHR showed a higher prevalence of hyperlipidemia, hypertension, cardiovascular disease, and chronic kidney disease in the current study. These conditions tend to be linked to an increased risk of death, indicating that higher UHR may be associated with poor prognosis. However, it remains unclear whether UHR is linked to elevated mortality in individuals with diabetes or prediabetes.
To our knowledge, this may be the first study to explore the association of UHR with mortality in individuals with diabetes or prediabetes. Our study included 18,804 American adults with diabetes or prediabetes, with a median follow-up of 80 months, revealing that elevated UHR was associated with an increased risk of all-cause and cardiovascular mortality. Limited previous research has explored the prognostic value of UHR (22, 38). Yu et al. reported that high UHR was associated with elevated occurrence of major adverse cardiovascular events (MACEs) and all-cause mortality in patients with acute myocardial infarction, with UHR predicting MACEs and all-cause mortality events with area under the curves (AUC) of 0.716 and 0.711, respectively (22). Furthermore, the study by Yu et al. identified an enhanced prognostic prediction through the interaction between serum UA and HDL-C. Of note, higher serum UA levels and abnormal lipid metabolism (including lower HDL-C levels) are common in individuals with abnormal glucose metabolism (24, 25). The mean (± SE) of UHR in individuals with diabetes or prediabetes was 12.31 ± 0.07%, higher than 10.09 ± 4.23% reported in previous studies in the general population (17). Liu et al. also reported a similar positive correlation between UHR and the risk of cardiovascular deaths in dialysis patients, with subgroup analyses indicating a more pronounced correlation observed in patients with comorbid diabetes (38). Notably, the two studies above had relatively small sample sizes and were limited to the Chinese population. Further exploration and validation are required to determine the prognostic value of UHR.
We also found a J-shaped association between UHR and all-cause and cardiovascular mortality in patients with diabetes or prediabetes. Previous research has also shown a non-linear correlation between serum UA or HDL levels and poor prognosis (39, 40). Lamacchia et al. observed a J-shaped association between serum UA and all-cause mortality in three Italian T2DM cohorts (39). Similarly, Mazza et al. found a J-shaped association between serum UA and coronary mortality in older adults with T2DM (41). Extensive cohort studies from both the United States and China have also indicated that both low and high HDL-C levels are associated with a greater risk of all-cause and cardiovascular mortality (42, 43). Yi et al. identified a U-shaped association between HDL-C and mortality in middle-aged and elderly Koreans (40). The above-mentioned studies may help explain the non-linear relationship between UHR and mortality. In addition, our subgroup analyses revealed a remarkable positive correlation between UHR and all-cause mortality in women and those aged < 60, underscoring the importance of strengthening serum UA and lipid management in these populations to prevent premature death in individuals with abnormal glucose metabolism. Meanwhile, the positive relationship between UHR and the risk of cardiovascular death was not affected by age, sex, various comorbidities, or diabetes conditions. In summary, our findings support the potential prognostic value of UHR in a population with abnormal glucose metabolism, and monitoring and controlling UHR may be beneficial in improving survival.
The association of elevated UHR with increased mortality risk in individuals with abnormal glucose metabolism can be explained by various mechanisms. Overall, it is primarily linked to high serum UA levels, low HDL-C levels, or both. First, serum UA promotes atherosclerosis by inducing vascular endothelial dysfunction, production of inflammatory factors, and by inhibiting autophagy (44, 45). Serum UA can also activate the renin-angiotensin-aldosterone system (RAAS), leading to increased cardiovascular and renal complications (46, 47). Of note, Long-term hyperglycemia exacerbates inflammation, oxidative stress, and activation of the RAAS, ultimately resulting in a poor prognosis for individuals with abnormal glucose metabolism (47). Second, multiple functions of HDL-C are impaired in T2DM, including decreased antioxidant capacity, reduced ability to inhibit inflammatory pathways, and diminished protection of vascular endothelial, all of which indirectly promote the occurrence and development of atherosclerosis (48, 49). Finally, the interaction between high serum UA and low HDL-C may increase inflammation and oxidative stress. On the one hand, it promotes the progression of atherosclerosis and thereby increases the risk of cardiovascular disease (50). On the other hand, it synergistically has adverse effects on cardiovascular, renal, and other organs through IR, thereby increasing the risk of death (51, 52). More importantly, the abnormal state of glucose metabolism exacerbated the link between IR and the risk of cardiovascular disease (53).
There are several limitations of this study. First, Calculating UHR solely based on baseline measurements of serum UA and HDL-C may not capture the dynamic changes over long-term follow-up, potentially impacting the relationship with mortality. Second, despite adjusting for various factors such as demographics, lifestyle, comorbidities, glucose control status, and medication use, residual confounders such as dietary habits and duration of diabetes were not considered. Third, participants in the analysis were exclusively from the United States, and whether the findings are generalizable to other regions remains unknown. Fourth, due to the nature of observational studies, the causal relationship between UHR and mortality may not be established. Despite that, some strengths of our study should be highlighted. First of all, this cohort study utilized an extensive database from a national source with a sizeable sample, a long follow-up period, and relatively reliable data obtained. Second, we used a weighted design according to the NHANES guidelines and performed sensitivity analyses with results consistent with the main findings, thus increasing the credibility of the present study. Finally, we explored the prognostic value of UHR for the first time in diabetic and prediabetic individuals. We also elucidated the threshold points for UHR in all-cause and cardiovascular mortality, respectively. All in all, our study highlights the promising application of UHR in the clinical management of abnormal glucose metabolism populations.
5 Conclusions
The study revealed that elevated UHR was linked to a notable rise in both all-cause mortality (threshold point of 13.73%) and cardiovascular mortality (threshold point of 9.39%) in patients with diabetes or prediabetes. These findings emphasize the importance of monitoring UHR as a potential indicator of increased mortality risk. Therefore, proper management and intervention strategies targeted at regulating serum UA and HDL-C levels would be essential in reducing the likelihood of adverse health outcomes in individuals with abnormal glucose metabolism. Further research is necessary to evaluate the prognostic value of UHR as a clinical indicator and to investigate potential underlying mechanisms.
Data availability statement
Publicly available datasets were analyzed in this study. This data can be found here: https://www.cdc.gov/nchs/nhanes/index.htm.
Ethics statement
The studies involving humans were approved by the Research Ethics Review Board of the National Center for Health Statistics. The studies were conducted in accordance with the local legislation and institutional requirements. The participants provided their written informed consent to participate in this study.
Author contributions
XL: Data curation, Formal analysis, Investigation, Methodology, Project administration, Software, Writing – original draft. TC: Conceptualization, Formal analysis, Investigation, Methodology, Writing – review & editing.
Funding
The author(s) declare that no financial support was received for the research, authorship, and/or publication of this article.
Acknowledgments
We thank all NHANES participants and staff for their contributions and the NHANES databases for providing accessible data.
Conflict of interest
The authors declare that the research was conducted in the absence of any commercial or financial relationships that could be construed as a potential conflict of interest.
Publisher’s note
All claims expressed in this article are solely those of the authors and do not necessarily represent those of their affiliated organizations, or those of the publisher, the editors and the reviewers. Any product that may be evaluated in this article, or claim that may be made by its manufacturer, is not guaranteed or endorsed by the publisher.
Supplementary material
The Supplementary Material for this article can be found online at: https://www.frontiersin.org/articles/10.3389/fendo.2024.1476336/full#supplementary-material
References
1. Sun H, Saeedi P, Karuranga S, Pinkepank M, Ogurtsova K, Duncan BB, et al. Idf diabetes atlas: global, regional and country-level diabetes prevalence estimates for 2021 and projections for 2045. Diabetes Res Clin Pract. (2022) 183:109119. doi: 10.1016/j.diabres.2021.109119
2. Tabák AG, Herder C, Rathmann W, Brunner EJ, Kivimäki M. Prediabetes: A high-risk state for diabetes development. Lancet. (2012) 379:2279–90. doi: 10.1016/s0140-6736(12)60283-9
3. Cai X, Zhang Y, Li M, Wu JH, Mai L, Li J, et al. Association between prediabetes and risk of all cause mortality and cardiovascular disease: updated meta-analysis. Bmj. (2020) 370:m2297. doi: 10.1136/bmj.m2297
4. Li W, Wang A, Jiang J, Liu G, Wang M, Li D, et al. Risk of chronic kidney disease defined by decreased estimated glomerular filtration rate in individuals with different prediabetic phenotypes: results from a prospective cohort study in China. BMJ Open Diabetes Res Care. (2020) 8:e000955. doi: 10.1136/bmjdrc-2019-000955
5. Huang Y, Cai X, Qiu M, Chen P, Tang H, Hu Y, et al. Prediabetes and the risk of cancer: A meta-analysis. Diabetologia. (2014) 57:2261–9. doi: 10.1007/s00125-014-3361-2
6. Schlesinger S, Neuenschwander M, Barbaresko J, Lang A, Maalmi H, Rathmann W, et al. Prediabetes and risk of mortality, diabetes-related complications and comorbidities: umbrella review of meta-analyses of prospective studies. Diabetologia. (2022) 65:275–85. doi: 10.1007/s00125-021-05592-3
7. Echouffo-Tcheugui JB, Perreault L, Ji L, Dagogo-Jack S. Diagnosis and management of prediabetes: A review. Jama. (2023) 329:1206–16. doi: 10.1001/jama.2023.4063
8. Raghavan S, Vassy JL, Ho YL, Song RJ, Gagnon DR, Cho K, et al. Diabetes mellitus-related all-cause and cardiovascular mortality in a national cohort of adults. J Am Heart Assoc. (2019) 8:e011295. doi: 10.1161/jaha.118.011295
9. Kolahi Ahari R, Mansoori A, Sahranavard T, Miri MS, Feizi S, Esmaily H, et al. Serum uric acid to high-density lipoprotein ratio as a novel indicator of inflammation is correlated with the presence and severity of metabolic syndrome: A large-scale study. Endocrinol Diabetes Metab. (2023) 6:e446. doi: 10.1002/edm2.446
10. Zhou X, Xu J. Association between serum uric acid-to-high-density lipoprotein cholesterol ratio and insulin resistance in patients with type 2 diabetes mellitus. J Diabetes Investig. (2024) 15:113–20. doi: 10.1111/jdi.14086
11. Zhou X, Xu J. Association between serum uric acid-to-high-density lipoprotein cholesterol ratio and insulin resistance in an American population: A population-based analysis. J Diabetes Investig. (2024) 15:762–71. doi: 10.1111/jdi.14170
12. Kocak MZ, Aktas G, Erkus E, Sincer I, Atak B, Duman T. Serum uric acid to Hdl-cholesterol ratio is a strong predictor of metabolic syndrome in type 2 diabetes mellitus. Rev Assoc Med Bras (1992). (2019) 65:9–15. doi: 10.1590/1806-9282.65.1.9
13. Yu X, Sun F, Ming J, Liang S, Zhang W, Wang L, et al. Serum uric acid to high-density lipoprotein cholesterol ratio is a promising marker for identifying metabolic syndrome in nondiabetic Chinese men. Postgrad Med. (2023) 135:741–9. doi: 10.1080/00325481.2023.2263372
14. Zhao H, Qiu X, Li HZ, Cui JJ, Sun YY. Association between serum uric acid to Hdl-cholesterol ratio and nonalcoholic fatty liver disease risk among Chinese adults. BioMed Environ Sci. (2023) 36:1–9. doi: 10.3967/bes2022.111
15. Xie Y, Huang K, Zhang X, Wu Z, Wu Y, Chu J, et al. Association of serum uric acid-to-high-density lipoprotein cholesterol ratio with non-alcoholic fatty liver disease in American adults: A population-based analysis. Front Med (Lausanne). (2023) 10:1164096. doi: 10.3389/fmed.2023.1164096
16. Balci SB, Atak BM, Duman T, Ozkul FN, Aktas G. A novel marker for prediabetic conditions: uric acid-to-Hdl cholesterol ratio. Bratisl Lek Listy. (2024) 125:145–8. doi: 10.4149/bll_2023_130
17. Zhang YN, Wang QQ, Chen YS, Shen C, Xu CF. Association between serum uric acid to Hdl-cholesterol ratio and nonalcoholic fatty liver disease in lean Chinese adults. Int J Endocrinol. (2020) 2020:5953461. doi: 10.1155/2020/5953461
18. Wang H, Ba Y, Gao X, Zhuo J, Li Y, Sun J, et al. Association between serum uric acid to high density lipoprotein-cholesterol ratio and arterial stiffness in a Japanese population. Med (Baltimore). (2023) 102:e34182. doi: 10.1097/md.0000000000034182
19. Deng F, Jia F, Sun Y, Zhang L, Han J, Li D, et al. Predictive value of the serum uric acid to high-density lipoprotein cholesterol ratio for culprit plaques in patients with acute coronary syndrome. BMC Cardiovasc Disord. (2024) 24:155. doi: 10.1186/s12872-024-03824-z
20. Park B, Jung DH, Lee YJ. Predictive value of serum uric acid to Hdl cholesterol ratio for incident ischemic heart disease in non-diabetic Koreans. Biomedicines. (2022) 10:1422. doi: 10.3390/biomedicines10061422
21. Yang Y, Shen XY, Tang HX, Liu H, Wen Y. Sex differences in the association of the uric acid to high-density lipoprotein cholesterol ratio with coronary artery disease risk among Chinese nondialysis patients with Ckd stages 3-5. Nutr Metab Cardiovasc Dis. (2024) 34:1546–53. doi: 10.1016/j.numecd.2024.03.003
22. Yang Y, Zhang J, Jia L, Su J, Ma M, Lin X. the interaction between uric acid and high-density lipoprotein cholesterol on the prognosis of patients with acute myocardial infarction. Front Cardiovasc Med. (2023) 10:1226108. doi: 10.3389/fcvm.2023.1226108
23. Liu P, Li J, Yang L, Zhang Z, Zhao H, Zhao N, et al. Association between cumulative uric acid to high-density lipoprotein cholesterol ratio and the incidence and progression of chronic kidney disease. Front Endocrinol (Lausanne). (2023) 14:1269580. doi: 10.3389/fendo.2023.1269580
24. Kumar A, Singh V. Atherogenic dyslipidemia and diabetes mellitus: what’s new in the management arena? Vasc Health Risk Manag. (2010) 6:665–9. doi: 10.2147/vhrm.s5686
25. King C, Lanaspa MA, Jensen T, Tolan DR, Sánchez-Lozada LG, Johnson RJ. Uric acid as a cause of the metabolic syndrome. Contrib Nephrol. (2018) 192:88–102. doi: 10.1159/000484283
26. ElSayed NA, Aleppo G, Bannuru RR, Bruemmer D, Collins BS, Ekhlaspour L, et al. Diagnosis and classification of diabetes: standards of care in diabetes-2024. Diabetes Care. (2024) 47:S20–s42. doi: 10.2337/dc24-S002
27. Yanai H, Adachi H, Hakoshima M, Katsuyama H. Molecular biological and clinical understanding of the pathophysiology and treatments of hyperuricemia and its association with metabolic syndrome, cardiovascular diseases and chronic kidney disease. Int J Mol Sci. (2021) 22:9221. doi: 10.3390/ijms22179221
28. Nagao M, Nakajima H, Toh R, Hirata KI, Ishida T. Cardioprotective effects of high-density lipoprotein beyond its anti-atherogenic action. J Atheroscler Thromb. (2018) 25:985–93. doi: 10.5551/jat.RV17025
29. Ahmed HM, Miller M, Nasir K, McEvoy JW, Herrington D, Blumenthal RS, et al. Primary low level of high-density lipoprotein cholesterol and risks of coronary heart disease, cardiovascular disease, and death: results from the multi-ethnic study of atherosclerosis. Am J Epidemiol. (2016) 183:875–83. doi: 10.1093/aje/kwv305
30. Mazidi M, Katsiki N, Mikhailidis DP, Banach M. Associations of serum uric acid with total and cause-specific mortality: findings from individuals and pooling prospective studies. Atherosclerosis. (2020) 296:49–58. doi: 10.1016/j.atherosclerosis.2019.07.019
31. Ong G, Davis WA, Davis TM. Serum uric acid does not predict cardiovascular or all-cause mortality in type 2 diabetes: the fremantle diabetes study. Diabetologia. (2010) 53:1288–94. doi: 10.1007/s00125-010-1735-7
32. Li B, Chen L, Hu X, Tan T, Yang J, Bao W, et al. Association of serum uric acid with all-cause and cardiovascular mortality in diabetes. Diabetes Care. (2023) 46:425–33. doi: 10.2337/dc22-1339
33. Shao Y, Shao H, Sawhney MS, Shi L. Serum uric acid as a risk factor of all-cause mortality and cardiovascular events among type 2 diabetes population: meta-analysis of correlational evidence. J Diabetes Complications. (2019) 33:107409. doi: 10.1016/j.jdiacomp.2019.07.006
34. Fanni G, Rosato R, Gentile L, Anselmino M, Frea S, Ponzo V, et al. Is Hdl cholesterol protective in patients with type 2 diabetes? A retrospective population-based cohort study. J Transl Med. (2020) 18:189. doi: 10.1186/s12967-020-02357-1
35. Li R, Chen JX, Lu Q, Geng TT, Xia PF, Wang Y, et al. Associations of lipoprotein subclasses with risk of all-cause and cardiovascular disease mortality in individuals with type 2 diabetes: A prospective cohort study. Diabetes Obes Metab. (2023) 25:3259–67. doi: 10.1111/dom.15224
36. Kosekli MA, Aktas G. Serum uric acid to Hdl cholesterol ratio is associated with diabetic control in new onset type 2 diabetic population. Acta Clin Croat. (2023) 62:277–82. doi: 10.20471/acc.2023.62.02.04
37. Xuan Y, Zhang W, Wang Y, Wang B, Xia F, Zhang K, et al. Association between uric acid to Hdl cholesterol ratio and diabetic complications in men and postmenopausal women. Diabetes Metab Syndr Obes. (2023) 16:167–77. doi: 10.2147/dmso.S387726
38. Liu R, Peng Y, Wu H, Diao X, Ye H, Huang X, et al. Uric acid to high-density lipoprotein cholesterol ratio predicts cardiovascular mortality in patients on peritoneal dialysis. Nutr Metab Cardiovasc Dis. (2021) 31:561–9. doi: 10.1016/j.numecd.2020.10.005
39. Lamacchia O, Fontana A, Pacilli A, Copetti M, Fariello S, Garofolo M, et al. On the non-linear association between serum uric acid levels and all-cause mortality rate in patients with type 2 diabetes mellitus. Atherosclerosis. (2017) 260:20–6. doi: 10.1016/j.atherosclerosis.2017.03.008
40. Yi SW, Park SJ, Yi JJ, Ohrr H, Kim H. High-density lipoprotein cholesterol and all-cause mortality by sex and age: A prospective cohort study among 15.8 million adults. Int J Epidemiol. (2021) 50:902–13. doi: 10.1093/ije/dyaa243
41. Mazza A, Zamboni S, Rizzato E, Pessina AC, Tikhonoff V, Schiavon L, et al. Serum uric acid shows a J-shaped trend with coronary mortality in non-insulin-dependent diabetic elderly people. The cardiovascular study in the elderly (Castel). Acta Diabetol. (2007) 44:99–105. doi: 10.1007/s00592-007-0249-3
42. Lu J, Han G, Liu X, Chen B, Peng K, Shi Y, et al. Association of high-density lipoprotein cholesterol with all-cause and cause-specific mortality in a Chinese population of 3.3 million adults: A prospective cohort study. Lancet Reg Health West Pac. (2024) 42:100874. doi: 10.1016/j.lanwpc.2023.100874
43. Mazidi M, Mikhailidis DP, Banach M. Associations between risk of overall mortality, cause-specific mortality and level of inflammatory factors with extremely low and high high-density lipoprotein cholesterol levels among American adults. Int J Cardiol. (2019) 276:242–7. doi: 10.1016/j.ijcard.2018.11.095
44. Khosla UM, Zharikov S, Finch JL, Nakagawa T, Roncal C, Mu W, et al. Hyperuricemia induces endothelial dysfunction. Kidney Int. (2005) 67:1739–42. doi: 10.1111/j.1523-1755.2005.00273.x
45. Yu W, Liu W, Xie D, Wang Q, Xu C, Zhao H, et al. High level of uric acid promotes atherosclerosis by targeting Nrf2-mediated autophagy dysfunction and ferroptosis. Oxid Med Cell Longev. (2022) 2022:9304383. doi: 10.1155/2022/9304383
46. Filiopoulos V, Hadjiyannakos D, Vlassopoulos D. New insights into uric acid effects on the progression and prognosis of chronic kidney disease. Ren Fail. (2012) 34:510–20. doi: 10.3109/0886022x.2011.653753
47. Lytvyn Y, Perkins BA, Cherney DZ. Uric acid as a biomarker and a therapeutic target in diabetes. Can J Diabetes. (2015) 39:239–46. doi: 10.1016/j.jcjd.2014.10.013
48. Denimal D. Antioxidant and anti-inflammatory functions of high-density lipoprotein in type 1 and type 2 diabetes. Antioxid. (Basel). (2023) 13:57. doi: 10.3390/antiox13010057
49. Sorrentino SA, Besler C, Rohrer L, Meyer M, Heinrich K, Bahlmann FH, et al. Endothelial-Vasoprotective Effects of High-Density Lipoprotein Are Impaired in Patients with Type 2 Diabetes Mellitus but Are Improved after Extended-Release Niacin Therapy. Circulation. (2010) 121:110–22. doi: 10.1161/circulationaha.108.836346
50. Hu X, Liu J, Li W, Wang C, Li G, Zhou Y, et al. Elevated serum uric acid was associated with pre-inflammatory state and impacted the role of Hdl-C on carotid atherosclerosis. Nutr Metab Cardiovasc Dis. (2022) 32:1661–9. doi: 10.1016/j.numecd.2022.03.026
51. Zhu Y, Hu Y, Huang T, Zhang Y, Li Z, Luo C, et al. High uric acid directly inhibits insulin signalling and induces insulin resistance. Biochem Biophys Res Commun. (2014) 447:707–14. doi: 10.1016/j.bbrc.2014.04.080
52. Manandhar B, Cochran BJ, Rye KA. Role of high-density lipoproteins in cholesterol homeostasis and glycemic control. J Am Heart Assoc. (2020) 9:e013531. doi: 10.1161/jaha.119.013531
Keywords: UHR, mortality, diabetes, prediabetes, NHANES, J-shaped association
Citation: Lai X and Chen T (2024) Association of serum uric acid to high-density lipoprotein cholesterol ratio with all-cause and cardiovascular mortality in patients with diabetes or prediabetes: a prospective cohort study. Front. Endocrinol. 15:1476336. doi: 10.3389/fendo.2024.1476336
Received: 05 August 2024; Accepted: 19 November 2024;
Published: 05 December 2024.
Edited by:
Sonja S. Zafirovic, VINČA Institute of Nuclear Sciences - National Institute of the Republic of Serbia, SerbiaReviewed by:
Julijana Stanimirovic, University of Belgrade, SerbiaAnastasija Panić, University of Belgrade, Serbia
Copyright © 2024 Lai and Chen. This is an open-access article distributed under the terms of the Creative Commons Attribution License (CC BY). The use, distribution or reproduction in other forums is permitted, provided the original author(s) and the copyright owner(s) are credited and that the original publication in this journal is cited, in accordance with accepted academic practice. No use, distribution or reproduction is permitted which does not comply with these terms.
*Correspondence: Tao Chen, Y2l0eWNyZWVrQDE2My5jb20=