 Heng Liu
 Huqiang Dong
 Yu Zhou1†
 Mingchu Jin
- 1Department of Urology, Renmin Hospital, Hubei University of Medicine, Shiyan, Hubei, China
- 2School of Public Health, Ningxia Medical University, Yinchuan, Ningxia, China
Background: Depression is a common mental illness with a high prevalence in overweight or obese individuals. Recent studies suggest that the Metabolic Score for Visceral Fat (METS-VF) is a novel metric for assessing visceral fat levels, potentially linking metabolic disturbances to depression. This study explores the association between METS-VF and depression severity in overweight or obese U.S. adults.
Methods: Data were obtained from the National Health and Nutrition Examination Survey (NHANES) 2007-2018 dataset, including 9,415 overweight or obese participants. Depression severity was measured using the Patient Health Questionnaire-9 (PHQ-9). To assess the association between METS-VF and depression, the study methodology included multivariate logistic regression, subgroup analyses, generalized additive model (GAM), and smoothed curve fitting. This study also calculated BMI for the Non-Hispanic Asian population from 2011-2018 and incorporated this data as part of a sensitivity analysis.
Results: Elevated levels of METS-VF in overweight or obese participants were significantly associated with increased PHQ-9 scores and an increased likelihood of depression. Notably, this association remained significant after adjustment for multiple covariates. Smoothed curve-fitting plots showed no nonlinear association between METS-VF and PHQ-9 scores. Subgroup analyses confirmed the robustness of these results across populations, particularly among people under the age of fifty. The sensitivity analyses confirmed the robustness of the results in this study.
Conclusion: METS-VF levels were positively associated with depression severity and the likelihood of depression in overweight or obese individuals, with the association being particularly pronounced in people under 50 years of age.
1 Background
Depression is a prevalent mental illness marked by persistently low mood, sleep or eating disturbances, excessive fatigue, loss of interest in activities, and intense feelings of guilt (1, 2). At now, estimates put the number of individuals affected by the illness at around 300 million globally, and the prevalence is rising annually (3). In terms of death, depression is just second to heart disease (4). Depression imposes a severe economic burden on individuals, families, society, and the healthcare system. It also has a serious impact on patients’ quality of life and leads to an increased risk of suicide (2, 5). However, studies have shown that the treatment of depression often lacks effectiveness and has a high rate of recurrence (6). Therefore, it is necessary to explore the influencing factors that may contribute to the development of depression and to provide early intervention.
Psychological, social, and physiological variables are among the risk factors for depression. Research has demonstrated a high correlation between obesity and the onset of depression among physiological parameters (7, 8). When it comes to depression in women, those who are obese are more likely to experience it than those who are not (1, 9). It has been shown that obesity significantly impacts diseases such as cardiovascular disease and cancer (10–12). It is also associated with psychiatric conditions, including mental and mood disorders (13, 14). These conditions, in turn, can lead to unhealthy diets and exacerbate the occurrence of overweight or obesity (15). BMI is a commonly used indicator of obesity. Nevertheless, its use in evaluating the body’s distribution of adipose tissue is limited (16). Therefore, a new index of obesity has been developed, called the Metabolic Score of Visceral Fat (METS-VF) (17, 18). This index has been shown to significantly measure other diseases, including fatty liver and diabetes, compared to other measures of obesity (19, 20). The connection between METS-VF and depression is still not well understood, despite significant advancements. By exploring the intricate connections between metabolic health and mental well-being, we can unlock new pathways for early intervention and tailored treatment approaches.
2 Materials and methods
2.1 Study population
NHANES, a project by the National Center for Health Statistics (NCHS), continuously assesses the health and nutritional status of the U.S. population. Trained personnel collected comprehensive data on socio-economic status, demographics, diet, and health from NHANES participants. In the present study, we downloaded six consecutive datasets (2007-2008, 2009-2010, 2011-2012, 2013-2014, 2015-2016, and 2017-2018) from the website to precisely evaluate the association between METS-VF and depression in overweight or obese patients. Of the total sample of 59,842 participants, 50,427 were excluded due to missing PHQ-9 scores and METS-VF data, having a BMI < 25, or being under 20 years old. Finally, 9,415 US patients who were overweight or obese were included in the analyses (Figure 1).
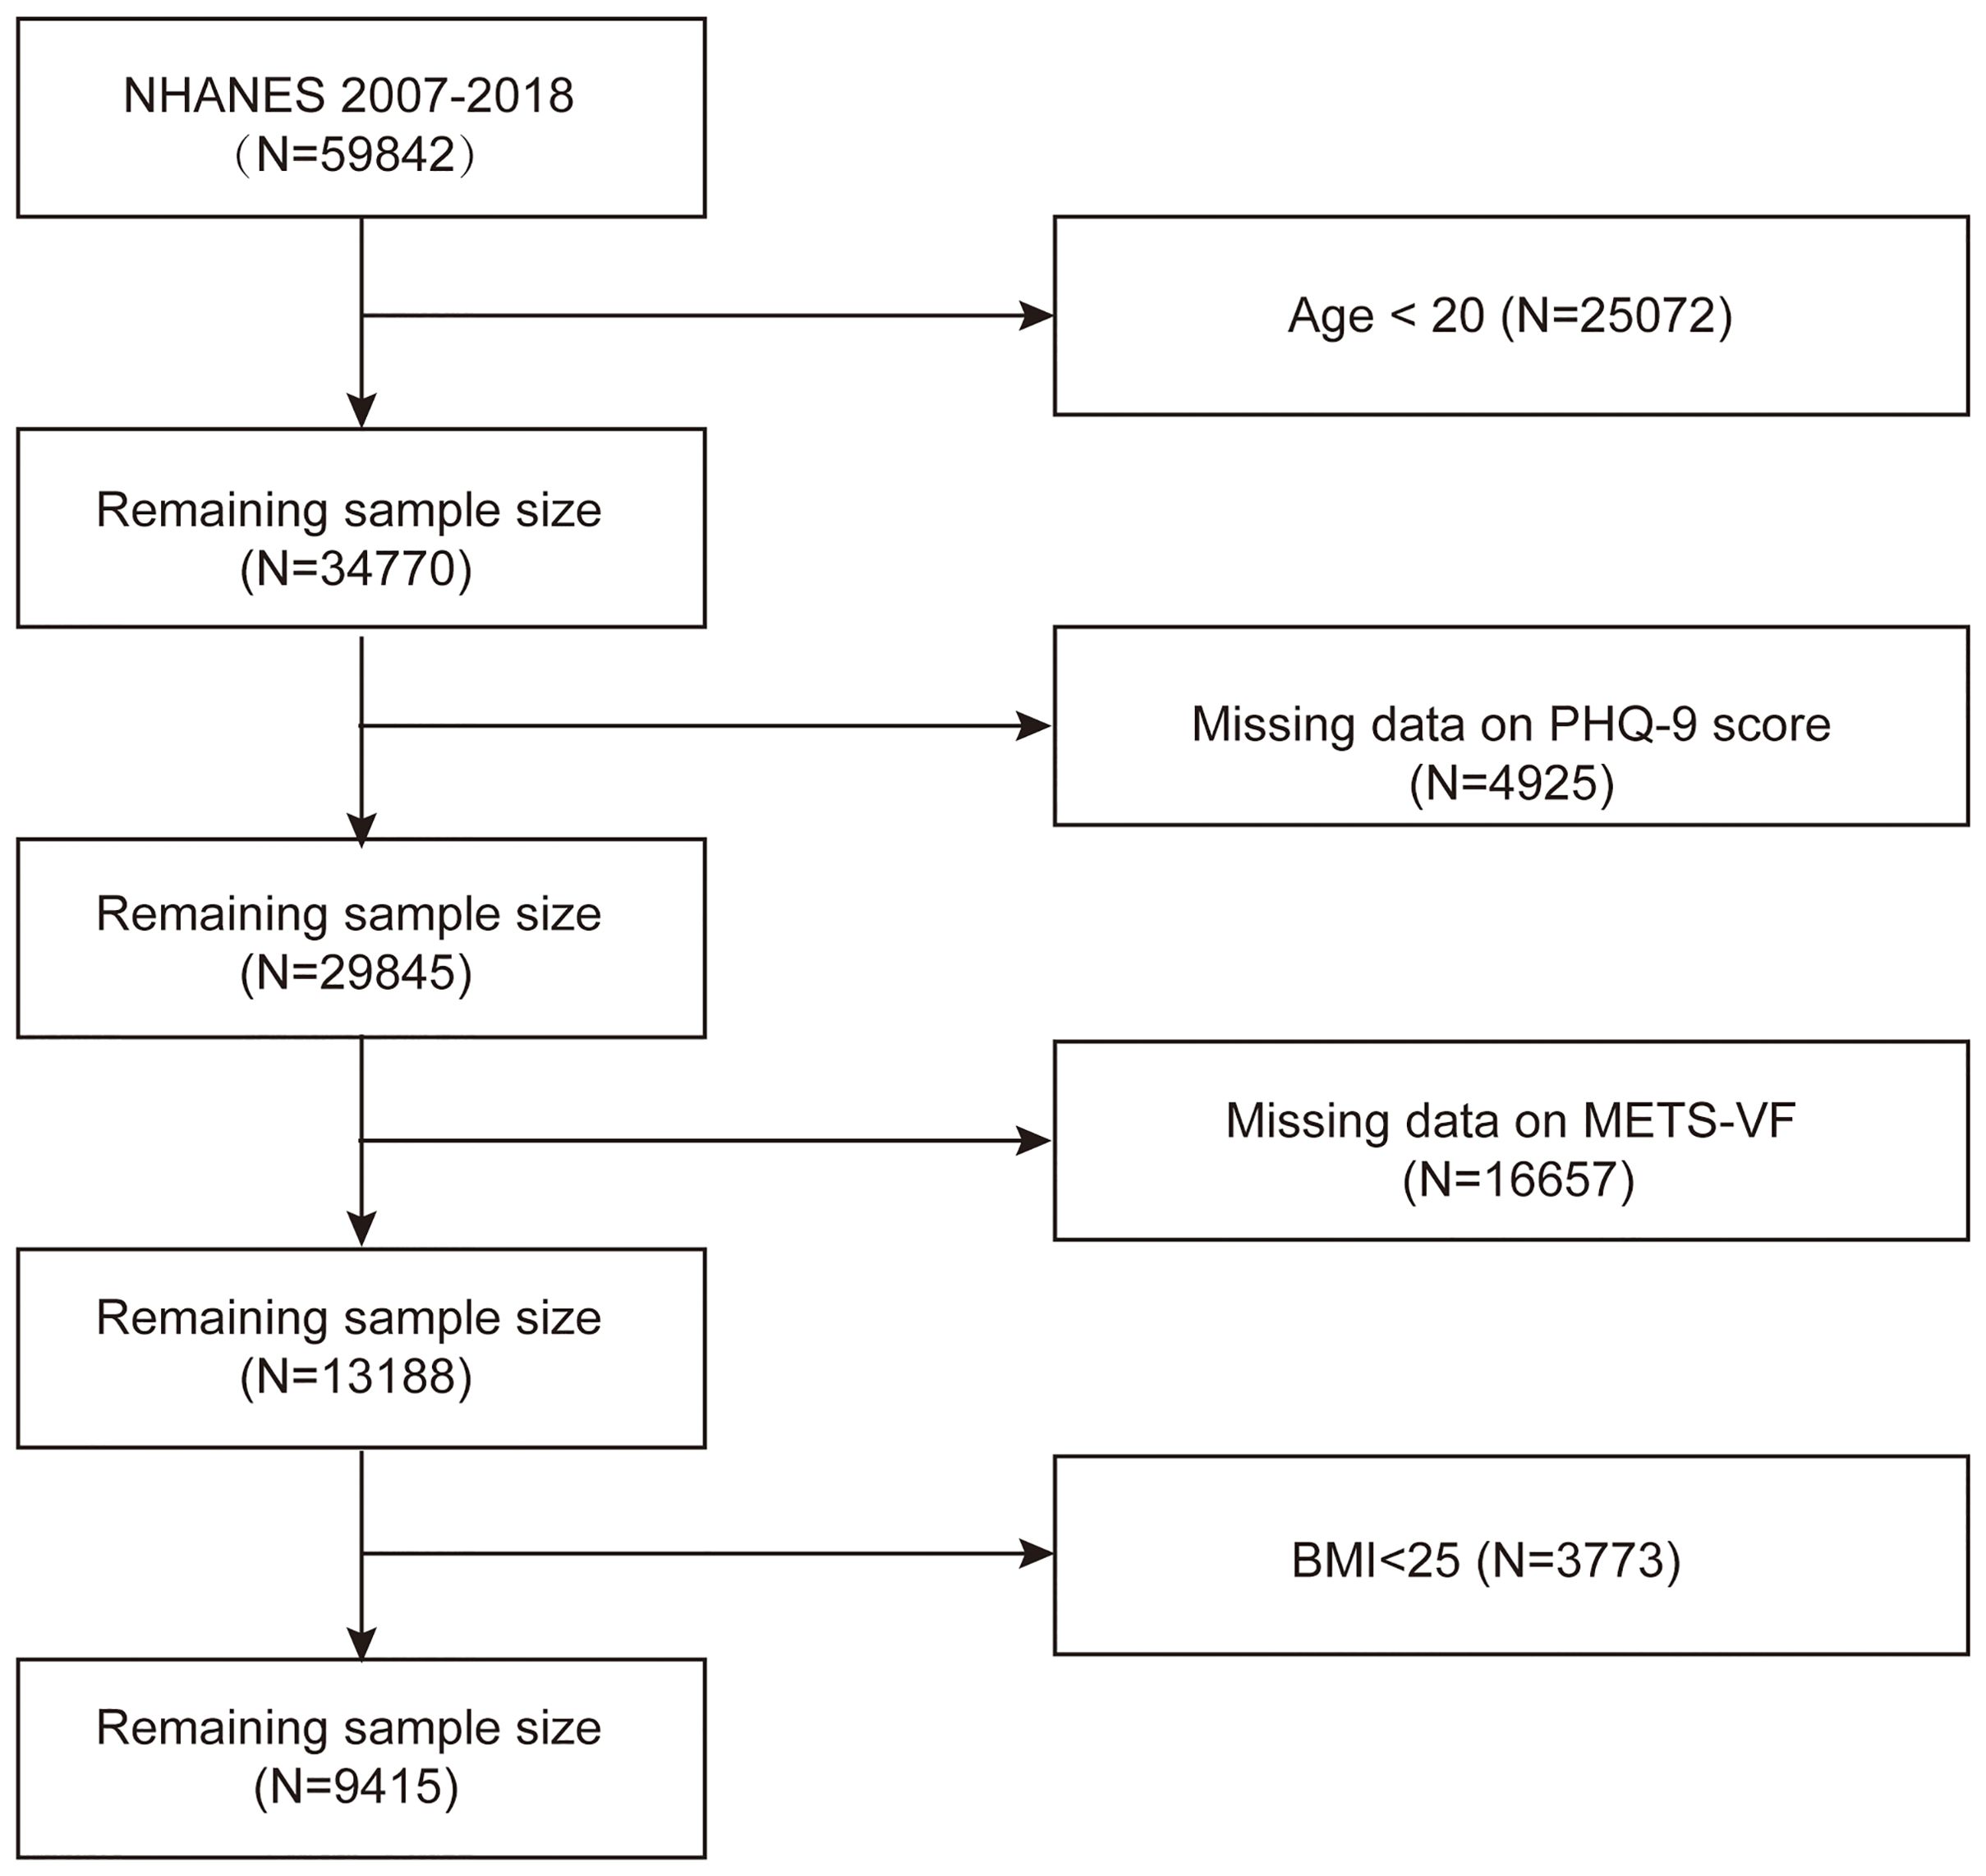
Figure 1. Flow chart of sample selection from the NHANES 2007–2018.
2.2 Assessment of depression
The PHQ-9 is a widely used depression screening questionnaire with 9 items, each scored from 0 to 3, resulting in a total score between 0 and 27 (21). A score of 10 or more suggests the presence of depression and is a validated threshold commonly used in epidemiological studies (22).
2.3 Evaluation of the METS-VF
The METS-VF assesses exposure to adipose tissue, incorporating the insulin resistance index (METS-IR), waist-to-height ratio (WHTR), age, and sex. At the Mobile Examination Center, professional technicians measure BMI, waist circumference, and height. HDL-C and triglycerides are analyzed with the Cobas 6000 Chemistry Analyzer, and fasting blood glucose is measured using the Roche/Hitachi Cobas C311 Chemistry Analyzer. Measurements use specific units: FBG and HDL-C in mg/dL, TG in mg/dL, BMI in kg/m², age in years, and sex coded as male = 1, female = 0. The METS-VF was calculated using the following formula (18):
2.4 Assessment of overweight and obesity
According to the recommendations of the World Health Organization (WHO), overweight and obese adults are classified based on BMI, which is defined as weight divided by height squared (kg/m²). The classifications are as follows: overweight BMI: 25-29.9 kg/m²; obese BMI ≥30 kg/m². However, Asian Americans face a higher risk of metabolic disease than other populations at the same BMI level due to a tendency toward central obesity. For this population, the classifications are adjusted as follows: overweight BMI: 23-27.5 kg/m²; obese BMI: ≥27.5 kg/m² (23–25).
As detailed data on Non-Hispanic Asian populations in the NHANES database only became available after 2010, we extracted NHANES data from 2011-2018 to re-analyze the association between METS-VF and depression in overweight or obese populations in order to avoid substantial missing sample sizes as part of a sensitivity analysis.
2.5 Covariates
This study included covariates such as gender, age, race, education level, marital status, household poverty-to-income ratio, BMI, smoking status, alcohol use, diabetes, hypertension, CVD, and stroke. Smokers were defined as those who had smoked at least 100 cigarettes in their lifetime and were smoking during the survey. Alcohol drinkers have consumed at least 12 alcoholic beverages in their lifetime and any year. Diabetes mellitus was identified by a physician’s diagnosis or fasting blood glucose ≥126 mg/dL. Hypertension was noted for individuals with a prior diagnosis, on medication, or with systolic/diastolic blood pressure ≥140/90 mmHg. CVD included those diagnosed with congestive heart failure, coronary artery disease, angina pectoris, or heart attack.
2.6 Statistical analyses
The NHANES multi-stage design was accounted for in all statistical analyses. Continuous variables were presented as survey-weighted means with 95% confidence intervals (CI), while categorical variables were shown as survey-weighted percentages with 95% CI. Differences between depressed and non-depressed groups were assessed using weighted linear regression or weighted chi-square tests.
To explore the association between METS-VF and depression in overweight or obese patients, three logistic regression models were used: Model 1 was unadjusted. Model 2 was adjusted for age, sex, and race. Model 3 was further adjusted for education, marital status, BMI, PIR, smoking, alcohol use, diabetes, hypertension, CVD, and stroke. Weighted multiple regression analyses were conducted to describe the association between METS-VF and PHQ-9 depression scores, treating METS-VF as both continuous and categorical (quartiles) variables and estimating trends by treating quartiles as continuous variables. The non-linear relationship between METS-VF and depression prevalence was explored using a generalized additive model (GAM) and smooth curve fitting. When non-linear associations were found, two-segment linear regression models were compared to single-linear models using a log-likelihood ratio test, and threshold effects were calculated. Subsequently, subgroup analyses and interaction tests were performed on potential confounders listed in the baseline table. The study was statistically analyzed using R version 4.3.3 and Empower software with the significance level set at P < 0.05.
3 Results
3.1 Baseline characteristics of the study population
The weighted prevalence of depressed patients (PHQ-9 score ≥10) was 7.82% (7.09%, 8.63%). Compared with non-depressed patients, depressed patients had higher METS-VF levels of 6.55 (6.52, 6.57), P < 0.01. The depressed group had a higher prevalence of female patients, individuals who were divorced or living alone, and those with cardiovascular disease, diabetes mellitus, stroke, and hypertension. Conversely, smoking, alcohol consumption, educational attainment, and PIR levels were significantly lower in the depressed group, with a notable difference between the groups (P < 0.01) (Table 1).
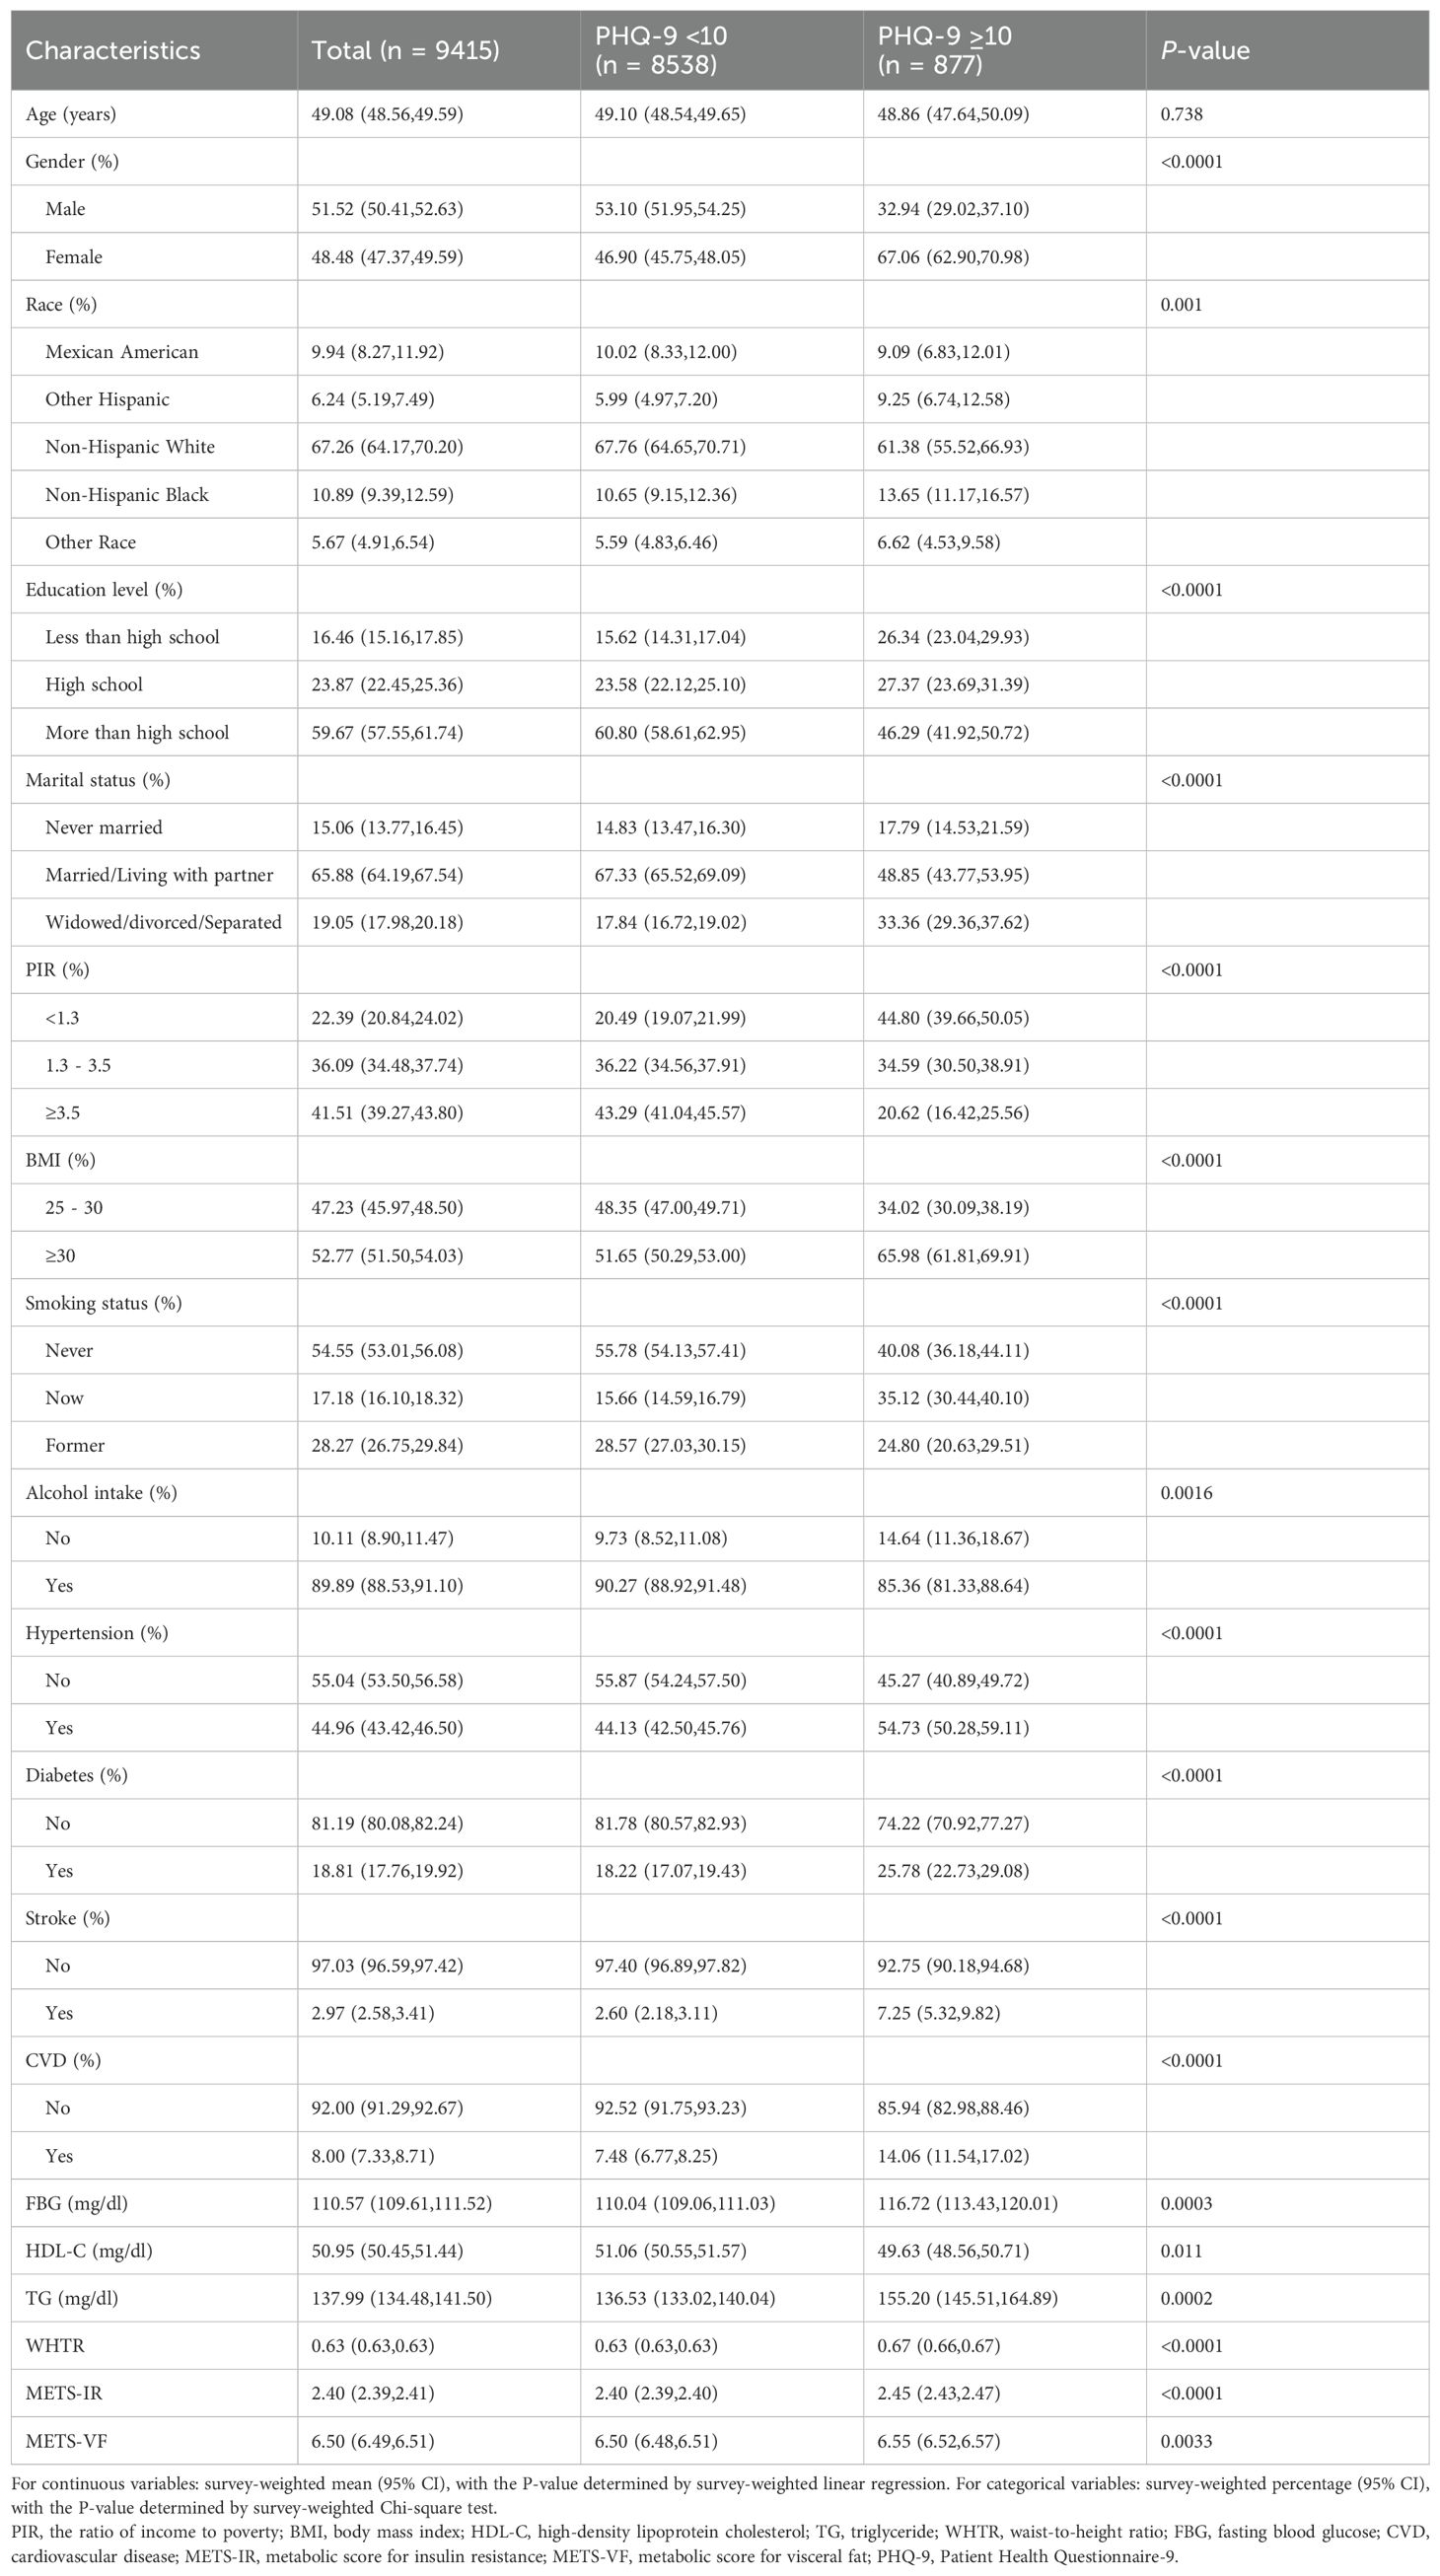
Table 1. Weighted characteristics of the study population based on depression.
3.2 Association between METS-VF and depression
Table 2 shows a positive correlation between METS-VF and PHQ-9 scores, with (β=0.28, 95% CI: 0.06, 0.51) in the crude model and (β=1.45, 95% CI: 1.11, 1.79) in the fully adjusted model. Similarly, METS-VF was positively associated with depression, where a one-unit increase in METS-VF raised the likelihood of developing depression by 197% (OR=2.97, 95% CI: 2.13, 4.14) after adjusting for all covariates. Additionally, when METS-VF was divided into quartiles, we observed that the positive association persisted and became more pronounced with higher METS-VF levels (P for trend <0.05). Smoothed curve-fitting analyses indicated no non-linear relationship between METS-VF and depression or PHQ-9 scores (log-likelihood ratio test P-value > 0.05) (Figure 2) (Table 3).
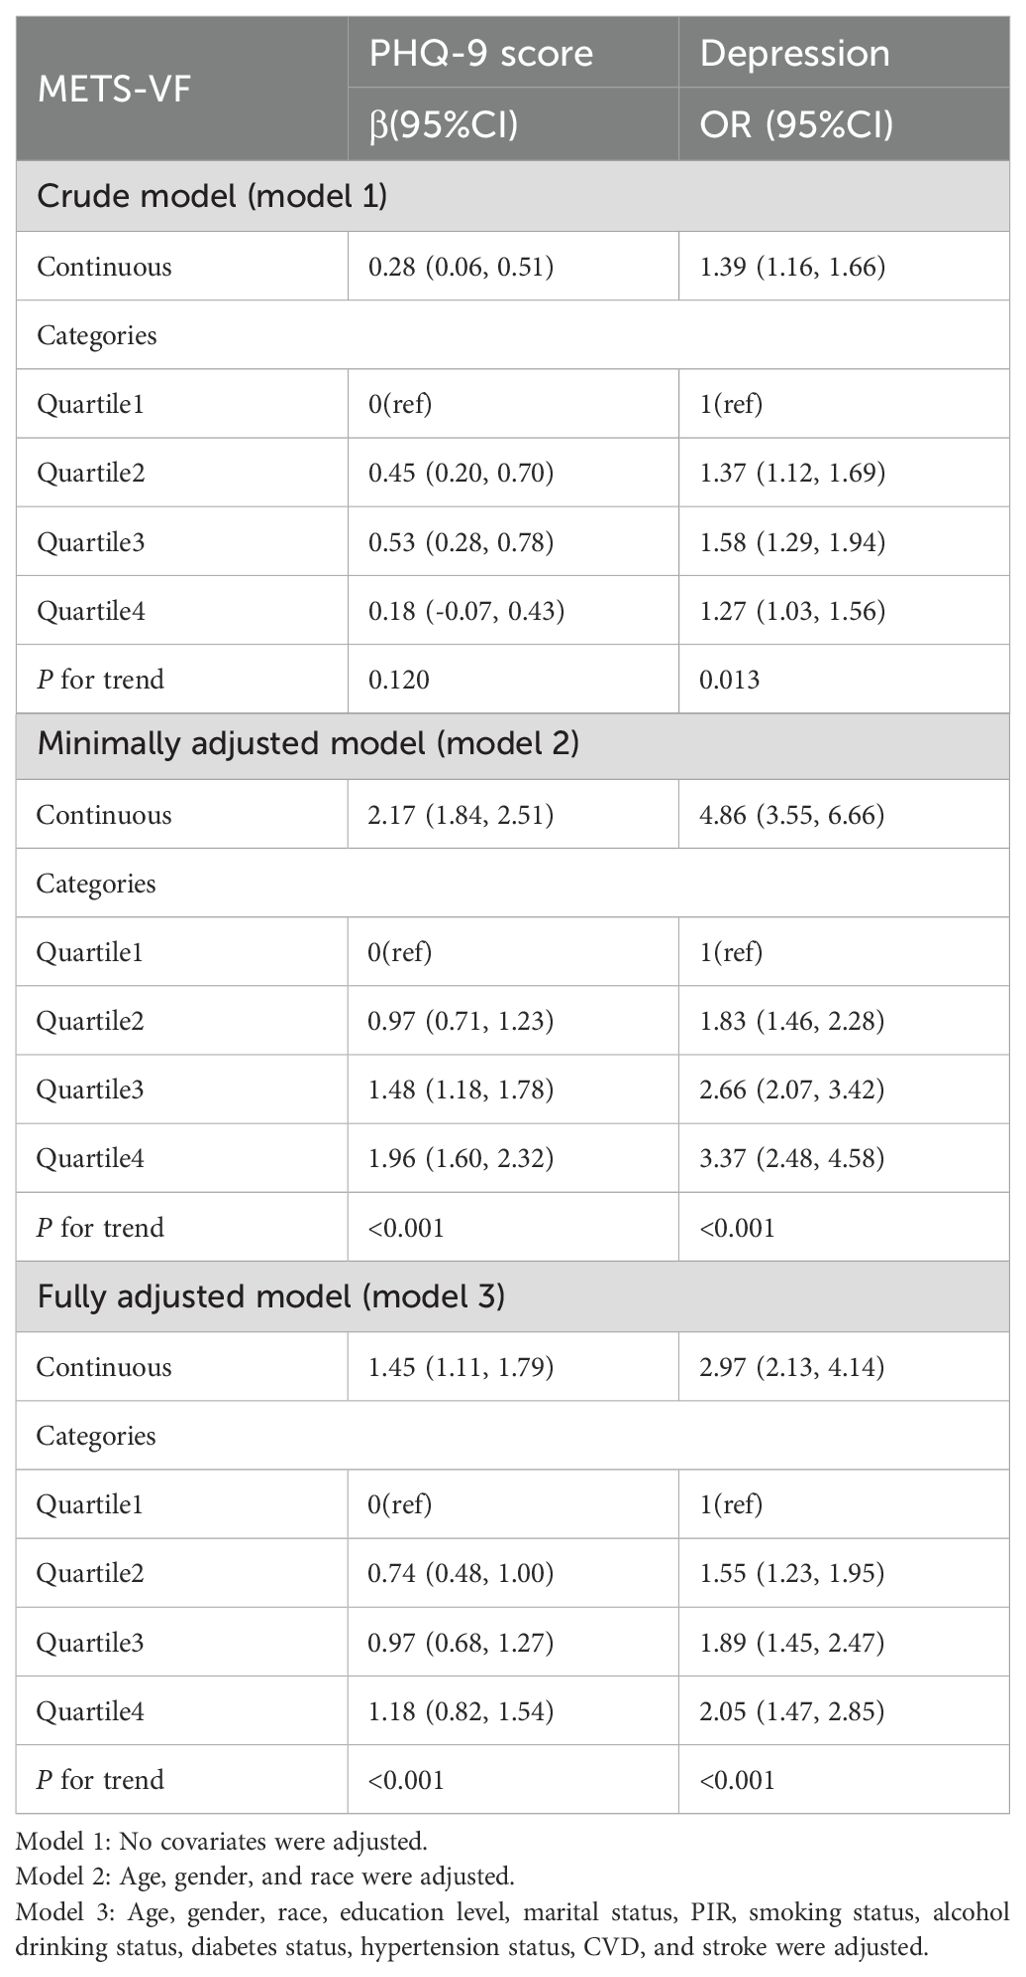
Table 2. Multiple regression analysis between METS-VF and depression in overweight or obese patients.
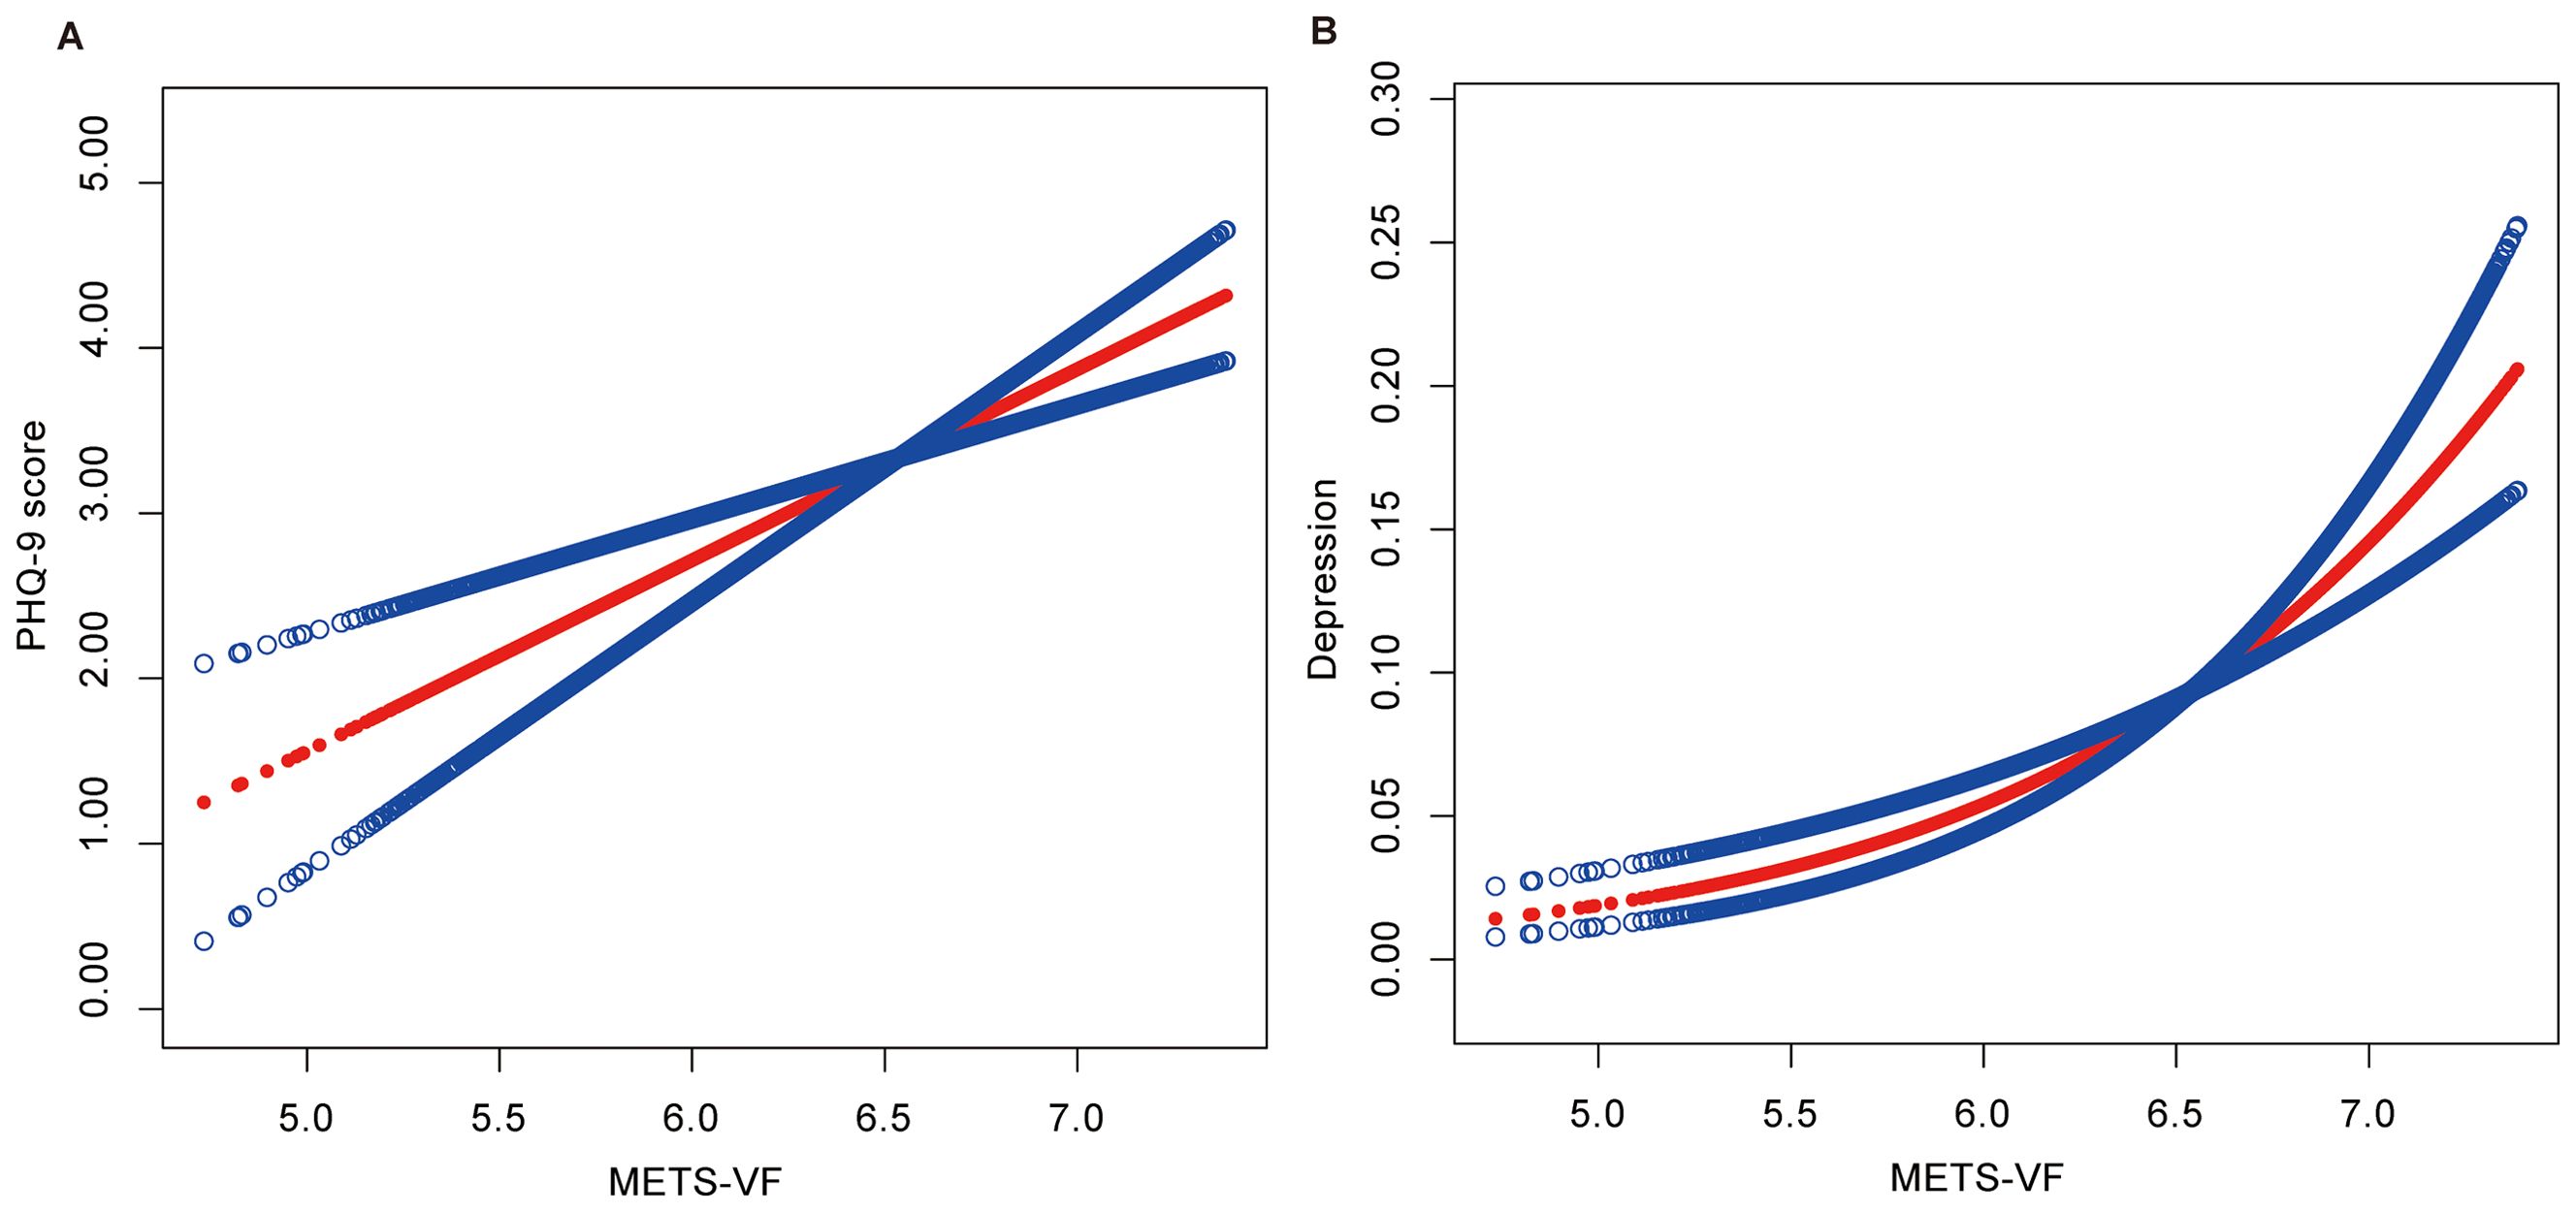
Figure 2. (A) Smooth curve fitting between METS-VF and PHQ-9 Score. (B) Smooth curve fitting between METS-VF and Depression. The associations were adjusted for gender, age, race, education level, marital status, PIR, smoking status, alcohol drinking status, diabetes status, hypertension status, CVD, and stroke.

Table 3. Analysis of the threshold effect between METS-VF and PHQ-9 score and depression in overweight or obese patients.
3.3 Subgroup analyses
Subgroup analyses were conducted to evaluate the consistency of the relationship between METS-VF levels and the prevalence of depression across different populations. The results indicated a positive correlation between METS-VF and depression prevalence in all subgroups, with no significant differences in the relationship across different populations (P for interaction > 0.05) (Figure 3).
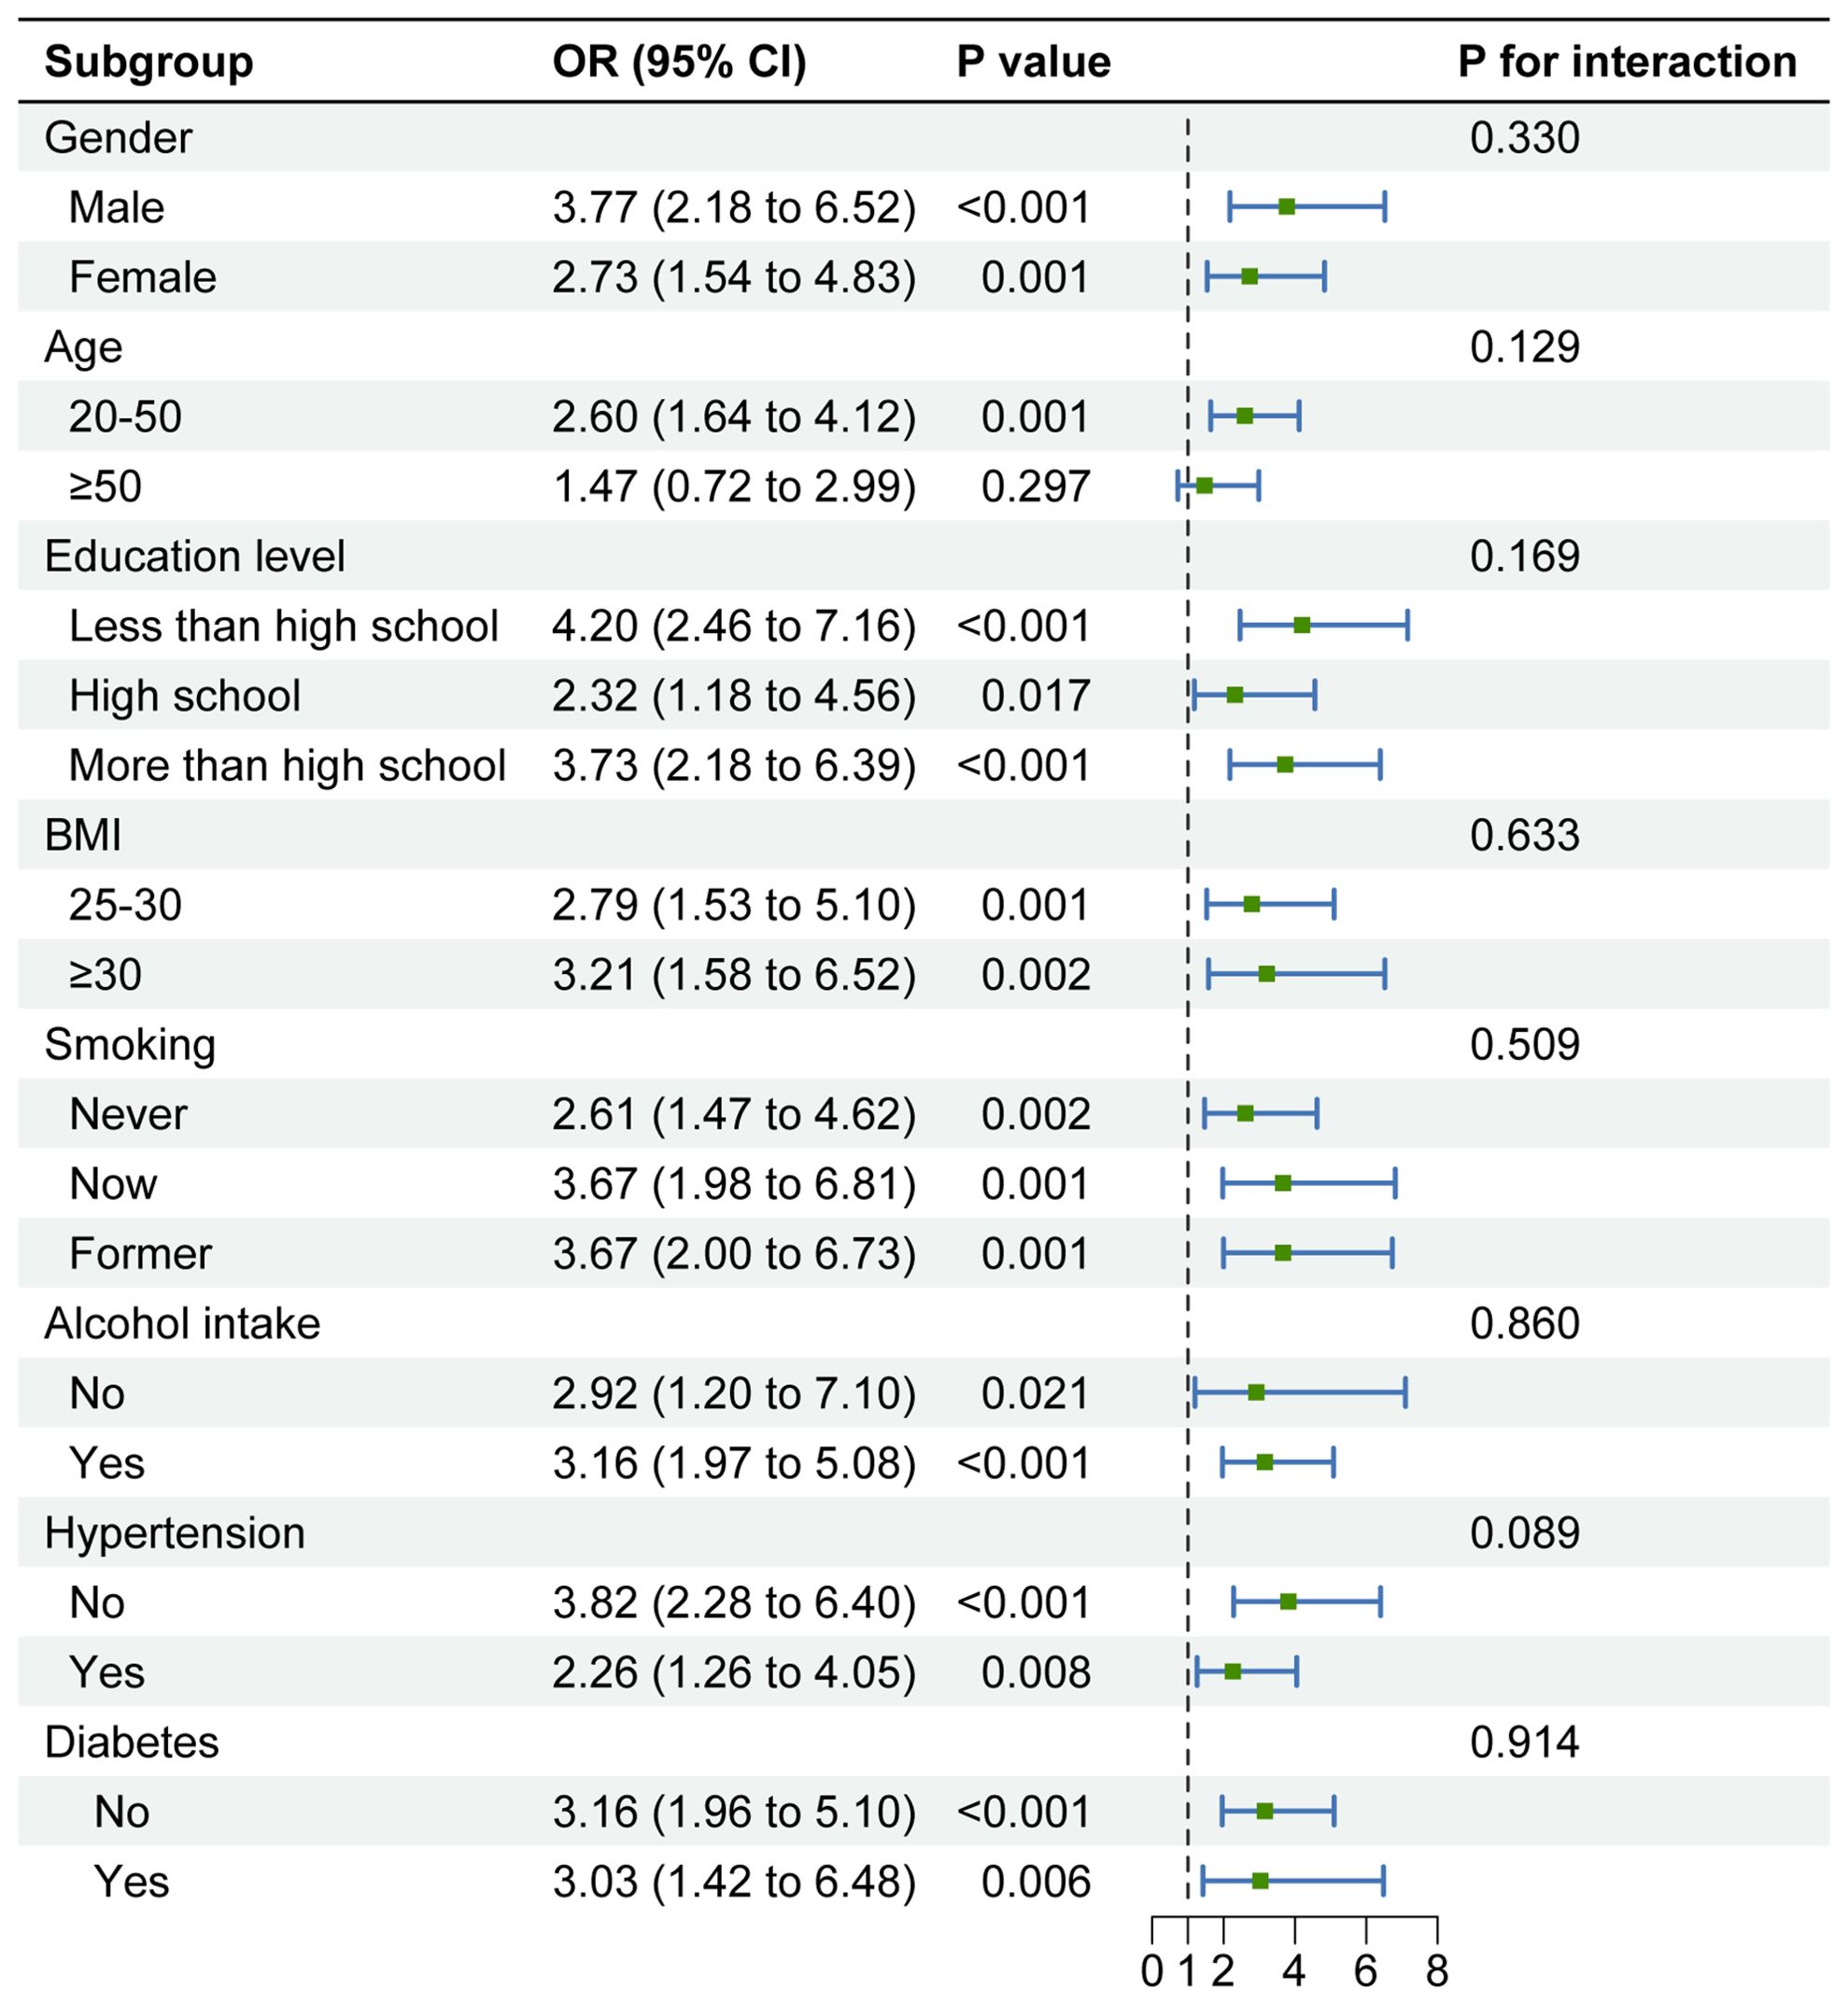
Figure 3. Subgroup analysis of the association between METS-VF and depression in overweight or obese patients. Note 1: The above model adjusted for gender, age, race, education level, marital status, PIR, smoking status, alcohol drinking status, diabetes status, hypertension status, CVD, and stroke. Note 2: In each case, the model is not adjusted for the stratification variable.
3.4 Sensitivity analysis
We extracted NHANES data from 2011-2018 to re-analyze the association between METS-VF and depression in overweight or obese populations as a sensitivity analysis (Supplementary Figure S1). The study demonstrated that in the fully adjusted model, METS-VF was positively associated with PHQ-9 scores (β=1.42, 95% CI: 0.84, 1.64). Similarly, METS-VF was positively associated with depression (OR=2.98, 95% CI: 1.98, 4.49) (Table 4). Smoothed curve-fitting analyses confirmed that there was no non-linear relationship between METS-VF and depression or PHQ-9 scores (log-likelihood ratio test p-value > 0.05) (Supplementary Figure S2) (Supplementary Table S2). These findings were consistent with the results of the data analyzed from 2007-2018.
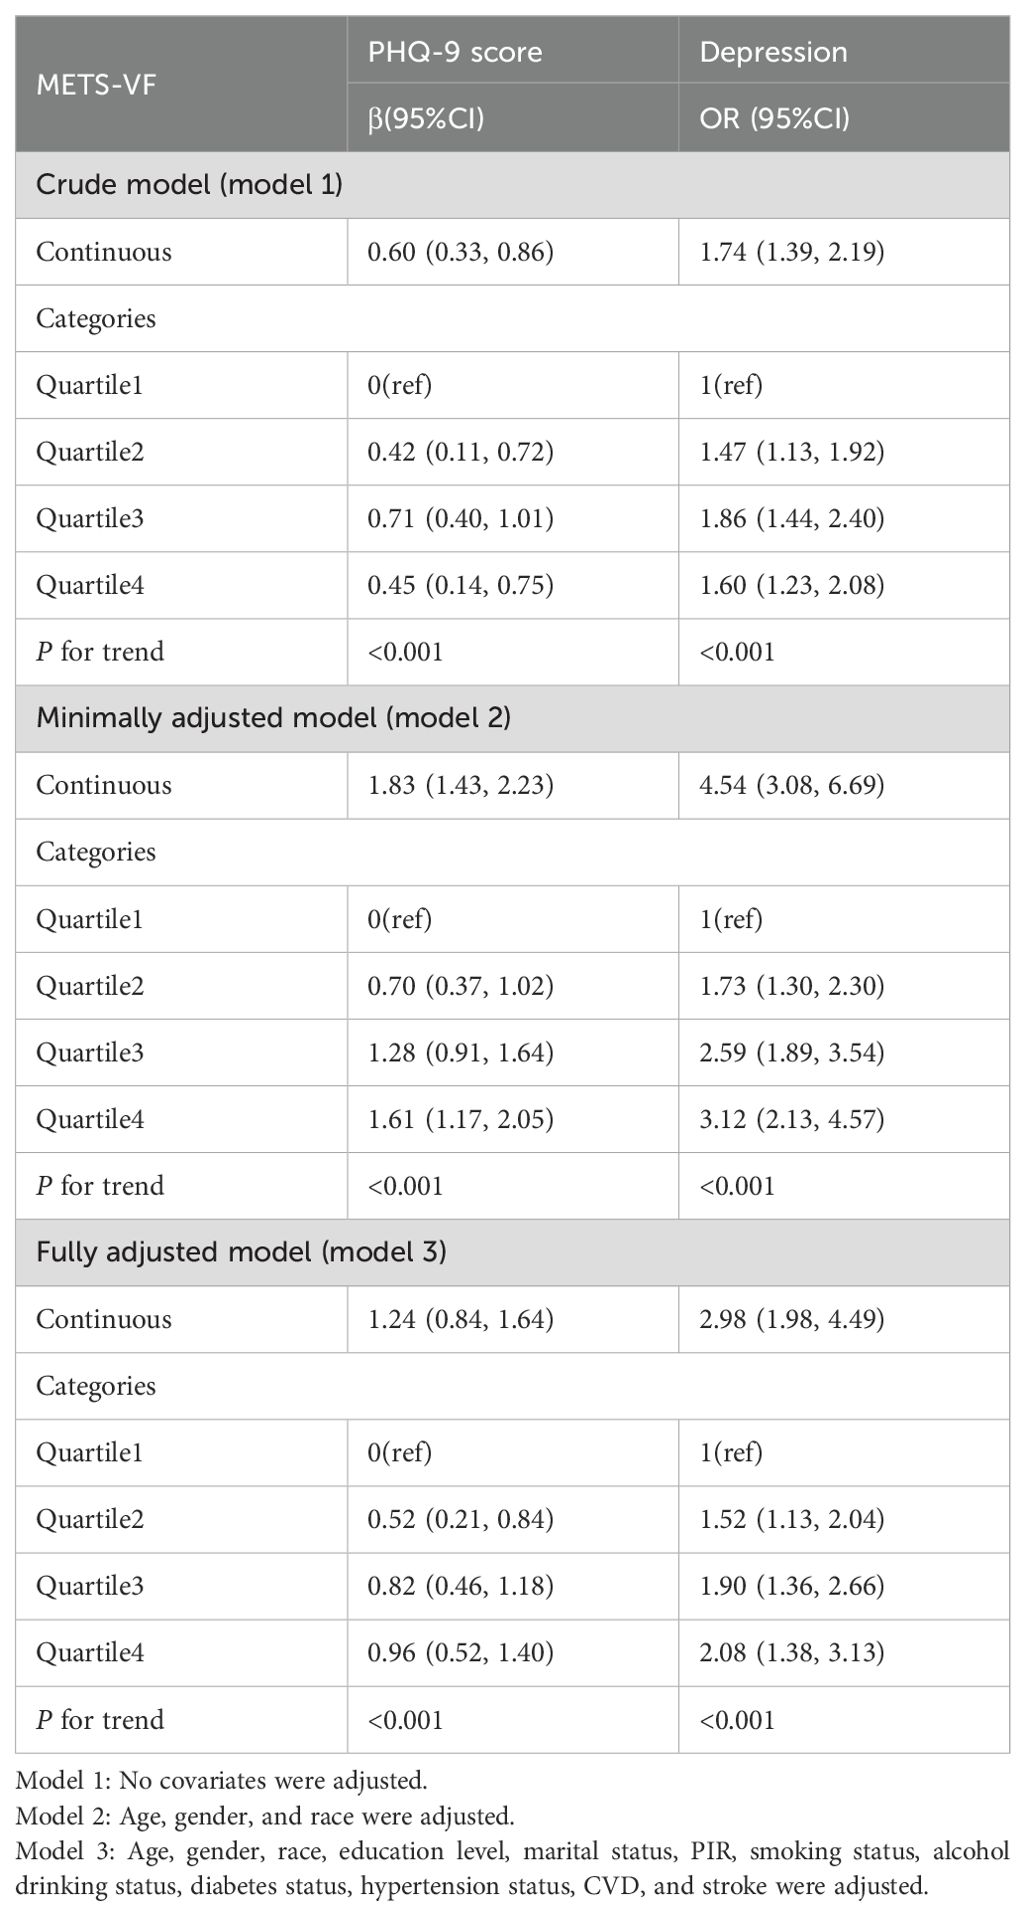
Table 4. Multiple regression analysis between METS-VF and depression in overweight or obese patients, 2011-2018.
4 Discussion
In populations that are overweight or obese, this research revealed a strong positive correlation between METS-VF and both the likelihood of developing depression and the severity of depression. This implies that higher METS-VF may be an important risk factor for depression. This association was also validated in multiple regression analyses and subgroup analyses and remained significant after adjusting for multiple covariates. These findings suggest that METS-VF may serve as a predictor of depression severity and the risk of developing depression. The sensitivity analyses confirmed the robustness of the results in this study.
In this study, after accounting for potential confounding variables, a strong association was found between elevated levels of the METS-VF index and an increased likelihood of developing depression compared with the low-level group. This finding is consistent with the relationship depicted in Figure 2. However, in the subgroup analyses, we observed that this trend may not apply to those over 50 years of age. This situation may offer some new insights, but due to the small sample sizes in the individual strata, it may be influenced by factors such as indicator assessment methods, population characteristics, and false-negative results. Therefore, larger studies with expanded population samples are necessary to account for this relationship in multiple ways. Nevertheless, our findings have implications for understanding the association between visceral fat levels and depression.
Obesity is a serious chronic disease that can be highly detrimental to one’s health (26).
Currently, BMI is commonly used to measure the degree of obesity, and VAI and SAD are also used to measure visceral fat levels (26, 27). However, these metrics have some shortcomings in measuring depression in both men and women (28). Therefore, the Metabolic Score for Visceral Fat (METS-VF) was developed (17, 18). Analysis of research predicting visceral fat using several indices revealed that the METS-VF had the best predictive value for identifying elevated visceral fat (17). This finding confirms previous studies that suggest depression severity and the risk of developing depression are associated with visceral fat distribution in overweight or obese populations.
In studies on the mechanistic aspects of higher levels of visceral adiposity and depression, although the specific mechanisms are not consistent, several possibilities have been suggested. Firstly, Capuron and Dixit believe that inflammation plays a mediating role between obesity and depression, with systemic low-grade inflammation being a key factor in the development of obesity (29, 30), and Margaret suggests that obesity is an important factor that affects the acquired immune system of inflammatory conditions, while adipocytes and infiltrating macrophages distributed in adipose have the ability to secrete inflammatory mediators (31, 32). The inflammatory cytokines generated cause changes in neuroplasticity and brain circuitry, disrupt neurotransmitter metabolism and function, and stimulate the neuroendocrine system (33). Systemic low-grade inflammation has been identified as a strong predictor of depression symptoms in people with metabolic syndrome (34). Secondly, metabolic syndrome plays a role in the development and progression of depression, and it includes obesity. In a study conducted in the UK, the results also showed that metabolic syndrome was associated with an increased risk of depression (35). Thus, there is a possibility that those with high cholesterol have an increased chance of developing depression. Cholesterol affects serotonin levels, which are negatively correlated with the risk of suicide. According to research by Marko, serotonin dysregulation may be linked to both high and low cholesterol levels (36–38). Through several methods, primary reductions in levels of cholesterol might directly lead to decreased brain 5-HT activity. Cholesterol levels may have a considerable impact on the clinical manifestations of depression as well as on the response to psychopharmacological treatment. Individuals with high cholesterol are more likely to experience anxiety problems and exhibit treatment resistance (39). The development of depression is associated with dyslipidemia. A study of lipid levels in depressed postpartum women found that the higher the depression level score, the more abnormal the lipid levels (38). This may be because depression leads to disorders of lipid metabolism, affecting the HPA axis in the body. This, in turn, alters lipid levels and promotes the development of depression (40). There is evidence to show that in people with depression, the axis of HPA may elevate glucocorticoid hormone levels, which may impact insulin’s ability to promote glucose absorption. This permits the body to store fat and blood sugar, which increases metabolic disorders (41). However, research examining the connection between teenage depression and lipid profiles discovered that the degree of dyslipidemia in teenagers with severe depressive disorder was similar to that of teenagers in good health (42). Thus, further investigation is still required for later studies on the connection between lipid levels and the incidence of depression in individuals of all ages. Nevertheless, METS-VF can more accurately represent visceral fat levels and offer a strong foundation for halting the onset and progression of depression.
5 Strengths and limitations
The strengths of this study include, first, the feasibility and usefulness of METS-VF as a novel index for assessing visceral fat levels. Second, the large sample size and high representativeness of the study population enhance the robustness of the findings. However, there are several limitations. First, due to the lack of information in the NHANES dataset on whether participants were treated with anti-obesity medications or had undergone bariatric surgery, we were unable to assess the potential impact of these factors on the results. Moreover, we did not analyze risk factors contributing to the development of depression from a microbial mechanism perspective. Additionally, the cross-sectional nature of the analyses limits our ability to infer a causal relationship between METS-VF and depression. Nonetheless, this study provides valuable insights into the relationship between visceral fat levels and depression severity and lays the foundation for future research.
6 Conclusion
The present study demonstrated a significant positive association between METS-VF and the likelihood of developing depression in overweight or obese individuals. Future research should adopt a longitudinal design to explore the complex relationship between visceral fat metabolism and depression in greater depth.
Data availability statement
The original contributions presented in the study are included in the article/Supplementary Material. Further inquiries can be directed to the corresponding author.
Ethics statement
The portions of this study involving human participants, human materials, or human data were conducted in accordance with the Declaration of Helsinki and were approved by the National Center for Health Statistics (NCHS) Ethics Review Board. The patients/participants provided their written informed consent to participate in this study. The studies were conducted in accordance with the local legislation and institutional requirements. The participants provided their written informed consent to participate in this study. Written informed consent was obtained from the individual(s) for the publication of any potentially identifiable images or data included in this article.
Author contributions
HL: Writing – review & editing, Writing – original draft, Resources, Methodology. HD: Writing – review & editing, Software, Conceptualization. YZ: Writing – original draft, Methodology, Data curation. MJ: Writing – original draft, Software, Data curation. HH: Writing – original draft, Project administration, Formal analysis. YY: Writing – review & editing, Writing – original draft, Visualization, Validation. HJ: Writing – review & editing, Writing – original draft, Supervision.
Funding
The author(s) declare that no financial support was received for the research, authorship, and/or publication of this article.
Acknowledgments
We would like to thank all participants in this study.
Conflict of interest
The authors declare that the research was conducted in the absence of any commercial or financial relationships that could be construed as a potential conflict of interest.
Publisher’s note
All claims expressed in this article are solely those of the authors and do not necessarily represent those of their affiliated organizations, or those of the publisher, the editors and the reviewers. Any product that may be evaluated in this article, or claim that may be made by its manufacturer, is not guaranteed or endorsed by the publisher.
Supplementary material
The Supplementary Material for this article can be found online at: https://www.frontiersin.org/articles/10.3389/fendo.2024.1482003/full#supplementary-material
Abbreviations
NHANES, National Health and Nutrition Examination Survey; GAM, generalized additive model; PIR, income to poverty ratio; CVD, cardiovascular disease; BMI, body mass index; METS-VF, Metabolic Score for Visceral Fat; PHQ-9, Patient Health Questionnaire-9; NCHS, National Center for Health Statistics; METS-IR, metabolic score for insulin resistance; WHTR, waist-to-height ratio; WC, waist circumference; HDL-C, high-density lipoprotein cholesterol; TG, triglycerides; FBG, fasting blood glucose; WHO, World Health Organization.
References
1. Fulton S, Décarie-Spain L, Fioramonti X, Guiard B, Nakajima S. The menace of obesity to depression and anxiety prevalence. Trends Endocrinol Metabolism: TEM. (2022) 33:18–35. doi: 10.1016/j.tem.2021.10.005
2. Zhao D, Long X, Wang J. Association of dietary vitamin C intake with depression in adults: A cross-sectional study of NHANES from 2005 to 2020. J Affect Disord. (2024) 358:113–20. doi: 10.1016/j.jad.2024.05.032
3. Andrea SB, Siegel SA, Teo AR. Social support and health service use in depressed adults: findings from the national health and nutrition examination survey. Gen Hosp Psychiatry. (2016) 39:73–9. doi: 10.1016/j.genhosppsych.2015.11.009
4. Yu B, Zhang X, Wang C, Sun M, Jin L, Liu X. Trends in depression among Adults in the United States, NHANES 2005-2016. J Affect Disord. (2020) 263:609–20. doi: 10.1016/j.jad.2019.11.036
5. Azeem R, Zubair UB, Jalil A, Kamal A, Nizami A, Minhas F. Prevalence of Suicide Ideation and its Relationship with Depression among Transgender Population. J Coll Physicians Surgeons–Pakistan: JCPSP. (2019) 29:349–52. doi: 10.29271/jcpsp.2019.04.349
6. Ménard C, Hodes GE, Russo SJ. Pathogenesis of depression: Insights from human and rodent studies. Neuroscience. (2016) 321:138–62. doi: 10.1016/j.neuroscience.2015.05.053
7. McIntyre RS. The co-occurrence of depression and obesity: implications for clinical practice and the discovery of targeted and precise mechanistically informed therapeutics. J Clin Psychiatry. (2024) 85(2):24com15322. doi: 10.4088/JCP.24com15322
8. Naparstek J, Wing RR, Xu X, Leahey TM. Internet-delivered obesity treatment improves symptoms of and risk for depression. Obes (Silver Spring Md). (2017) 25:671–5. doi: 10.1002/oby.21773
9. Vittengl JR. Mediation of the bidirectional relations between obesity and depression among women. Psychiatry Res. (2018) 264:254–9. doi: 10.1016/j.psychres.2018.03.023
10. Hopkins BD, Goncalves MD, Cantley LC. Obesity and cancer mechanisms: cancer metabolism. J Clin Oncol. (2016) 34:4277–83. doi: 10.1200/jco.2016.67.9712
11. The L. The link between cancer and obesity. Lancet (London England). (2017) 390:1716. doi: 10.1016/s0140-6736(17)32659-4
12. Zarzour A, Kim HW, Weintraub NL. Understanding obesity-related cardiovascular disease: it’s all about balance. Circulation. (2018) 138:64–6. doi: 10.1161/circulationaha.118.034454
13. Li X, Shi X, Tan Y, Yu Y, Tang C, Xu G, et al. Chen W et al: Metabolic indexes of obesity in patients with common mental disorders in stable stage. BMC Psychiatry. (2022) 22:91. doi: 10.1186/s12888-022-03752-2
14. Osmari DG, Garcez A, Dias-da-Costa JS, Olinto MTA. Association between obesity and common mental disorders in women: a population-based study in Southern Brazil. Soc Psychiatry Psychiatr Epidemiol. (2023) 59(9):1577-1585. doi: 10.1007/s00127-023-02530-z
15. Herhaus B, Kruse J, Hinz A, Brähler E, Petrowski K. Depression, anxiety, and health-related quality of life in normal weight, overweight and obese individuals with diabetes: a representative study in Germany. Acta Diabetologica. (2024) 61:725–34. doi: 10.1007/s00592-024-02248-7
16. Sweatt K, Garvey WT, Martins C. Strengths and limitations of BMI in the diagnosis of obesity: what is the path forward? Curr Obes Rep. (2024) 13(3):584-595. doi: 10.1007/s13679-024-00580-1
17. Torun C, Ankaralı H, Caştur L, Uzunlulu M, Erbakan AN, Akbaş MM, et al. Is metabolic score for visceral fat (METS-VF) a better index than other adiposity indices for the prediction of visceral adiposity. Diabetes Metab Syndrome Obesity: Targets Ther. (2023) 16:2605–15. doi: 10.2147/dmso.S421623
18. Deng C, Ke X, Lin L, Fan Y, Li C. Association between indicators of visceral lipid accumulation and infertility: a cross-sectional study based on U.S. women. Lipids Health Dis. (2024) 23:186. doi: 10.1186/s12944-024-02178-x
19. Yang R, Kuang M, Qiu J, Yu C, Sheng G, Zou Y. Assessing the usefulness of a newly proposed metabolic score for visceral fat in predicting future diabetes: results from the NAGALA cohort study. Front Endocrinol. (2023) 14:1172323. doi: 10.3389/fendo.2023.1172323
20. Kuang M, Qiu J, Li D, Hu C, Zhang S, Sheng G, et al. The newly proposed Metabolic Score for Visceral Fat is a reliable tool for identifying non-alcoholic fatty liver disease, requiring attention to age-specific effects in both sexes. Front Endocrinol. (2023) 14:1281524. doi: 10.3389/fendo.2023.1281524
21. Kroenke K, Spitzer RL, Williams JB. The PHQ-9: validity of a brief depression severity measure. J Gen Internal Med. (2001) 16:606–13. doi: 10.1046/j.1525-1497.2001.016009606.x
22. Costantini L, Pasquarella C, Odone A, Colucci ME, Costanza A, Serafini G, et al. Amore M et al: Screening for depression in primary care with Patient Health Questionnaire-9 (PHQ-9): A systematic review. J Affect Disord. (2021) 279:473–83. doi: 10.1016/j.jad.2020.09.131
23. Bajaj SS, Zhong A, Zhang AL, Stanford FC. Body mass index thresholds for asians: A race correction in need of correction? Ann Internal Med. (2024) 177:1127–9. doi: 10.7326/m24-0161
24. Jih J, Mukherjea A, Vittinghoff E, Nguyen TT, Tsoh JY, Fukuoka Y, et al. Using appropriate body mass index cut points for overweight and obesity among Asian Americans. Prev Med. (2014) 65:1–6. doi: 10.1016/j.ypmed.2014.04.010
25. WHO Expert Consultation. Appropriate body-mass index for Asian populations and its implications for policy and intervention strategies. Lancet (London England). (2004) 363:157–63. doi: 10.1016/s0140-6736(03)15268-3
26. Zhang L, Yin J, Sun H, Dong W, Liu Z, Yang J, et al. The relationship between body roundness index and depression: A cross-sectional study using data from the National Health and Nutrition Examination Survey (NHANES) 2011-2018. J Affect Disord. (2024) 361:17–23. doi: 10.1016/j.jad.2024.05.153
27. Lei J, Luo Y, Xie Y, Wang X. Visceral adiposity index is a measure of the likelihood of developing depression among adults in the United States. Front Psychol. (2022) 13:772556. doi: 10.3389/fpsyg.2022.772556
28. Nong Y, Wu G, Lu J, Wei X, Yu D. The mediating role of obesity in the development of depression in individuals with diabetes: A population-based study from NHANES 2005-2014. J Affect Disord. (2024) 351:977–82. doi: 10.1016/j.jad.2024.02.036
29. Capuron L, Lasselin J, Castanon N. Role of adiposity-driven inflammation in depressive morbidity. Neuropsychopharmacology. (2017) 42:115–28. doi: 10.1038/npp.2016.123
30. Kanneganti TD, Dixit VD. Immunological complications of obesity. Nat Immunol. (2012) 13:707–12. doi: 10.1038/ni.2343
31. Gregor MF, Hotamisligil GS. Inflammatory mechanisms in obesity. Annu Rev Immunol. (2011) 29:415–45. doi: 10.1146/annurev-immunol-031210-101322
32. Lasselin J, Magne E, Beau C, Ledaguenel P, Dexpert S, Aubert A, et al. Adipose inflammation in obesity: relationship with circulating levels of inflammatory markers and association with surgery-induced weight loss. J Clin Endocrinol Metab. (2014) 99:E53–61. doi: 10.1210/jc.2013-2673
33. Dantzer R, O’Connor JC, Freund GG, Johnson RW, Kelley KW. From inflammation to sickness and depression: when the immune system subjugates the brain. Nat Rev Neurosci. (2008) 9:46–56. doi: 10.1038/nrn2297
34. Capuron L, Su S, Miller AH, Bremner JD, Goldberg J, Vogt GJ, et al. Depressive symptoms and metabolic syndrome: is inflammation the underlying link? Biol Psychiatry. (2008) 64:896–900. doi: 10.1016/j.biopsych.2008.05.019
35. Akbaraly TN, Kivimäki M, Brunner EJ, Chandola T, Marmot MG, Singh-Manoux A, et al. Association between metabolic syndrome and depressive symptoms in middle-aged adults: results from the Whitehall II study. Diabetes Care. (2009) 32:499–504. doi: 10.2337/dc08-1358
36. Parekh A, Smeeth D, Milner Y, Thure S. The role of lipid biomarkers in major depression. Healthc (Basel Switzerland). (2017) 5(1):5. doi: 10.3390/healthcare5010005
37. von Zimmermann C, Brückner L, Mühle C, Weinland C, Kornhuber J, Lenz B. Bioimpedance body measures and serum lipid levels in masculine depression. Front Psychiatry. (2022) 13:794351. doi: 10.3389/fpsyt.2022.794351
38. Gjerde PB, Simonsen CE, Lagerberg TV, Steen NE, Andreassen OA, Steen VM, et al. Sex-specific effect of serum lipids and body mass index on psychotic symptoms, a cross-sectional study of first-episode psychosis patients. Front Psychiatry. (2021) 12:723158. doi: 10.3389/fpsyt.2021.723158
39. Sonnenberg LM, Quatromoni PA, Gagnon DR, Cupples LA, Franz MM, Ordovas JM, et al. Diet and plasma lipids in women. II. Macronutrients and plasma triglycerides, high-density lipoprotein, and the ratio of total to high-density lipoprotein cholesterol in women: the Framingham nutrition studies. J Clin Epidemiol. (1996) 49:665–72. doi: 10.1016/0895-4356(96)00031-5
40. Huang Q, Wang D, Chen S, Tang L, Ma C. Association of METS-IR index with depressive symptoms in US adults: A cross-sectional study. J Affect Disord. (2024) 355:355–62. doi: 10.1016/j.jad.2024.03.129
41. Cheng L, Wu Q, Wang S. Cardiometabolic index is associated with increased depression: A population-based study. J Affect Disord. (2024) 348:259–64. doi: 10.1016/j.jad.2023.12.073
Keywords: Metabolic Score for Visceral Fat, depression, obesity, METS-VF, NHANES
Citation: Liu H, Dong H, Zhou Y, Jin M, Hao H, Yuan Y and Jia H (2024) The association between Metabolic Score for Visceral Fat and depression in overweight or obese individuals: evidence from NHANES. Front. Endocrinol. 15:1482003. doi: 10.3389/fendo.2024.1482003
Received: 17 August 2024; Accepted: 09 September 2024;
Published: 26 September 2024.
Edited by:
Filip Kukic, University of Banja Luka, Bosnia and HerzegovinaReviewed by:
Milos Milosevic, Singidunum University, SerbiaGian Pio Sorice, University of Bari Aldo Moro, Italy
Copyright © 2024 Liu, Dong, Zhou, Jin, Hao, Yuan and Jia. This is an open-access article distributed under the terms of the Creative Commons Attribution License (CC BY). The use, distribution or reproduction in other forums is permitted, provided the original author(s) and the copyright owner(s) are credited and that the original publication in this journal is cited, in accordance with accepted academic practice. No use, distribution or reproduction is permitted which does not comply with these terms.
*Correspondence: Hongtao Jia, NTM5OTcyODkwQHFxLmNvbQ==
†These authors have contributed equally to this work and share first authorship