 Amirhossein Shirinezhad1
 Alireza Azarboo1†
 Amirhossein Ghaseminejad-Raeini1*†Fatemeh Kanaani Nejad2Negar Zareshahi1Sheyda Mohtasham Amiri3Yasamin Tahmasebi1
 Amir Human Hoveidaei4†
- 1School of Medicine, Tehran University of Medical Sciences, Tehran, Iran
- 2Medical Imaging Research Center, Shiraz University of Medical Sciences, Shiraz, Iran
- 3Department of Medicine, Islamic Azad University Tehran Medical Sciences, Tehran, Iran
- 4Sports Medicine Research Center, Neuroscience Institute, Tehran University of Medical Sciences, Tehran, Iran
Background: The relationship of insulin resistance with bone mineral density (BMD) remains unclear, offering an opportunity for novel indices to shed light on the matter. The aim of this review was to evaluate the association between surrogate indices of insulin resistance and BMD.
Methods: A systematic review was conducted to evaluate observational studies that examined the relationship between insulin resistance surrogate indices and BMD in adults. Databases including PubMed, Web of Science, Scopus, and Embase were searched. Quality assessment was performed using Joanna Briggs Institute (JBI) critical appraisal tools.
Results: This systematic review included 27 cohorts and cross-sectional studies with 71,525 participants to assess the potential link between insulin resistance surrogate indices like HOMA-IR, HOMA-β, TyG, TyG-BMI, TyG-WtHR, and TyG-WC, along with METS-IR, and VAI, and BMD at various sites. There seems to be no link between BMD and the HOMA index, despite being extensively studied in various studies (adjusted β ranging from -0.49 to 0.103). Most literature suggests that a higher TyG index is associated with decreased BMD levels (adjusted β ranging from -0.085 to 0.0124). Despite limited evidence, other insulin resistance indices such as VAI (adjusted β ranging from 0.007 to 0.016), TyG-BMI (adjusted β ranging from 0.002 to 0.415), METS-IR (adjusted β ranging from 0.005 to 0.060), TyG-WtHR (β = 0.012) and TyG-WC (β = 0.0001) have shown a positive association with BMD in a few studies.
Conclusion: This systematic review emphasizes the intricate connection between insulin resistance and BMD. The lack of ability to perform a meta-analysis and the dependence on cross-sectional studies hinder the robustness of the findings, hence necessitating well-designed longitudinal studies.
Systematic review registration: https://www.crd.york.ac.uk/prospero/, identifier CRD42024512770.
Introduction
Osteoporotic fractures are associated with low BMD, making them a risk factor. The age-standard rate of osteoporosis incidence in 2019 was 49.2 million (1). The amount of global deaths and DALYs linked to low bone mineral density rose by 111.16% and 93.82% from 207,367 and 8,588,936 in 1990 to 437,884 and 16,647,466 in 2019 (2). Several variables can influence bone health and contribute to the development of osteoporosis (3). While certain characteristics like age, sex, or ethnicity have an inescapable impact on bone health, various modifiable factors, such as weight, alcohol consumption, or a sedentary lifestyle, can be improved by appropriate diet and physical activity to enhance bone condition (4). Multiple investigations have assessed the substantial impact of insulin resistance on various health-related conditions, including bone health.
The literature was clued into the inverse association of insulin resistance and bone health when the hypothesis of the negative impact of insulin resistance on bone remodeling was first presented (5, 6). Visceral fat mass (7), an altered lipid profile (8), and metabolic syndrome (9) are additional factors that might negatively impact bone health, leading to osteoporosis and an increased risk of fractures in the population. These parameters are sometimes referred to as surrogate indices for insulin resistance (10, 11). Multiple investigations have assessed the substantial impact of insulin resistance surrogate indices on various health-related conditions, such as vascular damage (12), hypertension (13), and metabolic syndrome (14). Furthermore, the correlation between these factors and bone health is receiving significant attention and has been thoroughly examined in several research studies (15, 16).
Given that the findings of studies on the association of insulin resistance and its surrogates with BMD are not consistent (17–20) and lack systematic reviews on this association to summarize the available evidence, the objective of this study was to assess the impact of surrogate indices of insulin resistance, including Homeostatic Model Assessment for Insulin Resistance (HOMA-IR), Homeostatic Model Assessment for Beta-Cell Function (HOMA-β), Triglyceride-Glucose Index (TyG), Triglyceride-Glucose Body Mass Index (TyG-BMI), Triglyceride-Glucose Waist-to-Height Ratio (TyG-WtHR), Triglyceride-Glucose Waist Circumference (TyG-WC), Metabolic Score for Insulin Resistance (METS-IR), and Visceral Adiposity Index (VAI), on BMD to clarify the possible role of insulin resistance in the determination of bone health.
Materials and methods
The PRISMA statement guidelines were followed during the conduct of this meta-analysis (21). This study adhered to a predetermined process outlined in the prospective register of systematic reviews (PROSPERO) (CRD42024512770).
Search strategy and screening
We conducted a search on electronic databases, including PubMed, Embase, Web of Science, and Scopus, until July 2024. The search utilized the following terms or relevant Medical Subject Headings (MeSH): (“visceral adiposity index” [Title/Abstract] OR “VAI” [Title/Abstract] OR “lipid accumulation product” [Title/Abstract] OR “LAP” [Title/Abstract] OR “triglyceride glucose index” [Title/Abstract] OR “TyG” [Title/Abstract] OR “triglyceride-glucose index” [Title/Abstract] OR “TyG-body mass index” [Title/Abstract] OR “TyG-BMI” [Title/Abstract] OR “TyG-waist circumference” [Title/Abstract] OR “TyG-WC” [Title/Abstract] OR “Homeostatic Model Assessment for Insulin Resistance” [Title/Abstract] OR “HOMA-IR” [Title/Abstract] OR “Metabolic Syndrome Insulin Resistance” [Title/Abstract] OR “MetS-IR” [Title/Abstract] OR “Lipoprotein Insulin Resistance Index” [Title/Abstract] OR “LP-IR” [Title/Abstract] OR “TyG-NC” [Title/Abstract] OR “TyG-NHtR” [Title/Abstract] OR “triglycerides to HDL cholesterol ratio” [Title/Abstract] OR “TG/HDL-C” [Title/Abstract] OR “Adipose insulin resistance index” [Title/Abstract] OR “Adipo-IR” [Title/Abstract] OR “lipid indices” [Title/Abstract] OR “Insulin Resistance index” [Title/Abstract] OR “Insulin Resistance indices” [Title/Abstract]) AND (“bone density”[MeSH] OR “fractures, bone”[MeSH] OR “osteoporosis”[MeSH] OR “osteoporosis”[Title/Abstract] OR “osteoporotic”[Title/Abstract] OR “osteoporoses”[Title/Abstract] OR “bone loss”[Title/Abstract] OR “fracture”[Title/Abstract] OR “bone demineralisation”[Title/Abstract] OR “bone demineralization”[Title/Abstract] OR “metabolic bone disease*”[Title/Abstract] OR “osteopenia”[Title/Abstract] OR “osteopenic”[Title/Abstract] OR “osteopaenia”[Title/Abstract] OR “osteopaenic”[Title/Abstract] OR “bone density”[Title/Abstract] OR “bone deterioration”[Title/Abstract] OR “bone mass density”[Title/Abstract] OR “bone mineral density”[Title/Abstract] OR “BMD”[Title/Abstract]). Further articles were screened for eligibility by referencing the included studies. Rayyan, a free online web tool for systematic reviewing, was used to screen the studies. It is accessible at https://www.rayyan.ai. Two reviewers (A.G.R. and A.A.) independently assessed each study and thoroughly examined the entire text to remove any duplicate materials. Studies meeting the inclusion-exclusion criteria were chosen. The third author (A.H.H.) conducted consensus meetings to address any potential disagreements among reviewers.
Inclusion and exclusion criteria
Population (P): Adult participants; Exposure (E): Studies assessing insulin resistance surrogate indices (e.g., HOMA-IR, TyG, VAI).; Comparison (C): Individuals with different levels of insulin resistance surrogate indices; Outcomes (O): BMD of different areas when beta coefficient was reported by multivariate analysis; Type of Design (T): Observational studies. Here are the formulas illustrating the definitions for the insulin surrogate indices.
For men:
For women:
Exclusion criteria were studies that involved patients with diabetes, studies without adjustment for covariates such as multivariable logistic regression analysis, non-English studies, studies that did not report BMD values (T score or Z score), FRAX or osteoporosis (low T score +/- fracture), as well as case reports, reviews, editorials, commentaries, and conference abstracts that lacked original research data or detailed methodologies.
Data extraction and quality assessment
After conducting a full-text screening, two researchers (S.M.A., Y.T.) separately entered the data into an existing Excel spreadsheet. This document included two categories of data (1): demographic details like journal, authors, publication year, study location, design, sample size, gender, patient age, IR index, and outcomes; and (2) specific results such as covariates, beta coefficient, insulin resistance indices (HOMA-IR, HOMA-β, VAI, TyG, TyG-BMI, TyG-WTHR, TyG-WC, and METS-IR) levels, and BMD of various anatomical sites. The third reviewer (A.H.H.) assessed the conflicts.
Two authors (N.Z., A.A.) individually assessed the studies’ quality using the critical appraisal checklists developed by the Joanna Briggs Institute (JBI) for cohort studies (22). The JBI critical evaluation checklist consists of eleven components for cohort studies and eight for cross-sectional studies. The checklist assesses specific research topics to detect possible bias risks and offers direct binary answers. If the answer was yes, the question received a score of 1. Responses that were negative, ambiguous, or irrelevant were assigned a score of 0 (23). Scheduled meetings were arranged in order to come to a common agreement and settle any disagreements.
Results
Study selection
The initial systematic search of databases, including PubMed, Web of Science, Scopus, and Embase, identified 7,518 studies. After removing duplicates (n = 4,021), 3,497 records proceeded to title and abstract screening, of which 3,380 studies were excluded as irrelevant. A full-text assessment was conducted for the remaining 117 studies. Twenty-seven of these studies were deemed eligible for systematic review (Figure 1).
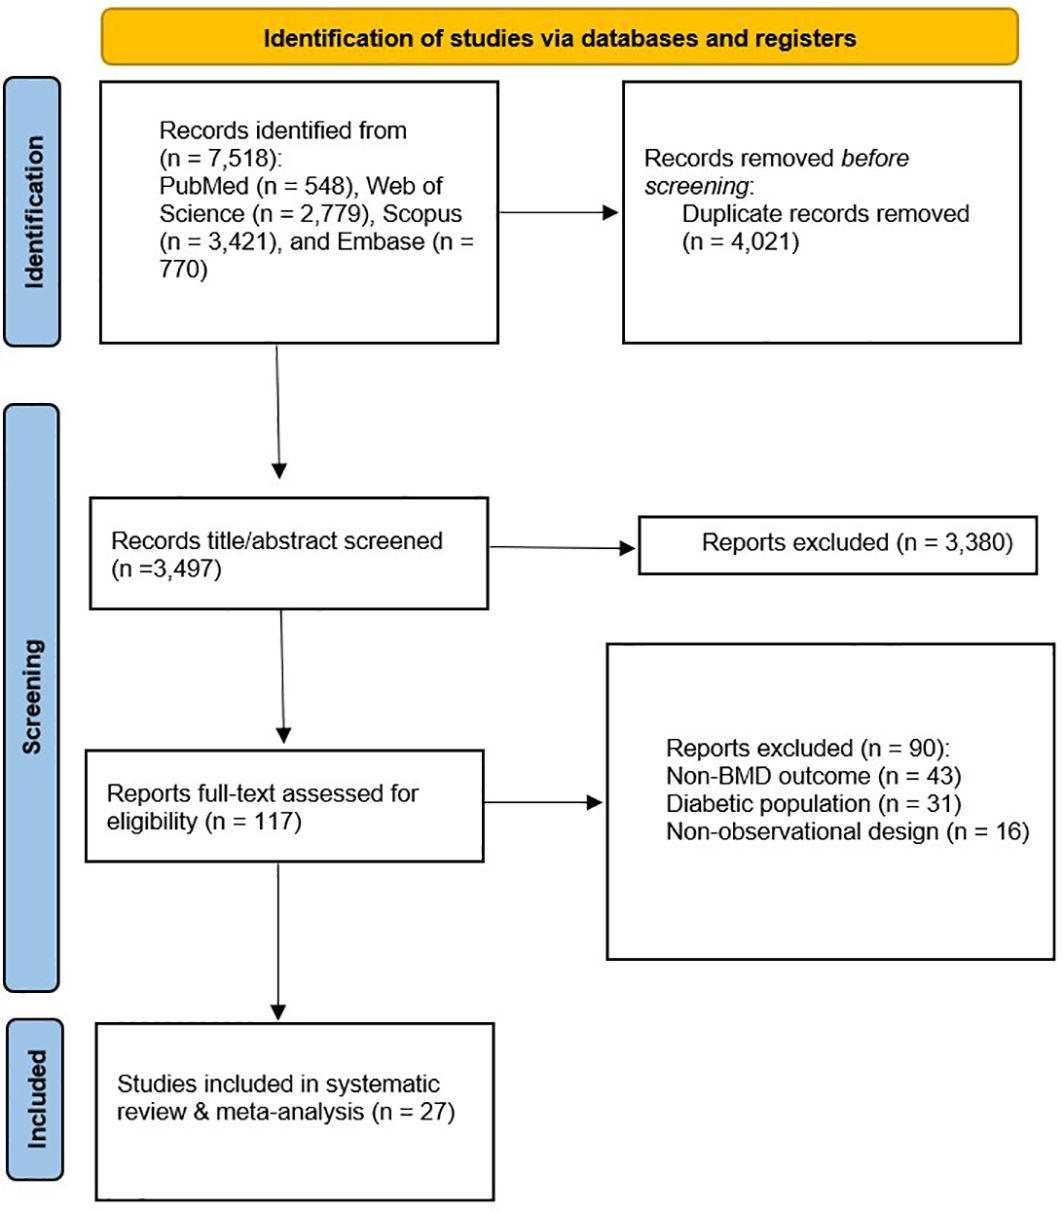
Figure 1. PRISMA flow diagram.
Baseline characteristics and quality assessment
This systematic review included studies conducted across various geographic regions, comprising the USA (5, 20, 24–32), China (33–37), Korea (19, 38–41), Brazil (42, 43), Japan (44), Singapore (45), Serbia (46) and Spain (47). The studies utilized cohort (20, 36, 44, 45) and cross-sectional (5, 19, 24–35, 37–43, 46, 47) methodologies. Data for 71,525 participants (52.1% female) were analyzed. The mean age of our population ranged from 30.3 (19) to 73.6 (20). Different indices, such as HOMA-IR, HOMA-β, VAI, TyG, TyG-BMI, TyG-WTHR, TyG-WC, and METS-IR, were used to indicate insulin resistance. Various outcome measures and additional information are summarized in Table 1.
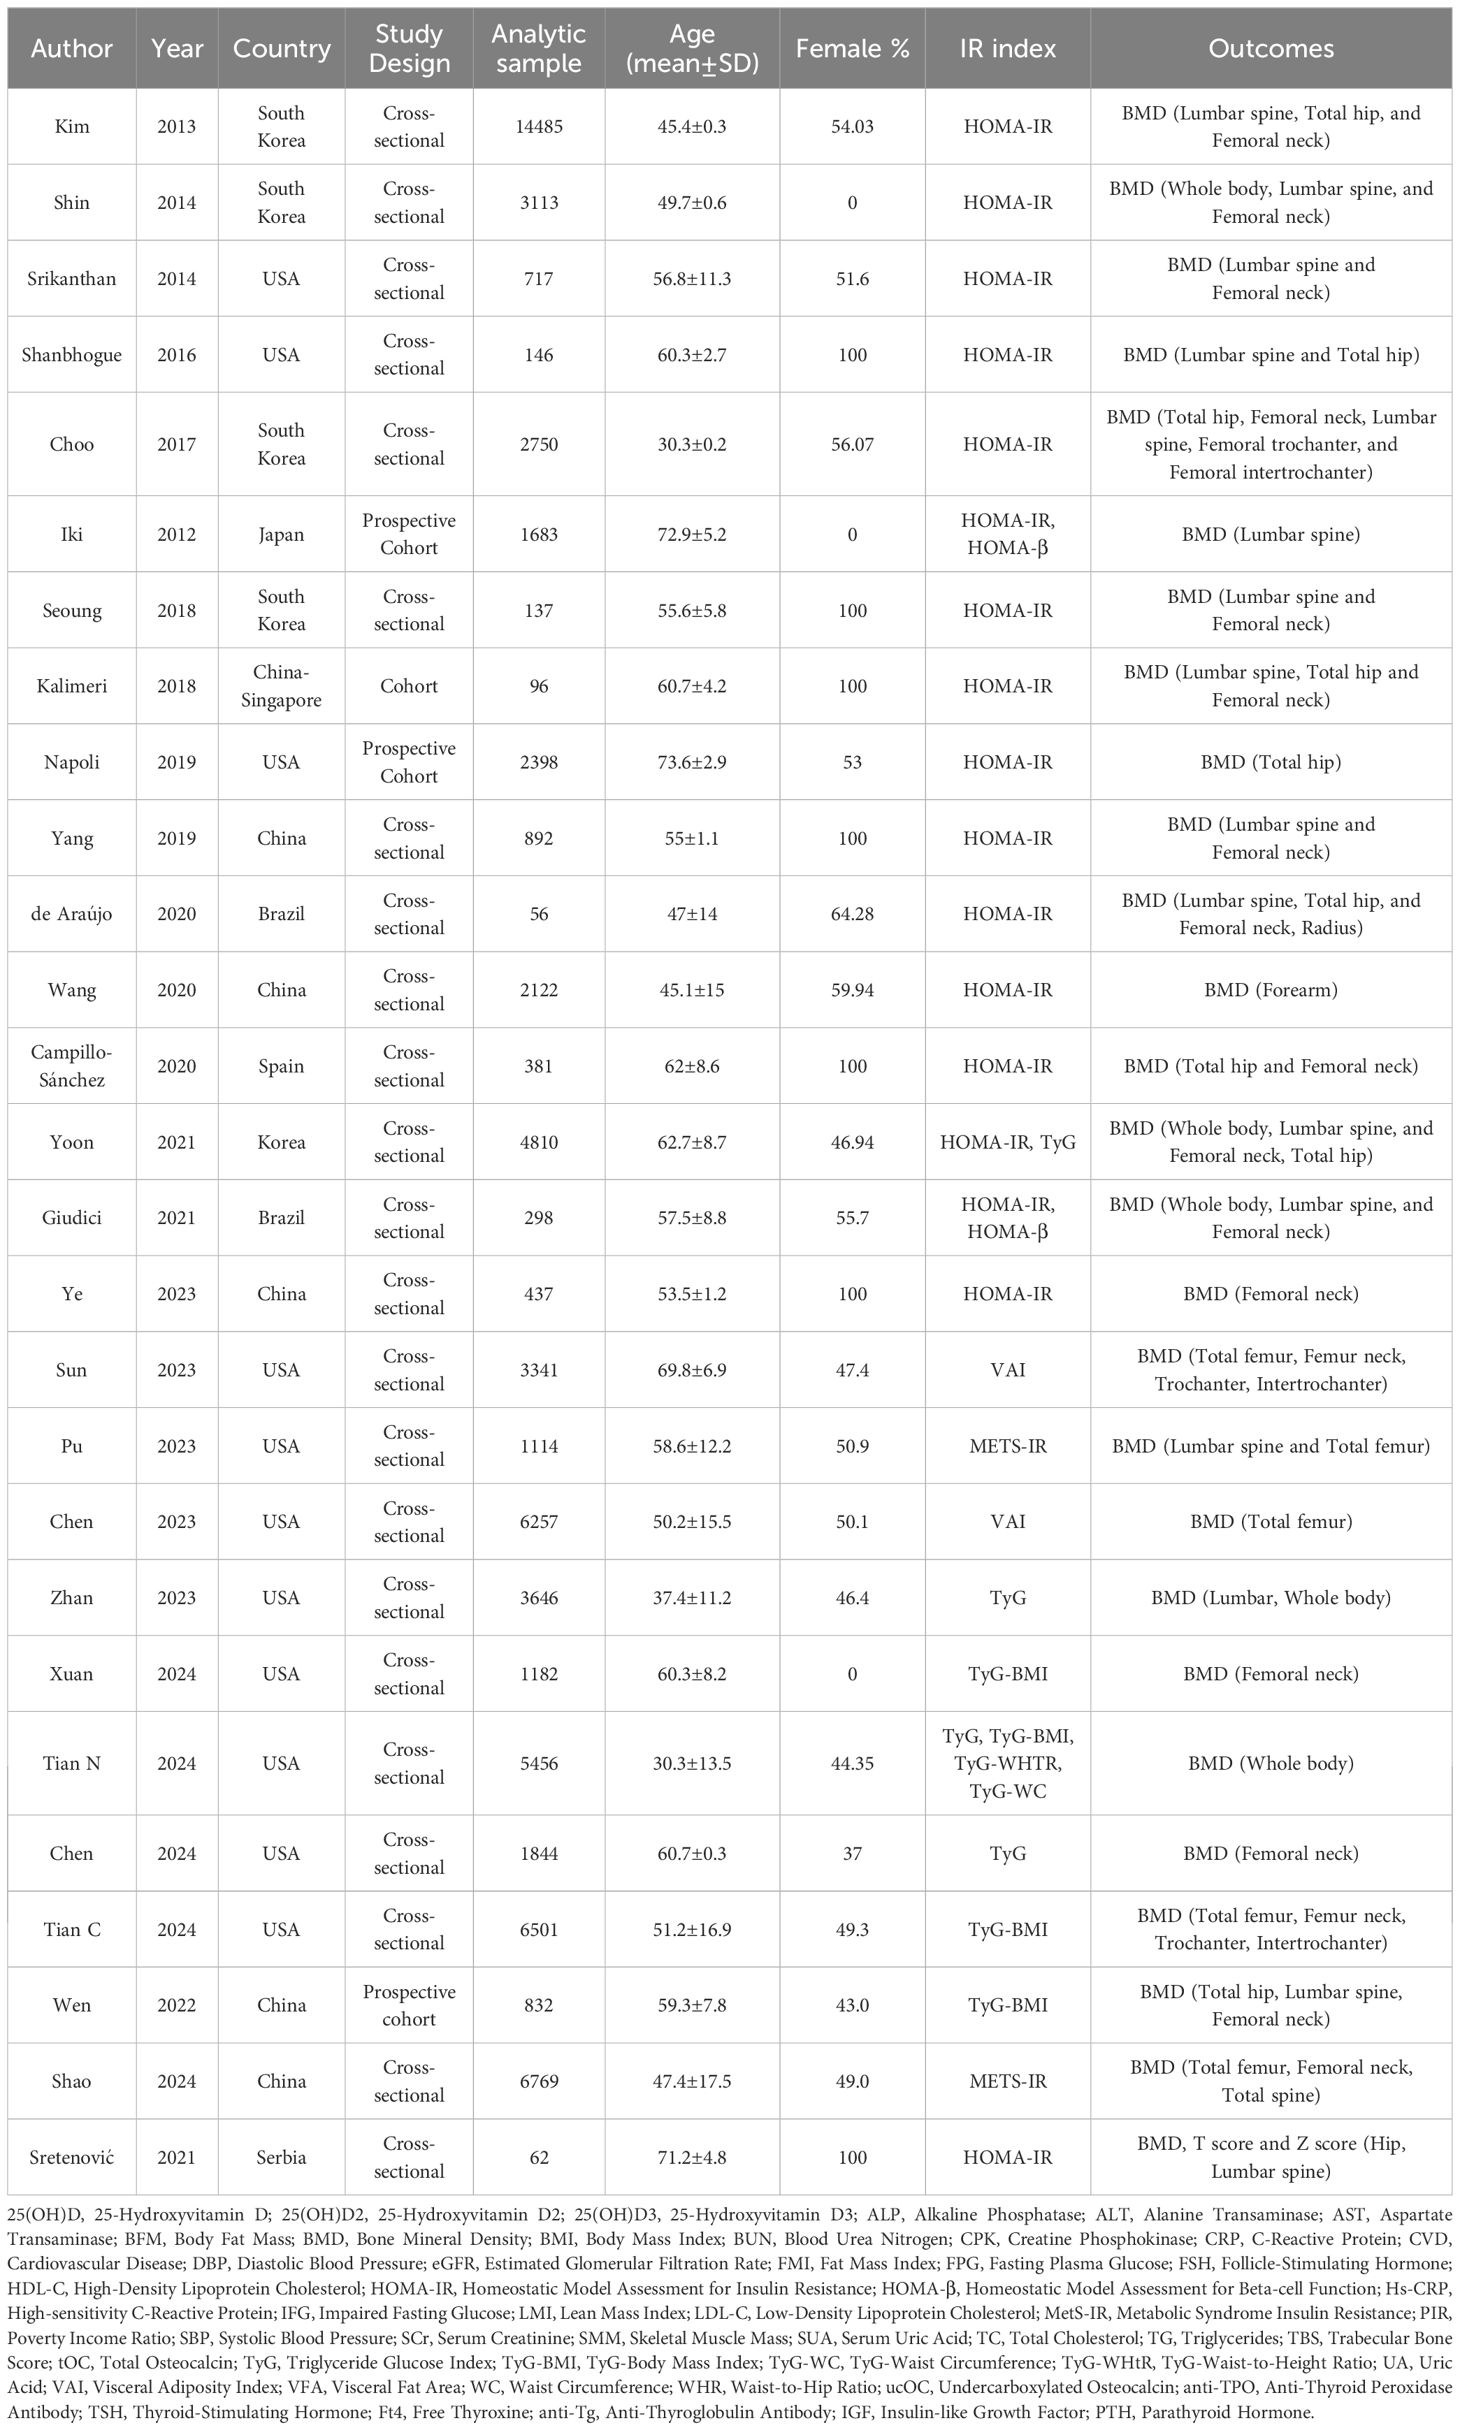
Table 1. Baseline characteristics of the included studies.
The quality assessment of cross-sectional studies in this review indicated a uniformly high standard, with all studies meeting each of the eight JBI quality criteria. The cohort studies also demonstrated high quality, with most criteria consistently met across studies. However, there were some limitations in addressing incomplete follow-up in two of the cohort studies (44, 45), which did not employ strategies to address this issue. Despite these minor limitations, the overall methodological quality of the included studies was robust (Supplementary Tables S1, S2).
HOMA-IR and bone mineral density
A number of 17 studies reported the association between HOMA-IR and BMD (5, 19, 20, 24, 33–35, 38–47). Several results of studies reported that elevated levels of HOMA-IR were inversely associated with BMD (5, 19, 34, 38, 39, 41, 45), with the adjusted regression coefficient ranging from -1.11 (38) to -0.021 (39). As for specific sites of BMD, higher levels of HOMA-IR had a negative effect on whole-body BMD, with the adjusted regression coefficient ranging from -0.041 (41) to -0.025 (39), femoral neck BMD [from -1.09 (38) to -0.021 (39)], and lumbar BMD [from β = -0.49 (38) to β = -0.084 (19)]. Numerous results showed that the level of HOMA-IR does not statistically correlate with BMD (5, 19, 20, 24, 38–47). Kim et al., with a sample size of 14,485, revealed that in premenopausal women, no association was found between the HOMA-IR index and lumbar spine BMD (β = -0.16, P = 0.352). Lumbar spine, total hip, and femoral neck BMD were not correlated with the HOMA-IR level in postmenopausal women (β = 0.2, P = 0.482; β = 0.03, P = 0.940; and β = -0.45, P = 0.409) (38). Yoon et al., with a sample size of 4,810, reported that HOMA-IR in men’s lumbar spine (β = -0.014, P = 0.499) and total hip (β = -0.021, P = 0.344), as well as in women’s lumbar spine (β = 0.006, P = 0.813), femoral neck (β = -0.043, P = 0.115), total hip (β = 0.013, P = 0.620), whole body (β = -0.026, P = 0.260) BMD, were not associated with HOMA-IR levels (41). In contrast, Yang et al. identified a direct correlation between HOMA-IR and BMD of the lumbar spine and femoral neck (β = 0.103, P = 0.002; β = 0.091, P = 0.009) (33). Likewise, Ye et al. found that greater insulin resistance was associated with increased femoral neck BMD in nondiabetic postmenopausal women (β [95%CI] = 0.025 [0.003, 0.047], P = 0.026) (35).
TyG and bone mineral density
Four studies reported on the relationship between TyG index and BMD (28, 30, 32, 41). Yoon et al. found that an inverse association existed between TyG index and femoral neck, total hip, and whole-body BMD in non-diabetic men (β = -0.085, P < 0.001; β = -0.046, P = 0.037; β = -0.098, P < 0.001) and femoral neck and whole-body BMD in women (β = -0.071, P = 0.008; β = -0.065, P = 0.005), but no association was observed in the total hip area BMD of women (β = -0.003, P = 0.911). Lumbar spine BMD was found to have no relationship with TyG index in men (β = -0.028, P = 0.168) or women (β = 0.016, P = 0.500) (41). According to Zhan et al., an inverse correlation existed between TyG index and BMD of the lumbar spine and whole body (β [95%CI] = -0.008 [-0.017, 0], β [95%CI] = -0.007 [-0.012, -0.001]) (28). Conversely, Tian N et al. found a positive correlation between whole-body BMD and TyG (β [95%CI] = 0.0124 [0.001, 0.024]) (30). Furthermore, Chen et al. found no association between femoral neck BMD and TyG index (32). Therefore, most of the literature suggests that a higher TyG index, reflecting higher insulin resistance, is generally associated with lower BMD.
VAI and bone mineral density
Two studies reported on VAI and BMD (25, 27). There was a positive association between VAI and BMD of total femur, femoral neck, trochanter, and intertrochanter, Sun et al. reported (β [95%CI] = 0.006 [0.004, 0.009], P < 0.001; β [95%CI] = 0.004 [0.002, 0.006], P = 0.001; β [95%CI] = 0.005 [0.003, 0.007], P < 0.001; β [95%CI] = 0.007 [0.004, 0.010], P < 0.001) (27). Chen et al. displayed a substantially positive association between femoral BMD and VAI (β [95%CI] = 0.016 [0.014, 0.019], P < 0.001) (25). Hence, a greater VAI index, indicating increased insulin resistance, was generally linked to higher BMD.
Other insulin surrogate indices and bone mineral density
HOMA-β (43, 44), TyG-BMI (29–31, 36), METS-IR (26), TyG-WTHR (30), and TyG-WC (30) were reported in very few studies. Giudici et al. reported on HOMA-β and BMD of the total body, lumbar spine, and femur (β = -0.006, P = 0.631; β = 0.071, P = 0.206; β = -0.021, P = 0.089), and found no statistically significant association (43). Similarly, Iki et al. found no correlation between HOMA-β and lumbar spine BMD (β = 0.043, P = 0.0948) (44). Therefore, it can be deduced that no association exists between HOMA-β and BMD.
As for TyG-BMI, Xuan et al. assessed insulin resistance by TyG-BMI, which demonstrated a positive association between TyG-BMI and femoral neck BMD as well (β [95%CI] = 0.058 [0.045, 0.072], P < 0.001) (29), similar to Tian N et al. assessing whole-body BMD and TyG-BMI (β [95%CI] = 0.0004 [0.0003, 0.0004], P <0.0001) (30) and Tian C et al. assessing total femur, femur neck, trochanter, intertrochanter BMD and TyG-BMI (β [95%CI] = 0.002 [0.002, 0.002], P<0.00001; β [95%CI] = 0.001 [0.001, 0.002], P<0.00001; β [95%CI] = 0.001 [0.001, 0.001], P<0.00001; β [95%CI] = 0.002 [0.002, 0.002], P<0.00001) (31). Likewise, Wen et al. indicated positive correlation between TyG-BMI and femoral neck, lumbar spine and total hip BMD in both male (respectively β = 0.224, 0.185, 0.271; p < 0.001) and female (respectively β = 0.279, 0.192, 0.415; p < 0.001) (36).
Regarding METS-IR, Pu et al. illustrated a direct correlation between elevated levels of METS-IR, indicating higher insulin resistance, and increased total femoral and lumbar spine BMD (β [95%CI] = 0.005 [0.004, 0.006]; β = 0.005 [0.004, 0.006]) (26). Similarly, Shao et al. found positive association between METS-IR and BMD of total femur, femoral neck and total spine (β[95%CI] = 0.060 [0.057, 0.064]; β[95%CI] = 0.049 [0.045, 0.052]; β[95%CI] = 0.040 [0.036, 0.044]; P<0.001) (37).
Lastly, a positive association was seen between whole-body BMD and TyG-WTHR (β[95%CI] = 0.012 [0.008, 0.016], P<0.0001) and TyG-WC (β[95%CI] = 0.0001 [0.0001, 0.0001], P<0.0001) (30). Summarized information regarding the qualitative synthesis of the included data is visibale in Table 2.
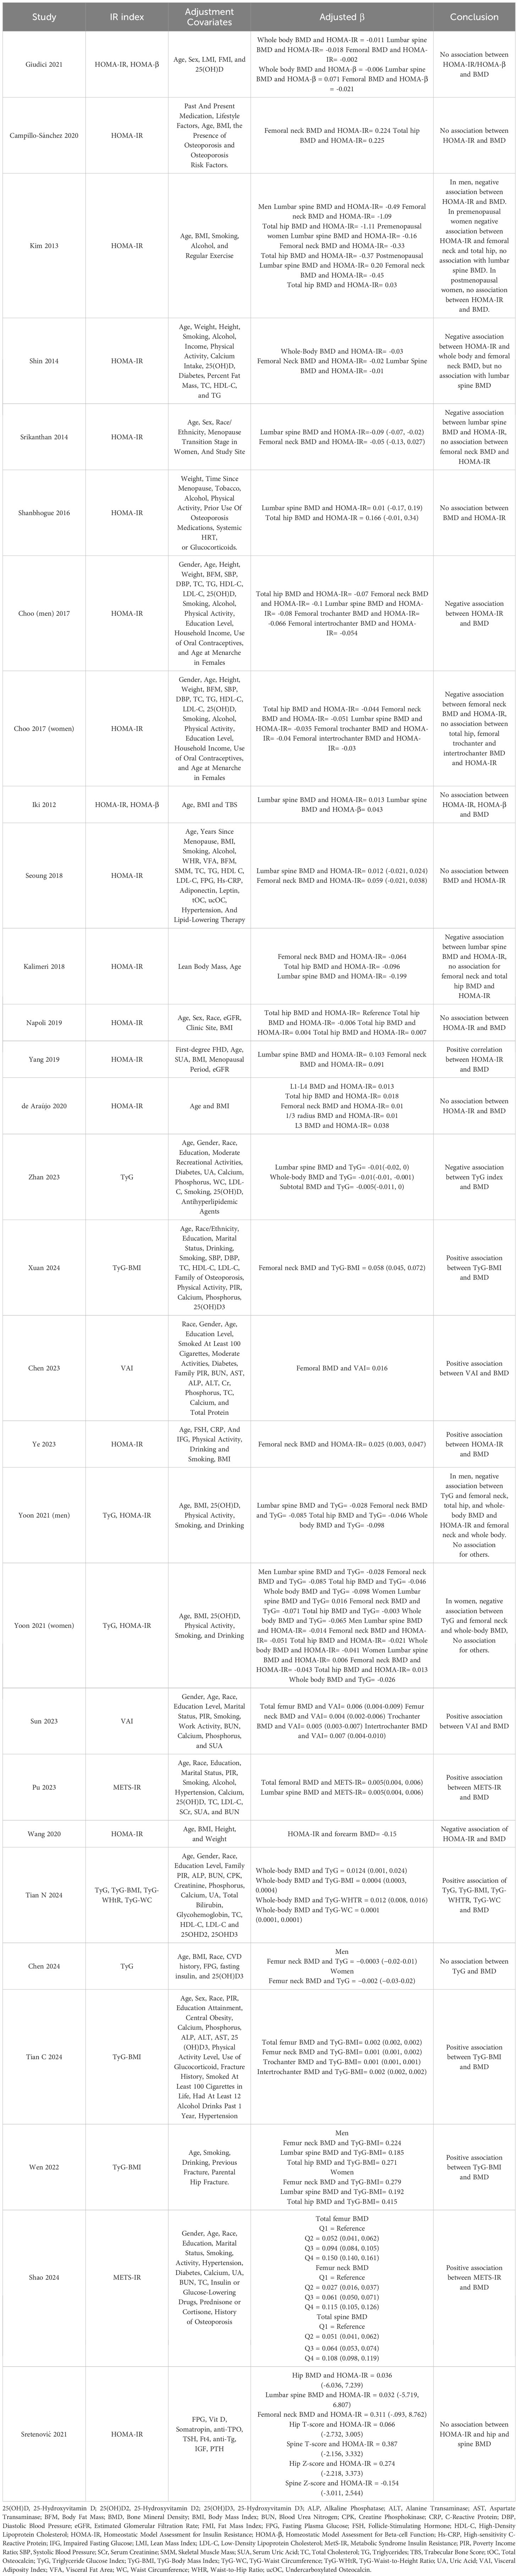
Table 2. Summary of main findings.
Discussion
A total of 27 cohorts and cross-sectional studies consisting of 71,525 participants were included in this systematic review to evaluate the possible association of insulin resistance surrogate indices such as HOMA (IR and β), TyG and its derivates (including TyG-BMI, TyG-WtHR, and TyG-WC), as well as METS-IR and VAI, with BMD of different sites. The HOMA index, which has been examined excessively in several studies, appears to have no association with BMD. The majority of the literature indicates that a higher TyG index is linked to a lower BMD. Although other insulin resistance indices (TyG derivates, METS-IR, and VAI) have been investigated in few studies and there is limited evidence of their association, they have a positive association with BMD (Figure 2).
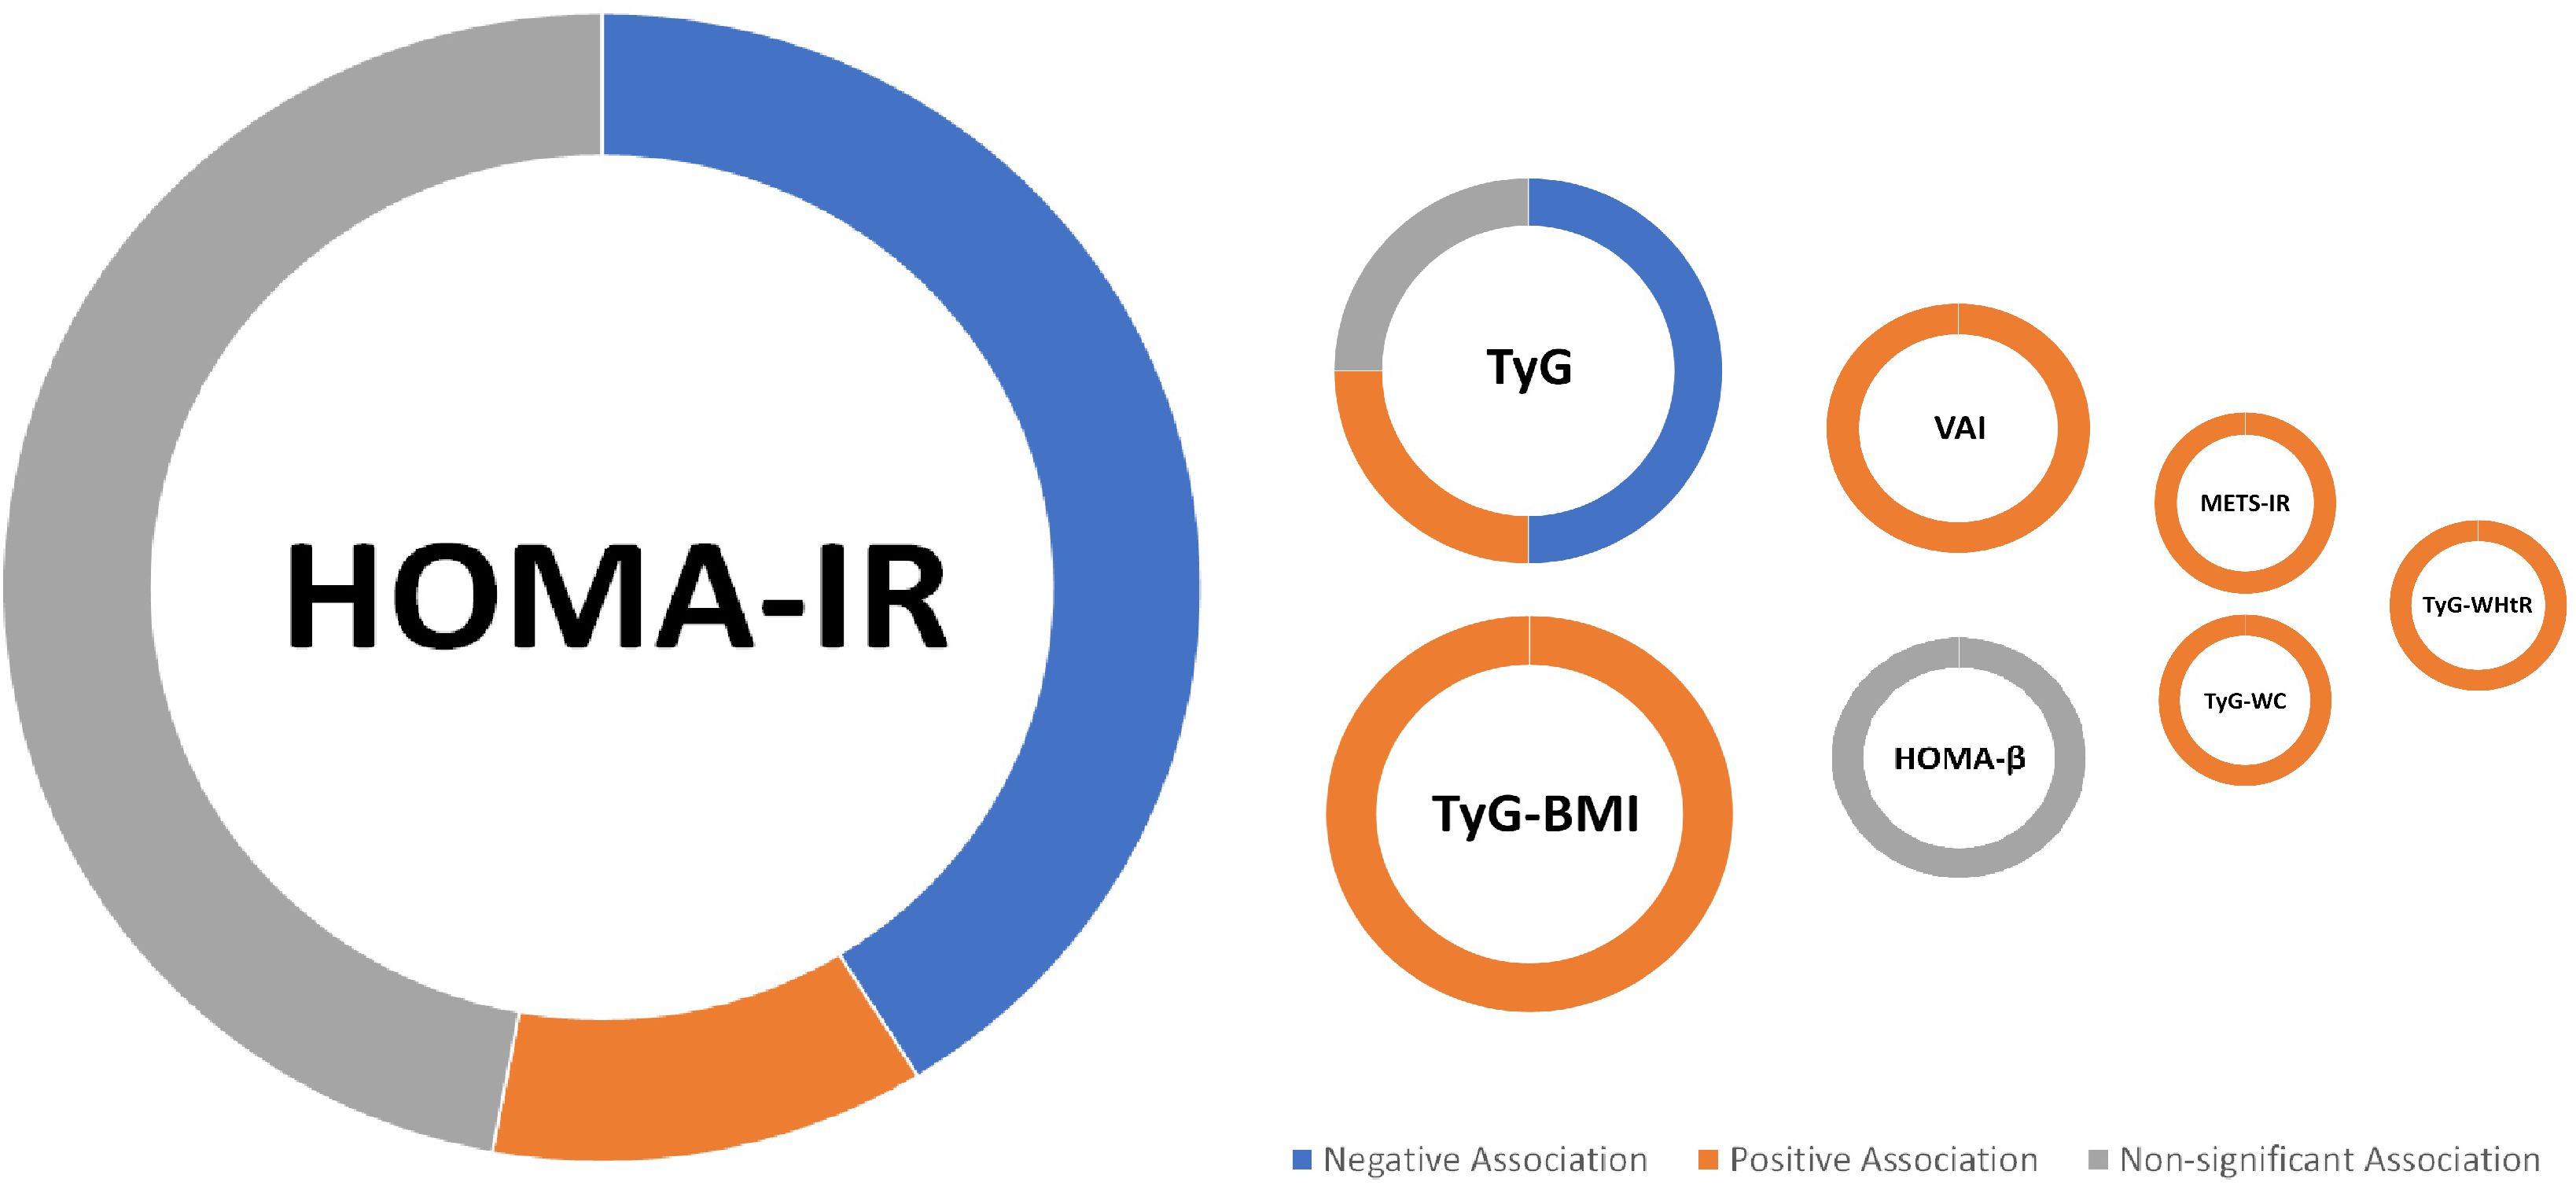
Figure 2. Summary of findings; For the IR index, a larger circle indicates a greater number of included studies (e.g., the largest circle belongs to HOMA-IR, on which the highest number of studies has been conducted (17 studies).
Insulin resistance, defined as peripheral tissue’s failure to respond to insulin, is a key feature of metabolic syndrome and an increasing risk factor for BMD loss (48, 49). Conversely, insulin promotes osteoblast proliferation and survival, resulting in increased bone mass. Because insulin resistance and hyperinsulinism are major causes of diabetes, bone mass could be increased in type 2 diabetic patients (50, 51). Therefore, insulin resistance could conceivably have mixed effects on bone mass. In IR, insulin signaling in osteoblasts is impaired, reducing their activity and leading to decreased bone formation (52). Additionally, IR promotes chronic inflammation, elevating pro-inflammatory cytokines like TNF-α and IL-6, which stimulate osteoclasts (bone-resorbing cells), accelerating bone resorption (53). Elevated levels of advanced glycation end products (AGEs) in IR further degrade bone quality by impairing collagen structure, exacerbating bone fragility (54). Insulin resistance promotes the differentiation of mesenchymal stem cells into adipocytes rather than osteoblasts within the bone marrow. This shift increases marrow adipose tissue (MAT), which negatively correlates with BMD and contributes to overall bone loss. The presence of excess adipose tissue in the marrow can disrupt the delicate balance between bone formation and resorption (55). Elevated glucose levels can further impair osteoblastogenesis by activating pathways that promote adipogenesis while inhibiting the expression of key osteogenic transcription factors like Runx2. This dual effect exacerbates the decline in bone mass associated with IR (56). Due to the lack of a standardized definition of insulin resistance, various indices with different components have been established that can probably predict it and are widely used in studies (57).
The HOMA-IR and HOMA-β homeostasis models rely on basal plasma insulin and glucose measurements to assess insulin resistance and pancreatic β cell activity, respectively (58). They have been widely validated and utilized in clinical and epidemiological investigations (59–61). The triglyceride and glucose index, also known as the TyG index, is another insulin resistance surrogate index that has moderate predictive accuracy (62). The TyG index’s accuracy can be improved by combining it with adiposity indicators such as BMI, WC, and waist-to-height ratio, resulting in TyG-BMI, TyG-WT, and TyG-WtHR (63, 64). As for TyG-BMI, high triglycerides mechanistically lead to lipotoxicity by accumulating in non-adipose tissues, which impairs insulin signaling and disrupts pancreatic β-cell function, increasing IR. High glucose levels also heighten oxidative stress by raising reactive oxygen species (ROS) levels, which harm β-cells. Additionally, excess visceral fat—often reflected in elevated TyG-BMI—contributes to chronic low-grade inflammation, further inhibiting insulin pathways. The TyG-WtHR combines TyG with waist-to-height ratio, highlighting central obesity’s role in IR. Central obesity elevates circulating free fatty acids, impairing insulin signaling in muscles and liver. This also leads to inflammation, oxidative stress, and reduced metabolic flexibility—the body’s ability to alternate between fat and carbohydrate oxidation—which disrupts glucose homeostasis. Lastly, the TyG-WC index incorporates waist circumference to assess IR risks tied to abdominal obesity. High waist circumference, linked to greater visceral fat, increases pro-inflammatory cytokine secretion, contributing to systemic IR. It also correlates with altered lipid metabolism, with elevated triglycerides and reduced HDL cholesterol worsening insulin sensitivity.
The visceral adiposity index, or VAI, is another insulin resistance surrogate composed of BMI, WC, triglyceride, and HDL levels, VAI is another metric that probably predicts insulin resistance (65). The METS-IR index incorporates components of metabolic syndrome, including waist circumference, blood pressure, fasting glucose, and lipids, to gauge IR. This syndrome affects IR through adipokine dysregulation, where altered adipokine secretion (e.g., elevated leptin and reduced adiponectin) fosters systemic inflammation and leptin resistance, leading to hyperglycemia. It also induces endothelial dysfunction, reducing nitric oxide and impairing glucose uptake (66). Although the variety of insulin resistance surrogates and their components enables the assessment of many aspects of insulin resistance in individuals, it also brings significant heterogeneity in their implications and associated expected outcomes, such as BMD. The next section attempts to construct a framework for the interpretation and implementation of each insulin resistance surrogate in predicting BMD.
Among studies that evaluated the association between HOMA-IR and BMD, 8 found no association, 7 found a negative association, and 2 found a positive association. A total of two studies that evaluated the association between BMD and HOMA-β also indicated no association. Apparently, the formulas of HOMA-IR and HOMA-β, which contain fasting plasma glucose and insulin, can be valid and reliable in the prediction of insulin resistance (67). However, they failed to estimate BMD accurately, as the majority of studies indicated no association between them.
The review of the studies that assessed the TyG index and BMD association identified three negative associations, two no associations, and one positive association. As a result, the serum triglyceride and glucose index, which has moderate to low accuracy in diagnosing insulin resistance (62), is unlikely to be associated with BMD. However, when the details of the results were reviewed, it turned out that all three studies that found a negative relationship between TyG and BMD investigated whole-body BMD. None of the studies that found no association between TyG and BMD did so with whole-body BMD. This topic could be the focus of future research, as three studies may not be enough to provide evidence of a negative association between TyG and whole-body BMD.
TyG-BMI was found to be positively associated with BMD in three studies, while TyG-WtHR and TyG-WC were positively associated with BMD in one study. The potential positive correlation between TyG-BMI and higher BMD could be explained by incorporating BMI into the TyG formula, as increased body weight increases mechanical load and activates osteoblasts, and each unit increase in BMI is associated with a 0.0082 g/cm2 increase in BMD (68–70). Two studies found a positive connection between VAI and BMD, while one found a favorable association between METS-IR and BMD. Although there is limited evidence of an association between BMD, METS-IR, and VAI, this can be explained by the fact that both indices include an integrated BMI component (the VAI formula contains HDL, WC, triglyceride, and BMI, and the METS-IR formula contains fasting glucose, fasting triglyceride, HDL-c, and BMI).
This study carried several limitations. First, the variety in populations and insulin resistance indices across the included studies precluded the possibility of performing a meta-analysis. Additionally, the cross-sectional nature of most included studies restricts the ability to infer causality between insulin resistance and BMD. Variability in the covariates adjusted for in the different studies may also introduce bias, as some relevant confounders might not have been consistently accounted for. Furthermore, the diverse characteristics of the sample size of studies in sex, physiologic parameters (e.g., menstruation status), and underlying disease contribute to the heterogeneity of studies on the association between insulin resistance surrogates and BMD. Another limitation is that the relationship between insulin resistance indices and specific bone quality parameters, such as bone microarchitecture and strength, has not been explored in the included studies, calling for further research focusing on how insulin resistance affects bone health beyond bone mineral density. To establish a firm conclusion, the link between insulin resistance indices and restricted evidence, particularly the TyG index, should be investigated in cohort studies.
Conclusion
Despite the heterogenicity of studies on the association between the HOMA index and BMD, there is probably no association. Although there are few studies on other insulin resistance surrogate indices, TyG may have a negative association with whole BMD. Other insulin resistance indices, such as TyG derivates, VAI, and METS-IR, are observed to have positive associations, which may be due to the addition of BMI into their formula. Future research should prioritize conducting longitudinal studies in order to explain causation and gain a deeper understanding of the mechanisms involved in these correlations. Research should investigate how lifestyle interventions, like diet and exercise, can affect insulin resistance levels and their influence on bone health.
Data availability statement
The original contributions presented in the study are included in the article/Supplementary Material. Further inquiries can be directed to the corresponding author.
Author contributions
AS: Writing – review & editing, Writing – original draft, Validation, Supervision, Methodology, Investigation, Conceptualization. AA: Writing – review & editing, Writing – original draft, Project administration, Methodology, Formal analysis, Data curation. AG-R: Writing – review & editing, Writing – original draft, Visualization, Resources, Conceptualization. FK: Writing – review & editing, Writing – original draft, Investigation. NZ: Writing – review & editing, Writing – original draft, Validation, Software, Investigation, Data curation. SA: Writing – review & editing, Writing – original draft, Data curation. YT: Writing – review & editing, Writing – original draft, Data curation. AH: Writing – review & editing, Writing – original draft, Validation, Supervision, Project administration, Investigation.
Funding
The author(s) declare that no financial support was received for the research, authorship, and/or publication of this article.
Conflict of interest
The authors declare that the research was conducted in the absence of any commercial or financial relationships that could be construed as a potential conflict of interest.
Publisher’s note
All claims expressed in this article are solely those of the authors and do not necessarily represent those of their affiliated organizations, or those of the publisher, the editors and the reviewers. Any product that may be evaluated in this article, or claim that may be made by its manufacturer, is not guaranteed or endorsed by the publisher.
Supplementary material
The Supplementary Material for this article can be found online at: https://www.frontiersin.org/articles/10.3389/fendo.2024.1499479/full#supplementary-material
Abbreviations
BMD, Bone Mineral Density; HOMA-IR, Homeostatic Model Assessment for Insulin Resistance; TyG, Triglyceride Glucose Index; VAI, Visceral Adiposity Index; BMI, Body Mass Index; WC, Waist Circumference; METS-IR, Metabolic Syndrome Insulin Resistance; LP-IR, Lipoprotein Insulin Resistance Index; HDL-C, High-Density Lipoprotein Cholesterol; Adipo-IR, Adipose Insulin Resistance Index; DM, Diabetes Mellitus; IR, Insulin Resistance; TyG-BMI, Triglyceride Glucose Index-Body Mass Index; TyG-WTHR, Triglyceride Glucose Index-Waist-to-Height Ratio; TyG-WC, Triglyceride Glucose Index-Waist Circumference; TyG-NC, Triglyceride Glucose Index-Neck Circumference; TyG-NHtR, Triglyceride Glucose Index-Neck to Height Ratio; HOMA-β, Homeostatic Model Assessment for Beta-Cell Function.
References
1. Zhu Z, Yu P, Wu Y, Wu Y, Tan Z, Ling J, et al. Sex specific global burden of osteoporosis in 204 countries and territories, from 1990 to 2030: an age-period-cohort modeling study. J nutrition Health aging. (2023) 27:767–74. doi: 10.1007/s12603-023-1971-4
2. Shen Y, Huang X, Wu J, Lin X, Zhou X, Zhu Z, et al. The global burden of osteoporosis, low bone mass, and its related fracture in 204 countries and territories, 1990-2019. Front Endocrinol (Lausanne). (2022) 13:882241. doi: 10.3389/fendo.2022.882241
3. Wilson-Barnes SL, Lanham-New SA, Lambert H. Modifiable risk factors for bone health & fragility fractures. Best Pract Res Clin Rheumatol. (2022) 36:101758. doi: 10.1016/j.berh.2022.101758
4. Pouresmaeili F, Kamalidehghan B, Kamarehei M, Goh YM. A comprehensive overview on osteoporosis and its risk factors. Ther Clin Risk Manage. (2018) 14:2029–49. doi: 10.2147/TCRM.S138000
5. Srikanthan P, Crandall CJ, Miller-Martinez D, Seeman TE, Greendale GA, Binkley N, et al. Insulin resistance and bone strength: findings from the study of midlife in the United States. J Bone Miner Res. (2014) 29:796–803. doi: 10.1002/jbmr.2083
6. Yang J, Hong N, Shim J-S, Rhee Y, Kim HC. Association of insulin resistance with lower bone volume and strength index of the proximal femur in nondiabetic postmenopausal women. J Bone Metab. (2018) 25:123. doi: 10.11005/jbm.2018.25.2.123
7. Jain RK, Vokes T. Visceral adipose tissue is negatively associated with bone mineral density in NHANES 2011-2018. J Endocr Soc. (2023) 7:bvad008. doi: 10.1210/jendso/bvad008
8. Kim J, Ha J, Jeong C, Lee J, Lim Y, Jo K, et al. Bone mineral density and lipid profiles in older adults: a nationwide cross-sectional study. Osteoporos Int. (2023) 34:119–28. doi: 10.1007/s00198-022-06571-z
9. Chin KY, Wong SK, Ekeuku SO, Pang KL. Relationship between metabolic syndrome and bone health - an evaluation of epidemiological studies and mechanisms involved. Diabetes Metab Syndr Obes. (2020) 13:3667–90. doi: 10.2147/DMSO.S275560
10. Singh B, Saxena A. Surrogate markers of insulin resistance: A review. World J Diabetes. (2010) 1:36–47. doi: 10.4239/wjd.v1.i2.36
11. Huang R, Cheng Z, Jin X, Yu X, Yu J, Guo Y, et al. Usefulness of four surrogate indexes of insulin resistance in middle-aged population in Hefei, China. Ann Med. (2022) 54:622–32. doi: 10.1080/07853890.2022.2039956
12. Fiorentino TV, Marini MA, Succurro E, Andreozzi F, Sesti G. Relationships of surrogate indexes of insulin resistance with insulin sensitivity assessed by euglycemic hyperinsulinemic clamp and subclinical vascular damage. BMJ Open Diabetes Res Care. (2019) 7:e000911. doi: 10.1136/bmjdrc-2019-000911
13. Rattanatham R, Tangpong J, Chatatikun M, Sun D, Kawakami F, Imai M, et al. Assessment of eight insulin resistance surrogate indexes for predicting metabolic syndrome and hypertension in Thai law enforcement officers. PeerJ. (2023) 11:e15463. doi: 10.7717/peerj.15463
14. Antoniolli LP, Nedel BL, Pazinato TC, de Andrade Mesquita L, Gerchman F. Accuracy of insulin resistance indices for metabolic syndrome: a cross-sectional study in adults. Diabetol Metab Syndrome. (2018) 10:65. doi: 10.1186/s13098-018-0365-y
15. Zhuo M, Chen Z, Zhong M-L, Lei F, Qin J-J, Liu S, et al. Association of insulin resistance with bone mineral density in a nationwide health check-up population in China. Bone. (2023) 170:116703. doi: 10.1016/j.bone.2023.116703
16. Gu P, Pu B, Xin Q, Yue D, Luo L, Tao J, et al. The metabolic score of insulin resistance is positively correlated with bone mineral density in postmenopausal patients with type 2 diabetes mellitus. Sci Rep. (2023) 13:8796. doi: 10.1038/s41598-023-32931-8
17. Fu YH, Liu WJ, Lee CL, Wang JS. Associations of insulin resistance and insulin secretion with bone mineral density and osteoporosis in a general population. Front Endocrinol (Lausanne). (2022) 13:971960. doi: 10.3389/fendo.2022.971960
18. Barrett-Connor E, Kritz-Silverstein D. Does hyperinsulinemia preserve bone? Diabetes Care. (1996) 19:1388–92. doi: 10.2337/diacare.19.12.1388
19. Choo MS, Choi SR, Han JH, Lee SH, Shim YS. Association of insulin resistance with near peak bone mass in the femur and lumbar spine of Korean adults aged 25-35: The Korean National Health and Nutrition Examination Survey 2008-2010. PLoS One. (2017) 12:e0177311. doi: 10.1371/journal.pone.0177311
20. Napoli N, Conte C, Pedone C, Strotmeyer ES, Barbour KE, Black DM, et al. Effect of insulin resistance on BMD and fracture risk in older adults. J Clin Endocrinol Metab. (2019) 104:3303–10. doi: 10.1210/jc.2018-02539
21. Moher D, Liberati A, Tetzlaff J, Altman DG. Preferred reporting items for systematic reviews and meta-analyses: the PRISMA statement. PLoS Med. (2009) 6:e1000097. doi: 10.1371/journal.pmed.1000097
22. Ma L-L, Wang Y-Y, Yang Z-H, Huang D, Weng H, Zeng X-T. Methodological quality (risk of bias) assessment tools for primary and secondary medical studies: what are they and which is better? Military Med Res. (2020) 7:7. doi: 10.1186/s40779-020-00238-8
23. Porritt K, Gomersall J, Lockwood C. JBI's Systematic Reviews: Study selection and critical appraisal. Am J Nurs. (2014) 114:47–52. doi: 10.1097/01.NAJ.0000450430.97383.64
24. Shanbhogue VV, Finkelstein JS, Bouxsein ML, Yu EW. Association between insulin resistance and bone structure in nondiabetic postmenopausal women. J Clin Endocrinol Metab. (2016) 101:3114–22. doi: 10.1210/jc.2016-1726
25. Chen ZH, Zhou TF, Bu YT, Yang L. Bone mineral density saturation as influenced by the visceral adiposity index in adults older than 20 years: a population-based study. Lipids Health Dis. (2023) 22:170. doi: 10.1186/s12944-023-01931-y
26. Pu B, Gu P, Yue D, Xin Q, Lu W, Tao J, et al. The METS-IR is independently related to bone mineral density, FRAX score, and bone fracture among U.S. non-diabetic adults: a cross-sectional study based on NHANES. BMC Musculoskelet Disord. (2023) 24:730. doi: 10.1186/s12891-023-06817-9
27. Sun A, Hu J, Wang S, Yin F, Liu Z. Association of the visceral adiposity index with femur bone mineral density and osteoporosis among the U.S. older adults from NHANES 2005-2020: a cross-sectional study. Front Endocrinol (Lausanne). (2023) 14:1231527. doi: 10.3389/fendo.2023.1231527
28. Zhan H, Liu X, Piao S, Rong X, Guo J. Association between triglyceride-glucose index and bone mineral density in US adults: a cross sectional study. J Orthop Surg Res. (2023) 18:810. doi: 10.1186/s13018-023-04275-6
29. Xuan X, Sun R, Peng C, Liu L, Huang T, Huang C. The nonlinear association between triglyceride glucose-body mass index and femoral neck BMD in nondiabetic elderly men: NHANES 2005-March 2020. PLoS One. (2024) 19:e0296935. doi: 10.1371/journal.pone.0296935
30. Tian N, Chen S, Han H, Jin J, Li Z. Association between triglyceride glucose index and total bone mineral density: a cross-sectional study from NHANES 2011-2018. Sci Rep. (2024) 14:4208. doi: 10.1038/s41598-024-54192-9
31. Tian C, Liu J, Ma M, Wang S, Zhang Y, Feng Z, et al. Association between surrogate marker of insulin resistance and bone mineral density in US adults without diabetes. Arch Osteoporosis. (2024) 19:42. doi: 10.1007/s11657-024-01395-2
32. Chen H, Hu J, Li J, Li Q, Lan L. Association between triglyceride-glucose index and femoral bone mineral density in community-dwelling, nondiabetic men and women: a NHANES analysis of 1,928 US individuals. Menopause. (2024) 31:626–33. doi: 10.1097/GME.0000000000002374
33. Yang L, Hu X, Zhang H, Pan W, Yu W, Gu X. Association of bone mineral density with a first-degree family history of diabetes in normoglycemic postmenopausal women. Menopause. (2019) 26:1284–8. doi: 10.1097/GME.0000000000001396
34. Wang Y, Chen F, Wang H, Yu C, Shao S, Zhao M, et al. Association between forearm bone mineral density and metabolic obesity in a northern chinese population. Metab Syndr Relat Disord. (2020) 18:251–9. doi: 10.1089/met.2019.0128
35. Ye S, Shi L, Zhang Z. Effect of insulin resistance on gonadotropin and bone mineral density in nondiabetic postmenopausal women. Front Endocrinol (Lausanne). (2023) 14:1235102. doi: 10.3389/fendo.2023.1235102
36. Wen Z, Li Y, Xu L, Yue C, Wang Q, Chen R, et al. Triglyceride glucose-body mass index is a reliable indicator of bone mineral density and risk of osteoporotic fracture in middle-aged and elderly nondiabetic chinese individuals. J Clin Med. (2022) 11:5694. doi: 10.3390/jcm11195694
37. Shao Y, Zhong H, Li L, Du X, Zhou X, Hua Y. Association between the metabolic score of insulin resistance index and bone mineral density: A cross-sectional study. Int J Gerontology. (2024) 18:118–23. doi: 10.6890/IJGE.202404_18(2).0011
38. Kim YH, Cho KH, Choi YS, Kim SM, Nam GE, Lee SH, et al. Low bone mineral density is associated with metabolic syndrome in South Korean men but not in women: The 2008-2010 Korean National Health and Nutrition Examination Survey. Arch Osteoporos. (2013) 8:142. doi: 10.1007/s11657-013-0142-3
39. Shin D, Kim S, Kim KH, Lee K, Park SM. Association between insulin resistance and bone mass in men. J Clin Endocrinol Metab. (2014) 99:988–95. doi: 10.1210/jc.2013-3338
40. Seoung JY, Lee SW, Kang YM, Kim MJ, Park JM, Moon HM, et al. Association between metabolic risks and bone mineral density in postmenopausal women. CEOG. (2018) 45:671–6. doi: 10.12891/ceog4341.2018
41. Yoon JH, Hong AR, Choi W, Park JY, Kim HK, Kang HC. Association of triglyceride-glucose index with bone mineral density in non-diabetic koreans: KNHANES 2008-2011. Calcif Tissue Int. (2021) 108:176–87. doi: 10.1007/s00223-020-00761-9
42. de Araújo IM, Parreiras ESLT, Carvalho AL, Elias J Jr., Salmon CEG, de Paula FJA. Insulin resistance negatively affects bone quality not quantity: the relationship between bone and adipose tissue. Osteoporos Int. (2020) 31:1125–33. doi: 10.1007/s00198-020-05365-5
43. Giudici KV, de França NAG, Peters BSE, Fisberg RM, Martini LA. Associations between markers of glucose metabolism and bone measures among diabetic and non-diabetic adults. J Diabetes Metab Disord. (2021) 20:1247–55. doi: 10.1007/s40200-021-00849-5
44. Iki M, Tamaki J, Fujita Y, Kouda K, Yura A, Kadowaki E, et al. Serum undercarboxylated osteocalcin levels are inversely associated with glycemic status and insulin resistance in an elderly Japanese male population: Fujiwara-kyo Osteoporosis Risk in Men (FORMEN) Study. Osteoporos Int. (2012) 23:761–70. doi: 10.1007/s00198-011-1600-7
45. Kalimeri M, Leek F, Wang NX, Koh HR, Roy NC, Cameron-Smith D, et al. Association of insulin resistance with bone strength and bone turnover in menopausal chinese-Singaporean women without diabetes. Int J Environ Res Public Health. (2018) 15:889. doi: 10.3390/ijerph15050889
46. Bazic-Sretenovic D, Veselinovic M, Cekerevac I, Nikolic Turnic T, Azanjac A, Koricanac A, et al. The relationship between insulin resistance, bone mineral density and fracture risk in postmenopausal women. Vojnosanitetski pregled. (2021) 79:41–. doi: 10.2298/VSP210216041B
47. Campillo-Sánchez F, Usategui-Martín R, Ruiz-de Temiño Á, Gil J, Ruiz-Mambrilla M, Fernández-Gómez JM, et al. Relationship between insulin resistance (HOMA-IR), trabecular bone score (TBS), and three-dimensional dual-energy X-ray absorptiometry (3D-DXA) in non-diabetic postmenopausal women. J Clin Med. (2020) 9:1732. doi: 10.3390/jcm9061732
48. Tahani N, Choudhary S, Boivin C, Dawson C, Gittoes N, Geberhiwot T. Very high bone mineral density in a monogenic form of obesity-associated insulin resistance. Bone. (2021) 143:115756. doi: 10.1016/j.bone.2020.115756
49. Cherif R, Mahjoub F, Sahli H, Cheour E, Vico L, Sakly M, et al. Positive association of obesity and insulin resistance with bone mineral density in Tunisian postmenopausal women. J Clin Densitometry. (2018) 21:163–71. doi: 10.1016/j.jocd.2017.05.015
50. Napoli N, Chandran M, Pierroz DD, Abrahamsen B, Schwartz AV, Ferrari SL. Mechanisms of diabetes mellitus-induced bone fragility. Nat Rev Endocrinol. (2017) 13:208–19. doi: 10.1038/nrendo.2016.153
51. Fulzele K, Riddle RC, DiGirolamo DJ, Cao X, Wan C, Chen D, et al. Insulin receptor signaling in osteoblasts regulates postnatal bone acquisition and body composition. Cell. (2010) 142:309–19. doi: 10.1016/j.cell.2010.06.002
52. Zhu S, Chen W, Masson A, Li Y-P. Cell signaling and transcriptional regulation of osteoblast lineage commitment, differentiation, bone formation, and homeostasis. Cell Discovery. (2024) 10:71. doi: 10.1038/s41421-024-00689-6
53. Conte C, Epstein S, Napoli N. Insulin resistance and bone: a biological partnership. Acta diabetologica. (2018) 55:305–14. doi: 10.1007/s00592-018-1101-7
54. Parwani K, Mandal P. Role of advanced glycation end products and insulin resistance in diabetic nephropathy. Arch Physiol Biochem. (2023) 129:95–107. doi: 10.1080/13813455.2020.1797106
55. Tencerova M, Okla M, Kassem M. Insulin signaling in bone marrow adipocytes. Curr Osteoporos Rep. (2019) 17:446–54. doi: 10.1007/s11914-019-00552-8
56. Cipriani C, Colangelo L, Santori R, Renella M, Mastrantonio M, Minisola S, et al. The interplay between bone and glucose metabolism. Front Endocrinol (Lausanne). (2020) 11:122. doi: 10.3389/fendo.2020.00122
57. Mesinovic J, McMillan LB, Shore-Lorenti C, Zengin A, De Courten B, Ebeling PR, et al. Sex-specific associations between insulin resistance and bone parameters in overweight and obese older adults. Clin Endocrinol (Oxf). (2019) 90:680–9. doi: 10.1111/cen.2019.90.issue-5
58. Matthews DR, Hosker JP, Rudenski AS, Naylor B, Treacher DF, Turner R. Homeostasis model assessment: insulin resistance and β-cell function from fasting plasma glucose and insulin concentrations in man. diabetologia. (1985) 28:412–9. doi: 10.1007/BF00280883
59. Yoon H, Jeon DJ, Park CE, You HS, Moon AE. Relationship between homeostasis model assessment of insulin resistance and beta cell function and serum 25-hydroxyvitamin D in non-diabetic Korean adults. J Clin Biochem Nutr. (2016) 59:139–44. doi: 10.3164/jcbn.15-143
60. Khalili D, Khayamzadeh M, Kohansal K, Ahanchi NS, Hasheminia M, Hadaegh F, et al. Are HOMA-IR and HOMA-B good predictors for diabetes and pre-diabetes subtypes? BMC Endocrine Disord. (2023) 23:39. doi: 10.1186/s12902-023-01291-9
61. Hu H, Nakagawa T, Honda T, Yamamoto S, Mizoue T. Should insulin resistance (HOMA-IR), insulin secretion (HOMA-β), and visceral fat area be considered for improving the performance of diabetes risk prediction models. BMJ Open Diabetes Res Care. (2024) 12:e003680. doi: 10.1136/bmjdrc-2023-003680
62. Sánchez-García A, Rodríguez-Gutiérrez R, Mancillas-Adame L, González-Nava V, Díaz González-Colmenero A, Solis RC, et al. Diagnostic accuracy of the triglyceride and glucose index for insulin resistance: A systematic review. Int J Endocrinol. (2020) 2020:4678526. doi: 10.1155/2020/4678526
63. Bala C, Gheorghe-Fronea O, Pop D, Pop C, Caloian B, Comsa H, et al. The association between six surrogate insulin resistance indexes and hypertension: a population-based study. Metab Syndrome Related Disord. (2019) 17:328–33. doi: 10.1089/met.2018.0122
64. Ramírez-Vélez R, Pérez-Sousa MÁ, González-Ruíz K, Cano-Gutierrez CA, Schmidt-RioValle J, Correa-Rodríguez M, et al. Obesity-and lipid-related parameters in the identification of older adults with a high risk of prediabetes according to the American diabetes association: an analysis of the 2015 health, well-being, and aging study. Nutrients. (2019) 11:2654. doi: 10.3390/nu11112654
65. Jiang K, Luan H, Pu X, Wang M, Yin J, Gong R. Association between visceral adiposity index and insulin resistance: A cross-sectional study based on US adults. Front Endocrinol. (2022) 13. doi: 10.3389/fendo.2022.921067
66. Bazyar H, Zare Javid A, Masoudi MR, Haidari F, Heidari Z, Hajializadeh S, et al. Assessing the predictive value of insulin resistance indices for metabolic syndrome risk in type 2 diabetes mellitus patients. Sci Rep. (2024) 14:8917. doi: 10.1038/s41598-024-59659-3
67. Romo-Romo A, Aguilar-Salinas CA, Gómez-Díaz RA, Brito-Córdova GX, Gómez-Pérez FJ, López-Carrasco MG, et al. Validity and reliability of simple surrogate indexes to evaluate beta-cell function and insulin sensitivity. Rev Med Chil. (2022) 150:1458–66. doi: 10.4067/S0034-98872022001101458
68. Lloyd JT, Alley DE, Hawkes WG, Hochberg MC, Waldstein SR, Orwig DL. Body mass index is positively associated with bone mineral density in US older adults. Arch osteoporosis. (2014) 9:1–8. doi: 10.1007/s11657-014-0175-2
69. Meyer HE, Søgaard AJ, Falch JA, Jørgensen L, Emaus N. Weight change over three decades and the risk of osteoporosis in men: the Norwegian Epidemiological Osteoporosis Studies (NOREPOS). Am J Epidemiol. (2008) 168:454–60. doi: 10.1093/aje/kwn151
Keywords: insulin resistance, bone mineral density, HOMA-IR, TyG index, VAI, systematic review, osteoporosis, BMD
Citation: Shirinezhad A, Azarboo A, Ghaseminejad-Raeini A, Kanaani Nejad F, Zareshahi N, Amiri SM, Tahmasebi Y and Hoveidaei AH (2024) A systematic review of the association between insulin resistance surrogate indices and bone mineral density. Front. Endocrinol. 15:1499479. doi: 10.3389/fendo.2024.1499479
Received: 20 September 2024; Accepted: 26 November 2024;
Published: 18 December 2024.
Edited by:
Ali Ghasem-Zadeh, University of Melbourne, AustraliaReviewed by:
Kamyar Asadipooya, University of Kentucky, United StatesNaibedya Chattopadhyay, Central Drug Research Institute (CSIR), India
Copyright © 2024 Shirinezhad, Azarboo, Ghaseminejad-Raeini, Kanaani Nejad, Zareshahi, Amiri, Tahmasebi and Hoveidaei. This is an open-access article distributed under the terms of the Creative Commons Attribution License (CC BY). The use, distribution or reproduction in other forums is permitted, provided the original author(s) and the copyright owner(s) are credited and that the original publication in this journal is cited, in accordance with accepted academic practice. No use, distribution or reproduction is permitted which does not comply with these terms.
*Correspondence: Amirhossein Ghaseminejad-Raeini, YWhnbnIxOTk5QGdtYWlsLmNvbQ==
†ORCID: Alireza Azarboo, orcid.org/0000-0003-3399-2360
Amirhossein Ghaseminejad-Raeini, orcid.org/0000-0002-4322-0236
Amir Human Hoveidaei, orcid.org/0000-0003-4607-354X