 Ting Lu
 Shunshun Lu2
 Jianwei Shen
- 1Department of Gastroenterology, Ningbo Medical Center Lihuili Hospital, Ningbo, ZheJiang, China
- 2Department of Hospital-Acquired Infection Control, Ningbo Medical Center Lihuili Hospital, Ningbo, ZheJiang, China
Background: Helicobacter pylori has been increasingly implicated in extra-gastric diseases. Current evidence regarding the association between serum thyroid-stimulating hormone (TSH), thyroxine (T4), and H. pylori infection remains inconclusive. Consequently, this study aimed to explore the correlation between TSH and T4 levels and H. pylori infection in a US-based population sample.
Methods: Data from the US National Health and Nutrition Examination Survey (NHANES), comprising 971 participants aged 30–85 years from 1999 to 2000, were analyzed. Binary logistic regression was employed to analyze the correlation between H. pylori and TSH and T4 levels. The impact of TSH and T4 on H. pylori infection was further assessed using restricted cubic spline (RCS) analysis. In addition, subgroup analyses stratified by sex and age were conducted.
Results: Subjects with H. pylori seropositivity demonstrated lower serum TSH levels and higher serum T4 levels compared to those with H. pylori seronegativity. A significant positive correlation was identified between H. pylori seropositivity and T4 levels with increasing quartiles of hormonal levels in both univariate regression models (Q4 vs. Q1: OR = 1.483; 95% CI, 1.033–2.129) and multivariate regression models (Q4 vs. Q1: OR = 1.004; 95% CI, 0.981–1.026). Conversely, a negative correlation was observed between H. pylori seropositivity and TSH levels with increasing quartiles of hormonal levels in univariate regression models (Q4 vs. Q1: OR = 0.579; 95% CI, 0.403–0.831) and in multivariate regression models (Q4 vs. Q1: OR = 0.580; 95% CI, 0.389–0.866). In stratified analyses, the adjusted association of serum T4 levels with H. pylori seropositivity was statistically significant among men (T4: Q4 vs. Q1: OR = 2.253; 95% CI, 1.311–3.873), age over 68 years in TSH levels (Q4 vs. Q1: OR = 0.434; 95% CI, 0.206–0.911), and age 41–54 years in T4 levels (Q4 vs. Q1: OR = 4.965; 95% CI, 2.071–11.903). RCS analysis revealed a non-linear relationship between TSH levels and H. pylori infection. Notably, when TSH < 0.98 IU/ml, the likelihood of H. pylori infection significantly increased.
Conclusions: Lower TSH and higher T4 levels were associated with H. pylori infection, particularly among men and elderly individuals.
1 Introduction
Helicobacter pylori is a bacterium that preferentially colonizes in the gastric epithelium, often causing a spectrum of digestive disease, including peptic ulcer, chronic gastritis, and even gastric cancer. It has been reported that approximately half of the global population is infected with H. pylori (1), with a prevalence rate of approximately 35.6% in the US (2). Furthermore, numerous extra-gastric diseases have been proven to be associated with H. pylori infection, such as dermatosis, thyroid diseases, and metabolic, cardiovascular, and neurological diseases (3–5).
Thyroxine (T4) is a thyroid hormone (TH) synthesized and secreted by the thyroid gland (6). The regulation of THs is governed by the complex hypothalamic–pituitary–thyroid (HPT) axis. Thyroid-stimulating hormone (TSH), produced by the anterior pituitary gland, promotes the synthesis and release of THs, primarily through negative feedback mechanisms within the HPT axis (7). Evidence indicates that H. pylori infection plays a pivotal role in thyroid disease (8), particularly autoimmune thyroid diseases (ATDs), owing to its ability to mimic the antigenic profile present on thyroid cell membranes (9). Vincenzo Bassi et al. discovered a heightened prevalence of H. pylori exclusively among patients with hyperthyroid Graves’ disease (GD), in contrast to those with Hashimoto thyroiditis (HT) (10). Additionally, De Luis et al. reported markedly elevated levels of anti-H. pylori immunoglobulin G antibodies in patients with subclinical hyperthyroidism, compared to the control cohort (11). Furthermore, a recent prospective study highlighted a substantial association between H. pylori infection and the likelihood of subclinical hyperthyroidism in Chinese women, independent of dietary factors (12). Both TSH and T4 are considered sensitive biomarkers for evaluating thyroid function, reflecting conditions of either hypothyroidism or hyperthyroidism (13). At present, the relationship between H. pylori infection and plasma levels of TSH and T4 in the general population remains insufficiently investigated and contentious (14–16).
Since the T4 data were incorporated in October 2023, it is now particularly intriguing to explore the relationship between TSH, T4 levels, and H. pylori infection based on data from the 1999–2000 National Health and Nutrition Examination Survey (NHANES).
2 Materials and methods
2.1 Study design and sample
NHANES is a publicly accessible database managed by the Centers for Disease Control and Prevention (CDC), providing extensive data regarding the health and nutritional status of the non-institutionalized U.S population. The survey encompasses information derived from questionnaires, demographic profiles, laboratory tests, and physical examinations (17, 18). The data analyzed in this study were form the 1999–2000 NHANES cycles, encompassing participants who had both H. pylori infection and measurements of plasma TSH and T4 levels, with T4 data being added to the database in October 2023.
The exclusion criteria were as follows: (1) individuals aged <30 or >85 years; (2) missing data for H. pylori serology, TSH, or T4 levels; and (3) individuals with thyroid disease or taking thyroid medications. Participants possessing relevant laboratory data and demographic variables of interest were incorporated into this investigation, culminating in a total sample size of 971 individuals aged between 30 and 85 years old. The schematic representation of the participant selection process is illustrated in Figure 1.
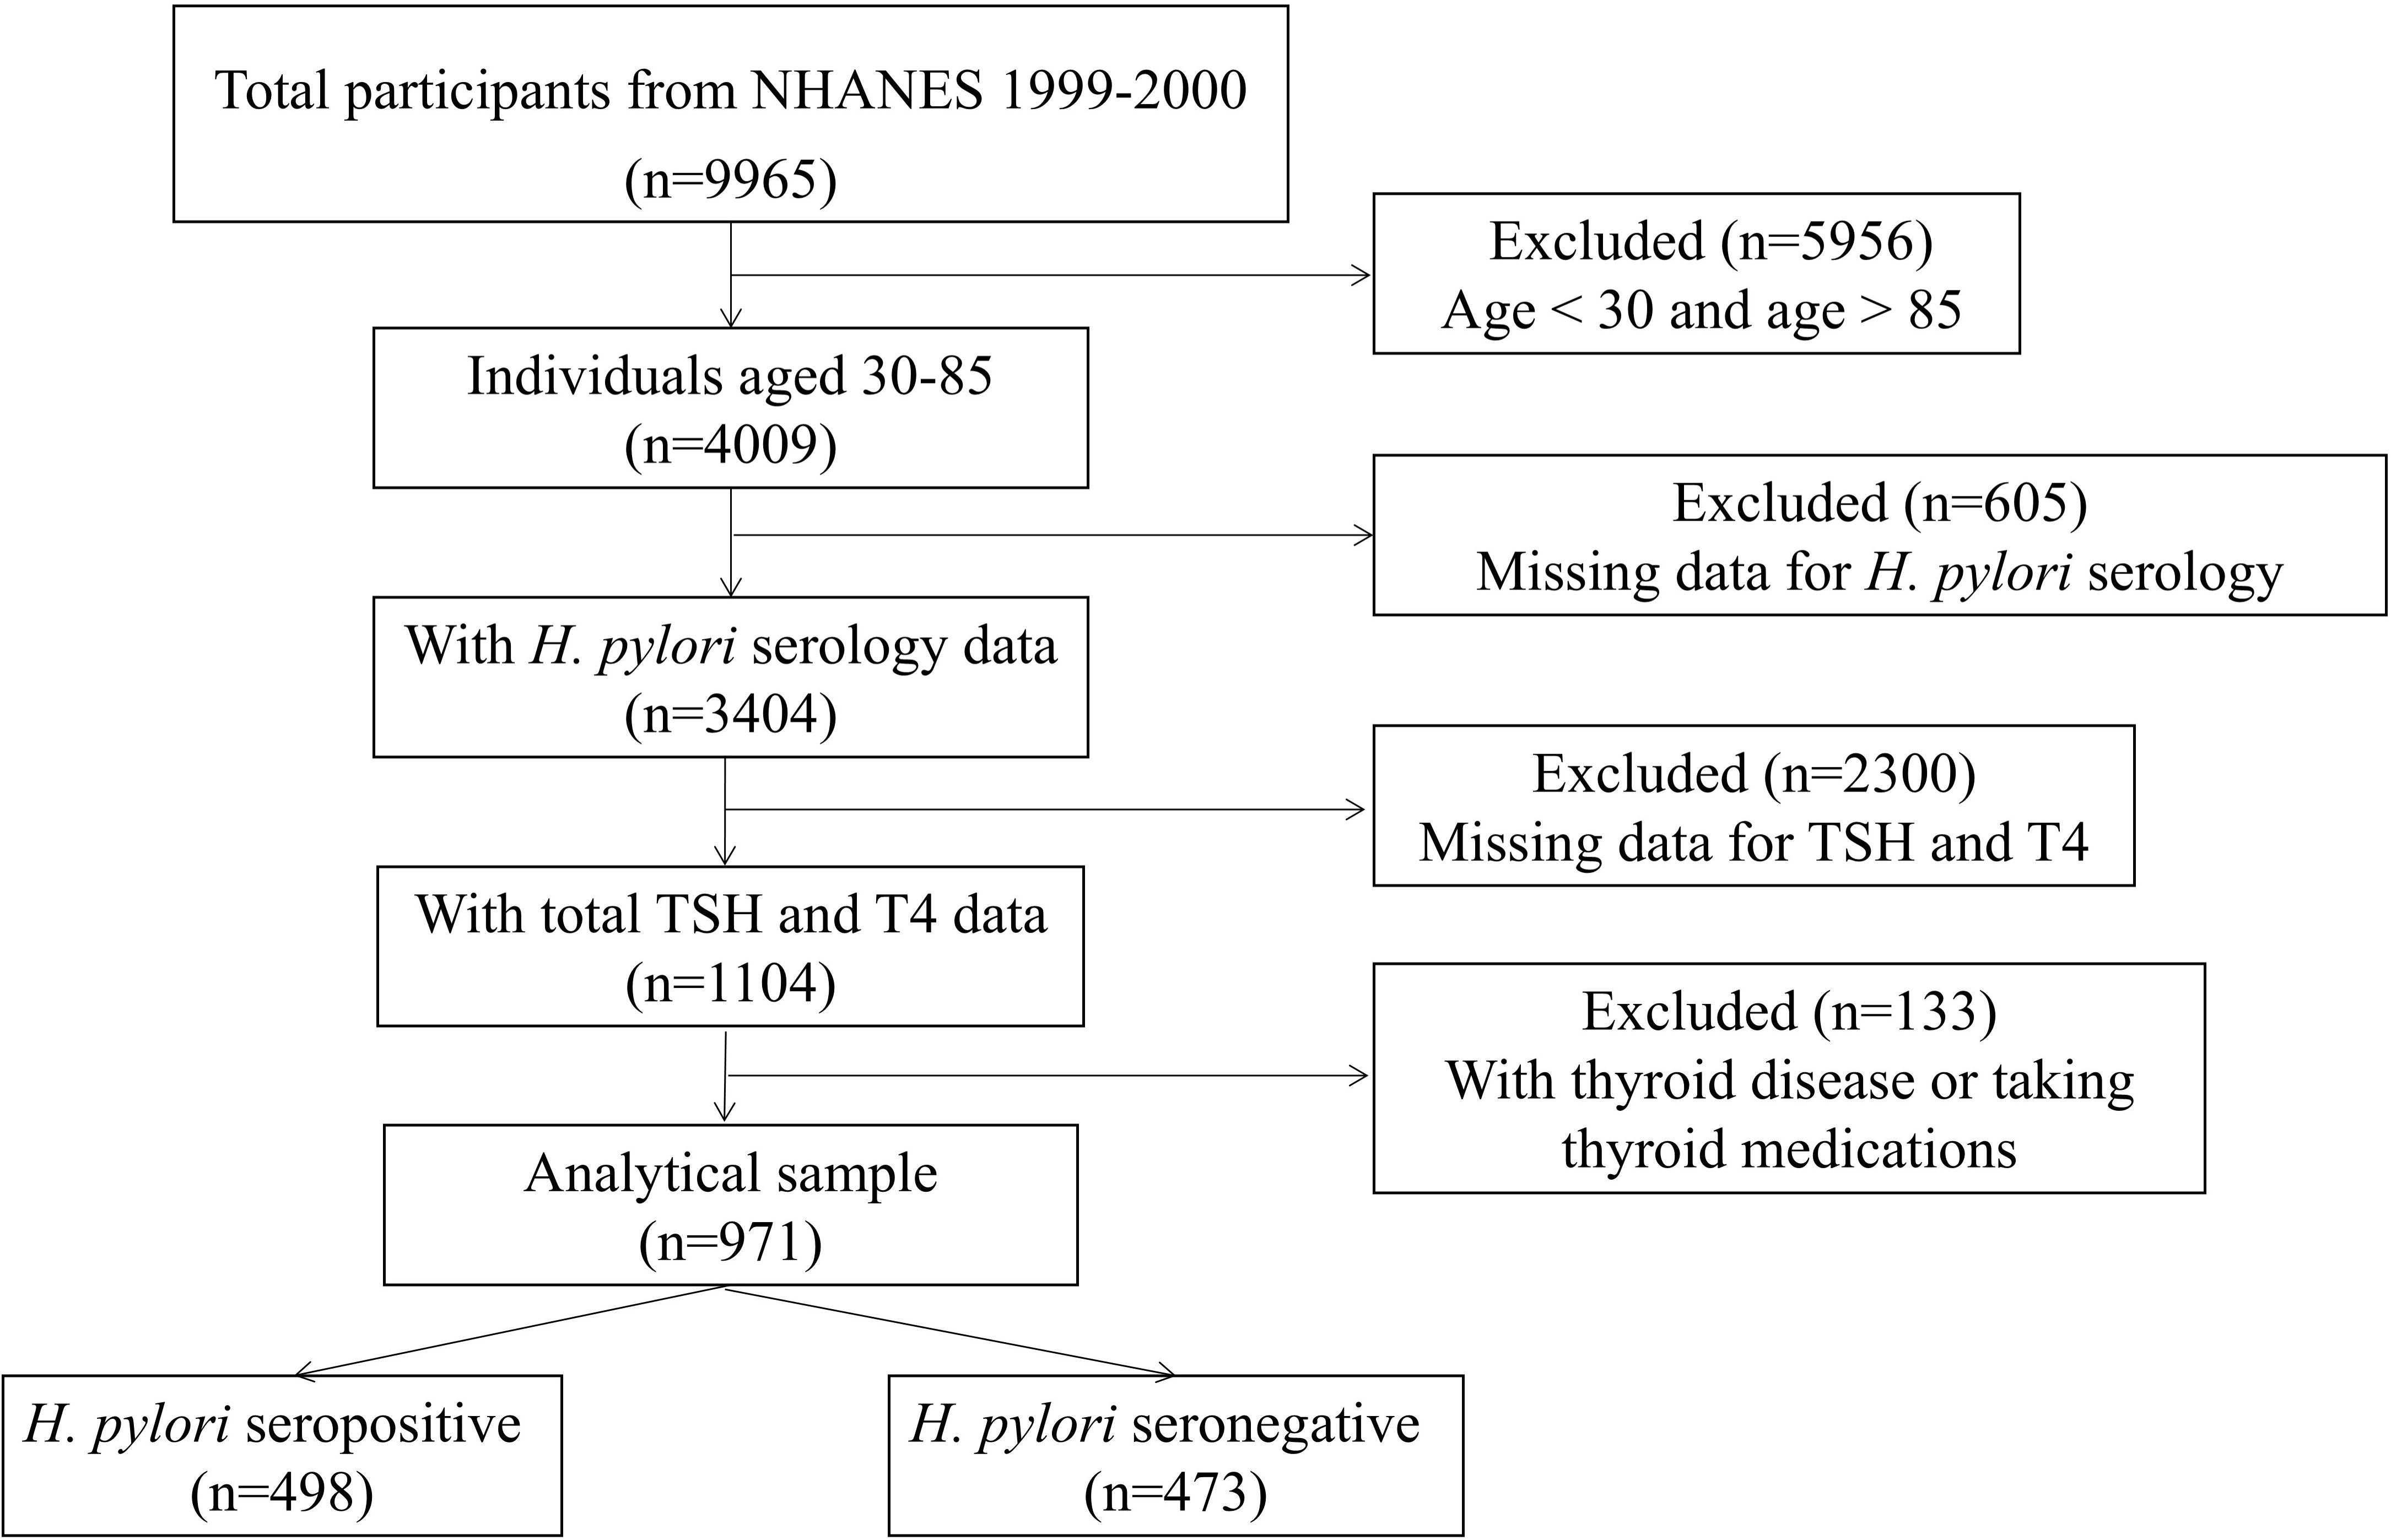
Figure 1. The flowchart of sample selection.
2.2 Helicobacter pylori status
In accordance with the NHANES protocol (19), H. pylori-specific immunoglobulin G (IgG) levels were quantified utilizing the H. pylori IgG enzyme-linked immunosorbent assay (ELISA) developed by Wampole Laboratories (Granbury, N) (20). Standard ELISA cutoff values were applied to classify participants as seropositive [optical density (OD) value ≥1.1] or seronegative (OD value < 0.9) for H. pylori. Indeterminate results (OD values between 0.9 and 1.1) were excluded to avoid potential biases in the statistical analysis of this investigation (21).
2.3 Thyroid-stimulating hormone and thyroxine
The dependent variable analyzed in this study was H. pylori seropositivity, while the primary independent variables of interest were plasma levels of TSH and T4. Both serum TSH and T4 were sourced from the NHANES laboratory dataset, designated as LAB18T4, which was updated in October 2023. Thyroid medications have been identified in the prescription drug medication document.
2.4 Covariates
The covariates examined in this research encompass age, gender, race, education level, body mass index (BMI), smoking behavior, alcohol behavior, and homocysteine levels. These variables were selected based on existing evidence linking them to both H. pylori serostatus and thyroid function (18, 21, 22). Among the covariates, age, TSH, T4, and homocysteine were categorized as continuous variables, while sex, race, education level, BMI, smoking behavior, and alcohol behavior were classified as categorical variables.
2.5 Statistical analyses
For continuous variables, independent t-test or Mann–Whitney test was employed to analyze the differences between groups. Depending on the normality of distribution, continuous variables were presented as mean ± SD; otherwise, they were presented as Median. Categorical variables were assessed using the chi-square test and reported as counts and percentages. Levels of TSH and T4 were categorized into quartiles (Q1 to Q4). Multiple regression analysis was conducted to identify the factors influencing TSH and T4 levels. Furthermore, the relationship between TSH, T4, and H. pylori was examined through restricted cubic spline (RCS) analysis, with knots positioned at the 5th, 35th, 65th, and 95th percentiles. Statistical analyses were carried out using SPSS (version 26.0) and R software (version 4.1.3), with a significance threshold set at p < 0.05, where both the p for overall and the p for non linear relationship in RCS were less than 0.05.
3 Results
3.1 Characteristics of included subjects
A total of 971 participants were included in this study, with 498 classified as H. pylori IgG seropositive and 473 as H. pylori IgG seronegative. Notable differences were detected between the two groups (p < 0.05) in terms of age, race, educational level, and serum TSH and T4 levels. The baseline characteristics of the study subjects are detailed in Table 1.

Table 1. Baseline characteristics of the study subjects.
3.2 Association between H. pylori seropositivity and TSH and T4
3.2.1 Multiple regression model
The outcomes of different multivariate linear regression models are summarized in Tables 2, 3: Model 1 is unadjusted, model 2 is adjusted for age and sex, and model 3 is further adjusted for race and educational level.
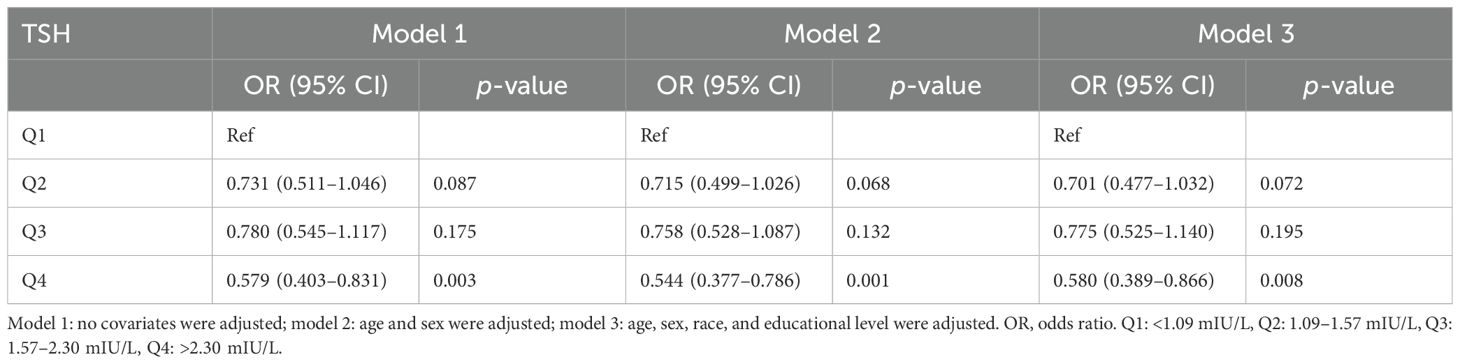
Table 2. Association of thyroid-stimulating hormone level with Helicobacter pylori seropositivity.
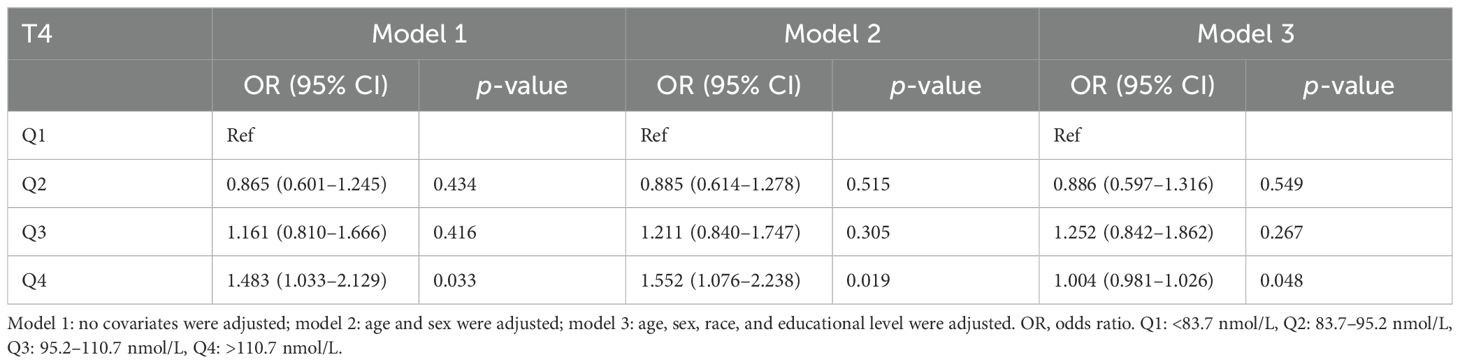
Table 3. Association of thyroxine level with Helicobacter pylori seropositivity.
In the unadjusted model, a negative association was identified between H. pylori seropositivity and TSH levels across increasing quartiles of hormonal levels (Q4 vs. Q1: OR = 0.579; 95% CI, 0.403–0.831, p = 0.003). This negative relationship persisted after adjustments for confounding factors in model 2 (Q4 vs. Q1: OR = 0.544, 95% CI, 0.377–0.786; p = 0.001) and model 3 (Q4 vs. Q1: OR = 0.580, 95% CI, 0.389–0.866; p = 0.008). Conversely, a significant positive association was observed between H. pylori and T4 levels across increasing quartiles of hormonal levels (Q4 vs. Q1: OR = 1.483; 95% CI, 1.033–2.129, p = 0.033). This positive connection remained significant after adjustments for confounding factors in model 2 (Q4 vs. Q1: OR = 1.552; 95% CI, 1.076–2.238, p = 0.019) and was marginally significant in model 3 (Q4 vs. Q1: OR = 1.004; 95% CI, 0.981–1.026, p = 0.048), as presented in Table 3.
3.2.2 Subgroup analyses
In the sex-stratified subgroup analyses, a positive correlation was discovered between the H. pylori seropositivity and T4 levels in men (Q4 vs. Q1 OR = 2.253; 95% CI, 1.311–3.873; p = 0.003). However, no significant relationship was observed between TSH levels and H. pylori seropositivity in men, as the positive correlation disappeared after adjusting for confounding variables in the multivariate regression model (Q4 vs. Q1 OR = 0.636; 95% CI, 0.340–1.188; p = 0.156). Among women, neither TSH nor T4 levels exhibited any association with H. pylori seropositivity. Detailed findings are provided in Tables 4, 5.
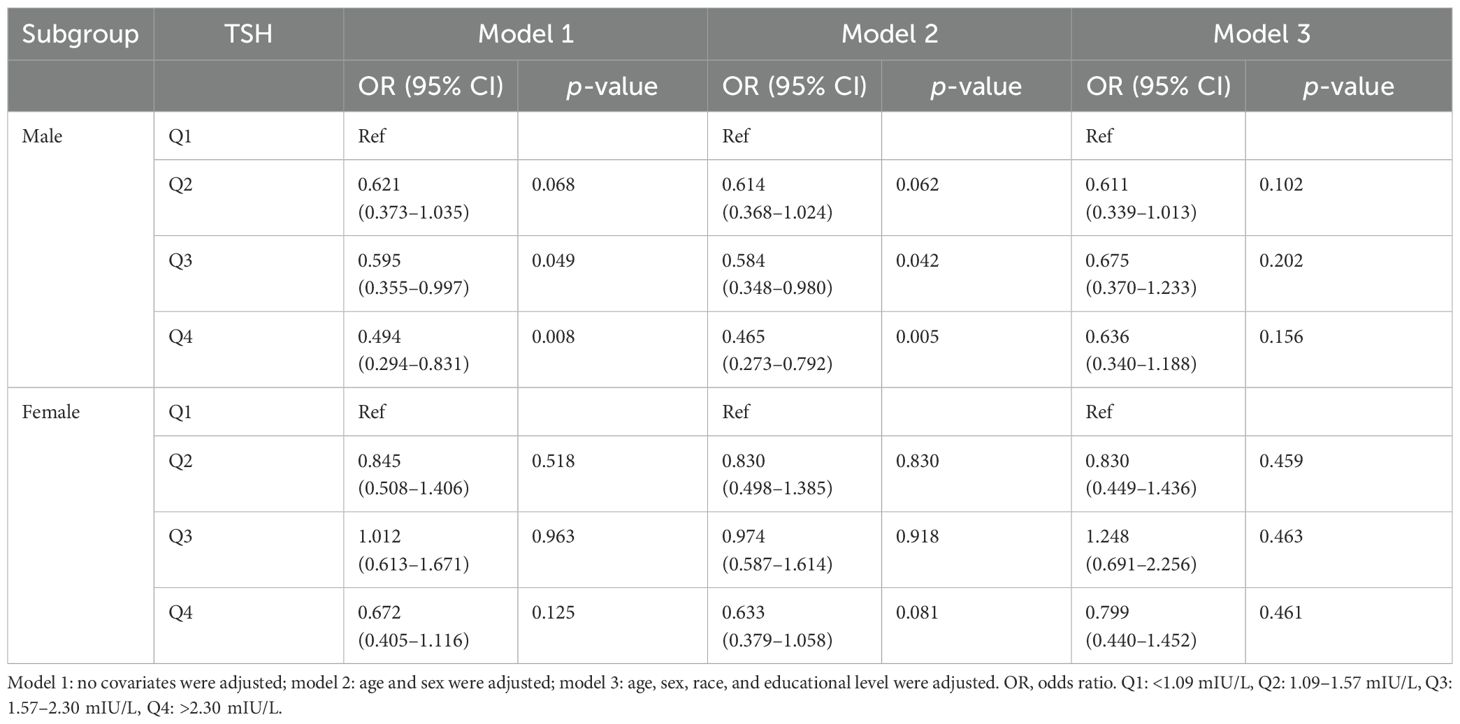
Table 4. Association of thyroid-stimulating hormone level with Helicobacter pylori seropositivity based on subgroup of sex.
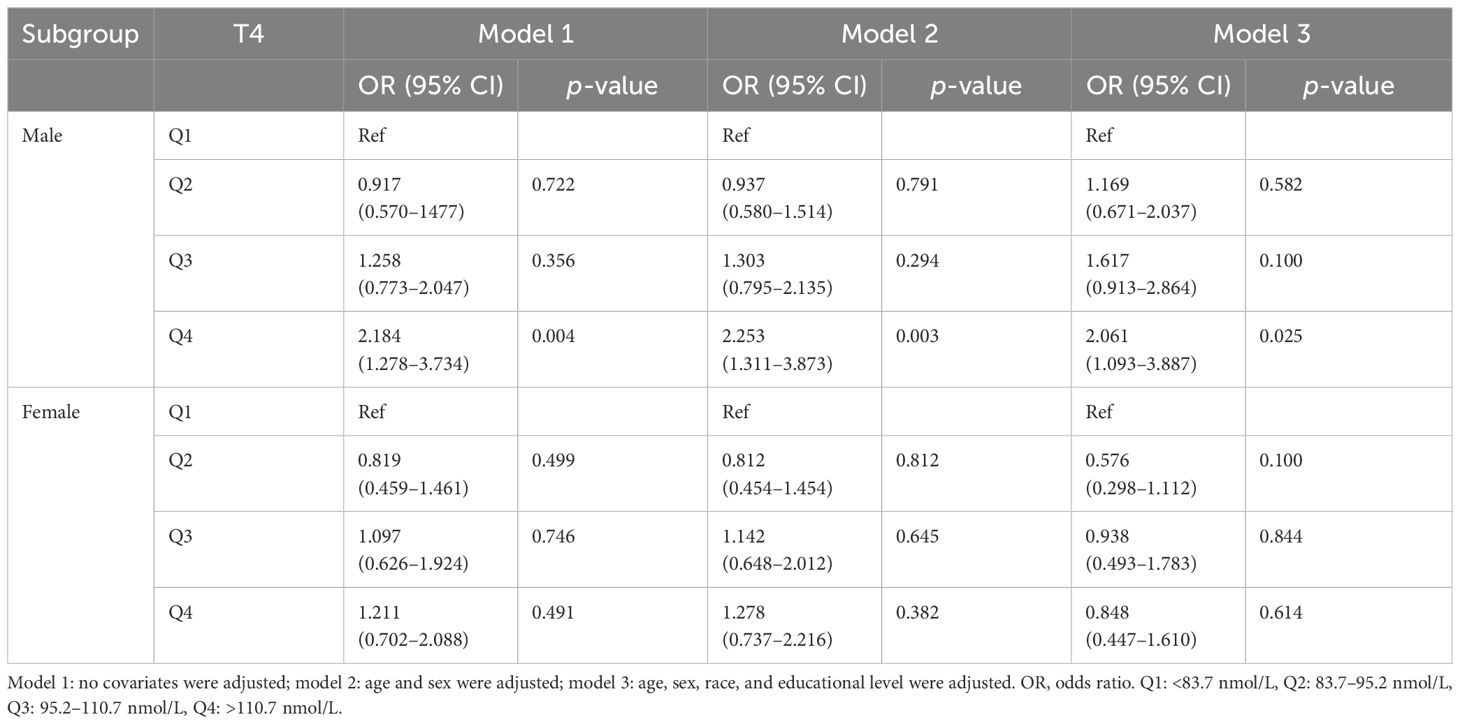
Table 5. Association of thyroxine level with Helicobacter pylori seropositivity based on subgroup of sex.
In the age-stratified subgroup analyses, a negative correlation was identified between H. pylori seropositivity and TSH levels among participants aged over 68 years (Q4 vs. Q1: OR = 0.434; 95% CI, 0.206–0.911; p = 0.027). Furthermore, no significant association was observed between TSH levels and H. pylori seropositivity in other age groups, as detailed in Table 6. Additionally, there was a positive association between H. pylori seropositivity and T4 levels among participants aged 41–54 years (Q4 vs. Q1: OR = 4.965; 95% CI, 2.071–11.903; p < 0.001). However, T4 levels showed no significant relationship with H. pylori seropositivity in other age groups, as outlined Table 7.
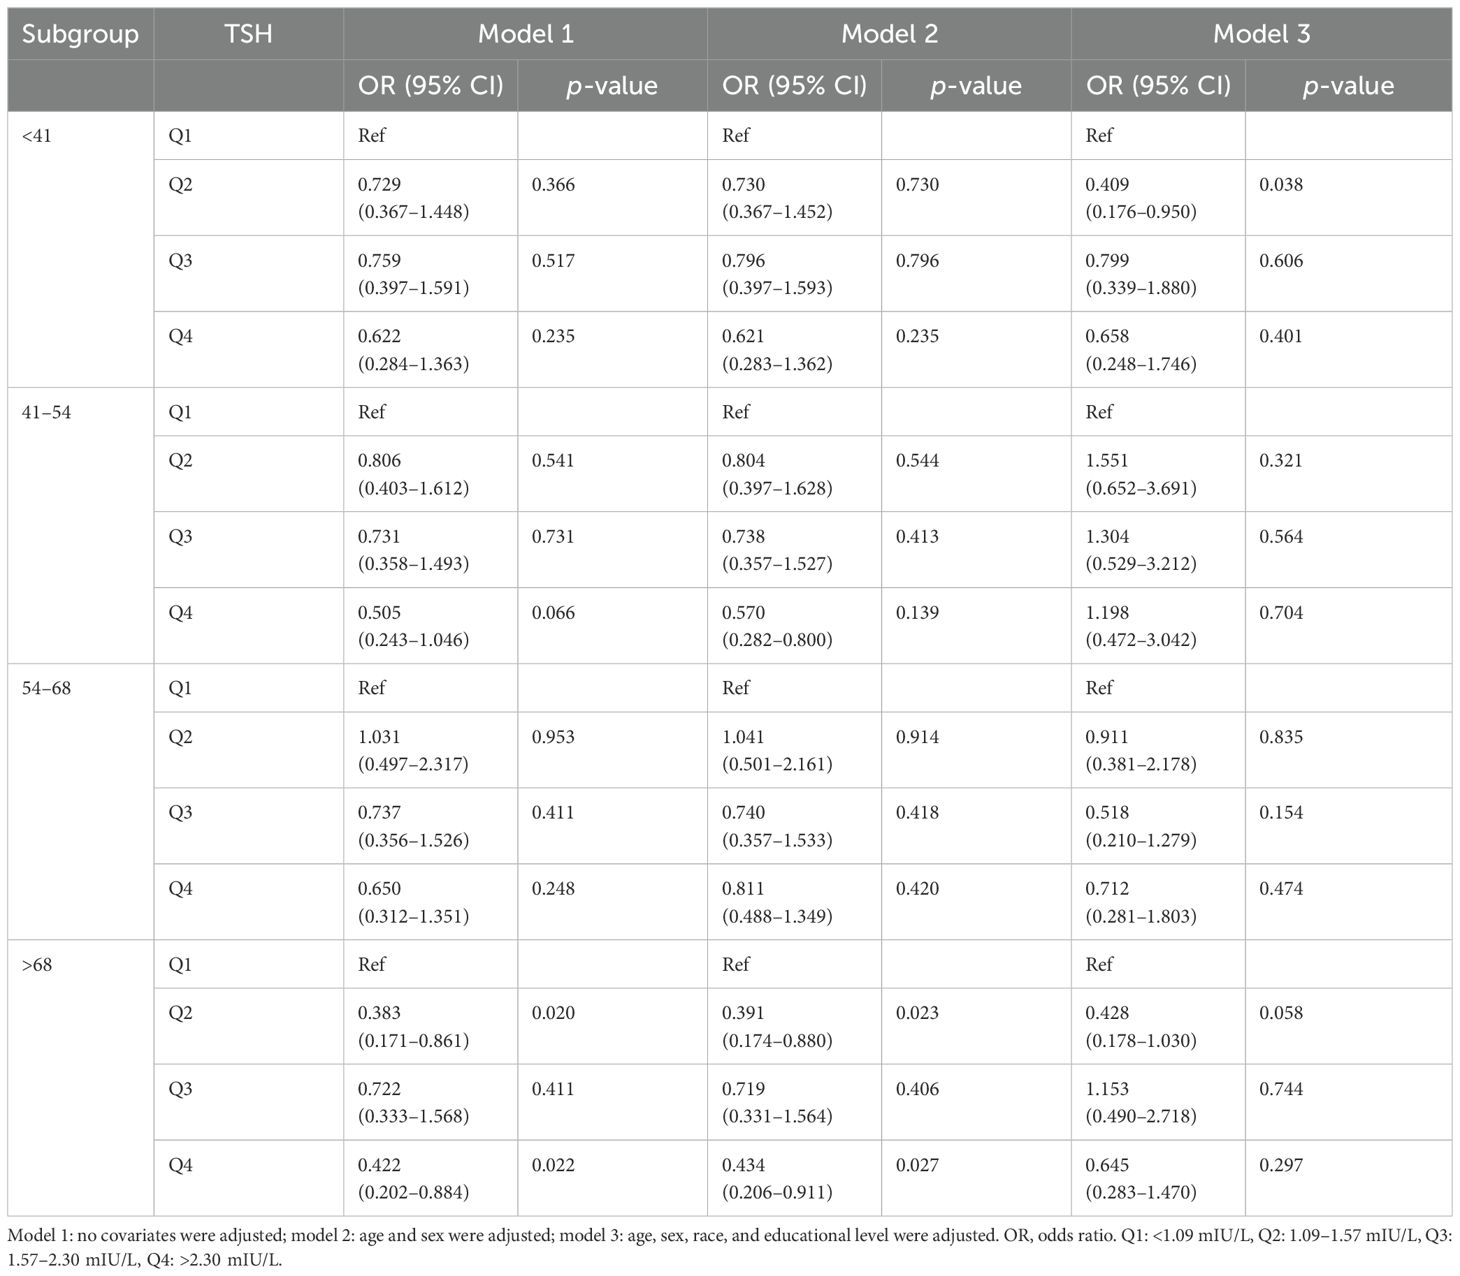
Table 6. Association of thyroid-stimulating hormone level with Helicobacter pylori seropositivity based on subgroup of age.
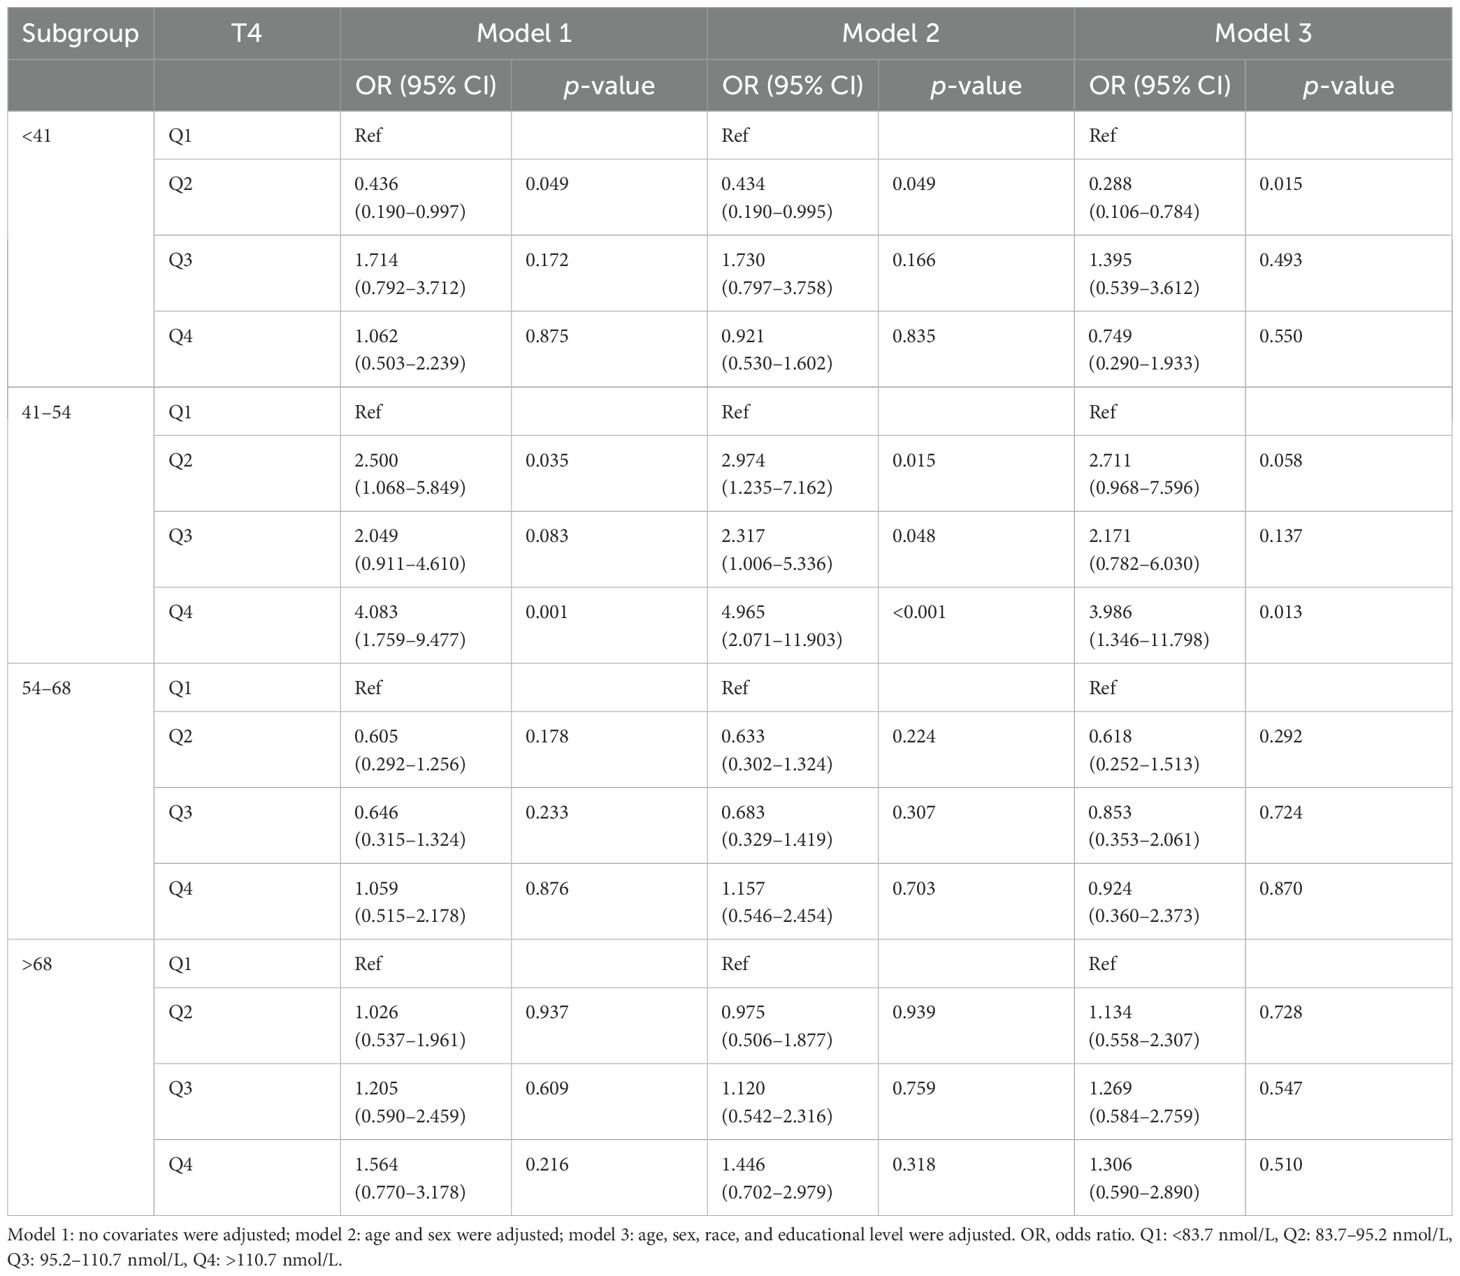
Table 7. Association of thyroxine level with Helicobacter pylori seropositivity based on subgroup of age.
3.2.3 Non-linear relationship between TSH, T4, and H. pylori infection
An RCS model was employed to assess the association between TSH levels and H. pylori infection. As illustrated in Figure 2, when TSH levels fall below 0.98 IU/mL, the risk of H. pylori infection rises significantly (p < 0.05). Conversely, there was no linear relationship between T4 levels and H. pylori infections.
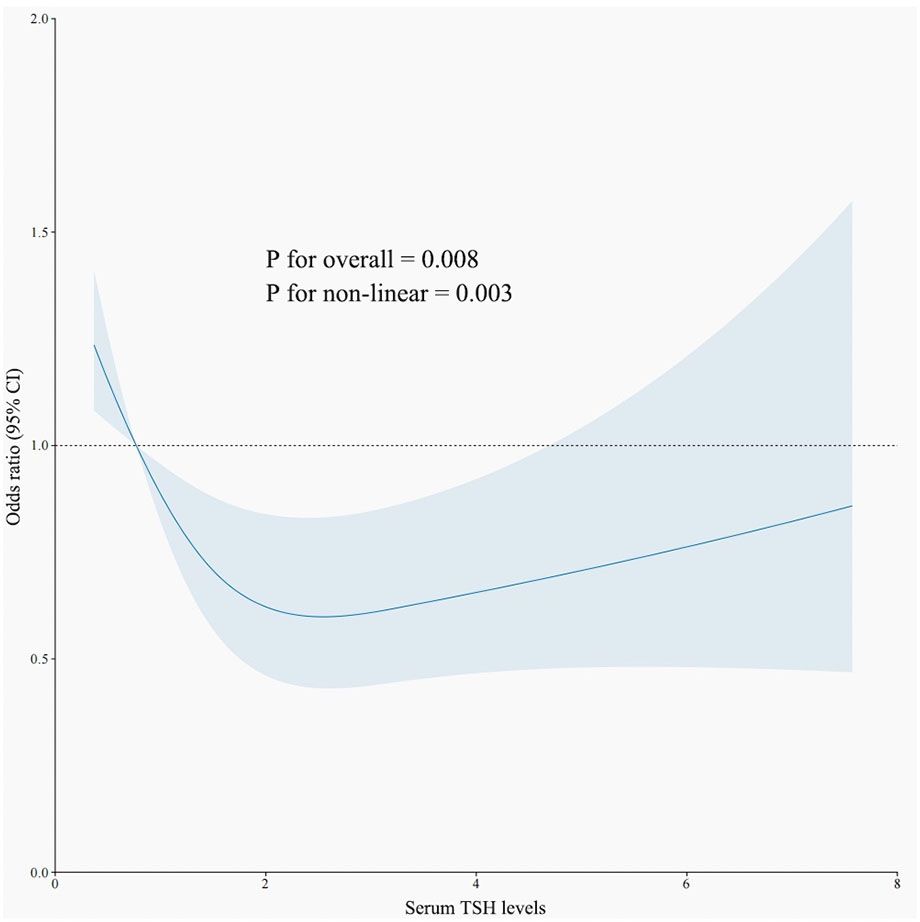
Figure 2. The restricted cubic spline curve for the relationship between serum TSH levels and H. pylori infection. The blue lines represent odds ratios, and blue areas represent 95% confidence intervals.
4 Discussion
This study utilized newly updated NHANES data to explore the relationship between TSH and T4 levels and H. pylori infection. In summary, H. pylori seropositivity demonstrated a positive correlation with T4 levels and a negative correlation with TSH levels. In stratified analyses, the adjusted association between serum T4 levels and H. pylori seropositivity was statistically significant in men but not in women, with significant correlations observed for serum TSH in participants over 68 years of age and for T4 in those aged 41–45 years.
As is widely acknowledged, thyroid function is composed of TSH and T4, with these serum markers often exhibiting a negative correlation. Our research identified variations in TSH and T4 levels between populations positive and negative for H. pylori. The non-linear connection revealed an enormous rise in the likelihood of H. pylori infection when TSH levels < 0.98 IU/mL. This suggests that individuals exhibiting hyperthyroid tendencies are more susceptible to H. pylori infection, corroborating findings from prior studies (10).
H. pylori testing should be considered for individuals undergoing treatment with medications known to be affected by this infection, such as T4, as outlined in the Houston Consensus (23). Therefore, this suggests an implied relationship between H. pylori infection and thyroid function. Nonetheless, the impact of thyroid function disorders, including hyperthyroidism or hypothyroidism, on H. pylori infection remains a contentious issue. Larizza et al. demonstrated that H. pylori could provoke an immune response against thyroid cells (24). A notable association has also been observed between Cag-A-positive H. pylori strains and GD, regardless of the patients’ hormonal status (25). The association may be attributed to cross-reactivity between antibodies against the H. pylori Cag-A protein and the follicular cells of the thyroid gland (26). Additionally, conflicting findings from other research have indicated a positive correlation between H. pylori infection and autoimmune atrophic thyroiditis (27, 28).
The mechanisms by which elevated T4 levels and suppressed TSH levels heighten the susceptibility to H. pylori infection remain incompletely understood; however, several lines of evidence may shed light on this relationship. Firstly, the discovery of a homologous 11-residue peptide shared by both gastric parietal cell antigens and thyroid peroxidase suggests a common epitope (29), implying that antibodies generated during H. pylori infection may cross-react with thyroid antigens, potentially contributing to hyperthyroidism (30). Secondly, studies have shown a strong correlation between IgG anti-H. pylori antibodies and thyroid autoantibodies, along with a reduction in thyroid autoantibody levels following the successful eradication of H. pylori infection (31). Thirdly, previous investigations have demonstrated that H. pylori strains can express fucosylated Lewis determinants, which are commonly found in various host tissues and may trigger an autoimmune response that could impair thyroid function (32). Typically, thyroid diseases, particularly ATDs, are influenced by a variety of autoimmune mechanisms. It has been reported that H. pylori infection plays a role in the pathogenesis of HT, the leading cause of hypothyroidism (28). In addition, in GD, humoral autoimmunity characterized by a TH2 profile is prevalent. Once infected with H. pylori, cytokines such as interleukin (IL)-4, IL-5, and IL-6 are activated, initiating a cascade of humoral immune responses that may modify the expression of adhesion molecules on the gastric mucosa, thereby contributing to the hyperthyroidism observed in GD (10, 33). The mechanism is believed to be associated with molecular mimicry between H. pylori antigens and thyroid constituents. Collectively, these findings offer compelling explanations for the observed correlation between H. pylori infection and hyperthyroidism.
A notable correlation was found between persistent H. pylori infection and ATDs in female patients, regardless of thyroid gland functional status. Specifically, this association was observed in relation to both HT and GD across multiple studies (10, 12), whereas no such connection was noted for non-autoimmune thyroid disorders. Although this association was primarily observed in women, a trend suggesting a similar relationship was noted in men (34). Because of the limitations of the NHANES database, the present study was unable to include thyroid autoantibodies such as thyroglobulin antibody (TGAb) and thyroid peroxidase antibodies (TPOAbs), which may have resulted in a weakened association between H. pylori seropositivity and TSH levels as well as T4 levels within gender cohorts.
Previous studies have suggested that the successful colonization of H. pylori in the gastric environment is influenced by age-related physiological factors and host characteristics, with the incidence of H. pylori-related diseases increasing with age (35, 36), a finding consistent with our results. Furthermore, additional factors such as socioeconomic status, geographical location, and ethnicity may also contribute to the rates of H. pylori infection (37). Breckan et al. reported that the prevalence of H. pylori is age-dependent, rising from adolescence and reaching its peak between the ages of 60 and 70 years (38).
It has to be recognized that there are several limitations in this study. First, H. pylori infection was defined based on serological testing, which cannot distinguish between past and present infections. Second, the NHANES 1999–2000 dataset lacked certain relevant information, such as TGAb and TPOAb, which weakens the association between H. pylori and thyroid autoimmunity, thus hindering a more thorough exploration of the underlying mechanisms. Should future NHANES updates include these data, more detailed classification comparisons could be conducted again in the future. Third, as a cross-sectional study, it does not allow for the establishment of causative relationships between TSH and T4 levels and H. pylori seropositivity, nor does it provide temporal data to differentiate between past and present H. pylori infections. Further longitudinal studies are needed to make interpretations of observed associations in the future. Lastly, while we accounted for the influence of certain medications, other factors, such as long-term contraceptive use in women, may affect thyroid function (39), as well as dietary factors like “high-salt” intake (40) or a high dietary inflammatory index (41), which are likely to influence the prevalence of H. pylori infection.
5 Conclusion
Overall, serum TSH and T4 levels were found to be associated with the risk of H. pylori infection, particularly among men, individuals with hyperthyroidism, and elderly adults. These people should pay close attention to H. pylori screening, as H. pylori infection is closely related to gastric cancer.
Data availability statement
The raw data supporting the conclusions of this article will be made available by the authors, without undue reservation.
Ethics statement
The studies involving humans were approved by Ethics Committee of Ningbo Medical Center Li Huili Hospital. The studies were conducted in accordance with the local legislation and institutional requirements. The ethics committee/institutional review board waived the requirement of written informed consent for participation from the participants or the participants’ legal guardians/next of kin because the data were obtained from public databases and were exempted from ethical review by the Ethics Committee of Ningbo Medical Center Li Huili Hospital.
Author contributions
TL: Writing – review & editing, Data curation, Formal Analysis, Investigation, Writing – original draft. SL: Data curation, Formal Analysis, Writing – review & editing. JL: Data curation, Writing – original draft. XS: Data curation, Writing – review & editing. DC: Data curation, Writing – review & editing. JS: Conceptualization, Writing – review & editing.
Funding
The author(s) declare financial support was received for the research, authorship, and/or publication of this article. This study was supported by the Ningbo Science and Technology Innovation 2025 Major Special Project of China (No. 2023Z159).
Conflict of interest
The authors declare that the research was conducted in the absence of any commercial or financial relationships that could be construed as a potential conflict of interest.
Publisher’s note
All claims expressed in this article are solely those of the authors and do not necessarily represent those of their affiliated organizations, or those of the publisher, the editors and the reviewers. Any product that may be evaluated in this article, or claim that may be made by its manufacturer, is not guaranteed or endorsed by the publisher.
References
1. Zamani M, Ebrahimtabar F, Miller V, Miller W.H, Alizadeh-Navael R, Shokri-Shirvanl J, et al. Systematic review with meta analysis: the worldwide prevalence of Helicobacter pylori infection. Aliment Pharmacol Ther. (2018) 47:868–76. doi: 10.1111/apt.2018.47.issue-7
2. Burucoa C, Axon A. Epidemiology of Helicobacter pylori infection. Helicobacter. (2017) 22:1–5. doi: 10.1111/hel.2017.22.issue-S1
3. Astl J, Sterzl I. Activation of helicobacter pylori causes either autoimmune thyroid diseases or carcinogenesis in the digestive tract. Physiol Res. (2015) 64:S291–301. doi: 10.33549/physiolres
4. Kucukazman M, Yeniova O, Dal K, Yavuz B. Helicobacter pylori and cardiovascular disease. Eur Rev Med Pharmacol Sci. (2015) 19:3731–41.
5. Wang L, Cao Z-M, Zhang L-L, Dai X-C, Liu Z-J, Zeng Y-X, et al. Helicobacter pylori and autoimmune diseases: Involing multiple systems. Front Immunol. (2022) 13:833424. doi: 10.3389/fimmu.2022.833424
6. Mullur R, Liu YY, Brent GA. Thyroid hormone regulation of metabolism. Physiol Rev. (2014) 94:355–82. doi: 10.1152/physrev.00030.2013
7. Chiamolera MI, Wondisford FE. Minireview: thyrotropin-releasing hormone and the thyroid hormone feedback mechanism. Endocrinology. (2009) 150:1091–6. doi: 10.1210/en.2008-1795
8. Wang Y, Zhu S, Xu Y, Wang X, Zhu Y. Interaction between gene a-positive helicobacter pylori and human leukocyte antigen II alleles increase the risk of graves disease in Chinese han population: An association study. Gene. (2013) 531:84–9. doi: 10.1016/j.gene.2013.07.069
9. Hou Y, Sun W, Zhang C, Wang T, Guo X, Wu L, et al. Meta-analysis of the correlation between helicobacter pylori infection and autoimmune thyroid diseases. Oncotarget. (2017) 8:115691–700. doi: 10.18632/oncotarget.22929
10. Bassi V, Marino G, Iengo A, Fattoruso O, Santinelli C. Autoimmune thyroid diseases and Helicobacter pylori: The correlation is present only in Graves’s disease. World J Gastroenterol. (2012) 18:1093–7. doi: 10.3748/wjg.v18.i10.1093
11. Shi WJ, Liu W, Zhou XY, Ye F, Zhang GX. Associations of helicobacter pylori infection and cytotoxin-associated gene a status with autoimmune thyroid diseases: a meta-analysis. Thyroid. (2013) 23:1294–300. doi: 10.1089/thy.2012.0630
12. Zhang J, Hai X, Wang S, Zhu F, Gu Y, Meng G, et al. Helicobacter pylori infection increase the risk of subclinical hyperthyroidism in middle-aged and elderly women independent of dietary factors: Results from the Tianjin chronic low-grade systemic inflammation and health cohort study in China. Front Nutr. (2023) 10:1002359. doi: 10.3389/fnut.2023.1002359
13. Fan H, Liu Z, Zhang X, Wu S, Shi T, Zhang P, et al. Thyroid stimulating hormone levels are associated with genetically predicted nonalcoholic fatty liver disease. J Clin Endocrinol Metab. (2022) 107:2522–9. doi: 10.1210/clinem/dgac393
14. Skelin M, Lucijanić T, Amidžić Klarić D, Resič A, Bakula M, LiberatiČizmek AM, et al. Factors affecting gastrointestinal absorption of levothyroxine: A review. Clin Ther. (2017) 39:378–403. doi: 10.1016/j.clinthera.2017.01.005
15. Triantafifillidis JK, Georgakopoulos D, Gikas A, Merikas E, Peros G, Sofroniadou K, et al. Relation between helicobacter pylori infection, thyroid hormone levels and cardiovascular risk factors on blood donors. Hepatogastroenterology. (2003) 50:cccxviii–cccxx.
16. Tomasi PA, Dore MP, Fanciulli G, Sanciu F, Realdi G, Delitala G. Is there anything to the reported association between helicobacter pylori infection and autoimmune thyroiditis? Dig Dis Sci. (2005) 50:385–8. doi: 10.1007/s10620-005-1615-z
17. Prevention CfDCa. National health and nutrition examination survey: centers for disease control and prevention (2020). Available online at: https://www.cdc.gov/nchs/nhanes/index.htm (Accessed 05 Apr 2021).
18. Huang J, Liu Z, Ma J, Liu J, Lv M, Wang F, et al. The association between helicobacter pylori seropositivity and bone mineral density in adults. Med Inflammation. (2022) 2022:2364666. doi: 10.1155/2022/2364666
19. Centers for Disease Control and Prevention. National Health and Nutrition Examination Survey 1999–2001 Data Documentation, Codebook, and Frequencies – H. pylori . Available online at: https://wwwn.cdc.gov/Nchs/Nhanes/1999-2000/LAB11.htm (Accessed 1 April 2024).
20. Berrett AN, Gale SD, Erickson LD, Brown BL, Hedges DW. Folate and inflammatory markers moderate the association between helicobacter pylori exposure and cognitive function in US adults. Helicobacter. (2016) 21:471–80. doi: 10.1111/hel.12303
21. Meier HCS, Miller FW, Dinse GE, Weinberg CR, Cho CC, Parks CG. Helicobacter pylori seropositivity is associated with antinuclear antibodies in US adults, NHANES 1999-2000. Epidemiol Infect. (2020) 148:e20. doi: 10.1017/S0950268820000126
22. Huang JW, Xie C, Niu Z, He LJ, Li JJ. The relation between helicobacter pylori immunoglobulin G seropositivity and leukocyte telomere length in US adults from NHANES 1999-2000. Helicobacter. (2020) 25:e12760. doi: 10.1111/hel.12760
23. El-Serag HB, Kao JY, Kanwal F, Gilger M, LoVecchio F, Moss SF, et al. Houston Consensus conference on testing for helicobacter pylori infection in the United States. Clin Gastroenterol Hepatol. (2018) 16:992–1002. doi: 10.1016/j.cgh.2018.03.013
24. Larizza D, Calcaterra V, Martinetti M, Negrini R, De Silvestri A, Cisternino M, et al. Helicobacter pylori infection and autoimmune thyroid disease in young patients: the disadvantage of carrying the human leukocyte antigenDRB1*0301 allele. J Clin Endocrinol Metab. (2006) 91:176–9. doi: 10.1210/jc.2005-1272
25. Bassi V, Santinelli C, Iengo A, Romano C. Identification of a correlation between Helicobacter pylori infection and Graves’ disease. Helicobacter. (2010) 15:558–62. doi: 10.1111/j.1523-5378.2010.00802.x
26. Figura N, Di Cairano G, Moretti E, Lacoponi F, Santucci A, Bernardini G, et al. Helicobacter pylori infection and autoimmune thyroid diseases: the role of virulent strains. Antibiotics. (2019) 9:12. doi: 10.3390/antibiotics9010012
27. Papamichael KX, Papaioannou G, Karga H, Roussos A, Mantzaris GJ. Helicobacter pylori infection and endocrine disorders: is there a link? World J Gastroenterol. (2009) 15:2701–7. doi: 10.3748/wjg.15.2701
28. De Luis DA, Varela C, de la Calle H, Cantón R, de Argila CM, San Roman AL, et al. Helicobacter pylori infection is markedly increased in patients with autoimmune atrophic thyroiditis. J Clin Gastroenterol. (1998) 26:259–63. doi: 10.1097/00004836-199806000-00008
29. Elisei R, Mariotti S, Swillens S, Vassart G, Ludgate M. Studies with recombinant autoepitopes of thyroid peroxidase: evidence suggesting an epitope shared between the thyroid and the gastric parietal cell. Autoimmunity. (1990) 8:65–70. doi: 10.3109/08916939008998434
30. Choi YM, Kim TY, Kim EY, Jang EK, Jeon MJ, Kim WG, et al. Association between thyroid autoimmunity and helicobacter pylori infection. Korean J Intern Med. (2017) 32:309–13. doi: 10.3904/kjim.2014.369
31. Bertalot G, Montresor G, Tampieri M, Spasiano A, Pedroni M, Milanesi B, et al. Decrease in thyroid autoantibodies after eradication of helicobacter pylori infection. Clin Endocrinol. (2004) 61:650–2. doi: 10.1111/j.1365-2265.2004.02137.x
32. Wirth HP, Yang M, Karita M, Blaser MJ. Expression of the human cell surface glycoconjugates Lewis x and Lewis y by helicobacter pylori isolates is related to cagA status. Infect Immun. (1996) 64:4598–605. doi: 10.1128/iai.64.11.4598-4605.1996
33. Roura-Mir C, Catálfamo M, Sospedra M, Alcalde L, PujolBorrell R, Jaraquemada D. Single-cell analysis of intrathyroidal lymphocytes shows differential cytokine expression in Hashimoto’s and Graves’ disease. Eur J Immunol. (1997) 27:3290–302. doi: 10.1002/eji.1830271228
34. Dore MP, Fanciulli G, Manca A, Pes GM. Association of helicobacter pylori infection with autoimmune thyroid disease in the female sex. J Clin Med. (2023) 12:5150. doi: 10.3390/jcm12155150
35. Huang JY, Sweeney EG, Sigal M, Zhang HC, Remington SJ, Cantrell MA, et al. Chemodetection and destruction of host urea allows helicobacter pylori to locate the epithelium. Cell Host Microbe. (2015) 18:147–56. doi: 10.1016/j.chom.2015.07.002
36. Goh KL, Chan WK, Shiota S, Yamaoka Y. Epidemiology of helicobacter pylori infection and public health implications. Helicobacter. (2011) 16:1–9. doi: 10.1111/j.1523-5378.2011.00874.x
37. Sreeja SR, Le T-D, Eom BW, Oh S-H, Shivappa N, Hebert J-R, et al. Association between the dietary inflammatory index and gastric disease risk: findings from a Korean population-based cohort study. Nutrients. (2022) 14:2662. doi: 10.3390/nu14132662
38. Breckan RK, Paulssen EJ, Asfeldt AM, Kvamme J-M, Straume B, Florholmen J. The all-age prevalence of helicobacter pylori infection and potential transmission routes. A population-based study. Helicobacter. (2016) 21)6:586–95. doi: 10.1111/hel.12316
39. Qiu Y, Hu Y, Xing Z, Fu Q, Zhu J, Su A. Birth control pills and risk of hypothyroidism: a cross-sectional study of the national health and nutrition examination survey, 2007-2012. BMJ Open. (2021) 11:e46607. doi: 10.1136/bmjopen-2020-046607
40. Shu L, Zheng P-F, Zhang X-Y, Feng Y-L. Dietary patterns and Helicobacter pylori infection in a group of Chinese adults ages between 45 and 59 years old. Medicine. (2019) 98:2(e14113). doi: 10.1097/MD.0000000000014113
Keywords: Helicobacter pylori infection, thyroid stimulating hormone, thyroxine, NHANES, CDC
Citation: Lu T, Lu S, Lin J, Shao X, Chen D and Shen J (2025) Association between Helicobacter pylori infection, serum thyroid-stimulating hormone, and thyroxine in the National Health and Nutrition Examination Survey 1999–2000. Front. Endocrinol. 16:1482073. doi: 10.3389/fendo.2025.1482073
Received: 17 August 2024; Accepted: 13 January 2025;
Published: 03 February 2025.
Edited by:
Lutz Schomburg, Charité University Medicine Berlin, GermanyReviewed by:
Sarbjeet Makkar, Washington University in St. Louis, United StatesAlin Horatiu Nedelcu, Grigore T. Popa University of Medicine and Pharmacy, Romania
Copyright © 2025 Lu, Lu, Lin, Shao, Chen and Shen. This is an open-access article distributed under the terms of the Creative Commons Attribution License (CC BY). The use, distribution or reproduction in other forums is permitted, provided the original author(s) and the copyright owner(s) are credited and that the original publication in this journal is cited, in accordance with accepted academic practice. No use, distribution or reproduction is permitted which does not comply with these terms.
*Correspondence: Jianwei Shen, c2hlbmp3MTE4NEAxMjYuY29t