 Dongxu Han
 Jingnan Liu
 Yu Wang
 Hongxia Wang
 Lingdan Yuan
 Wei Jin
 Lige Song
- 1Department of Endocrinology, Shanghai Tongji Hospital, School of Medicine, Tongji University, Shanghai, China
- 2Institute of Osteoporosis and Metabolic Bone Diseases, School of Medicine, Tongji University, Shanghai, China
Background: A20, also known as TNF-α-induced protein 3 (TNFAIP3), is a crucial negative regulator of inflammation and immune responses. Emerging evidence suggests that A20 is involved in the regulation of glucose metabolism and plays a significant role in bone metabolic diseases by inhibiting nuclear factor (NF)-κB activation. However, the potential relationship between serum A20 level and bone mineral density (BMD) in patients with type 2 diabetes mellitus (T2DM) has not been explored. This study aims to investigate the association between serum A20 level with BMD and bone turnover markers (BTMs) in patients with T2DM.
Method: A total of 189 patients with T2DM and 183 non-diabetic individuals were included in the study based on the inclusion and exclusion criteria. Participants were categorized into normal BMD and low BMD groups. Baseline clinical histories were collected through face-to-face questionnaires. Participants underwent measurements of blood biochemistry and anthropometric, hand grip strength records and short physical performance battery (SPPB) assessment. Serum A20 level was quantified by enzyme-linked immunosorbent assay kit. Areal BMD was measured using dual-energy x-ray absorptiometry (DXA). A T-score of less than -1.0 at the lumbar spine 1-4, femoral neck and/or total hip was classified as low BMD.
Results: Serum A20 level was lower in patients with T2DM compared to controls [41.30 (29.91, 61.87) vs 76.01 (54.90, 109.64) pg/mL, P<0.001]. Bivariate correlation analysis revealed that A20 level was not associated with SPPB but negatively correlated with waist-to-hip ratio (WHR). Pearson correlation analysis showed A20 level was positively correlated with lumbar spine 1-4 BMD in male diabetic patients (r=0.253, P=0.032). Multivariate regression analysis showed a positive association between serum A20 level and lumbar spine 1-4 BMD (Beta=0.047; 95% CI: 0.007-0.086; P=0.024) after multivariate adjustment. Logistic regression analysis showed that lower serum A20 level predicted low BMD in male patients with T2DM (OR: 0.22; 95% CI: 0.09-0.59; P=0.002).
Conclusions: Type 2 diabetic patients exhibited lower serum A20 level compared to non-diabetic individuals. In male patients with T2DM, serum A20 level showed a significant positive correlation with lumbar spine 1-4 BMD and could serve as an independent negative predictor for low BMD.
1 Introduction
Type 2 diabetes mellitus (T2DM) is a widespread and increasing global health concern, characterized by hyperglycemia resulting from insulin resistance and pancreatic β-cell dysfunction (1). It has been reported that approximately 463 million adults had diabetes in 2019, of which more than 90% were T2DM (2). Osteoporosis is characterized by low bone mass and microarchitectural deterioration (3). Fragility fracture is the most severe complication of osteoporosis (4). One-third of females and one-fifth of males over 50 years old will experience fragility fractures, leading to significant economic burdens (5). Diabetes and osteoporosis often co-exist in older adults. In China, the prevalence of osteoporosis among patients with T2DM was found to be 37.8% (6). Increasing studies considered diabetic osteopathy as a complication of T2DM (7). It is widely recognized that T2DM is an independent risk factor of fragility fracture (8), which may be explained by accumulation of advanced glycation end-products (AGEs), increased adipogenesis in the bone marrow and chronic low-grade inflammation (9).
Chronic inflammation and oxidative stress act as crucial factors for the pathogenesis of both T2DM and osteoporosis. The release of the pro-inflammatory cytokine tumor necrosis factor-α (TNF-α) by obese adipose tissue plays a crucial role in contributing to the development of T2DM by impacting insulin signaling through the suppression of insulin receptor substrate 1 (IRS-1) (10). Pancreatic β cells are vulnerable to oxidative damage due to their limited antioxidant defenses, which can lead to dysfunction and apoptosis (11). Persistent hyperglycemia can stimulate the release of inflammatory cytokines, which can increase the risk of osteoporosis and bone fragility fractures through the nuclear factor-kappa B (NF-κB) pathway (12). Besides, excessive production of reactive oxygen species (ROS) induced by hyperglycemia could upregulate NF-κB signaling, leading to the polarization of macrophages towards the M1 phenotype and thus increase bone resorption (13). However, the specific mechanism of diabetic osteopathy has not yet been clarified, which leads to the limited effective therapies. Therefore, seeking novel biomarkers is of great significance for exploring potential targets for therapy. Recently, several pro-inflammatory biomarkers has been shown associated with bone homeostasis in T2DM, such as interleukin-1(IL-6), interleukin-1 (IL-1) and omentin-1 (14).
A20, also known as TNFAIP3 (Tumor Necrosis Factor Alpha-Induced Protein 3), is a zinc finger protein that functions as a critical negative regulator of inflammation and immune responses. NF-κB functions as a transcription factor that controls the activity of inflammatory signaling (15). Moreover, NF-κB serves as a detector for oxidative stress, responding to ROS activation (16). Specifically, A20 could terminate NF-κB signaling by removing ubiquitin chains from signaling intermediates such as RIP (receptor-interacting protein) (17). Increasing studies found that A20 participated in the early-onset and development of multiple inflammatory and autoimmune diseases, such as non-alcoholic fatty liver disease, rheumatoid arthritis, Behcet’s disease, etc. (18, 19). Aberrant A20 was also associated with diabetes and bone disease. A20 may regulate the gene expression of islet cells, thereby modulating insulin secretion (20). Besides, A20 could impact osteoclasts differentiation and proliferation. Enhanced A20 expression under hypoxic conditions can impede bone marrow monocytes (BMMCs) differentiation into osteoclasts (21). Mice with targeted deletion of A20 in osteoclasts exhibited severe trabecular bone loss, marked reductions in trabecular volume and osteoporosis (22).
In summary, given that chronic inflammation and oxidative stress play key roles in both T2DM and osteoporosis, it is proposed that A20 could influence the development of diabetic osteopathy by regulating inflammation. Although the bone mineral density (BMD) may underestimate fracture risk in individuals with T2DM, the evaluation of BMD through DXA remains a reliable predictor of fracture risk (23). This study aimed to investigate the correlation between serum A20 level and bone mass in patients with T2DM, which may provide novel insights for revealing the pathogenesis of diabetic osteopathy.
2 Materials and methods
2.1 Study population
In this study, 223 patients with T2DM were recruited from Tongji Hospital, Tongji University School of Medicine, Shanghai, China from January 2022 to January 2023. At the same time, 225 patients without T2DM were recruited from Ganquan community and Yichuan community hospitals in Putuo District, Shanghai, China. T2DM was diagnosed according to the criteria by the World Health Organization (1999). Inclusion criteria were as follows (1): age ≥ 50years old (2); estimated glomerular filtration rate (eGFR) > 90 ml·min-1·(1.73 m2)-1 (3); all female subjects must be postmenopausal. Exclusion criteria were as follows (1): history of fracture in the past 6 months (2); secondary osteoporosis (3); patients with malignant tumors (4); patients with autoimmune diseases (5); abnormal liver function [aspartate aminotransferase (AST) > 70 U·L-1 or alanine aminotransferase (ALT) > 80 U·L-1] (6); previous use of glucocorticoids, thyroid hormones, estrogens, thiazolidinediones and all types of anti-osteoporosis drugs. The protocol of this study has been permitted by the Ethics Committee of Tongji Hospital. The trial was registered on the Chinese Clinical Trial Registry (chictr.org.cn; CTR number: ChiCTR1800018700). All patients had signed informed consent before the study started. Finally, 189 patients with T2DM and 183 patients without T2DM as the control group participated in this study (Figure 1).
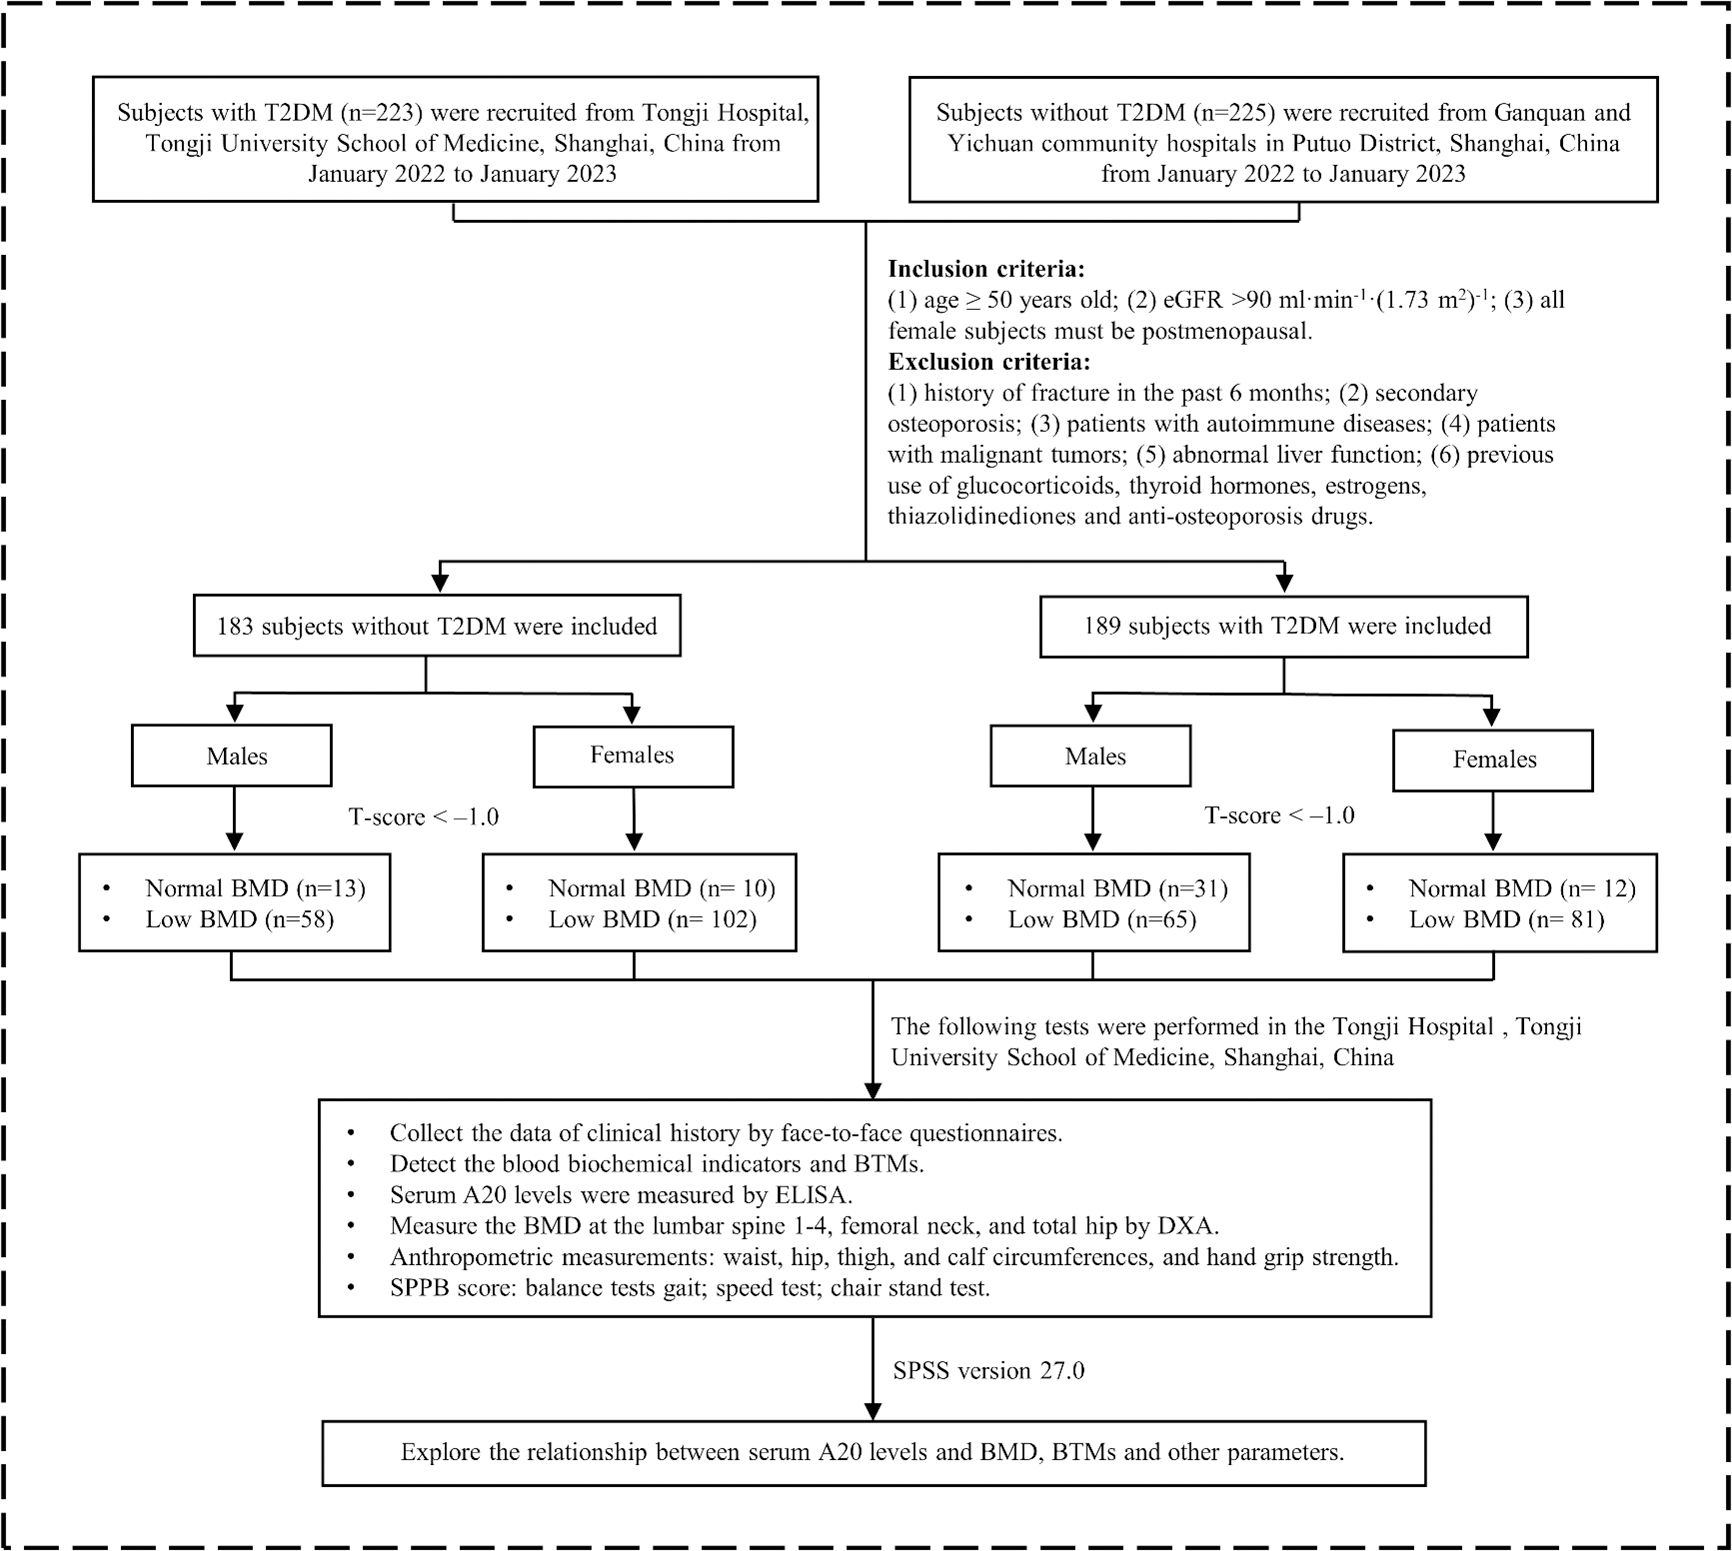
Figure 1. The flowchart of this study. T2DM, type 2 diabetes mellitus; eGFR, estimated glomerular filtration rate; AST, aspartate aminotransferase; ALT, alanine aminotransferase; BMD, bone mineral density; BTMs, bone turnover markers; ELISA, enzyme-linked immunosorbent assay; DXA, dual-energy x-ray absorptiometry; SPPB, short physical performance battery.
2.2 Demographic data and clinical data
Demographic data was gathered by face-to-face questionnaires for all patients including age, duration of T2DM, history of diseases, current smoking, current drinking, usage of drugs, etc. Drinking status was specified as drinking three or more units of alcohol daily, with one unit equaling 8 grams of alcohol.
2.3 Biochemical parameters measurement
After 8-12 hours of fast, fasting blood was collected to detect hemoglobin (Hb), fasting plasma glucose (FPG), triglyceride (TG), total cholesterol (TC), low-density lipoprotein (LDL), high-density lipoprotein (HDL), serum creatinine (CREA), AST, ALT, glycated hemoglobin (HbA1c), fasting insulin (FINS), c-terminal cross-linking telopeptide of type I collagen (CTX) and procollagen type I intact N-terminal (P1NP). Hb was quantitatively detected by an automatic analyzer. The detection method was cyano-methemoglobin colorimetry. FINS level was detected by the chemiluminescence method (Roche COB8000). Electrolytes, blood lipid indexes, creatinine and liver function were measured by an automatic serum chemical analyzer. A whole blood high-performance liquid chromatography was applied to detect HbA1c. Serum P1NP and CTX were measured using electrochemiluminescence assay (Roche, Cobas601). The homeostasis model assessment for insulin resistance (HOMA-IR) was determined using the formula: [FPG (mmol/L) × FINS (μU/mL)].
2.4 BMD detection by DXA
Dual-energy x-ray absorptiometry (DXA, HOLOGIC Discovery; coefficient of variation <1%) was employed to detect areal BMD at specific sites (lumbar spine 1–4, femur neck and total hip). To minimize errors, each operation was performed by the same technician. The unit of BMD is grams per square centimeter (g/cm²). T scores for the BMD were calculated based on the reference young adult populations. T-score= (BMD-mean BMD of young adult of the same sex)/standard deviation of young adult BMD. A T-score of less than -1.0 at any measurement site was classified as low BMD.
2.5 SPPB assessment
The Short Physical Performance Battery (SPPB) was employed to evaluate the physical performance of participants (24). The SPPB score consists of the following three parts (1). Balance tests: participants performed three balance exercises: standing with their feet side-by-side, semi-tandem stand and tandem stand (2). Gait speed test: gait speed of participants was measured over a 4-meter course at their usual pace (3). Chair stand test: this component assessed lower body strength and endurance. Participants were asked to rise from a seated position five times as quickly as possible without using their arms. Each test score ranged from 0 to 4 and the total SPPB score was calculated by summing the scores from each component, yielding a range from 0 to 12, with higher scores reflecting better physical performance.
2.6 Grip strength and anthropometric measurements
Grip strength was assessed by an electronic grip meter and the instrument was corrected before the test. Measure the grip strength of both hands separately 3 times, with a 2-minute interval between each measurement. Record the average grip strength of both hands. The grip strength was expressed in absolute unit (kg). Weight and height were measured while wearing no shoes and light clothing. Waist circumference was measured at the level of the umbilicus, and hip circumference was measured at the widest part of the buttocks. The waist to hip ratio (WHR) was calculated to assess abdominal obesity. WHR=Waist circumference (cm)/Hip circumference (cm). Body mass index (BMI) (kg·m-2) =Weight (kg)/Height (m) 2.
2.7 Blood samples collection and serum A20 level qualification by ELISA
Fasting venous blood was collected by trained professionals in the morning. The samples were then centrifuged at 4°C and 3000 rpm for 5 minutes to separate the serum and stored at -80°C until analysis (no more than 6 months). Serum A20 level concentrations were measured utilizing a commercially available enzyme-linked immunosorbent assay (ELISA) kit (CUSABIO, Wuhan, China) according to the manufacturer’s protocols. The sensitivity was 5.8 pg/mL. The intra-assay and inter-assay variations were <10%.
2.8 Statistical analysis
Statistical analysis and visualization were performed by SPSS version 27.0 (IBM, Armonk, NY, USA) and the software GraphPad Prism version 10.0, separately. Shapiro-Wilk was applied to test the normality of the data. Mean ± SD was utilized to describe the continuous parameters in a normal distribution. Continuous parameters in a skewed distribution were shown as median (p25-p75). Categorical parameters were described as percentages and numbers. For variables in a normal distribution, t-test was employed to compare the difference between two groups. Otherwise, the Mann-Whitney U test was used for analysis. Difference analysis in categorical variables was conducted by the chi-square test. Factors with P<0.1 were considered to have potential associations with low bone mass and were included in the binary logistic regression. A20 level was normalized by ln transformation and thus was in a normal distribution. Pearson or Spearman correlation analysis was used to explore the association between serum A20 level and other clinical parameters, including BMD. Partial correlation analysis was conducted to extract the correlation coefficient after adjusting for age, sex, smoking, drinking and BMI. Univariate linear regression analysis was conducted to explore which variable was correlated with the BMD of lumbar spine 1-4. Variables with P<0.1 were considered as confounding factors and would be adjusted. Multiple linear regression analysis was employed to correct confounding factors to figure out if there was an independent correlation between serum A20 level and BMD of lumbar spine 1-4. Statistical significance was defined as a two-sided P-value <0.05.
3 Results
3.1 Serum A20 level and baseline characteristics of the studied populations
There was no significant difference in serum A20 level between males and females, regardless of diabetes status (Figure 2A). Compared with non-T2DM patients, serum A20 level was significantly lower in patients with T2DM in the total population [41.30 (29.91, 61.87) vs 76.01 (54.90 VS 109.64) pg/mL, P<0.001], the male individuals [41.70 (29.00, 66.25) vs 81.66 (57.65, 120.51) pg/mL, P<0.001] and the female individuals [41.30 (31.61, 59.37) vs 72.93 (54.19, 107.63) pg/mL, P<0.001] (Figure 2B). Further we found that in the male patients with T2DM, serum A20 level was lower in low BMD group compared with the normal BMD group [36.53 (26.56, 59.32) vs 49.47 (39.12, 77.45) pg/mL, P=0.007] (Figure 2C), but no significant difference was shown in serum A20 level between the normal BMD group and low BMD group in females and the total population.
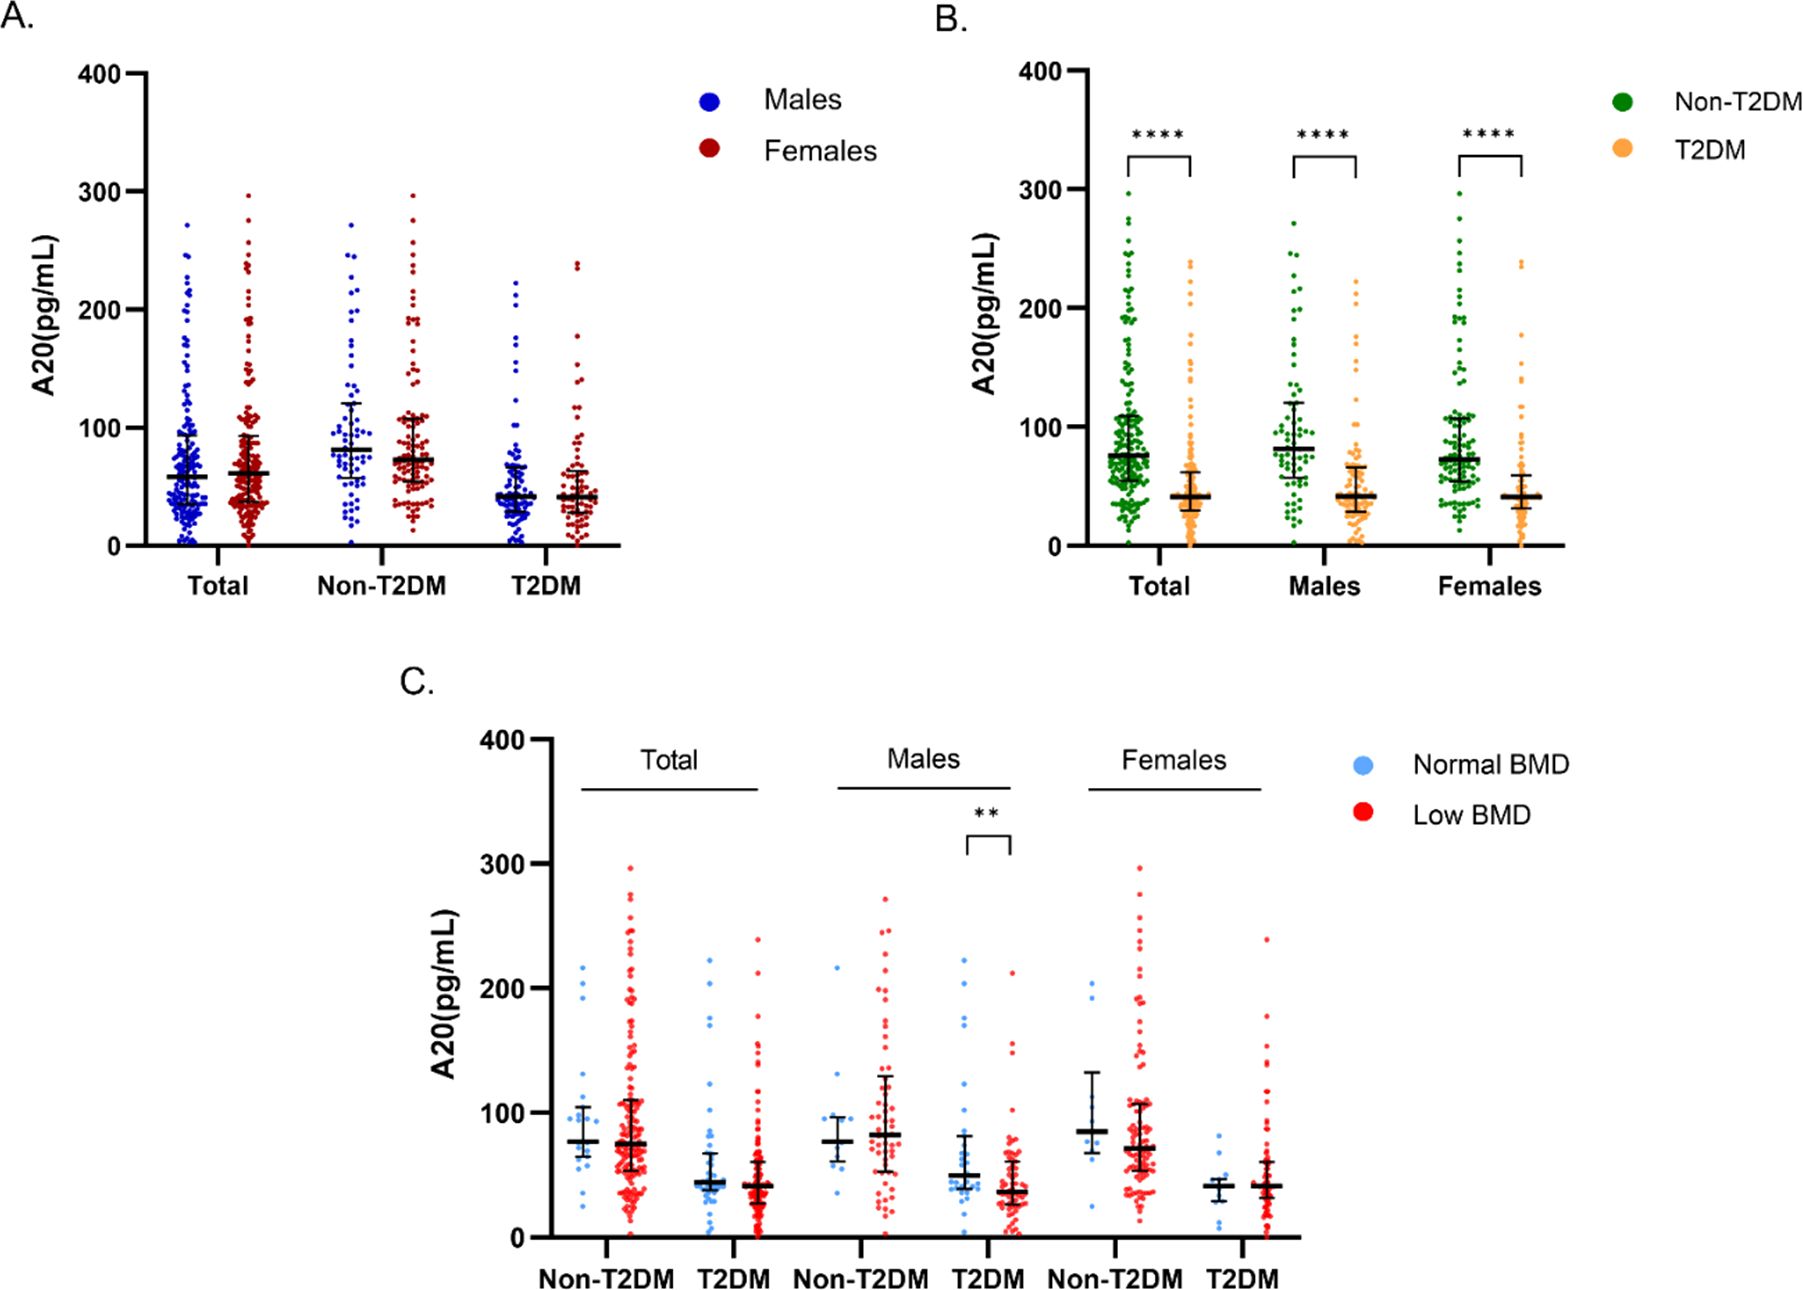
Figure 2. Comparison of serum A20 level grouped by gender, T2DM and bone mass. (A) Comparison of serum A20 level between males and females in the total, non-diabetic and diabetic populations. (B) Comparison of serum A20 level between non-diabetic and diabetic groups in the total population, males and females. (C) Comparison of serum A20 level between the normal BMD and low BMD groups categorized by sex and T2DM status. The statistical analyses were performed using Mann-Whitney U test and the significant levels were set at **P<0.01, ****P<0.0001. T2DM, type 2 diabetes mellitus; BMD, bone mineral density.
In male patients with T2DM, compared to the normal BMD group, the low BMD group had lower BMI (23.86 ± 2.697 vs 25.36 ± 3.138 kg/m2, P=0.026), calf circumference (33.19 ± 3.496 vs 35.15 ± 2.659 cm, P=0.015) and TC (4.18 ± 1.192 vs 4.89 ± 1.546 mmol/L, P=0.029). In male patients without T2DM, compared with the normal BMD group, the low BMD group were younger (68.79 ± 7.938 vs 74.42 ± 6.751 years, P=0.016) and had smaller waist circumference (87.66 ± 7.835 vs 92.65 ± 7.330 cm, P=0.041), higher level of HDL (1.33 ± 0.363 vs 1.10 ± 0.250 mmol/L, P=0.011) and CTX (0.37 ± 0.185 vs 0.28 ± 0.116 ng/mL, P=0.03) (Table 1). In female patients with T2DM, compared to the normal BMD group, the low BMD group were older (69.27 ± 8.093 vs 62.00 ± 10.41 years, P=0.037) and had a lower level of left-hand grip strength (16.63 ± 5.340 vs 19.47 ± 3.663 kg, P=0.038). In female patients without T2DM, compared with the normal BMD group, the low BMD group had a higher level of CTX (0.46 ± 0.195 vs 0.37 ± 0.075 ng/mL, P=0.012) (Table 2).
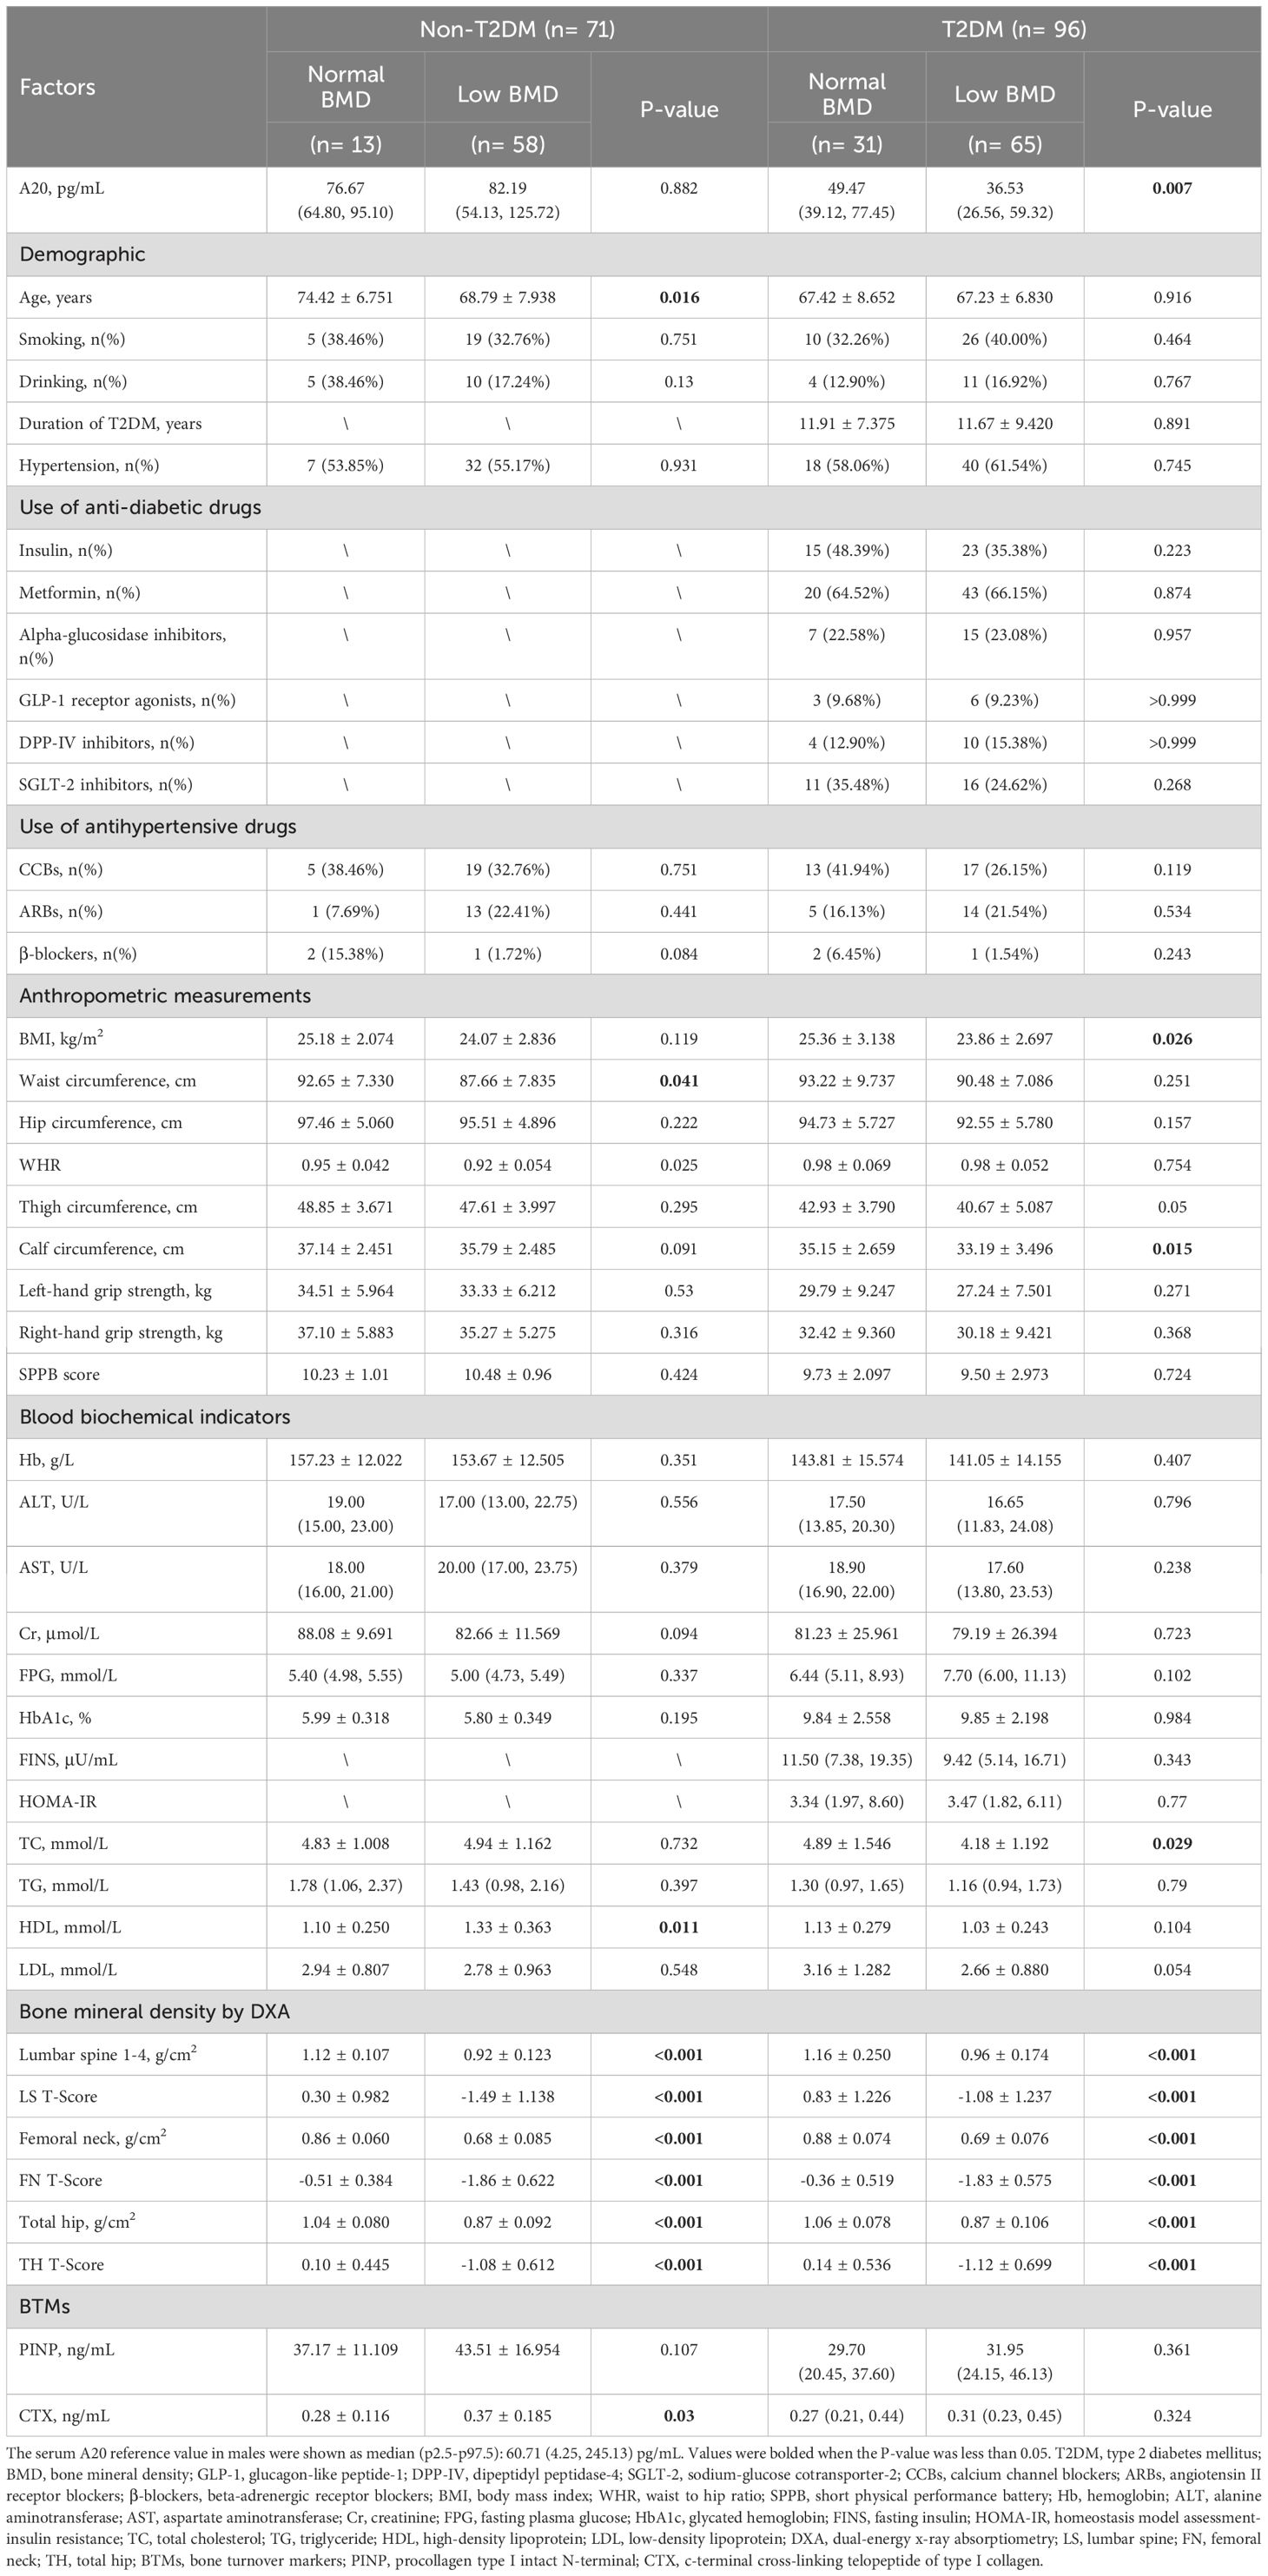
Table 1. Baseline clinical and biochemical characteristics of male individuals.
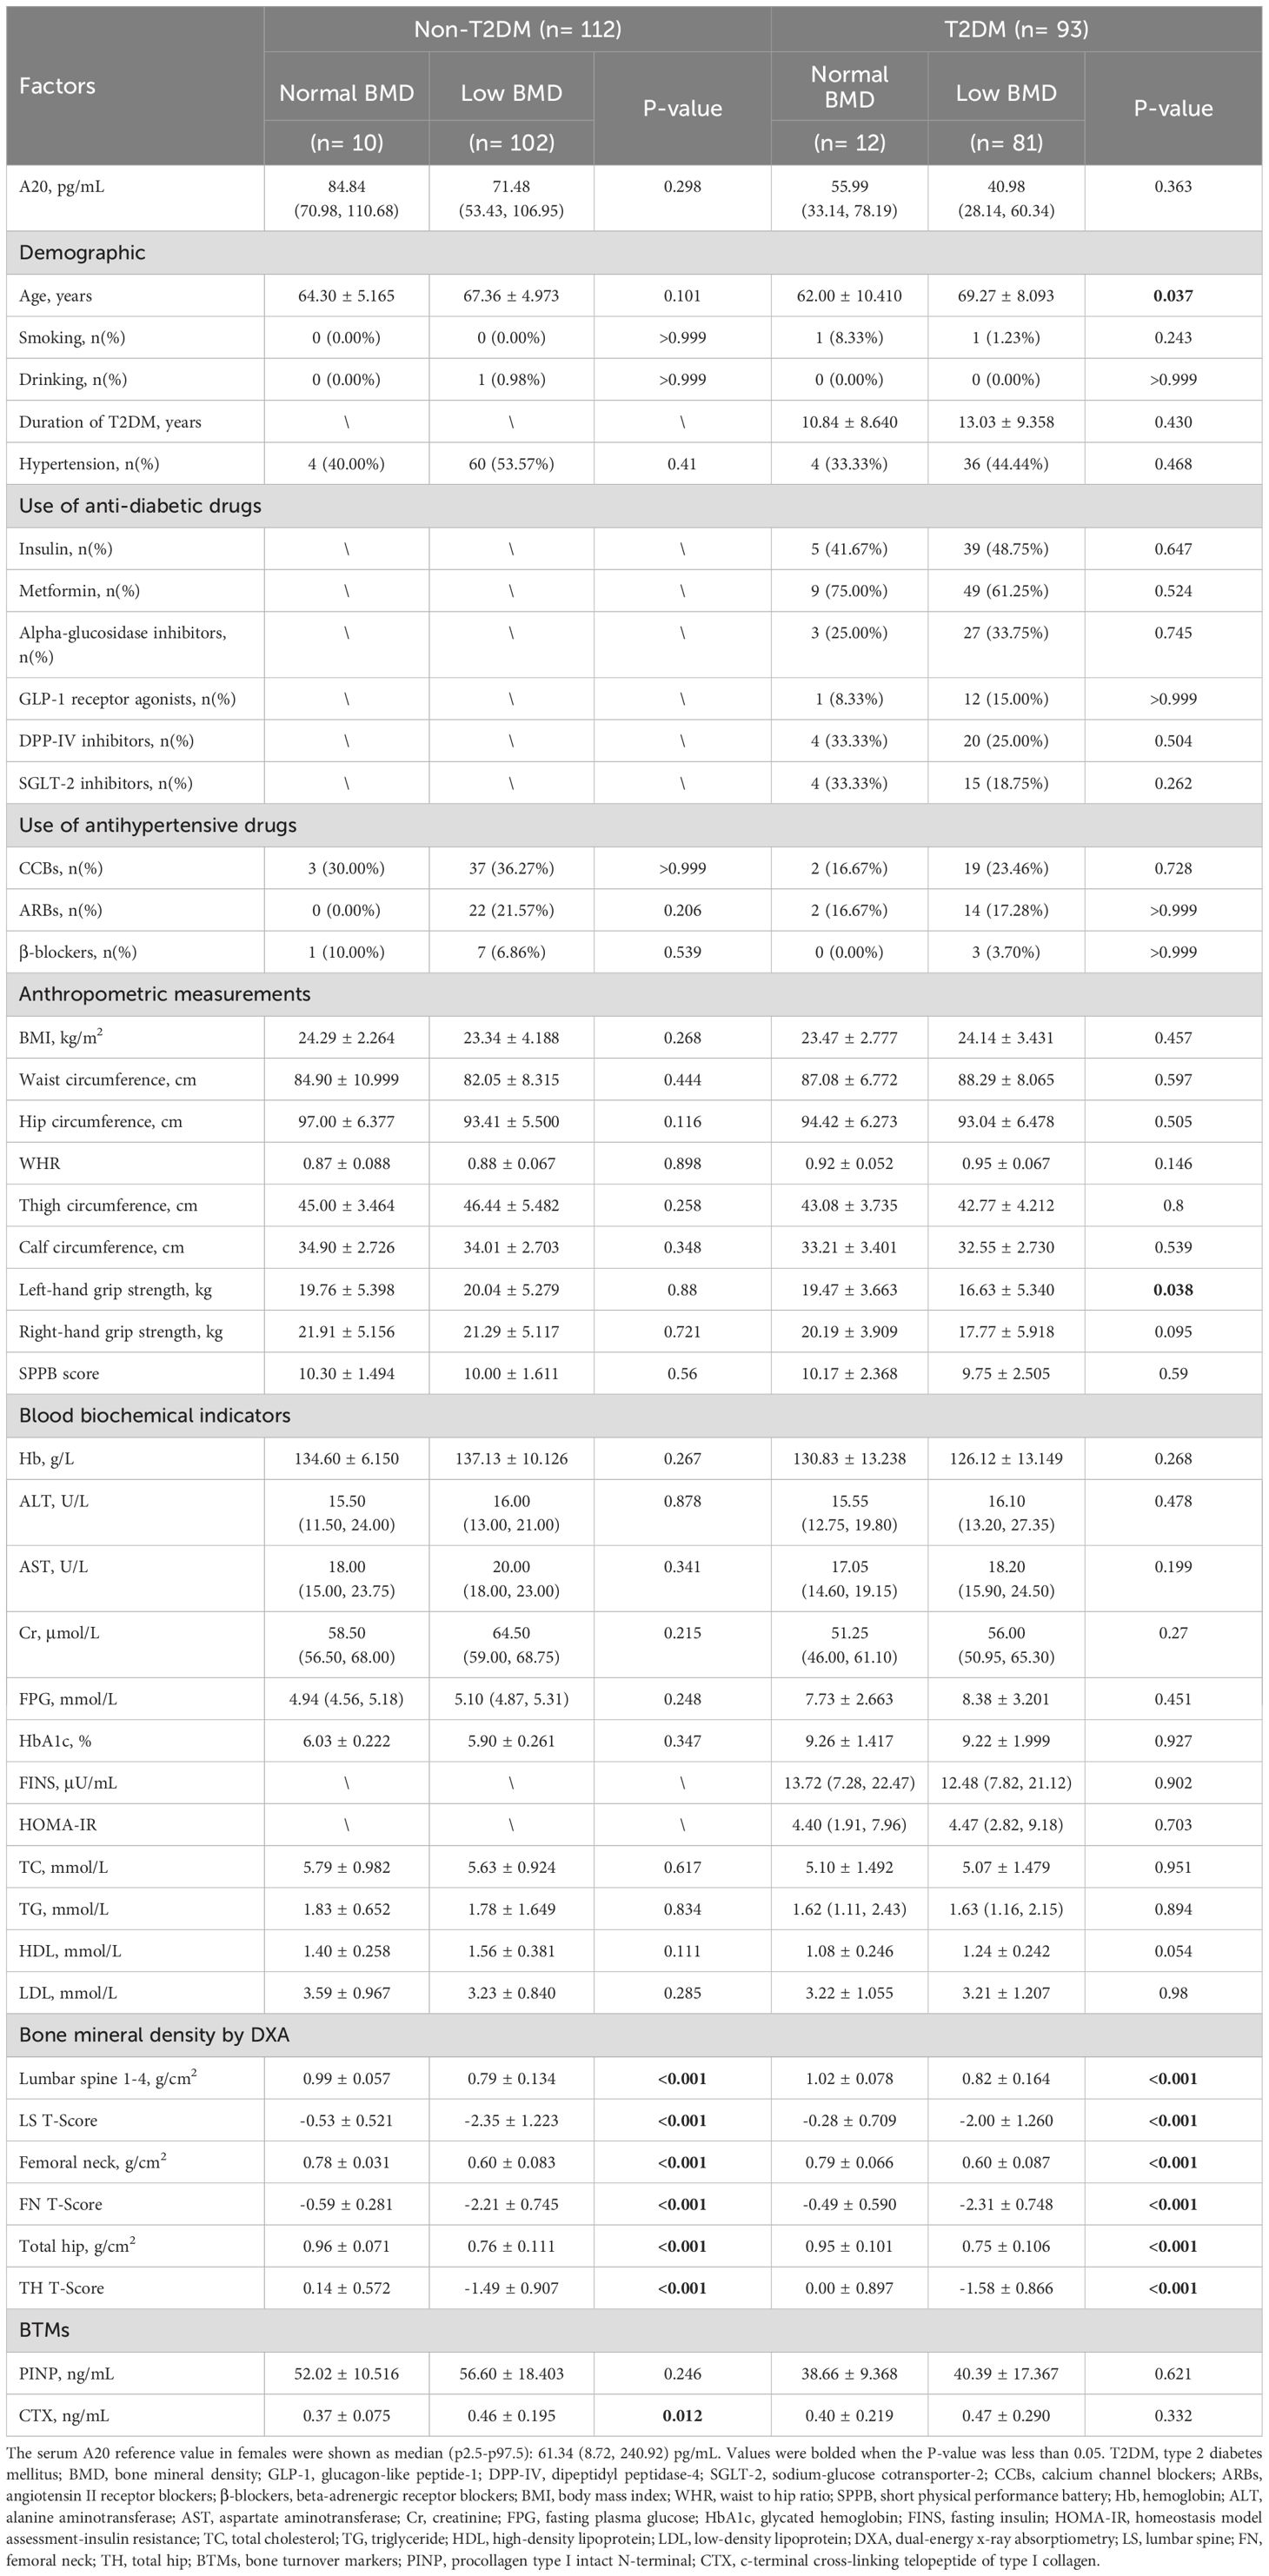
Table 2. Baseline clinical and biochemical characteristics of female individuals.
3.2 Association of serum A20 level with anthropometric, SPPB, biochemical and clinical parameters in all subjects
Bivariate correlation analysis was employed to explore the correlation between serum A20 level and other variables. The results showed that serum A20 level was positively associated with drinking (r=0.113, P=0.039), Hb (r=0.133, P=0.015), AST (r=0.149, P=0.006), Cr (r=0.208, P<0.001), HDL (r=0.111, P=0.043) and was negatively associated with T2DM (r=-0.418, P<0.001), waist circumference (r=-0.123,P=0.038), WHR (r=-0.173,P=0.003), FPG (r=-0.396, P<0.001) and HbA1c (r=-0.205, P=0.001). Next, after adjusting for age, sex, smoking, drinking and BMI, the partial correlation analysis revealed that serum A20 level was positively correlated with Hb (r=0.143, P=0.044), AST (r=0.153, P=0.031), Cr (r=0.165, P=0.02) and was negatively associated with occurrence of T2DM (r=-0.352, P<0.001), WHR (r=-0.172, P=0.015), FPG (r=-0.227, P=0.001) and HbA1c (r=-0.205, P=0.004) (Table 3).
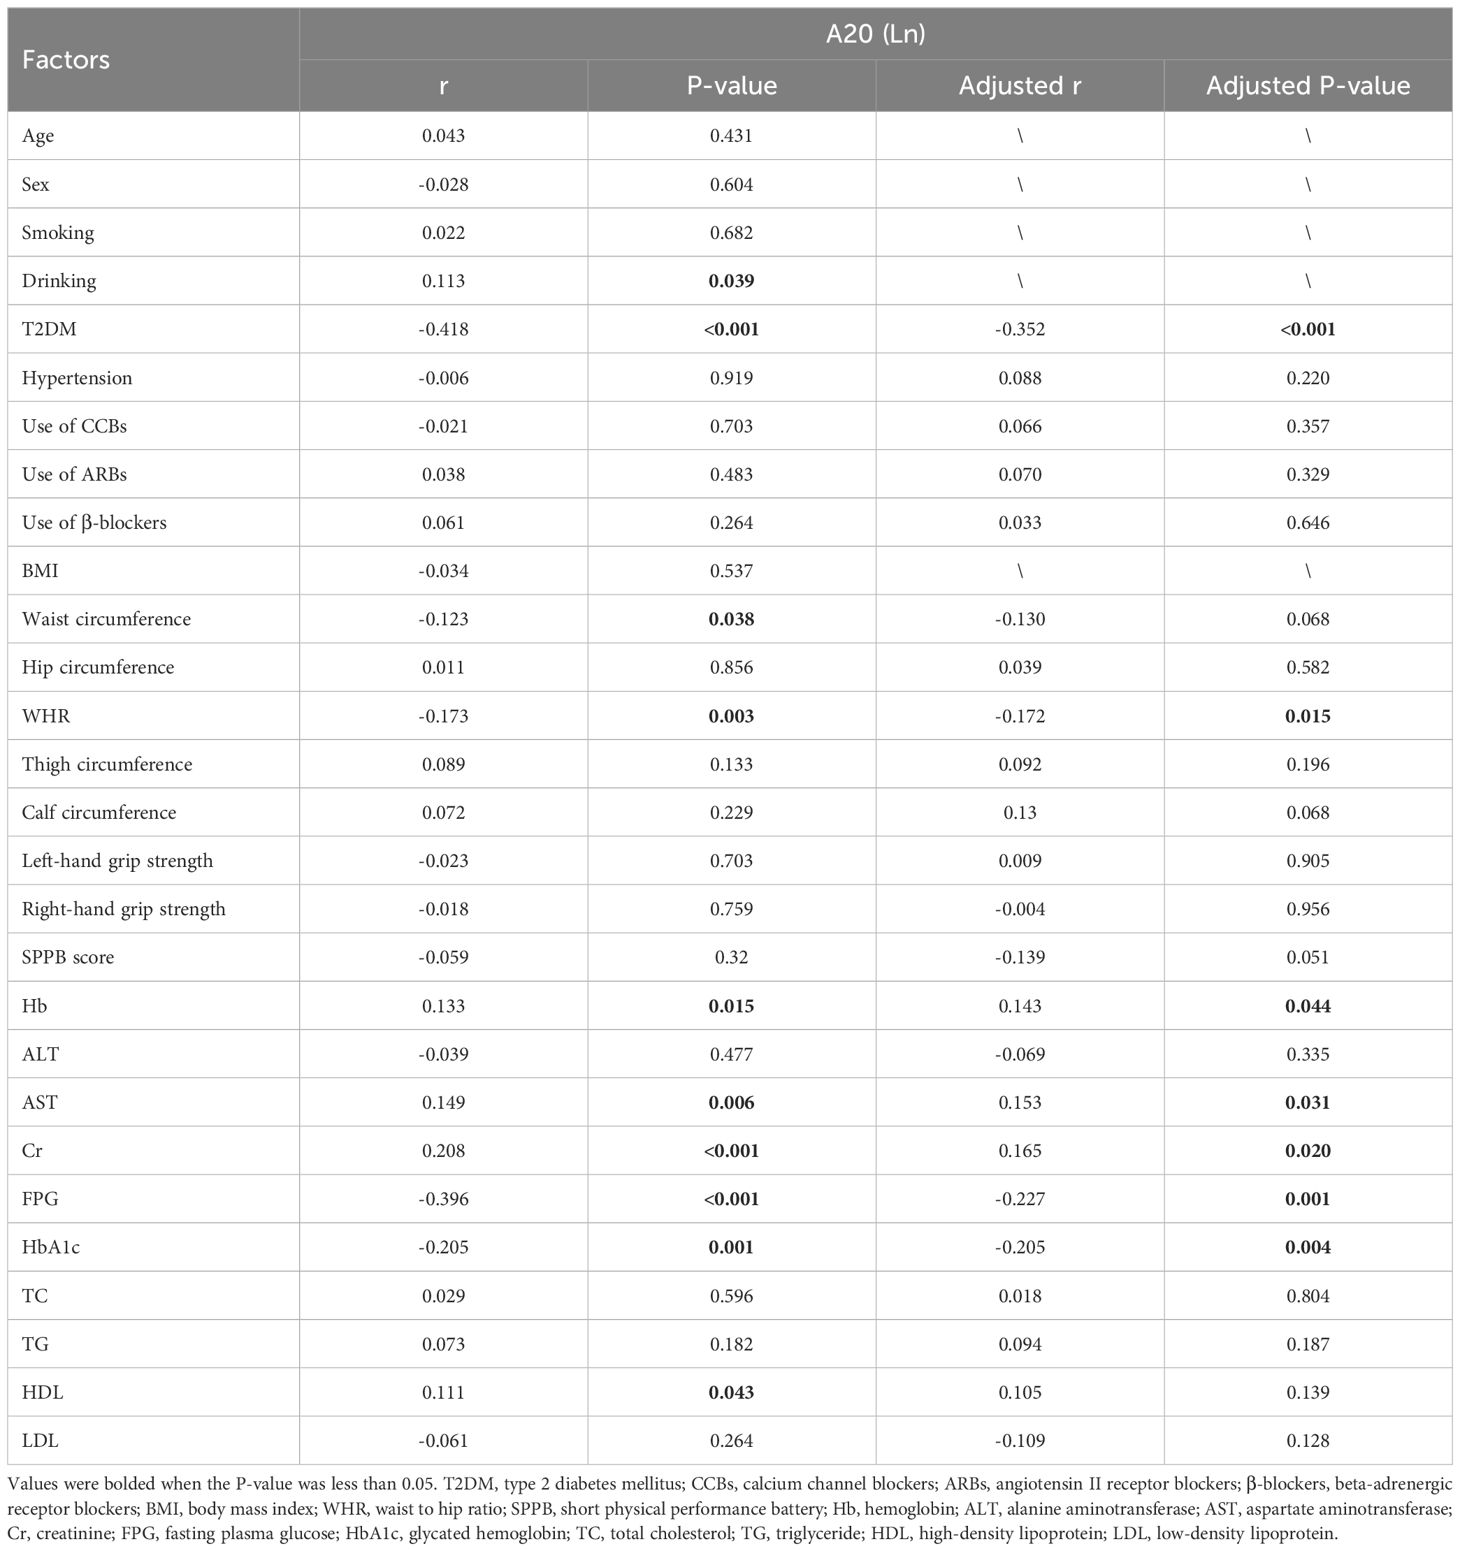
Table 3. Bivariate correlation analysis of variables associated with Serum A20 in all subjects.
3.3 Association of serum A20 level with BMD and BTMs
The results of Pearson analysis showed that serum A20 level was significantly associated with BMD (r=0.253, P=0.032) and corresponding T-score (r=0.255, P=0.031) of lumbar spine 1-4 in male patients with T2DM. However, no correlation was shown between serum A20 level with BMD of femoral neck, BMD of total hip and BTMs. Besides, no correlation was shown between serum A20 level with BMD and BTMs in other groups (Table 4).
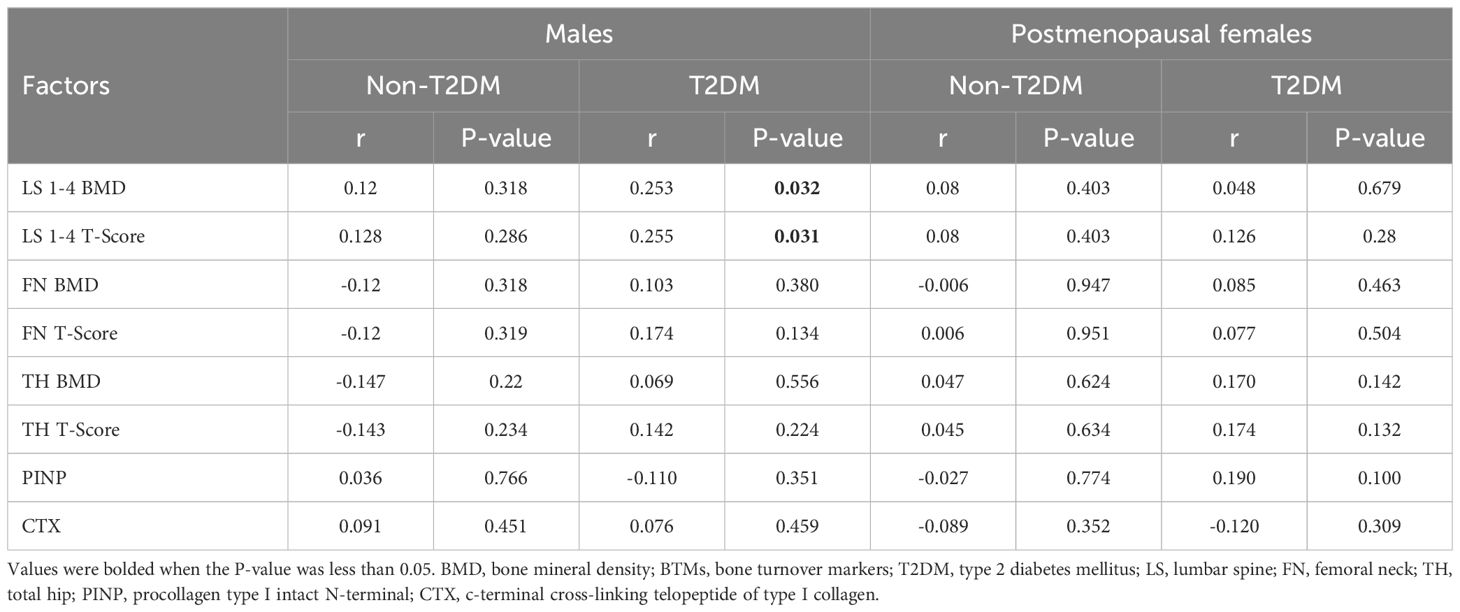
Table 4. Linear correlation analysis of A20 with BMD, T-Scores and BTMs.
3.4 Multivariate regression analysis of variables contributing to lumbar spine 1-4 BMD in male patients with T2DM
Firstly, univariate correlation analysis was employed to figure out the potential confounders of BMD. The results showed that the serum A20 level, duration of T2DM, hypertension, use of insulin and GLP-1 receptor agonists were positively correlated with lumbar spine 1-4 BMD and FPG was negatively correlated with lumbar spine 1-4 BMD (P<0.1). Next, multivariate regression analysis showed that serum A20 level (Beta=0.047; 95% CI: 0.007-0.086; P=0.024) and use of insulin (Beta=0.084; 95% CI: 0.002-0.166; P=0.049) were positively correlated with lumbar spine 1-4 BMD and FPG was negatively correlated with lumbar spine 1-4 BMD (Beta=-0.011; 95% CI: -0.021-0.000; P=0.047) after adjusting for confounding factors (Table 5).
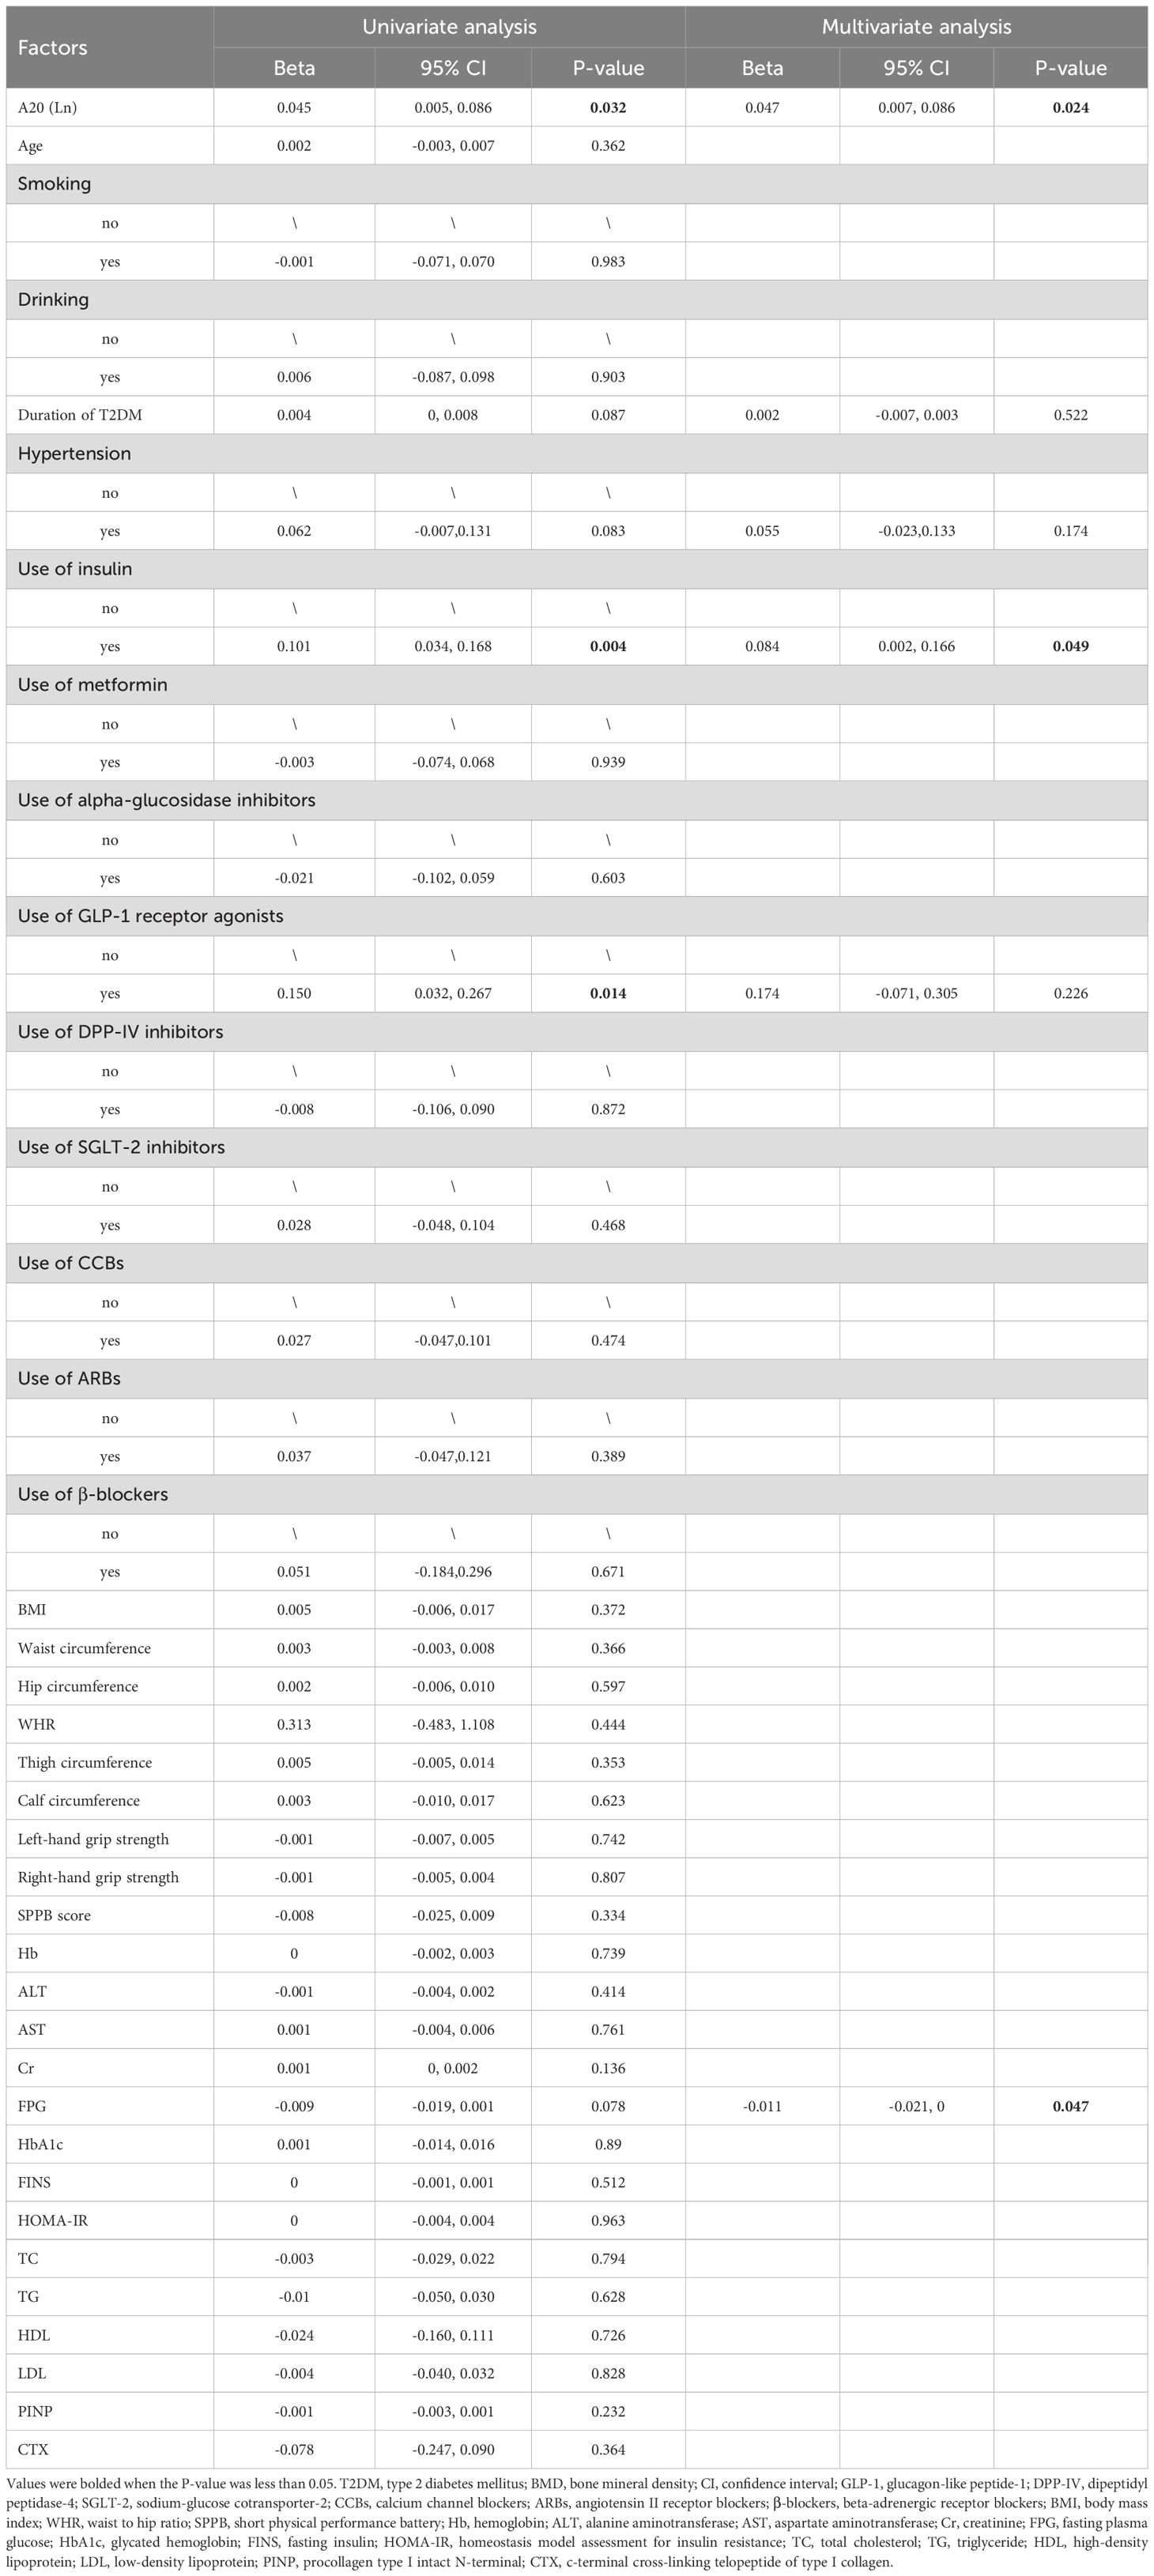
Table 5. Multivariate regression analysis of variables contributing to lumbar spine 1-4 BMD in male patients with T2DM.
3.5 Multivariable-adjusted OR for the correlation of serum A20 level with increased presence of low BMD in male patients with T2DM
Binary logistic regression analysis was conducted to assess the independent association between serum A20 level and low BMD. The result showed that after adjusting for drinking, BMI, WHR, thigh circumference, calf circumference, Hb, AST, Cr, FPG, HbA1c, TC and LDL, serum A20 level remained as a negative predictor for low BMD (OR:0.22; 95% CI: 0.09-0.59; P =0.002). Besides, BMI (OR: 0.73; 95% CI: 0.55-0.96; P =0.026) and TC (OR: 0.44; 95% CI: 0.21-0.91; P =0.027) were negative predictors for low BMD and higher WHR was a positive predictor for low BMD (OR: 6.67; 95% CI: 1.67-26.58; P =0.007) (Figure 3).
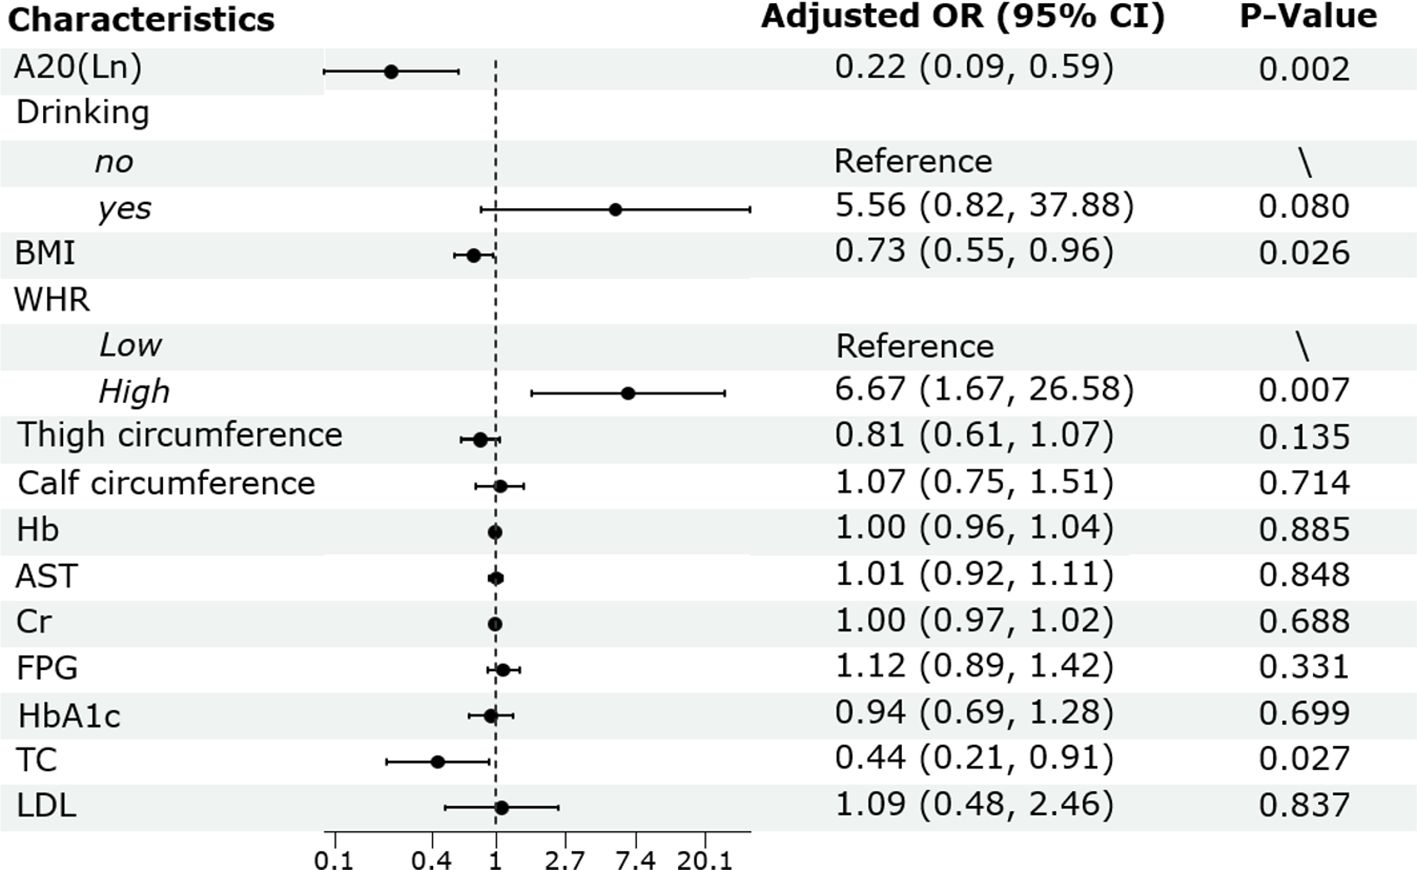
Figure 3. Binary logistic regression analysis of the risk factors of low BMD in male patients with T2DM. BMD, bone mineral density; T2DM, type 2 diabetes mellitus; OR, odds ratio; CI, confidence interval; BMI, body mass index; WHR, waist to hip ratio; Hb, hemoglobin; AST, aspartate aminotransferase; Cr, creatinine; FPG, fasting plasma glucose; HbA1c, glycated hemoglobin; TC, total cholesterol; LDL, low-density lipoprotein.
4 Discussion
Glucose metabolism and A20 could regulate each other reciprocally. One the one hand, previous studies suggested that high glucose environment or cytokines like TNF-α can initially stimulate the early production of A20 mRNA in various cell types (25–27). However, sustained hyperglycemia, may cause A20 mRNA to undergo N6-methyladenosine(m6A) modification, reducing its stability, accelerating its degradation and ultimately lowering A20 expression (28). At the protein level, studies have revealed significant reductions in A20 under high glucose conditions (29). For instance, A20 in smooth muscle cells (SMCs) may undergo ubiquitination and degradation due to glycosylation modifications when exposed to high glucose (30). Consistently, a study reported that patients with T2DM and LADA had significantly lower mRNA and protein expression level of A20 in peripheral blood mononuclear cells compared to the control group (31). On the other hand, the decline or pathological deficiency of A20 level may profoundly impact the blood glucose concentration and insulin production, particularly by modulating inflammatory signaling pathways and β-cell functions. Overexpressed A20 in islet could block NF-κB activation through reducing the induction of pro-inflammatory cytokines (32). Besides, A20 maintained β-cell integrity and survival by regulating apoptotic signaling (33). In addition to its role in controlling NF-κB signaling, A20 could down-regulate c-Jun N-terminal kinase (JNK) pathway and up-regulate v-Akt murine thymoma viral oncogene homolog (AKT)-dependent survival pathway in β-cell, thus protected β-cells from intrinsic apoptotsis (34). Lowered A20 level in human islet cells led to impaired insulin secretion induced by glucose, diminished expression of β-cell regulatory genes and transcription factors which are essential for the β-cell maturation and normal function (20).
Previous studies showed that patients with osteoporosis had lower level of Hb compared to the control group (35). Hemoglobin plays an antioxidant role in the preservation of bone health by safeguarding against oxidative stress-induced bone resorption and promoting bone formation (36). Higher WHR indicates more visceral white adipose tissue (WAT). Increased WAT is linked to systemic inflammation (37), oxidative stress, insulin resistance and endothelial dysfunction (38). In addition to IL-6, TNF-α, which can be partially secreted by WAT, WAT could also regulate bone homeostasis by secreting a variety of adipokines, such as leptin, adiponectin and resistin, etc. (39). For example, resistin could directly increase the circulating levels of IL-6 and TNF-α through NF-κB pathway and thus affect osteoclast differentiation (40). The multivariate logistic regression analysis found that higher WHR increased the risk of bone loss, which was consistent with previous studies (41).
A20 could influence bone homeostasis by participating in the regulation of bone formation and resorption processes. A20 non-specific knockout mice exhibited thinner trabeculae compared to wild-type mice (42). A20 deficiency stimulates receptor activator of nuclear factor kappa-B (RANK)-dependent osteoclasts formation and activity by persistently activating the NF-kB pathway (22, 43), upregulating osteoclastic markers such cathepsin K and matrix metallopeptidase (MMP-9) (44) and increasing calcium and phosphate absorption (45). Animal experiments corroborate that specific knockout of A20 in osteoclasts considerably decreased trabecular volume and density without noticeable effects on cortical bone (22). Current research explores A20 as a potential therapeutic target to inhibit osteoclast activity (46). Additionally, A20 influences bone formation by affecting various types of cells. A20 could protect osteoblasts from TNF-α-induced apoptosis and promote osteogenic differentiation (26). Though little understood, the influence of A20 on MSCs suggest its role in enhancing alkaline phosphatase activity and Ca2+ mineralized nodule accumulation during osteogenic induction mediated by γ-aminobutyric acid (GABA) (47). A20 has been shown to mitigate NF-κB activation in response to high glucose, reducing endothelial damage and apoptosis (27). Based on this, it can be speculated that A20 may influence osteogenesis by affecting the vascular endothelium closely coupled with osteogenesis, such as the H-type vessels in the metaphysis of long bones. However, this hypothesis requires further research to be confirmed.
A20 was found to be positively associated with lumbar spine 1-4 BMD rather than femoral neck or total hip BMD. The lumbar spine contains a higher proportion of trabecular bone compared to cortical bone (48). Chronic inflammation affects trabecular and cortical bone to different extent, typically causing more bone loss in trabecular regions (49). Therefore, the lumbar spine may be more responsive to A20’s regulation of inflammation.
The positive correlation between A20 and bone mass was shown in males but not females. Recent studies found that in both early and late postmenopausal females, bone mass loss remained at a high rate (50, 51). Although the peak bone loss in females occurs between the ages of 50 and 55, studies have shown that in individuals aged 67–69 years, bone loss in females is 2–5 times greater than in males (52). In females, the impact of estrogen deficiency persists throughout both the early and late stages of postmenopause (53). The abrupt decline in estrogen level triggers rapid bone loss over months to years after menopause, then followed by a second peak around the age of 70, possibly driven by secondary hyperparathyroidism resulting from early-phase bone loss (54, 55). In males, the gradual decline in sex hormones leads to a slow and sustained loss of bone mass (56, 57). Although increasing studies suggests that estrogen may play a more significant role than androgens in male osteoporosis (58–60), estrogen levels in older adults males remain higher than those in postmenopausal females (61, 62). Accelerated bone loss associated with estrogen withdrawal is mediated in part by increased oxidative stress and inflammation. The estrogen decline induces T cell activation, which elevates inflammatory cytokines like TNF-α and IL-1 in the bone marrow and circulation (63–66). TNF-α promotes RANKL production, enhancing osteoclast differentiation and suppresses osteogenic gene expression (67–69). Consequently, the significantly lower levels of estrogen in postmenopausal females may lead to more severe inflammation-induced bone loss than males, potentially overshadowing the regulatory role of A20 in inflammation.
This study provides us bountiful clues about the association between serum A20 level with bone metabolism, however, this study had several limitations. Firstly, cross-sectional design in this study was unable to determine causal relationships and perspective trials are necessary to confirm these results. Secondly, clinical trials with larger samples are necessary to confirm the different results between gender. Lastly, basic experimental researches will provide novel insights about how A20 regulates diabetic osteopathy.
Data availability statement
The original contributions presented in the study are included in the article/supplementary material. Further inquiries can be directed to the corresponding author.
Ethics statement
The studies involving humans were approved by the Ethics Committee of Tongji Hospital affiliated with Tongji University. The studies were conducted in accordance with the local legislation and institutional requirements. The participants provided their written informed consent to participate in this study.
Author contributions
DH: Conceptualization, Data curation, Formal analysis, Investigation, Visualization, Writing – original draft, Writing – review & editing. JL: Conceptualization, Data curation, Formal analysis, Investigation, Writing – original draft, Writing – review & editing. YW: Data curation, Formal analysis, Investigation, Writing – review & editing. HW: Data curation, Formal analysis, Investigation, Writing – review & editing. LY: Data curation, Formal analysis, Investigation, Writing – review & editing. WJ: Data curation, Formal analysis, Investigation, Writing – review & editing. LS: Conceptualization, Funding acquisition, Methodology, Project administration, Resources, Supervision, Writing – review & editing.
Funding
The author(s) declare that financial support was received for the research, authorship, and/or publication of this article. This work was supported by Medical Innovation Research Project of Shanghai Municipal Commission of Science and Technology [22Y11904600] and the Shanghai Municipal Health Commission [202340187].
Conflict of interest
The authors declare that the research was conducted in the absence of any commercial or financial relationships that could be construed as a potential conflict of interest.
Publisher’s note
All claims expressed in this article are solely those of the authors and do not necessarily represent those of their affiliated organizations, or those of the publisher, the editors and the reviewers. Any product that may be evaluated in this article, or claim that may be made by its manufacturer, is not guaranteed or endorsed by the publisher.
References
1. Ying W, Fu W, Lee YS, Olefsky JM. The role of macrophages in obesity-associated islet inflammation and β-cell abnormalities. Nat Rev Endocrinol. (2020) 16:81–90. doi: 10.1038/s41574-019-0286-3
2. Sun H, Saeedi P, Karuranga S, Pinkepank M, Ogurtsova K, Duncan BB, et al. IDF Diabetes Atlas: Global, regional and country-level diabetes prevalence estimates for 2021 and projections for 2045. Diabetes Res Clin Practice. (2022) 183:109119. doi: 10.1016/j.diabres.2021.109119
3. Clynes MA, Harvey NC, Curtis EM, Fuggle NR, Dennison EM, Cooper C. The epidemiology of osteoporosis. Br Med Bull. (2020) 133:105–17. doi: 10.1093/bmb/ldaa005
4. Chandran M, Lau TC, Gagnon-Arpin I, Dobrescu A, Li W, Leung MYM, et al. The health and economic burden of osteoporotic fractures in Singapore and the potential impact of increasing treatment rates through more pharmacological options. Arch Osteoporos. (2019) 14:114. doi: 10.1007/s11657-019-0664-4
5. Anam AK, Insogna K. Update on osteoporosis screening and management. Med Clin North Am. (2021) 105:1117–34. doi: 10.1016/j.mcna.2021.05.016
6. Si Y, Wang C, Guo Y, Xu G, Ma Y. Prevalence of osteoporosis in patients with type 2 diabetes mellitus in the chinese mainland: A systematic review and meta-analysis. Iran J Public Health. (2019) 48:1203–14.
7. Wu B, Fu Z, Wang X, Zhou P, Yang Q, Jiang Y, et al. A narrative review of diabetic bone disease: Characteristics, pathogenesis, and treatment. Front Endocrinol (Lausanne). (2022) 13:1052592. doi: 10.3389/fendo.2022.1052592
8. Melton LJ, Leibson CL, Achenbach SJ, Therneau TM, Khosla S. Fracture risk in type 2 diabetes: update of a population-based study. J Bone Miner Res. (2008) 23:1334–42. doi: 10.1359/jbmr.080323
9. Hofbauer LC, Busse B, Eastell R, Ferrari S, Frost M, Müller R, et al. Bone fragility in diabetes: novel concepts and clinical implications. Lancet Diabetes Endocrinol. (2022) 10:207–20. doi: 10.1016/S2213-8587(21)00347-8
10. Hotamisligil GS, Peraldi P, Budavari A, Ellis R, White MF, Spiegelman BM. IRS-1-mediated inhibition of insulin receptor tyrosine kinase activity in TNF-alpha- and obesity-induced insulin resistance. Science. (1996) 271:665–8. doi: 10.1126/science.271.5249.665
11. Yousef H, Khandoker AH, Feng SF, Helf C, Jelinek HF. Inflammation, oxidative stress and mitochondrial dysfunction in the progression of type II diabetes mellitus with coexisting hypertension. Front Endocrinol. (2023) 14:1173402/full. doi: 10.3389/fendo.2023.1173402/full
12. Liu W, Zhang X. Receptor activator of nuclear factor-κB ligand (RANKL)/RANK/osteoprotegerin system in bone and other tissues (review). Mol Med Rep. (2015) 11:3212–8. doi: 10.3892/mmr.2015.3152
13. Zhang B, Yang Y, Yi J, Zhao Z, Ye R. Hyperglycemia modulates M1/M2 macrophage polarization via reactive oxygen species overproduction in ligature-induced periodontitis. J Periodontal Res. (2021) 56:991–1005. doi: 10.1111/jre.12912
14. Yan P, Xu Y, Zhang Z, Zhu J, Miao Y, Gao C, et al. Association of circulating omentin-1 with osteoporosis in a chinese type 2 diabetic population. Mediators Inflammation. (2020) 2020:9389720. doi: 10.1155/2020/9389720
15. Wang T, Zhang X, Li JJ. The role of NF-kappaB in the regulation of cell stress responses. Int Immunopharmacol. (2002) 2:1509–20. doi: 10.1016/S1567-5769(02)00058-9
16. Hong Y, Boiti A, Vallone D, Foulkes NS. Reactive oxygen species signaling and oxidative stress: transcriptional regulation and evolution. Antioxidants (Basel). (2024) 13:312. doi: 10.3390/antiox13030312
17. Wertz IE, O’Rourke KM, Zhou H, Eby M, Aravind L, Seshagiri S, et al. De-ubiquitination and ubiquitin ligase domains of A20 downregulate NF-kappaB signalling. Nature. (2004) 430:694–9. doi: 10.1038/nature02794
18. Zhang L, Yao Y, Tian J, Jiang W, Zhou S, Chen J, et al. Alterations and abnormal expression of A20 in peripheral monocyte subtypes in patients with rheumatoid arthritis. Clin Rheumatol. (2021) 40:341–8. doi: 10.1007/s10067-020-05137-w
19. Zhao X, Dong R, Zhang L, Guo J, Shi Y, Ge L, et al. N6-methyladenosine-dependent modification of circGARS acts as a new player that promotes SLE progression through the NF-κB/A20 axis. Arthritis Res Ther. (2022) 24:37. doi: 10.1186/s13075-022-02732-x
20. Ratajczak W, Atkinson SD, Kelly C. A20 controls expression of beta-cell regulatory genes and transcription factors. J Mol Endocrinol. (2021) 67:189–201. doi: 10.1530/JME-21-0076
21. Yan K, Wu C, Ye Y, Li L, Wang X, He W, et al. A20 inhibits osteoclastogenesis via TRAF6-dependent autophagy in human periodontal ligament cells under hypoxia. Cell Prolif. (2020) 53:e12778. doi: 10.1111/cpr.12778
22. Martens A, Hertens P, Priem D, Rinotas V, Meletakos T, Gennadi M, et al. A20 controls RANK-dependent osteoclast formation and bone physiology. EMBO Rep. (2022) 23:e55233. doi: 10.15252/embr.202255233
23. Schwartz AV, Vittinghoff E, Bauer DC, Hillier TA, Strotmeyer ES, Ensrud KE, et al. Association of BMD and FRAX score with risk of fracture in older adults with type 2 diabetes. JAMA. (2011) 305:2184–92. doi: 10.1001/jama.2011.715
24. de Fátima Ribeiro Silva C, Ohara DG, Matos AP, Pinto ACPN, Pegorari MS. Short physical performance battery as a measure of physical performance and mortality predictor in older adults: A comprehensive literature review. Int J Environ Res Public Health. (2021) 18:10612. doi: 10.3390/ijerph182010612
25. Liuwantara D, Elliot M, Smith WS, Yam AO, Walters SN, Marino E, et al. Nuclear factor-kappaB regulates beta-cell death: a critical role for A20 in beta-cell protection. Diabetes. (2006) 55:2491–501. doi: 10.2337/db06-0142
26. Qin YJ, Zhang ZL, Yu LY, Jw H, Yn H, Tj L, et al. A20 overexpression under control of mouse osteocalcin promoter in MC3T3-E1 cells inhibited tumor necrosis factor-alpha-induced apoptosis. Acta pharmacologica Sin. (2006) 27:1231–7. doi: 10.1111/j.1745-7254.2006.00403.x
27. Hou CL, Zhang W, Wei Y, Mi JH, Li L, Zhou ZH, et al. Zinc finger protein A20 overexpression inhibits monocyte homing and protects endothelial cells from injury induced by high glucose. Genet Mol Res. (2011) 10:1050–9. doi: 10.4238/vol10-2gmr1102
28. Chen TC, Zhu WH, Wang CY, Dong X, Yu F, Su Y, et al. ALKBH5-mediated m6A modification of A20 regulates microglia polarization in diabetic retinopathy. Front Immunol. (2022) 13:813979. doi: 10.3389/fimmu.2022.813979
29. Liu L, Jiang Y, Steinle JJ. TNFAIP3 is anti-inflammatory in the retinal vasculature. Mol Vision. (2022) 28:124–9.
30. Shrikhande GV, Scali ST, da Silva CG, Damrauer SM, Csizmadia E, Putheti P, et al. O-glycosylation regulates ubiquitination and degradation of the anti-inflammatory protein A20 to accelerate atherosclerosis in diabetic ApoE-null mice. PloS One. (2010) 5:e14240. doi: 10.1371/journal.pone.0014240
31. Cheng LQ, Zhang DM, Jiang YZ, Deng W, Wu Q, Jiang X, et al. Decreased A20 mRNA and protein expression in peripheral blood mononuclear cells in patients with type 2 diabetes and latent autoimmune diabetes in adults. Diabetes Res Clin Pract. (2014) 106:611–6. doi: 10.1016/j.diabres.2014.09.014
32. Zammit NW, Seeberger KL, Zamerli J, Walters SN, Lisowski L, Korbutt GS, et al. Selection of a novel AAV2/TNFAIP3 vector for local suppression of islet xenograft inflammation. Xenotransplantation. (2021) 28:e12669. doi: 10.1111/xen.12669
33. Catrysse L, Fukaya M, Sze M, Meyerovich K, Beyaert R, Cardozo AK, et al. A20 deficiency sensitizes pancreatic beta cells to cytokine-induced apoptosis in vitro but does not influence type 1 diabetes development in vivo. Cell Death Dis. (2015) 6:e1918. doi: 10.1038/cddis.2015.301
34. Fukaya M, Brorsson CA, Meyerovich K, Catrysse L, Delaroche D, Vanzela EC, et al. A20 inhibits β-cell apoptosis by multiple mechanisms and predicts residual β-cell function in type 1 diabetes. Mol Endocrinol. (2016) 30:48–61. doi: 10.1210/me.2015-1176
35. Liu Y, Zeng Y, Lu J, Zhang X, Zhang Z, Li H, et al. Correlation of hemoglobin with osteoporosis in elderly Chinese population: A cross-sectional study. Front Public Health. (2023) 11:1073968. doi: 10.3389/fpubh.2023.1073968
36. Hannah SS, McFadden S, McNeilly A, McClean C. Take My Bone Away?” Hypoxia and bone: A narrative review. J Cell Physiol. (2021) 236:721–40. doi: 10.1002/jcp.v236.2
37. Panagiotakos DB, Pitsavos C, Yannakoulia M, Chrysohoou C, Stefanadis C. The implication of obesity and central fat on markers of chronic inflammation: The ATTICA study. Atherosclerosis. (2005) 183:308–15. doi: 10.1016/j.atherosclerosis.2005.03.010
38. Yang Y, Zhang H, Lan X, Qin X, Huang Y, Wang J, et al. Low BMI and high waist-to-hip ratio are associated with mortality risk among hemodialysis patients: a multicenter prospective cohort study. Clin Kidney J. (2022) 16:167–75. doi: 10.1093/ckj/sfac210
39. Liu X, Du Y, Zhao Z, Zou J, Zhang X, Zhang L. The multiple regulatory effects of white adipose tissue on bone homeostasis. J Cell Physiol. (2023) 238:1193–206. doi: 10.1002/jcp.v238.6
40. Kirk B, Feehan J, Lombardi G, Duque G. Muscle, bone, and fat crosstalk: the biological role of myokines, osteokines, and adipokines. Curr Osteoporos Rep. (2020) 18:388–400. doi: 10.1007/s11914-020-00599-y
41. Kim DH, Lim H, Chang S, Kim JN, Roh YK, Choi MK. Association between body fat and bone mineral density in normal-weight middle-aged koreans. Korean J Fam Med. (2019) 40:100–5. doi: 10.4082/kjfm.17.0082
42. Lee EG, Boone DL, Chai S, Libby SL, Chien M, Lodolce JP, et al. Failure to regulate TNF-induced NF-kappaB and cell death responses in A20-deficient mice. Science. (2000) 289:2350–4. doi: 10.1126/science.289.5488.2350
43. Lee MJ, Lim E, Mun S, Bae S, Murata K, Ivashkiv LB, et al. Intravenous immunoglobulin (IVIG) attenuates TNF-induced pathologic bone resorption and suppresses osteoclastogenesis by inducing A20 expression. J Cell Physiol. (2016) 231:449–58. doi: 10.1002/jcp.v231.2
44. Hong JY, Bae WJ, Yi JK, Kim GT, Kim EC. Anti-inflammatory and anti-osteoclastogenic effects of zinc finger protein A20 overexpression in human periodontal ligament cells. J Periodontal Res. (2016) 51:529–39. doi: 10.1111/jre.2016.51.issue-4
45. Matmati M, Jacques P, Maelfait J, Verheugen E, Kool M, Sze M, et al. A20 (TNFAIP3) deficiency in myeloid cells triggers erosive polyarthritis resembling rheumatoid arthritis. Nat Genet. (2011) 43:908–12. doi: 10.1038/ng.874
46. Kasher M, Freidin MB, Williams FM, Cherny SS, Malkin I, Livshits G. Shared genetic architecture between rheumatoid arthritis and varying osteoporotic phenotypes. J Bone Miner Res. (2022) 37:440–53. doi: 10.1002/jbmr.4491
47. Li H, Wu Y, Huang N, Zhao Q, Yuan Q, Shao B. [amp]]gamma;-aminobutyric acid promotes osteogenic differentiation of mesenchymal stem cells by inducing TNFAIP3. Curr Gene Ther. (2020) 20:152–61. doi: 10.2174/1566523220999200727122502
48. Clarke B. Normal bone anatomy and physiology. Clin J Am Soc Nephrol. (2008) 3 Suppl 3:S131–139. doi: 10.2215/CJN.04151206
49. Redlich K, Smolen JS. Inflammatory bone loss: pathogenesis and therapeutic intervention. Nat Rev Drug Discovery. (2012) 11:234–50. doi: 10.1038/nrd3669
50. Almeida M, Laurent MR, Dubois V, Claessens F, O’Brien CA, Bouillon R, et al. Estrogens and androgens in skeletal physiology and pathophysiology. Physiol Rev. (2017) 97:135–87. doi: 10.1152/physrev.00033.2015
51. Riggs BL, Khosla S, Melton LJ. A unitary model for involutional osteoporosis: estrogen deficiency causes both type I and type II osteoporosis in postmenopausal women and contributes to bone loss in aging men. J Bone Miner Res. (1998) 13:763–73. doi: 10.1359/jbmr.1998.13.5.763
52. Sigurdsson G, Aspelund T, Chang M, Jonsdottir B, Sigurdsson S, Eiriksdottir G, et al. Increasing sex difference in bone strength in old age: The Age, Gene/Environment Susceptibility-Reykjavik study (AGES-REYKJAVIK). Bone. (2006) 39:644–51. doi: 10.1016/j.bone.2006.03.020
53. Pietschmann P, Kerschan-Schindl K. Osteoporosis: gender-specific aspects. Wien Med Wochenschr. (2004) 154:411–5. doi: 10.1007/s10354-004-0100-1
54. Clarke BL, Khosla S. Physiology of bone loss. Radiol Clin North Am. (2010) 48:483–95. doi: 10.1016/j.rcl.2010.02.014
55. Zanocco KA, Yeh MW. Primary hyperparathyroidism: effects on bone health. Endocrinol Metab Clin North Am. (2017) 46:87–104. doi: 10.1016/j.ecl.2016.09.012
56. Laurent MR, Dedeyne L, Dupont J, Mellaerts B, Dejaeger M, Gielen E. Age-related bone loss and sarcopenia in men. Maturitas. (2019) 122:51–6. doi: 10.1016/j.maturitas.2019.01.006
57. Rinonapoli G, Ruggiero C, Meccariello L, Bisaccia M, Ceccarini P, Caraffa A. Osteoporosis in men: A review of an underestimated bone condition. Int J Mol Sci. (2021) 22:2105. doi: 10.3390/ijms22042105
58. Cauley JA. Estrogen and bone health in men and women. Steroids. (2015) 99:11–5. doi: 10.1016/j.steroids.2014.12.010
59. Sanyal A, Hoey KA, Mödder UI, Lamsam JL, McCready LK, Peterson JM, et al. Regulation of bone turnover by sex steroids in men. J Bone Miner Res. (2008) 23:705–14. doi: 10.1359/jbmr.071212
60. Szulc P. Role of sex steroids hormones in the regulation of bone metabolism in men: Evidence from clinical studies. Best Pract Res Clin Endocrinol Metab. (2022) 36:101624. doi: 10.1016/j.beem.2022.101624
61. Falahati-Nini A, Riggs BL, Atkinson EJ, O’Fallon WM, Eastell R, Khosla S. Relative contributions of testosterone and estrogen in regulating bone resorption and formation in normal elderly men. J Clin Invest. (2000) 106:1553–60. doi: 10.1172/JCI10942
62. Vilaca T, Eastell R, Schini M. Osteoporosis in men. Lancet Diabetes Endocrinol. (2022) 10:273–83. doi: 10.1016/S2213-8587(22)00012-2
63. Wu D, Cline-Smith A, Shashkova E, Perla A, Katyal A, Aurora R. T-cell mediated inflammation in postmenopausal osteoporosis. Front Immunol. (2021) 12:687551. doi: 10.3389/fimmu.2021.687551
64. Carlsten H. Immune responses and bone loss: the estrogen connection. Immunol Rev. (2005) 208:194–206. doi: 10.1111/j.0105-2896.2005.00326.x
65. Fischer V, Haffner-Luntzer M. Interaction between bone and immune cells: Implications for postmenopausal osteoporosis. Semin Cell Dev Biol. (2022) 123:14–21. doi: 10.1016/j.semcdb.2021.05.014
66. Ralston SH, Russell RG, Gowen M. Estrogen inhibits release of tumor necrosis factor from peripheral blood mononuclear cells in postmenopausal women. J Bone Miner Res. (1990) 5:983–8. doi: 10.1002/jbmr.5650050912
67. Kobayashi K, Takahashi N, Jimi E, Udagawa N, Takami M, Kotake S, et al. Tumor necrosis factor alpha stimulates osteoclast differentiation by a mechanism independent of the ODF/RANKL-RANK interaction. J Exp Med. (2000) 191:275–86. doi: 10.1084/jem.191.2.275
68. Azuma Y, Kaji K, Katogi R, Takeshita S, Kudo A. Tumor necrosis factor-alpha induces differentiation of and bone resorption by osteoclasts. J Biol Chem. (2000) 275:4858–64. doi: 10.1074/jbc.275.7.4858
Keywords: A20, type 2 diabetes mellitus, bone mineral density, bone turnover markers, low bone mass
Citation: Han D, Liu J, Wang Y, Wang H, Yuan L, Jin W and Song L (2025) Serum A20 level is associated with bone mineral density in male patients with type 2 diabetes mellitus. Front. Endocrinol. 16:1490214. doi: 10.3389/fendo.2025.1490214
Received: 04 September 2024; Accepted: 10 February 2025;
Published: 26 February 2025.
Edited by:
Ting Zheng, Hospital for Special Surgery, United StatesReviewed by:
Patricia Canto, National Autonomous University of Mexico, MexicoJialin Jiang, Hospital for Special Surgery, United States
Copyright © 2025 Han, Liu, Wang, Wang, Yuan, Jin and Song. This is an open-access article distributed under the terms of the Creative Commons Attribution License (CC BY). The use, distribution or reproduction in other forums is permitted, provided the original author(s) and the copyright owner(s) are credited and that the original publication in this journal is cited, in accordance with accepted academic practice. No use, distribution or reproduction is permitted which does not comply with these terms.
*Correspondence: Lige Song, NnNvbmdsaWdlQHRvbmdqaS5lZHUuY24=
†These authors have contributed equally to this work and share first authorship