 Baye Ashenef1*
 Bayu Wondimneh Yimenu1
 Enatnesh Essa Osman1Derese Sinamaw1
 Gelagey Baye1
 Zigale Hibstu Teffera2Mamaru Getinet Engida1
 Adane Adugna2Enyew Fenta Mengistu1Temesgen Baylie1
 Mohammed Jemal1
- 1Department of Biomedical Sciences, School of Medicine, Debre Markos University, Debre Markos, Ethiopia
- 2Department of Medical Laboratory Sciences, College of Health Sciences, Debre Markos University, Debre Markos, Ethiopia
Background: Excessive body weight are global health challenge affecting individuals across all age groups. They result from an imbalance between calorie intake and expenditure. Individuals with visual impairment are particularly vulnerable due to reduced physical activity, leading to higher rates of excessive body weight. This study assessed the prevalence and determinants of excessive body weight among visually impaired patients in northwest Ethiopia in 2024.
Method: A multi-centered institution-based cross-sectional study was done with 384 visually impaired patients selected using a simple random sample technique. An interviewer-administered structured questionnaire and physical assessments were used to gather data. The crude and adjusted odds ratios, as well as the 95% confidence intervals, were calculated. Bivariate and multivariate logistic regression analyses were performed. Variables having a p-value < 0.05 were considered substantially associated with excessive body weight.
Results: The prevalence of excessive body weight was 27.9% (95% CI: 23.2–32.8). Factors significantly associated with excessive body weight included being aged 65 or older (AOR = 5.43, 95% CI: 1.22–24.1), urban residency (AOR = 4.84, 95% CI: 2.95–7.95), and having visual impairment for five or more years (AOR = 3.33, 95% CI: 1.88–5.89).
Conclusion: Excessive body weight affects nearly one-third of visually impaired patients in northwest Ethiopia, with significant associations found for older age, urban residence, and long-term visual impairment. Integrating weight management programs, physical activity promotion, nutritional education, and community support is essential to improve health outcomes. Future studies using prospective cohort designs are recommended to explore causal relationships.
Introduction
Visual impairments often lead to reduced physical activity and difficulty managing food (1), contributing to unhealthy eating habits (2). Additionally, psychological issues such as depression, anxiety, and chronic stress can trigger hormonal changes and emotional eating, increasing their risk of excessive body weight (3)
Excessive body weight, defined by a BMI ≥ 25 kg/m² (4), encompasses both overweight and obesity and is characterized by an abnormal accumulation of body fat, significantly increasing health risks for individuals of all age groups (5–8). Excessive body weight arises mainly from an energy imbalance between calorie intake and expenditure (9). Contributing factors include reduced physical activity (10), insufficient sleep (11), abnormal physiological conditions (hypothyroidism, Cushing’s syndrome, growth hormone deficiency, eating disorders) (12–14), medications (like insulin, steroids, sulfonylureas, antidepressants, and hormonal contraceptives) (15), Genetic predisposition (14), and late-age pregnancy (16, 17).
These conditions are major risk factors for a range of non-communicable diseases, including cardiovascular diseases (heart disease and stroke), type 2 diabetes, musculoskeletal disorders like osteoarthritis, and certain cancers (e.g., endometrial, breast, and colon cancers) (18–20).
Globally, the prevalence of excessive body weight is rising. In 2022, the WHO reported that 2.5 billion adults were overweight, and 890 million were obese, with this trend evident in both developing and developed countries (16, 19). In Africa, overweight and obesity prevalence among adults ranges from 13.6% to 31%, while among children and adolescents, it ranges from 5% to 16.5% (16, 21). In Ethiopia, the prevalence of overweight and obesity among adults was reported at 20.4% and 5.4%, respectively (22).
Among adults with visual impairments, the prevalence of excessive body weight varies significantly by country, 22.2% in Korea (23), 36% in the United States (24), and 38% in India (25). However, no studies have investigated the prevalence of excessive body weight among visually impaired adults in Ethiopia.
Excessive body weight significantly affects individuals with visual impairments and their families (26). These conditions can reduce the quality of life (QOL) (27), and contribute to physical inactivity, resulting in low socioeconomic status (28). They also increase the need for self-care assistance, adversely affecting mental health, social functioning, employment, and educational opportunities (27, 29).
Evidence indicates that excessive body weight is associated with various factors including family history (30), age (31), sex (32), income (33), educational attainment (34), dietary type (35), length of sleep in a day (36), cigarette smoking (37), and alcohol consumption (38), khat chewing (39).
Despite these associations, no studies have explored the prevalence and risk factors of excessive body weight among visually impaired adults in Northwest Ethiopia. This study aims to fill that gap by investigating the prevalence and determinants of excessive body weight among visually impaired individuals attending follow-up visits in hospitals in Northwest Ethiopia. The findings emphasize the need to address excessive body weight within this population and implement targeted preventative strategies.
Methods and materials
Study setting and period
This study was conducted in hospitals located in Northwest Ethiopia from February 1 to March 30, 2024. These hospitals provide comprehensive care and support services to a population exceeding 25 million, including approximately 5,000 visually impaired patients who receive follow-ups and comprehensive healthcare services (unpublished data).
Study design and population
An institutional-based cross-sectional study was conducted among visually impaired patients attending hospitals in Northwest Ethiopia. The source population comprised all visually impaired patients on follow-up in the selected hospitals, while the study population included visually impaired patients on follow-up during the study period at randomly selected hospitals.
Inclusion and exclusion criteria
Inclusion criteria
● Adults aged 18 years and above with documented visual impairment.
● Residents of Northwest Ethiopia for at least six months.
● Individuals who provided informed consent.
Exclusion criteria
● Patients with severe illnesses, pregnancy, or mobility disabilities.
● Individuals with chronic conditions such as hypothyroidism, Cushing’s syndrome, or other infections that could interfere with body weight.
● Patients with severe cognitive impairments, acute psychiatric conditions, or those on weight-altering psychiatric medications.
● Individuals with hearing impairments or those taking medications affecting body weight
Sample size determination
The sample size was determined using a single population proportion formula.
Assumption:
n = sample size, P = proportion of excessive body weight = 50% since the study on excessive body weight among visually impaired patients was not conducted in the study area, d = Margin of sampling error tolerated- 5% (0.05), α = Critical value at 95% confidence interval of certainty (1.96).
Sampling procedure
A combination of simple and systematic random sampling techniques was used to select participants. Three hospitals (Finote Selam General Hospital, Debre Markos Comprehensive and Specialized Hospital, and Mertulemariam Primary Hospital) were randomly selected using the lottery method. From the ophthalmic clinic records, a sampling frame of visually impaired patients was established. Systematic random sampling was applied, with every 2nd patient selected during data collection (sampling interval K=7, calculated by dividing the total number of visually impaired patients during the study period [2,500] by the sample size [384]). The starting point (patient number 2) was determined through the lottery method. A proportional number of participants were selected from each hospital to ensure representativeness.
Study variables
Dependent variable
● Excessive body weight (Yes/No).
Independent variables
● Sociodemographic factors: Age, gender, residence, income, employment, education, marital status.
● Health-related factors: Blood pressure, family history of diabetes, diabetes mellitus
● Behavioral factors: Khat chewing, smoking, alcohol consumption, sleep duration, dietary habits, level of visual impairment
Operational definitions
Excessive body weight: BMI ≥ 25 kg/m² (4)
Diabetes Mellitus: a random plasma glucose level of ≥200 mg/dL (40).
Visual impairment: Having presenting visual acuity less than 6/12 in the better eye (41).
Mild visual impairment: Having visual acuity worse than 6/12 but better than 6/18 in the better eye (41).
Moderate visual impairment: Presenting distance visual acuity (VA) worse than 6/18 but better than 6/60 in the better eye (42).
Severe visual impairment: Presenting distance VA worse than 6/60 but better than 3/60 in the better eye (42).
Blindness: Presenting VA worse than 3/60 (43).
Current smoker: An adult who has smoked 100 cigarettes in his or her lifetime and who currently smokes cigarettes (44).
Ever alcohol user: Use of alcohol, at least once in an individual’s lifetime (45).
Current alcohol user: A person who consumed alcohol at least once within the last 30 days (45).
Duration of sleep: a short length of sleep of ≤5 hours and long sleep of ≥9 hours (46).
Data collection procedure and tools
Data collection occurred from February 1 to March 30, 2024, using a structured, interviewer-administered questionnaire developed from various validated sources (47, 48). The questionnaire collected data on medical assessments, substance use, and sociodemographic characteristics, while blood pressure and body mass index (BMI) measurements were taken for patients with visual impairment. Two BSc clinical nurses were recruited at each hospital to collect and document data.
Examinations and measurements
Anthropometric and blood pressure measurements
Weight and Height: Participants’ weight was measured using a standard balance scale, and height was recorded with a stadiometer. BMI was calculated by dividing weight (kg) by height squared (m²). Blood Pressure: Blood pressure was measured using a calibrated sphygmomanometer, ensuring standard protocol adherence.
Data analysis procedure
The collected data were checked for completeness and entered Epi data version 4.6. Then it was exported into SPSS version 26 for analysis. The crude and adjusted odds ratios were used to measure the association between study variables, and 95% confidence intervals were calculated. Descriptive measures such as median, interquartile range, and frequencies were calculated. Multicollinearity among selected independent variables was checked, and the variance inflation factor was found to be acceptable (less than 2) and model fitness was checked by the Hosmer and Lemeshow test at p-value >0.05 (p=0.965). Both bivariable and multivariable binary logistic regression models were used to identify associated factors of excessive body weight. Those variables having a p-value of <0.25 in the bivariable binary logistic regression analysis were selected for multivariable binary logistic regression. Those variables with a p-value of ≤ 0.05 in multivariable binary logistic regression were declared as having a statistically significant association with excessive body weight. Results were organized and presented by using frequency tables, graphs, and charts.
Data quality management
To ensure the data quality, high prominence was given in designing the data collection instrument. The questionnaire was pre-tested in a setup having similar socio-cultural characteristics with the 20 study participants at Bichena primary hospitals before the actual study begins. It helps to check its wording and sort out language barriers and contextual variations on the structured questionnaire. Training for both data collectors and supervisors regarding the study objectives, ethical considerations, data collection tools, interview techniques, measurement techniques, and strategies to ensure data quality and consistency was given for one day. Throughout the data collection, data collectors were supervised.
Results
Socio-demographic, clinical, substance use, and behavioral characteristics of study participants
The study involved 384 visually impaired patients, achieving a 100% response rate. Participants ranged in age from 18 to 90 years, with a median age of 59 years (± 17) and an interquartile range (IQR) of 49–69 years. Among the participants, 225 (58.6%) were male, 243 (63.3%) were married, 203 (52.9%) resided in rural areas, and 289 (75.3%) were illiterate (Table 1).

Table 1. Sociodemographic characteristics of visually impaired adult patients in selected hospitals of northwest Ethiopia, 2024 (n=384).
Of the participants, 244 (63.5%) had experienced visual impairment for less than five years. About half of the respondents (51.8%) reported sleeping between 5 and 8 hours per night. The majority, 232 (60.4%), were non-vegetarians. Additionally, 331 participants (86.2%) had consumed alcohol at some point in their lives, but only 47 (12.2%) reported drinking alcohol within the past 30 days, primarily traditional beverages such as tela or tej. Among the respondents, 63% had elevated systolic blood pressure, while 48.2% showed elevated diastolic blood pressure. Of the visually impaired respondents, 17.7% had diabetes mellitus (Table 2).
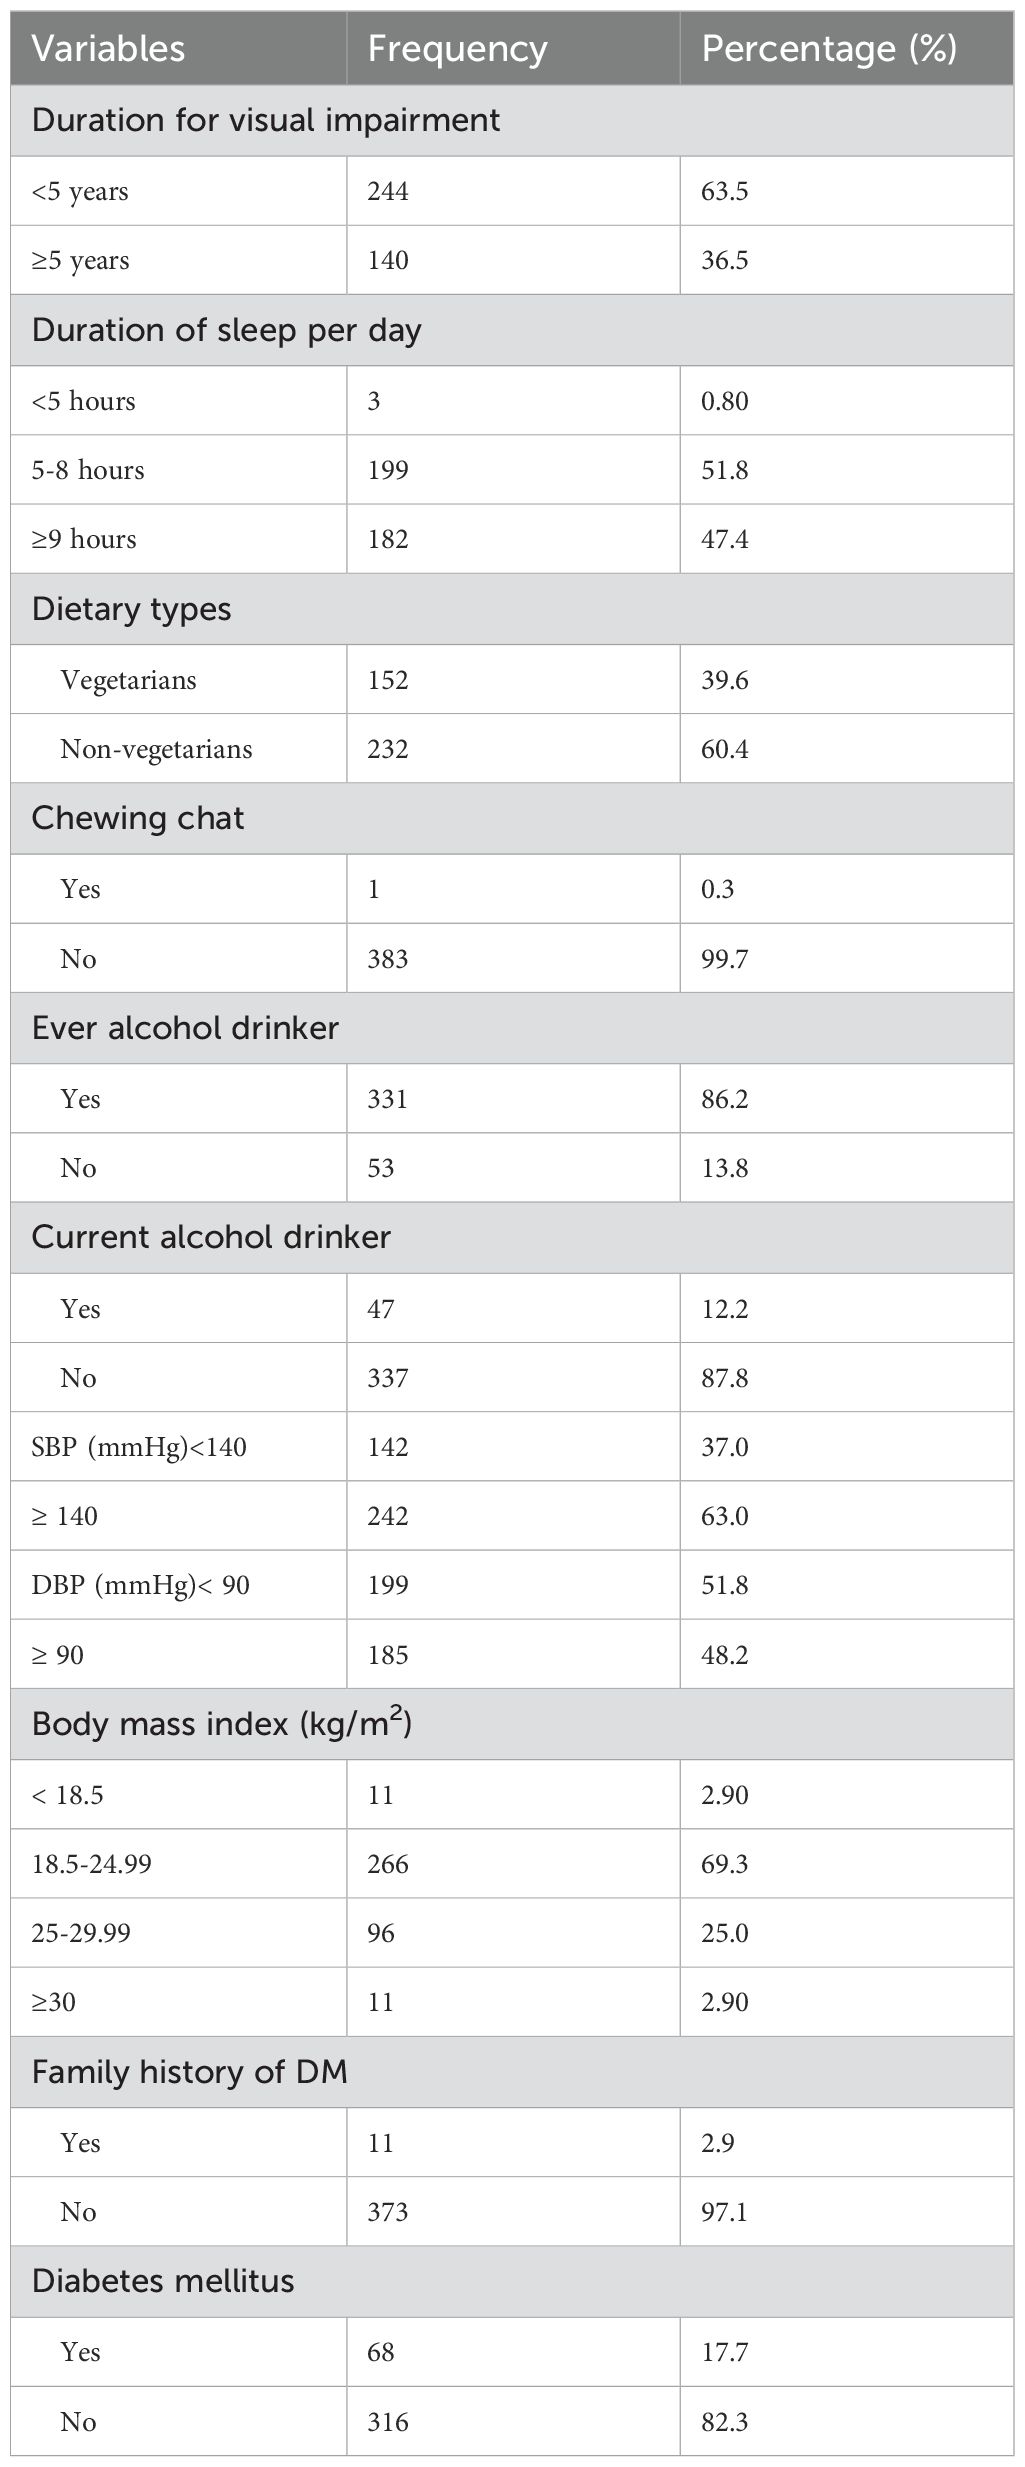
Table 2. Clinical and behavioral characteristics of visually impaired adult patients in selected hospitals of northwest Ethiopia, 2024 (n=384).
Prevalence of excessive body weight
The overall prevalence of excessive body weight among visually impaired patients was 27.9% (95% CI: 23.2- 32.8) (Figure 1). Among the respondents, 13.28% with mild visual impairment, 8.6% with moderate visual impairment, and 5.99% with severe visual impairment were found to have excessive body weight (Table 3).
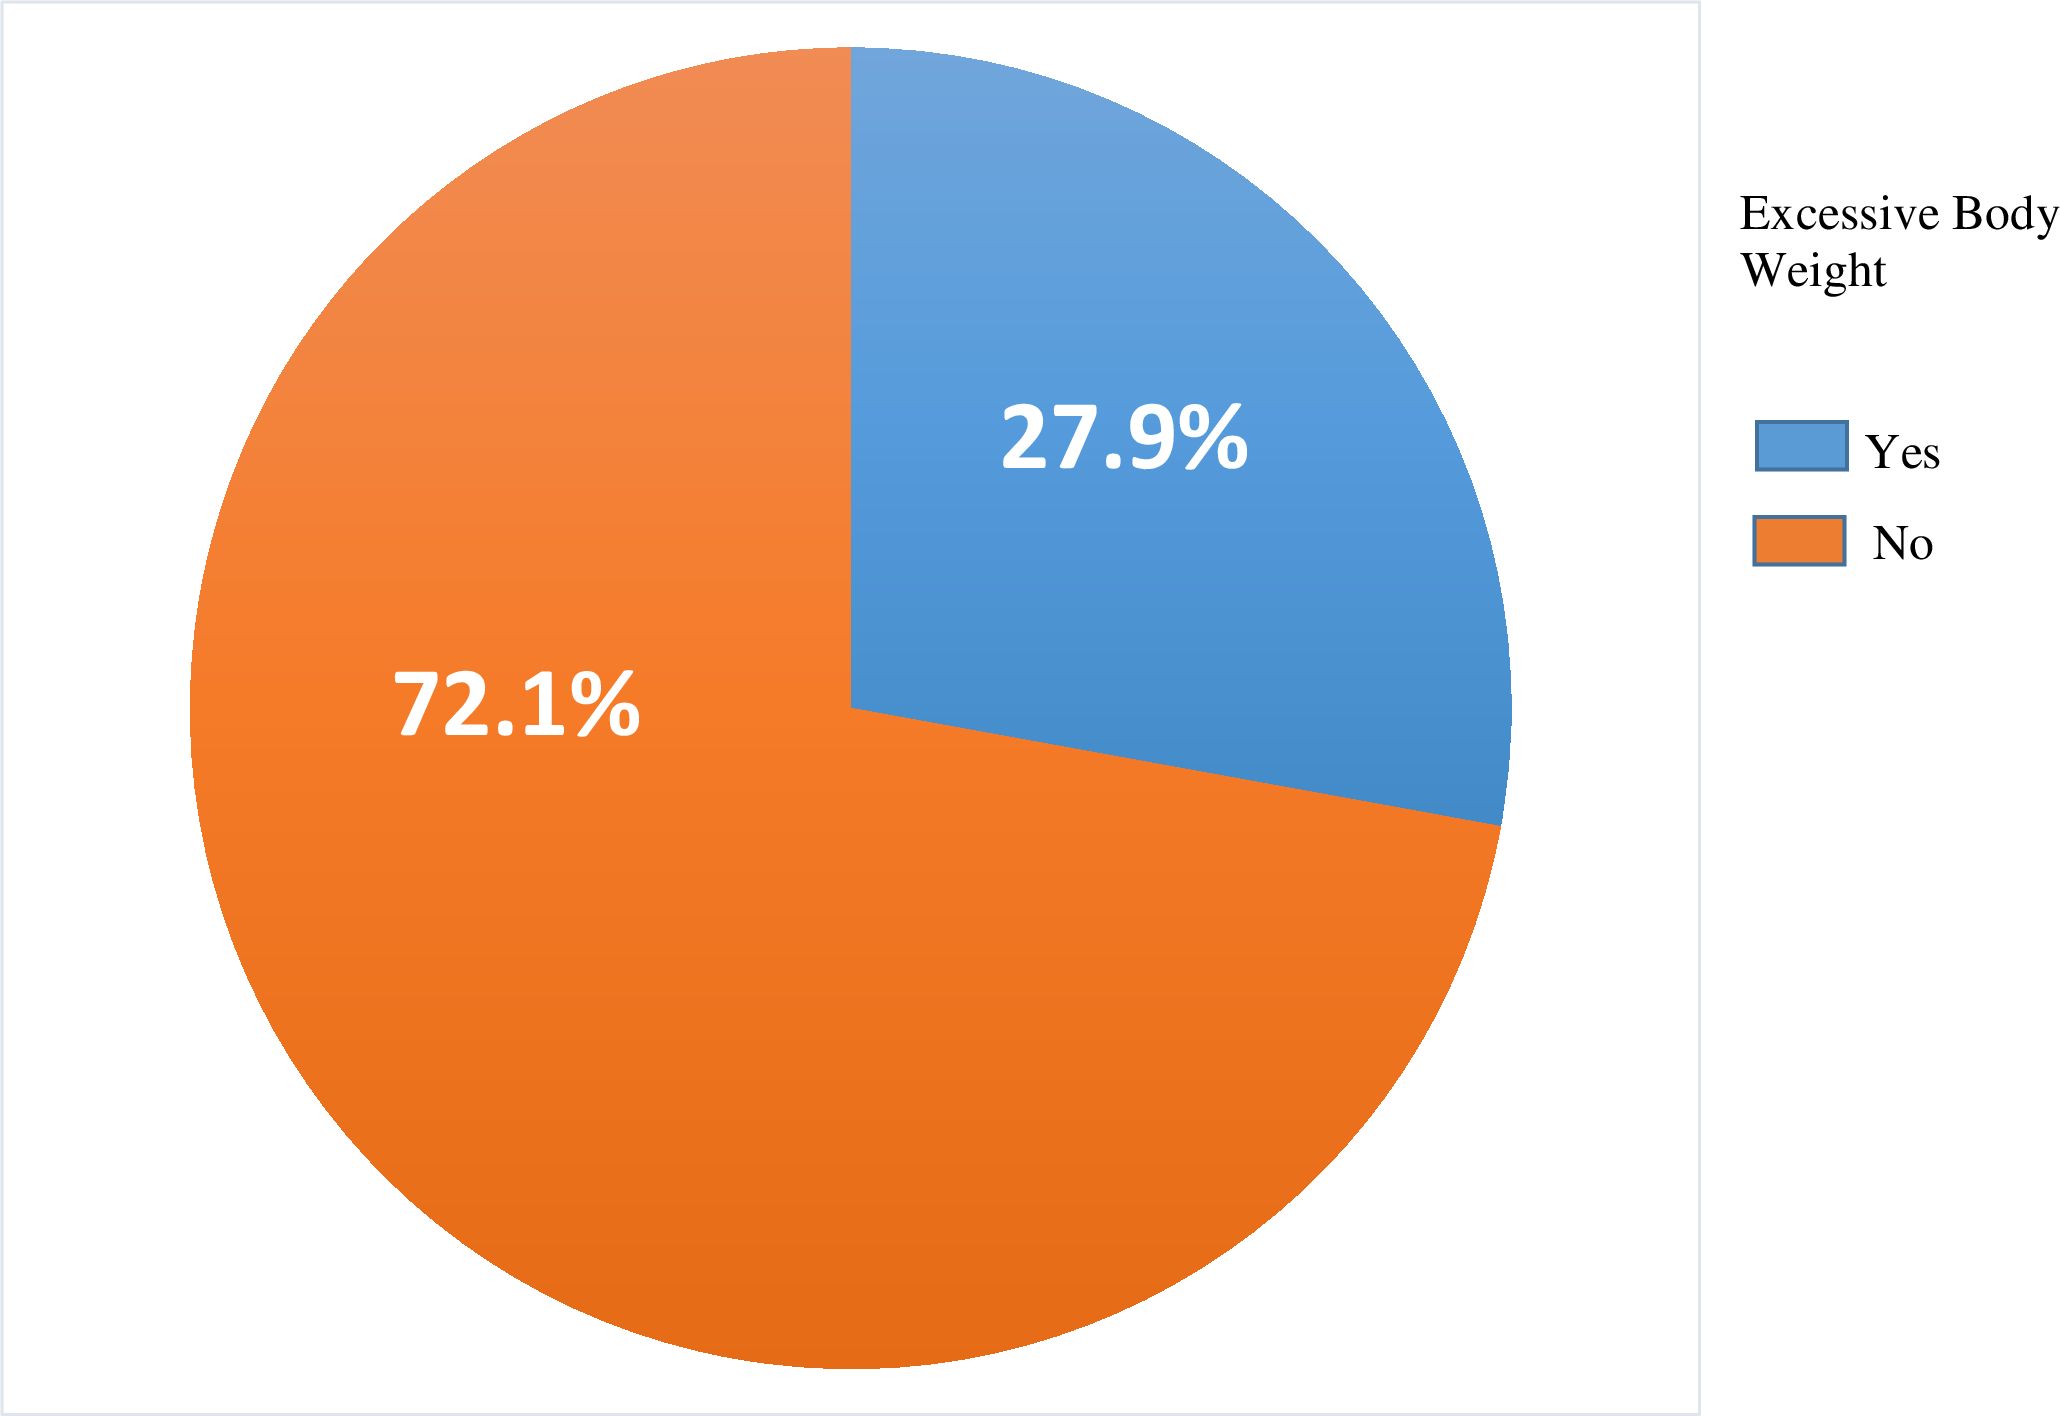
Figure 1. Prevalence of excessive body weight among visually impaired adult patients in selected hospitals of northwest Ethiopia, 2024 (n=384).
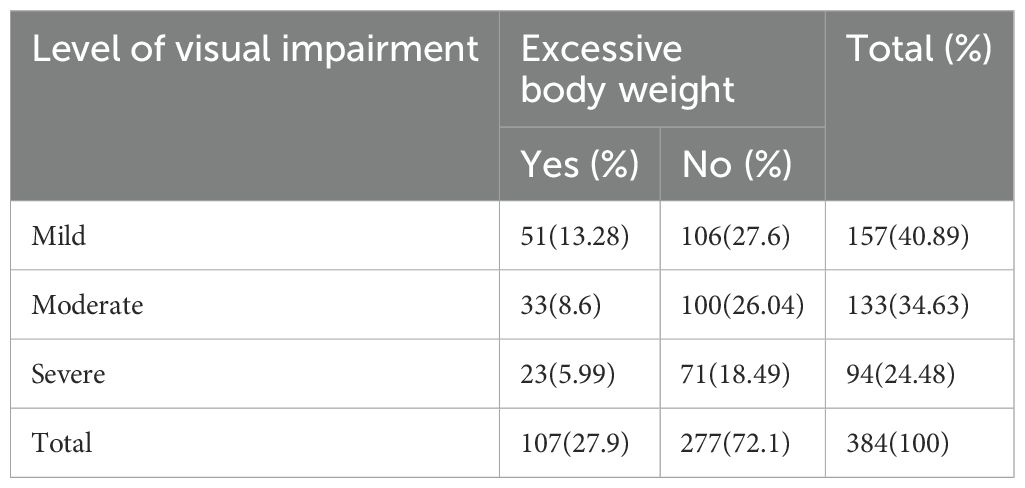
Table 3. Distribution of excessive body weight among visually impaired adult patients by level of visual impairment in selected hospitals of northwest Ethiopia, 2024 (n=384).
Determinant factors of diabetes mellitus among hypertensive patients
In the bivariate analysis, factors such as age, marital status, family size, residence, education level, occupation, duration of visual impairment, dietary habits, current alcohol consumption, and isolated diastolic blood pressure were associated with excessive body weight. However, the multivariate analysis, which adjusts for potential confounders, revealed that age (65 years or older), residence, and the duration of visual impairment were significantly associated with excessive body weight.
Respondents aged 65 years or older were significantly more likely to have excessive body weight, with 5.43 times higher odds compared to those under 40 years (AOR = 5.43, 95% CI: 1.22–12.1). Similarly, individuals residing in urban areas had 4.84 times higher odds of excessive body weight compared to those living in rural areas (AOR = 4.84, 95% CI: 2.95–7.95). Furthermore, individuals with visual impairment lasting five or more years were 3.33 times more likely to have excessive body weight compared to those with a shorter duration of impairment (AOR = 3.33, 95% CI: 1.88–5.89) (Table 4).
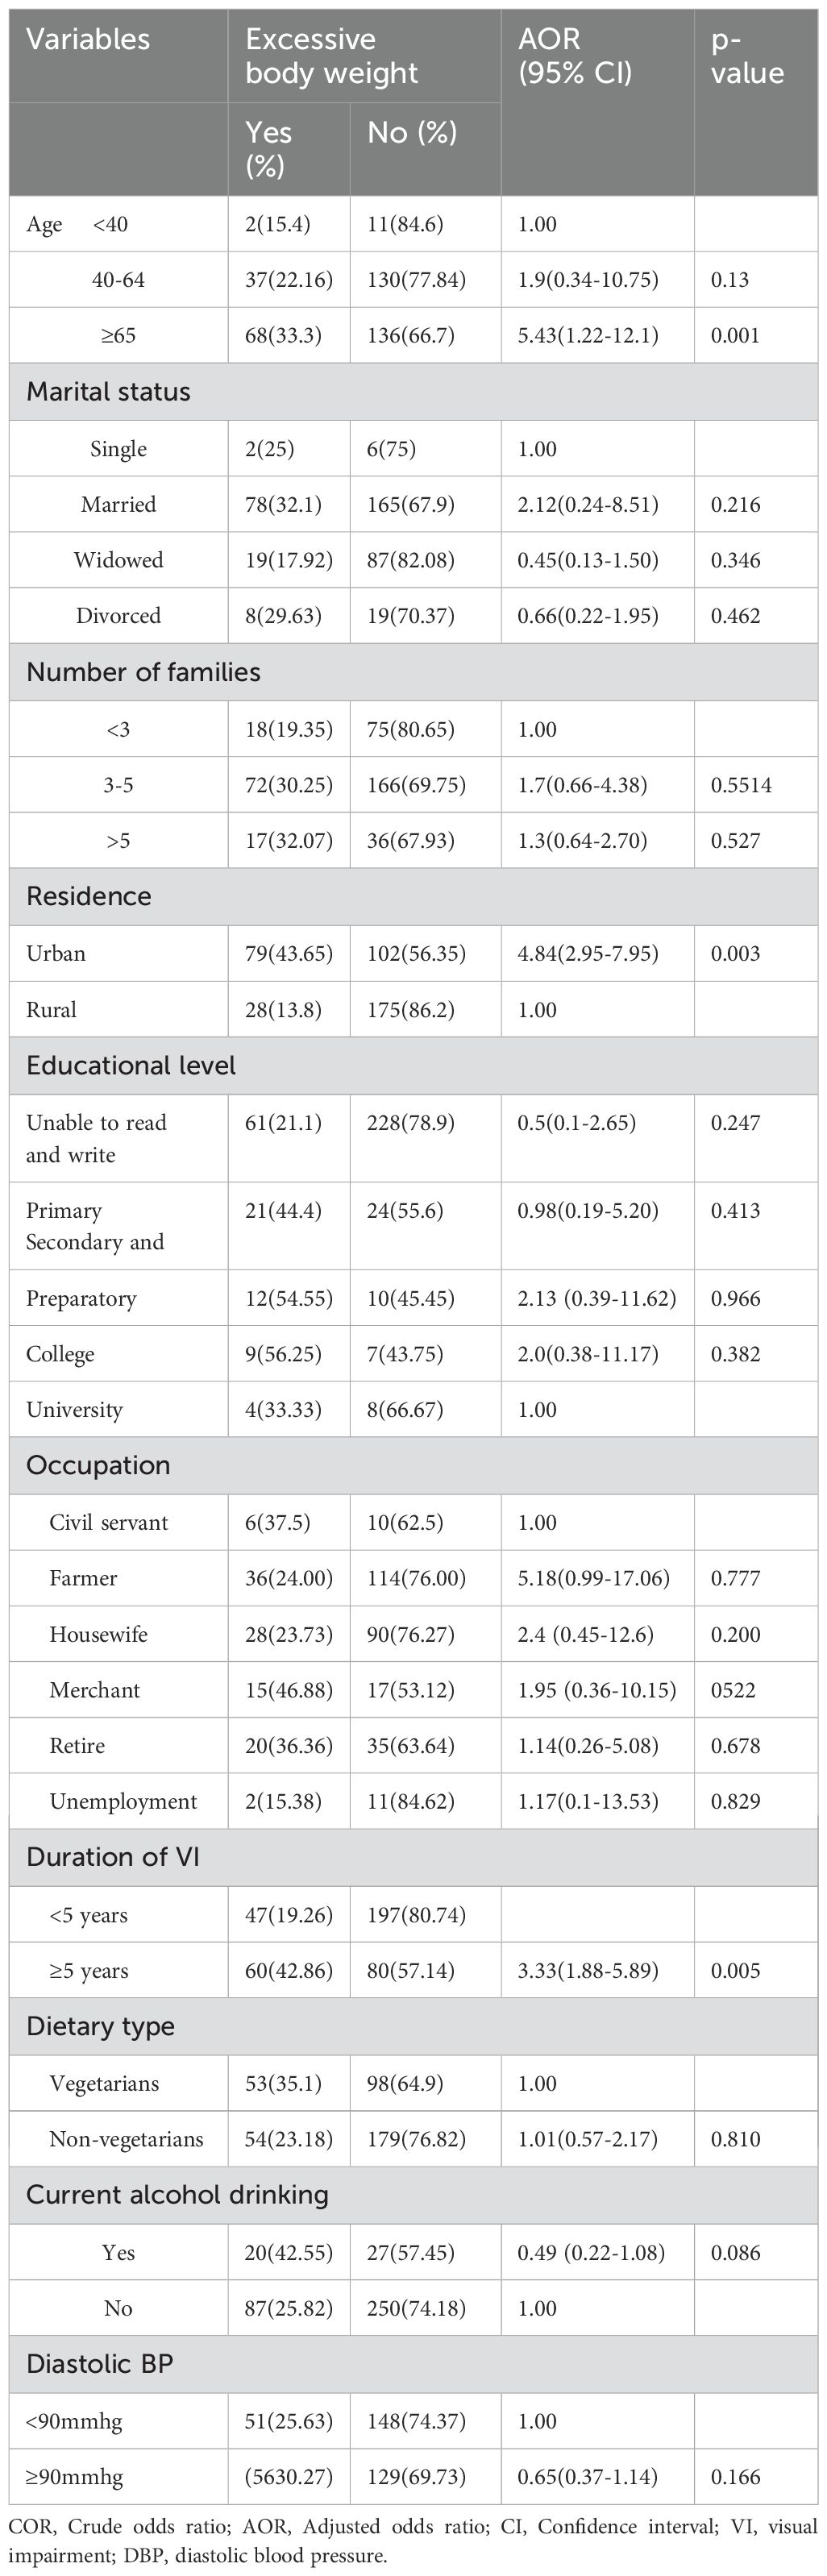
Table 4. Bivariable and multivariable binary logistic regression analysis of factors associated with excessive body weight among visually impaired adult patients in selected hospitals of northwest Ethiopia, 2024 (n=384).
Discussion
This study aimed to assess the prevalence of excessive body weight and its associated factors among visually impaired patients in hospitals in northwest Ethiopia in 2024. The prevalence of excessive body weight among these patients was found to be 27.9%, which is higher than the 22.2% reported in a Korean population-based study (23). This discrepancy might be due to this study having a smaller sample size compared to the Korean study, which included 8,435 participants. Additionally, the higher illiteracy rate among participants in this study likely contributed to lower levels of physical activity, potentially leading to an overestimation of excessive body weight prevalence. Furthermore, differences in study design may have influenced the results. While the Korean study employed a population-based prospective cohort design, this research used an institution-based cross-sectional approach. The hospital-based nature of this study might also have inflated the prevalence estimate compared to the broader, community-based Korean survey.
In contrast, the prevalence of excessive body weight in this study was lower than findings from studies conducted in the United States (36%) (24) and India (38%) (25). This discrepancy may stem from variations in participant age ranges. While both the U.S. and Indian studies focused on individuals aged 60 years and older, this study included participants aged 18 and above. Aging is often linked to decreased physical activity, resulting in reduced total energy expenditure and disturbances in energy balance, both of which can contribute to weight gain (49). Lifestyle differences between study populations may explain the observed variation. In the U.S. study, most participants were current alcohol drinkers and smokers, while in this study; the majority did not consume alcohol or smoke. Alcohol consumption, particularly binge drinking, significantly contributes to excessive body weight due to its high caloric content (7 calories per gram) (38). It reduces fat oxidation, promotes fat storage (especially abdominal), disrupts appetite-regulating hormones (leptin and ghrelin), impairs sleep, and lowers physical activity due to fatigue and hangovers (50, 51, 52–54). Smoking contributes to weight gain through metabolic dysregulation, including insulin resistance and altered fat metabolism, especially abdominal fat accumulation (55, 56). It disrupts appetite regulation via dopamine changes, increases cravings for high-calorie foods, and can lead to weight gain during cessation due to increased hunger and slower metabolism (57–61). Smoking is further linked to leptin resistance and chronic inflammation, exacerbating fat accumulation (62).
Our results revealed that 13.28%, 8.6%, and 5.99% of those with mild, moderate, and severe visual impairment respectively had excessive body weight. This discrepancy might be due to persons with severe visual impairment experiencing mobility difficulties that limit access to high-calorie diets, while reduced physical activity in mild cases may encourage weight gain (63). Additionally, individuals with advanced visual loss may adopt healthier diets due to caregiver support, while socioeconomic constraints might further reduce caloric intake (64).
Older adults (aged 65 and above) are significantly more likely to have excessive body weight, as supported by studies conducted in Ethiopia (65), Tanzania (66), Malaysia (67), and Norway (68). This association may be attributed to the close link between aging, vision impairment, and excessive body weight, which creates a cycle that negatively impacts health and quality of life in older individuals (69). Aging contributes to weight gain through a combination of metabolic, hormonal, and lifestyle changes (70). Sarcopenia, the age-related loss of muscle mass, lowers the basal metabolic rate, reducing calorie expenditure and increasing fat storage (71). Hormonal changes, such as reduced levels of growth hormone, testosterone, and estrogen, further promote fat accumulation and increase insulin resistance, exacerbating weight gain (72). Additionally, physical activity often declines with age due to mobility challenges, leading to fewer calories burned (73). Meanwhile, many older adults maintain their existing eating habits, often preferring high-calorie, low-nutrient foods, which further elevates the risk of weight gain (74).
Living in urban areas was significantly linked to excessive body weight, as observed in studies from Switzerland (75), Algeria (76), Bangladesh (77), and Ethiopia (78). Living in cities may contribute to excessive body weight due to several reasons (75). Urban dwellers often lead sedentary lifestyles, with jobs that require long periods of sitting and the use of cars or public transportation, which limits opportunities for physical activity (79). additionally, urban areas tend to have fewer safe spaces for exercise (80),, and the easy availability of unhealthy, high-calorie foods from fast food outlets and convenience stores encourages poor dietary habits (81). Collectively, these factors increase the likelihood of weight gain and make weight loss more challenging, contributing to higher rates of excessive body weight among urban populations.
A duration of visual impairment lasting five years or more is associated with excessive body weight. This could be attributed to the long-term effects of visual impairment, particularly when it persists for over five years, leading to an increase in body weight. Reduced physical activity often results from mobility issues, safety concerns, and reliance on others for assistance, which limit opportunities for exercise (82). This, in turn, fosters a more sedentary lifestyle, with individuals spending more time indoors and engaging in less physical movement. Emotional eating may also arise from stress, anxiety, or sadness linked to visual impairment, and difficulties in assessing food quantities or preparing meals can result in poor nutritional choices, typically favoring convenient or calorie-dense foods (83). These changes in physical activity and diet, combined with reduced overall energy expenditure, contribute to the risk of weight gain. Furthermore, limited access to healthcare resources and exercise programs tailored for individuals with visual impairments can make it challenging to effectively manage weight (84).
In this study, many of the questions in the data collection instrument relied on participants’ recall, which may introduce recall bias. Additionally, as a cross-sectional study, it does not allow for the establishment of a cause-and-effect relationship. Given that this study was conducted in a hospital setting, its findings on the prevalence of excessive body weight cannot be generalized to the broader community.
Conclusions and recommendations
This study found a 27.9% prevalence of excessive body weight among visually impaired patients in northwest Ethiopia. Factors such as older age, urban residency, and long-term visual impairment were significantly associated with higher rates of excessive body weight. To manage excessive body weight, promoting physical activity, nutritional education, specialized healthcare, weight monitoring, lifestyle counseling, and emotional support are crucial. Additionally, conducting a prospective cohort study would be valuable in establishing a cause-and-effect relationship. Future studies should also ensure the inclusion of individuals with mobility disabilities. Furthermore, the causes of visual impairment and obesity-related complications in patients with visual impairment such as insulin resistance, T2DM, lipid disorders, and hyperuricemia, should be included in future studies.
Data availability statement
The datasets presented in this study can be found in online repositories. The names of the repository/repositories and accession number(s) can be found in the article/supplementary material.
Ethics statement
The studies involving humans were approved by Institutional Review Committee (IRC) of the Amhara Institution of Public Health (APHI) (ref. no. APHI 3/1082). The studies were conducted in accordance with the local legislation and institutional requirements. Written informed consent for participation was not required from the participants or the participants’ legal guardians/next of kin in accordance with the national legislation and institutional requirements.
Author contributions
BA: Conceptualization, Data curation, Formal Analysis, Investigation, Methodology, Writing – original draft, Writing – review & editing. BY: Conceptualization, Formal Analysis, Methodology, Validation, Writing – original draft, Writing – review & editing. EO: Conceptualization, Formal Analysis, Software, Supervision, Writing – original draft, Writing – review & editing. DS: Conceptualization, Data curation, Formal Analysis, Writing – original draft, Writing – review & editing. GB: Investigation, Software, Supervision, Validation, Visualization, Writing – original draft, Writing – review & editing. ZT: Formal Analysis, Investigation, Methodology, Project administration, Writing – original draft, Writing – review & editing. ME: Investigation, Software, Supervision, Writing – original draft, Writing – review & editing. AA: Formal Analysis, Methodology, Validation, Visualization, Writing – original draft, Writing – review & editing. EM: Conceptualization, Data curation, Formal Analysis, Writing – original draft, Writing – review & editing. MJ: Conceptualization, Data curation, Investigation, Methodology, Supervision, Writing – original draft, Writing – review & editing. TB: Conceptualization, Data curation, Software, Supervision, Validation, Visualization, Writing – review & editing.
Funding
The author(s) declare that no financial support was received for the research and/or publication of this article.
Acknowledgments
We would like to acknowledge the study participants, data collectors, and supervisors for their willingness, valuable support, and assistance during this work.
Conflict of interest
The authors declare that the research was conducted in the absence of any commercial or financial relationships that could be construed as a potential conflict of interest.
Generative AI statement
The author(s) declare that no Generative AI was used in the creation of this manuscript.
Publisher’s note
All claims expressed in this article are solely those of the authors and do not necessarily represent those of their affiliated organizations, or those of the publisher, the editors and the reviewers. Any product that may be evaluated in this article, or claim that may be made by its manufacturer, is not guaranteed or endorsed by the publisher.
Abbreviations
AOR, Adjusted Odds Ratio; BMI, Body Mass Index; COR, Crude Odds Ratio; DBP, Diastolic Blood Pressure; Kg, Kilogram; Kg/m2, Kilogram per meter square; SBP, Systolic Blood Pressure; WHO, World Health Organization.
References
1. Sweeting J, Merom D, Astuti PAS, Antoun M, Edwards K, Ding D. Physical activity interventions for visually impaired adults: a systematic review and meta-analysis. BMJ Open. (2020) 10:e034036. doi: 10.1136/bmjopen-2019-034036
2. Morley JE, Argiles JM, Evans WJ, Bhasin S, Cella D, Deutz NE, et al. Nutritional recommendations for the management of sarcopenia. J Am Med Directors Assoc. (2010) 11:391–6. doi: 10.1016/j.jamda.2010.04.014
3. Darku ED, Diyaolu CO. The role of stress, sleep, and mental health in obesity and weight gain. Int Res J Modern Eng Technol Sci. (2024) 6. doi: 10.56726/IRJMETS62817
4. Scherübl H. Excess body weight and gastrointestinal cancer risk. Visceral Med. (2021) 37:261–6. doi: 10.1159/000515444
5. Rimmer JH, Yamaki K, Davis BM, Wang E, Vogel LC. Obesity and overweight prevalence among adolescents with disabilities. Prev Chronic Dis. (2011) 8:A41.
6. Chen H, Sun X, Pei L, Wang T. Body mass index influences age-related cataracts: an updated meta-analysis and systemic review. Arquivos Brasileiros Oftalmologia. (2024) 87. doi: 10.5935/0004-2749.2021-0382
7. Okoro UN, Johnson KA. Prevalence rate of obesity and overweight among pupils with blindness in special education schools in Akwa Ibom State Nigeria. J Res Humanit Soc Sci. (2021) 9.
8. Wrzesińska M, Urzędowicz B, Nawarycz T, Motylewski S, Pawlicki L. The prevalence of abdominal obesity among pupils with visual impairment in Poland. Disability Health J. (2017) 10:559–64. doi: 10.1016/j.dhjo.2017.02.004
9. Friedman N, Fanning EL. Overweight and obesity: an overview of prevalence, clinical impact, and economic impact. Dis Manage. (2004) 7:S–1-S-6. doi: 10.1089/1093507042317152
10. Miyata K, Yoshikawa T, Harano A, Ueda T, Ogata N. Effects of visual impairment on mobility functions in elderly: Results of Fujiwara-kyo Eye Study. PLoS One. (2021) 16:e0244997. doi: 10.1371/journal.pone.0244997
11. Al-Rashed F, Sindhu S, Al Madhoun A, Alghaith A, Azim R, Al-Mulla F, et al. Short sleep duration and its association with obesity and other metabolic risk factors in Kuwaiti Urban adults. Nat Sci Sleep. (2021) 13:1225–41. doi: 10.2147/NSS.S311415
12. Sanyal D, Raychaudhuri M. Hypothyroidism and obesity: An intriguing link. Indian J Endocrinol Metab. (2016) 20:554–7. doi: 10.4103/2230-8210.183454
13. Bista B, Beck N. Cushing syndrome. Indian J Pediatrics. (2014) 81:158–64. doi: 10.1007/s12098-013-1203-8
14. Huang Z, Huang L, Waters MJ, Chen C. Insulin and growth hormone balance: implications for obesity. Trends Endocrinol Metab. (2020) 31:642–54. doi: 10.1016/j.tem.2020.04.005
15. Patten SB, Williams JVA, Lavorato DH, Brown L, McLaren L, Eliasziw M. Major depression, antidepressant medication and the risk of obesity. Psychother Psychosomatics. (2009) 78:182–6. doi: 10.1159/000209349
17. Chatterjee A, Gerdes MW, Martinez SG. Identification of risk factors associated with obesity and overweight—A machine learning overview. Sensors. (2020) 20:2734. doi: 10.3390/s20092734
19. Fruh SM. Obesity: Risk factors, complications, and strategies for sustainable long-term weight management. J Am Assoc Nurse Practitioners. (2017) 29:S3–s14. doi: 10.1002/2327-6924.12510
20. Djalalinia S, Qorbani M, Peykari N, Kelishadi R. Health impacts of obesity. Pakistan J Med Sci. (2015) 31:239–42. doi: 10.12669/pjms.311.7033
21. Azeez TA. Obesity in Africa: The challenges of a rising epidemic amid dwindling resources. Obes Med. (2022) 31:100397. doi: 10.1016/j.obmed.2022.100397
22. Kassie AM, Abate BB, Kassaw MW. Prevalence of overweight/obesity among the adult population in Ethiopia: a systematic review and meta-analysis. BMJ Open. (2020) 10:e039200. doi: 10.1136/bmjopen-2020-039200
23. Hwang IC, Bae JH, Kim JM, Lee JM, Nguyen QD. Adult body height and age-related macular degeneration in healthy individuals: A nationwide population-based survey from Korea. PLoS One. (2020) 15:e0232593. doi: 10.1371/journal.pone.0232593
24. Chen J, Li H, Zhou B, Li X, Zhu Y, Yao Y. Interaction between visual impairment and subjective cognitive complaints on physical activity impairment in U.S. older adults: NHANES 2005–2008. BMC Geriatrics. (2024) 24:167. doi: 10.1186/s12877-024-04739-2
25. Jaisankar D, Swaminathan G, Roy R, Kulothungan V, Sharma T, Raman R. Association of obesity and age-related macular degeneration in Indian population. Indian J ophthalmology. (2018) 66:976–83. doi: 10.4103/ijo.IJO_1265_17
26. Gray LA, Hernandez Alava M, Kelly MP, Campbell MJ. Family lifestyle dynamics and childhood obesity: evidence from the millennium cohort study. BMC Public Health. (2018) 18:500. doi: 10.1186/s12889-018-5398-5
27. Stephenson J, Smith CM, Kearns B, Haywood A, Bissell P. The association between obesity and quality of life: a retrospective analysis of a large-scale population-based cohort study. BMC Public Health. (2021) 21:1990. doi: 10.1186/s12889-021-12009-8
28. Sarwer DB, Grilo CM. Obesity: Psychosocial and behavioural aspects of a modern epidemic: Introduction to the special issue. Am Psychol. (2020) 75:135–8. doi: 10.1037/amp0000610
29. Fabricatore AN, Wadden TA. Psychological aspects of obesity. Clin Dermatol. (2004) 22:332–7. doi: 10.1016/j.clindermatol.2004.01.006
30. Kjøllesdal MKR, Carslake D, Smith GD, Shaikh F, Næss Ø. The role of family factors in the association between early adulthood BMI and risk of cardiovascular disease. An intergenerational study of BMI in early adulthood and cardiovascular mortality in parents, aunts and uncles. Int J Obes. (2022) 46:228–34. doi: 10.1038/s41366-021-00987-z
31. Palmer AK, Jensen MD. Metabolic changes in ageing humans: current evidence and therapeutic strategies. J Clin Invest. (2022) 132. doi: 10.1172/JCI158451
32. Ethun K. Chapter 9 - sex and gender differences in body composition, lipid metabolism, and glucose regulation. In: Neigh GN, Mitzelfelt MM, editors. Sex Differences in Physiology. Academic Press, Boston (2016). p. 145–65.
33. Kim TJ, von dem Knesebeck O. Income and obesity: what is the direction of the relationship? A systematic review and meta-analysis. BMJ Open. (2018) 8:e019862. doi: 10.1136/bmjopen-2017-019862
34. Cohen AK, Rai M, Rehkopf DH, Abrams B. Educational attainment and obesity: a systematic review. Obes Rev. (2013) 14:989–1005. doi: 10.1111/obr.2013.14.issue-12
35. Olariike Oyindasola K. Diet and obesity. In: Akikazu T, Hubertus H, editors. Psychology and Pathophysiological Outcomes of Eating. IntechOpen, Rijeka (2021). p. Ch. 13.
36. Grandner MA, Schopfer EA, Sands-Lincoln M, Jackson N, Malhotra A. Relationship between sleep duration and body mass index depends on age. Obes (Silver Spring). (2015) 23:2491–8. doi: 10.1002/oby.v23.12
37. Dare S, Mackay DF, Pell JP. Relationship between smoking and obesity: a cross-sectional study of 499,504 middle-aged adults in the UK general population. PLoS One. (2015) 10:e0123579. doi: 10.1371/journal.pone.0123579
38. Traversy G, Chaput JP. Alcohol consumption and obesity: an update. Curr Obes Rep. (2015) 4:122–30. doi: 10.1007/s13679-014-0129-4
39. Girma T, Mossie A, Getu Y. Association between body composition and khat chewing in Ethiopian adults. BMC Res Notes. (2015) 8:680. doi: 10.1186/s13104-015-1601-2
40. Pippitt K, Li M, Gurgle HE. Diabetes mellitus: screening and diagnosis. Am Family physician. (2016) 93:103–9.
41. Ashenef B, Diress M, Yeshaw Y, Dagnew B, Gela YY, Akalu Y, et al. Visual impairment and its associated factors among hypertensive patients in Amhara Region referral hospitals, Ethiopia. Clin Ophthalmology. (2023) 17:3149–61. doi: 10.2147/OPTH.S408171
42. Abebe H, Wagnew F, Zeleke H, Tefera B, Tesfa S, Fetene T. Magnitude of visual impairment and associated factors among patients attending ophthalmic clinics of Debre Markos referral hospital, north West Ethiopia. BMC ophthalmology. (2021) 21:1–10. doi: 10.1186/s12886-021-01863-0
43. Taylor HR, Livingston PM, Stanislavsky YL, McCarty CA. Visual impairment in Australia: distance visual acuity, near vision, and visual field findings of the Melbourne Visual Impairment Project. Am J ophthalmology. (1997) 123:328–37. doi: 10.1016/S0002-9394(14)70128-X
44. CDC. NCHS, National Health Interview Survey, Special Topics, Adult Tobacco Use Information (2019). Available online at: https://wwwcdcgov/nchs/nhis/tobacco/tobacco_glossaryhtm (Accessed August 12, 2024).
45. CDC. NCHS NHIS, Special Topics, Adult Alcohol Use (2020). Available online at: https://archive.cdc.gov/www_cdc_gov/nchs/nhis/alcohol/alcohol_glossary.htm (Accessed August 12, 2024).
46. Peltzer K, Phaswana-Mafuya N. Association between visual impairment and low vision and sleep duration and quality among older adults in South Africa. Int J Environ Res Public Health. (2017) 14. doi: 10.3390/ijerph14070811
47. Kushner RF, Choi SW, Burns JL. Development of a six-factor questionnaire for use in weight management counselling. Patient Educ counselling. (2016) 99:2018–25. doi: 10.1016/j.pec.2016.06.022
48. Beechy L, Galpern J, Petrone A, Das SK. Assessment tools in obesity - psychological measures, diet, activity, and body composition. Physiol behaviour. (2012) 107:154–71. doi: 10.1016/j.physbeh.2012.04.013
49. Jura M, Kozak LP. Obesity and related consequences to ageing. Age (Dordrecht Netherlands). (2016) 38:23. doi: 10.1007/s11357-016-9884-3
50. Zakhari S. Overview: how is alcohol metabolized by the body? Alcohol Res health: J Natl Institute Alcohol Abuse Alcoholism. (2006) 29:245–54.
51. Steiner JL, Lang CH. Alcohol, adipose tissue and lipid dysregulation. Biomolecules. (2017) 7. doi: 10.3390/biom7010016
52. Calissendorff J, Gustafsson T, Holst JJ, Brismar K, Röjdmark S. Alcohol intake and its effect on some appetite-regulating hormones in man: influence of gastroprotection with sucralfate. Endocrine Res. (2012) 37:154–62. doi: 10.3109/07435800.2012.662662
53. He S, Hasler BP, Chakravorty S. Alcohol and sleep-related problems. Curr Opin Psychol. (2019) 30:117–22. doi: 10.1016/j.copsyc.2019.03.007
54. Lardier DT, Coakley KE, Holladay KR, Amorim FT, Zuhl MN. Exercise as a useful intervention to reduce alcohol consumption and improve physical fitness in individuals with alcohol use disorder: A systematic review and meta-analysis. Front Psychol. (2021) 12:675285. doi: 10.3389/fpsyg.2021.675285
55. Chiolero A, Faeh D, Paccaud F, Cornuz J. Consequences of smoking for body weight, body fat distribution, and insulin resistance. Am J Clin Nutr. (2008) 87:801–9. doi: 10.1093/ajcn/87.4.801
56. Artese A, Stamford BA, Moffatt RJ. Cigarette smoking: an accessory to the development of insulin resistance. Am J lifestyle Med. (2019) 13:602–5. doi: 10.1177/1559827617726516
57. Ashok AH, Mizuno Y, Howes OD. Tobacco smoking and dopaminergic function in humans: a meta-analysis of molecular imaging studies. Psychopharmacology. (2019) 236:1119–29. doi: 10.1007/s00213-019-05196-1
58. Baik JH. Dopaminergic control of the feeding circuit. Endocrinol Metab (Seoul Korea). (2021) 36:229–39. doi: 10.3803/EnM.2021.979
59. Wallace CW, Fordahl SC. Obesity and dietary fat influence dopamine neurotransmission: exploring the convergence of metabolic state, physiological stress, and inflammation on dopaminergic control of food intake. Nutr Res Rev. (2022) 35:236–51. doi: 10.1017/S0954422421000196
60. Volkow ND, Wang GJ, Baler RD. Reward, dopamine and the control of food intake: implications for obesity. Trends Cogn Sci. (2011) 15:37–46. doi: 10.1016/j.tics.2010.11.001
61. Bush T, Lovejoy JC, Deprey M, Carpenter KM. The effect of tobacco cessation on weight gain, obesity, and diabetes risk. Obes (Silver Spring Md). (2016) 24:1834–41. doi: 10.1002/oby.21582
62. Zhou Y, Rui L. Leptin signaling and leptin resistance. Front Med. (2013) 7:207–22. doi: 10.1007/s11684-013-0263-5
63. Jones N, Bartlett H. The impact of visual impairment on nutritional status: A systematic review. Br J Visual Impairment. (2018) 36:17–30. doi: 10.1177/0264619617730860
64. Jones N, Bartlett H, Cooke R. An analysis of the impact of visual impairment on activities of daily living and vision-related quality of life in a visually impaired adult population. Br J Visual Impairment. (2018) 37:026461961881407. doi: 10.1177/0264619618814071
65. Tegegne KD, Wagaw GB, Gebeyehu NA, Yirdaw LT, Shewangashaw NE, Mekonen NA, et al. Prevalence of central obesity and associated factors in Ethiopia: A systematic review and meta-analysis. Front endocrinology. (2022) 13:983180. doi: 10.3389/fendo.2022.983180
66. Mosha D, Paulo HA, Mwanyika-Sando M, Mboya IB, Madzorera I, Leyna GH, et al. Risk factors for overweight and obesity among women of reproductive age in Dar es Salaam, Tanzania. BMC Nutr. (2021) 7:37. doi: 10.1186/s40795-021-00445-z
67. Kyaw TM, Ismail Z, Selamat MI, Nawawi H. Obesity and its associated factors among older adults: MyHEBAT (Malaysian Health and Well-Being Assessment) study. Health Sci Rep. (2022) 5:e668. doi: 10.1002/hsr2.v5.4
68. Chatterjee A, Gerdes MW, Martinez SG. Identification of risk factors associated with obesity and overweight-A machine learning overview. Sensors (Basel Switzerland). (2020) 20. doi: 10.3390/s20092734
69. Swenor BK, Lee MJ, Varadaraj V, Whitson HE, Ramulu PY. Aging with vision loss: A framework for assessing the impact of visual impairment on older adults. Gerontologist. (2020) 60:989–95. doi: 10.1093/geront/gnz117
70. Pataky MW, Young WF, Nair KS. Hormonal and metabolic changes of aging and the influence of lifestyle modifications. Mayo Clinic Proc. (2021) 96:788–814. doi: 10.1016/j.mayocp.2020.07.033
71. Zamboni M, Rubele S, Rossi AP. Sarcopenia and obesity. Curr Opin Clin Nutr Metab Care. (2019) 22:13–9. doi: 10.1097/MCO.0000000000000519
72. Ding S, Madu CO, Lu Y. The impact of hormonal imbalances associated with obesity on the incidence of endometrial cancer in postmenopausal women. J Cancer. (2020) 11:5456–65. doi: 10.7150/jca.47580
73. Billot M, Calvani R, Urtamo A, Sánchez-Sánchez JL, Ciccolari-Micaldi C, Chang M, et al. Preserving mobility in older adults with physical frailty and sarcopenia: opportunities, challenges, and recommendations for physical activity interventions. Clin Interventions Aging. (2020) 15:1675–90. doi: 10.2147/CIA.S253535
74. Whitelock E, Ensaff H. On your own: older adults’ Food choice and dietary habits. Nutrients. (2018) 10. doi: 10.3390/nu10040413
75. Congdon P. Obesity and urban environments. Int J Environ Res Public Health. (2019) 16. doi: 10.3390/ijerph16030464
76. Atek M, Traissac P, El Ati J, Laid Y, Aounallah-Skhiri H, Eymard-Duvernay S, et al. Obesity and association with area of residence, gender and socio-economic factors in Algerian and Tunisian adults. PLoS One. (2013) 8:e75640. doi: 10.1371/journal.pone.0075640
77. Ahmad K, Khanam T, Keramat SA, Islam MI, Kabir E, Khanam R. Interaction between the place of residence and wealth on the risk of overweight and obesity in Bangladeshi women. PLoS One. (2020) 15:9:e024334. doi: 10.1371/journal.pone.0243349
78. Endale F, Nigussie A, Tamene A, Habte A, Ermias D, Beyamo A, et al. Abdominal obesity and associated factors among urban adults in Southwest Ethiopia: a community-based cross-sectional study. Pan Afr Med J. (2024) 47:47. doi: 10.11604/pamj.2024.47.47.34746
79. Stappers NEH, Bekker MPM, Jansen MWJ, Kremers SPJ, de Vries NK, Schipperijn J, et al. Effects of major urban redesign on sedentary behaviour, physical activity, active transport and health-related quality of life in adults. BMC Public Health. (2023) 23:1157. doi: 10.1186/s12889-023-16035-6
80. Sallis JF, Cerin E, Conway TL, Adams MA, Frank LD, Pratt M, et al. Physical activity about urban environments in 14 cities worldwide: a cross-sectional study. Lancet. (2016) 387:2207–17. doi: 10.1016/S0140-6736(15)01284-2
81. Pineda E, Stockton J, Scholes S, Lassale C, Mindell JS. Food environment and obesity: a systematic review and meta-analysis. BMJ Nutrition Prev Health. (2024):e000663. doi: 10.1136/bmjnph-2023-000663
82. Ong SR, Crowston JG, Loprinzi PD, Ramulu PY. Physical activity, visual impairment, and eye disease. Eye (London England). (2018) 32:1296–303. doi: 10.1038/s41433-018-0081-8
83. Dakanalis A, Mentzelou M, Papadopoulou SK, Papandreou D, Spanoudaki M, Vasios GK, et al. The association of emotional eating with overweight/obesity, depression, anxiety/stress, and dietary patterns: A review of the current clinical evidence. Nutrients. (2023) 15. doi: 10.3390/nu15051173
84. Cupples ME, Hart PM, Johnston A, Jackson AJ. Improving healthcare access for people with visual impairment and blindness. BMJ. (2012) 344:e542. doi: 10.1136/bmj.e542
Appendix
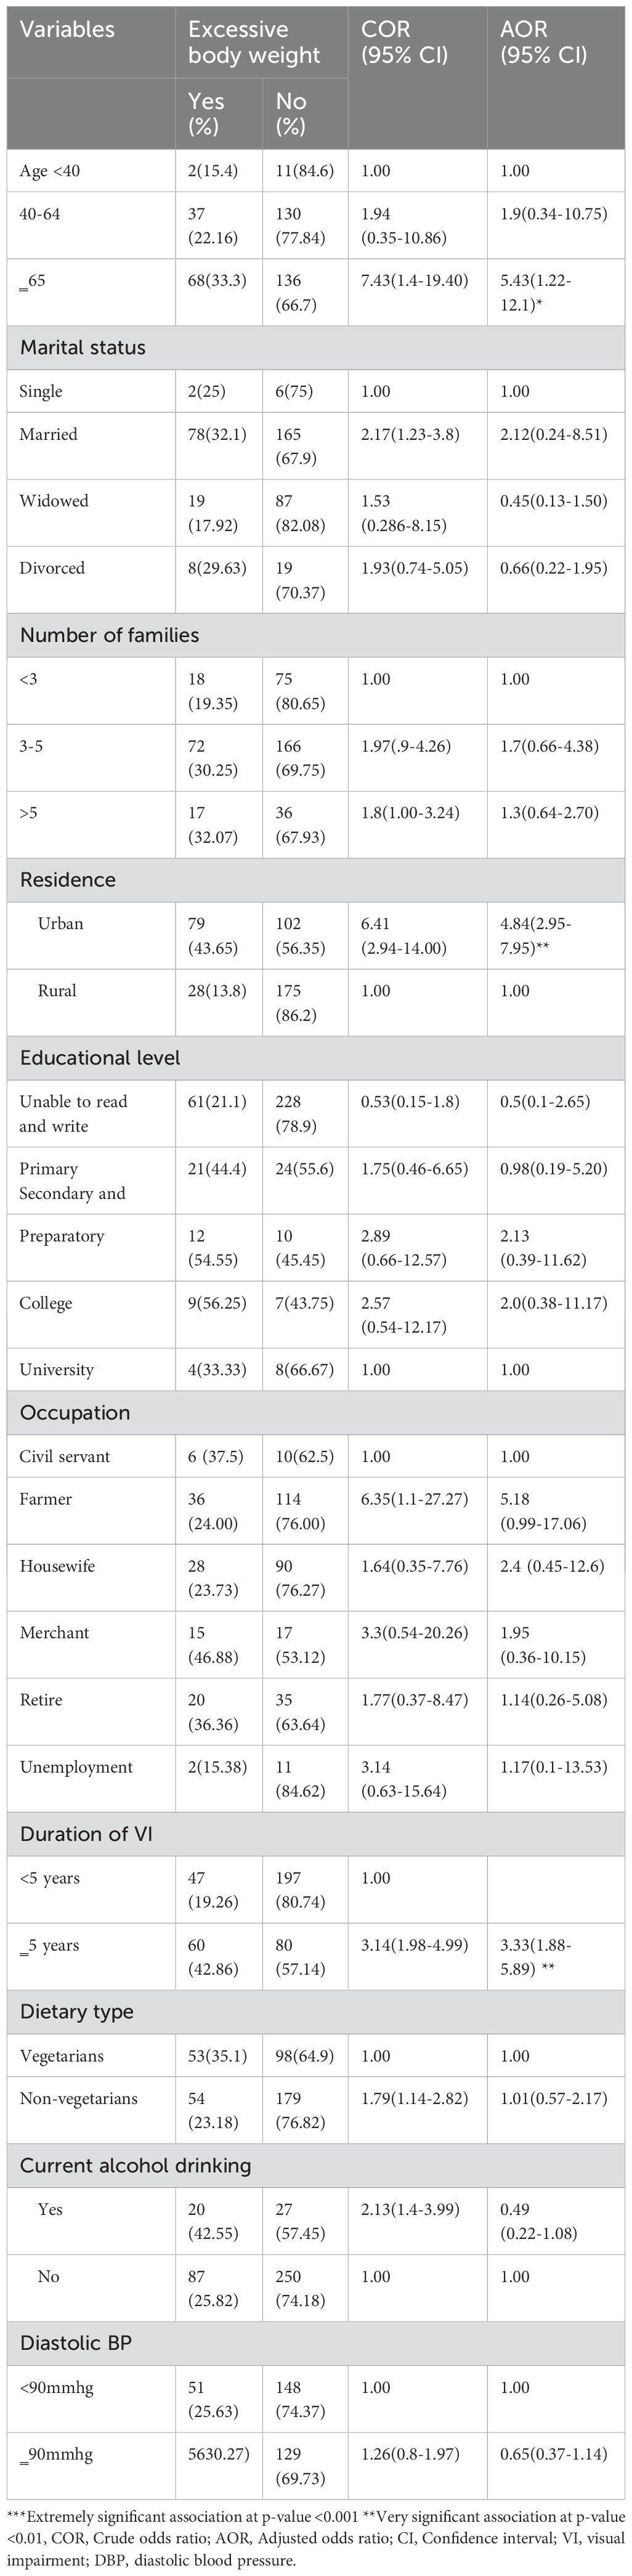
Table 1. Bivariable and multivariable binary logistic regression analysis of factors associated with excessive body weight among visually impaired adult patients in selected hospitals of northwest Ethiopia, 2024 (n=384).
Keywords: excessive body weight, visual impairment, northwest Ethiopia, overweight, obesity
Citation: Ashenef B, Yimenu BW, Osman EE, Sinamaw D, Baye G, Teffera ZH, Engida MG, Adugna A, Mengistu EF, Baylie T and Jemal M (2025) Excessive body weight and its contributing factors in visually impaired patients in northwest Ethiopia, 2024. Front. Endocrinol. 16:1514308. doi: 10.3389/fendo.2025.1514308
Received: 20 October 2024; Accepted: 27 February 2025;
Published: 20 March 2025.
Edited by:
Wen-Hui Wu, Tongji University, ChinaReviewed by:
Siti Nurliyana Abdullah, Raja Isteri Pengiran Anak Saleha Hospital, BruneiFahad Alzahrani, Taibah University, Saudi Arabia
Copyright © 2025 Ashenef, Yimenu, Osman, Sinamaw, Baye, Teffera, Engida, Adugna, Mengistu, Baylie and Jemal. This is an open-access article distributed under the terms of the Creative Commons Attribution License (CC BY). The use, distribution or reproduction in other forums is permitted, provided the original author(s) and the copyright owner(s) are credited and that the original publication in this journal is cited, in accordance with accepted academic practice. No use, distribution or reproduction is permitted which does not comply with these terms.
*Correspondence: Baye Ashenef, YmF5ZWFzaGVuYWZpNzdAZ21haWwuY29t