 Xiaoqing Yu
 Qin Deng1†
 Daixing Hu
 Lu Yang
- 1Department of Breast and Thyroid Surgery, Second Affiliated Hospital of Chongqing Medical University, Chongqing, China
- 2Hepatopancreatobiliary Center, The Second Affiliated Hospital of Nanjing Medical University, Nanjing, Jiangsu, China
- 3Scientific Research and Education Section, Chongqing Health Center for Women and Children, Chongqing, China
Background: Despite having negative lymph node (N0) status, thyroid cancer (TC) patients can still experience distant metastasis (DM), which significantly impacts their survival. This study aimed to investigate the prognostic factors for DM in TC patients (N0) and develop a predictive nomogram model for analyzing the prognosis of TC N0 patients with DM.
Methods: Data collected from the Surveillance, Epidemiology, and End Results (SEER) database for 18,504 TC patients (N0) between 2004 and 2015 were analyzed. Univariate and multivariate analyses were used to identify independent prognostic factors for DM in TC N0. These independent factors were used to build a nomogram model to predict overall survival (OS) at 1, 3, and 5 years for TC patients (N0) with DM.
Results and conclusion: This study examined the clinicopathological features associated with the risk and prognosis of DM in TC patients (N0), and successfully established and validated a nomogram capable of predicting OS in individual patients with DM. The nomogram is highly useful for the timely identification of TC patients (N0) at high risk of DM by physicians, enabling individualized survival evaluations and treatment for TC patients with DM (N0).
1 Introduction
Thyroid cancer (TC) is the most common malignant endocrine tumor, accounting for approximately 94.5% of all cases (1). Its prevalence has increased rapidly in recent years, with an annual growth rate of around 4%. TC is one of the few malignant tumors whose incidence rate is still rising (2–4). While most TC patients experience minimal distant metastasis (DM) and favorable survival outcomes, a subset of patients without lymph node metastasis still face the challenges of DM and poor prognosis. This subgroup requires further attention and investigation.
DM in TC patients is associated with worse prognoses. A recent study indicates that a small number of TC patients present with DM at diagnosis, a significant cause of TC-related mortality (5). Generally, TC patients primarily experience lymph node metastasis before progressing to DM. Consequently, those without lymph node metastasis are generally classified as low risk. However, a small portion of patients with DM also exhibit negative lymph node status, indicating a higher malignancy grade. Numerous studies have explored the risk factors for DM in TC and assessed overall survival (OS). While DM is commonly considered a late-stage event in cancer progression, evidence suggests that metastasis can occur at early stages in certain tumors or as an advanced event, without requiring differentiation at the primary tumor site (6). This phenomenon, known as metastasis dormancy, is supported by experimental models referred to as ‘tumor dormancy’ (7–9) and ‘cellular dormancy’ (10, 11). Therefore, when a tumor particularly TC, deviates from the traditional metastasis model (enlargement of the primary lesion, infiltration of regional lymph nodes, DM), it generally indicates increased invasiveness and a poorer prognosis (12).
Overall, TC is associated with a favorable prognosis. Clinicians often prioritize local lymph node metastasis over DM before and after diagnosis, particularly in differentiated TC, which significantly impacts staging, prognostic assessment, and treatment planning following surgery. Determining the necessity of DM examinations (such as lung CT, bone scanning, etc.) for all patients and identifying those who warrant further evaluation for DM are crucial considerations not only for diagnosing and treating TC patients but also for managing costs effectively.
Nomograms, widely used for prognostic analysis in cancers like TC and breast cancer (13–15), are effective tools for this purpose. Therefore, this study aims to identify risk factors for DM in TC patients without lymph node metastasis and develop a nomogram model for evaluating prognosis in individuals with DM (N0). Additionally, the accuracy and applicability of the nomogram model were validated. By stratifying patients based on prognosis, clinicians can select appropriate examination, treatment methods, and follow-up procedures.
2 Materials and methods
2.1 Data source
The data for this study were obtained from the SEER database (https://seer.cancer.gov/seerstat/) of the National Cancer Institute in the United States (16). The data used in this retrospective study are publicly available. Therefore, the need for informed consent from the patients was waived. No separate ethical approval was required for this study. A retrospective cohort study was conducted using information from the SEER database, which included 134,343 TC patients diagnosed between 2004 and 2015. The inclusion criteria were as follows: (1) Diagnosis of TC between 2004 and 2015; (2) Negative lymph nodes; (3) Pathological types including papillary thyroid cancer (PTC), follicular thyroid cancer (FTC), medullary thyroid cancer (MTC), and anaplastic thyroid cancer (ATC); (4) Active follow- up during the study period. Patients with lymph node metastasis, primary cancer lesions other than thyroid, coexisting tumors, and incomplete clinical and pathological information were excluded. Finally, a total of 18,504 TC patients with N0 status were included in this study. Among these cases, 350 (1.9%) patients (N0) had DM (Figure 1).
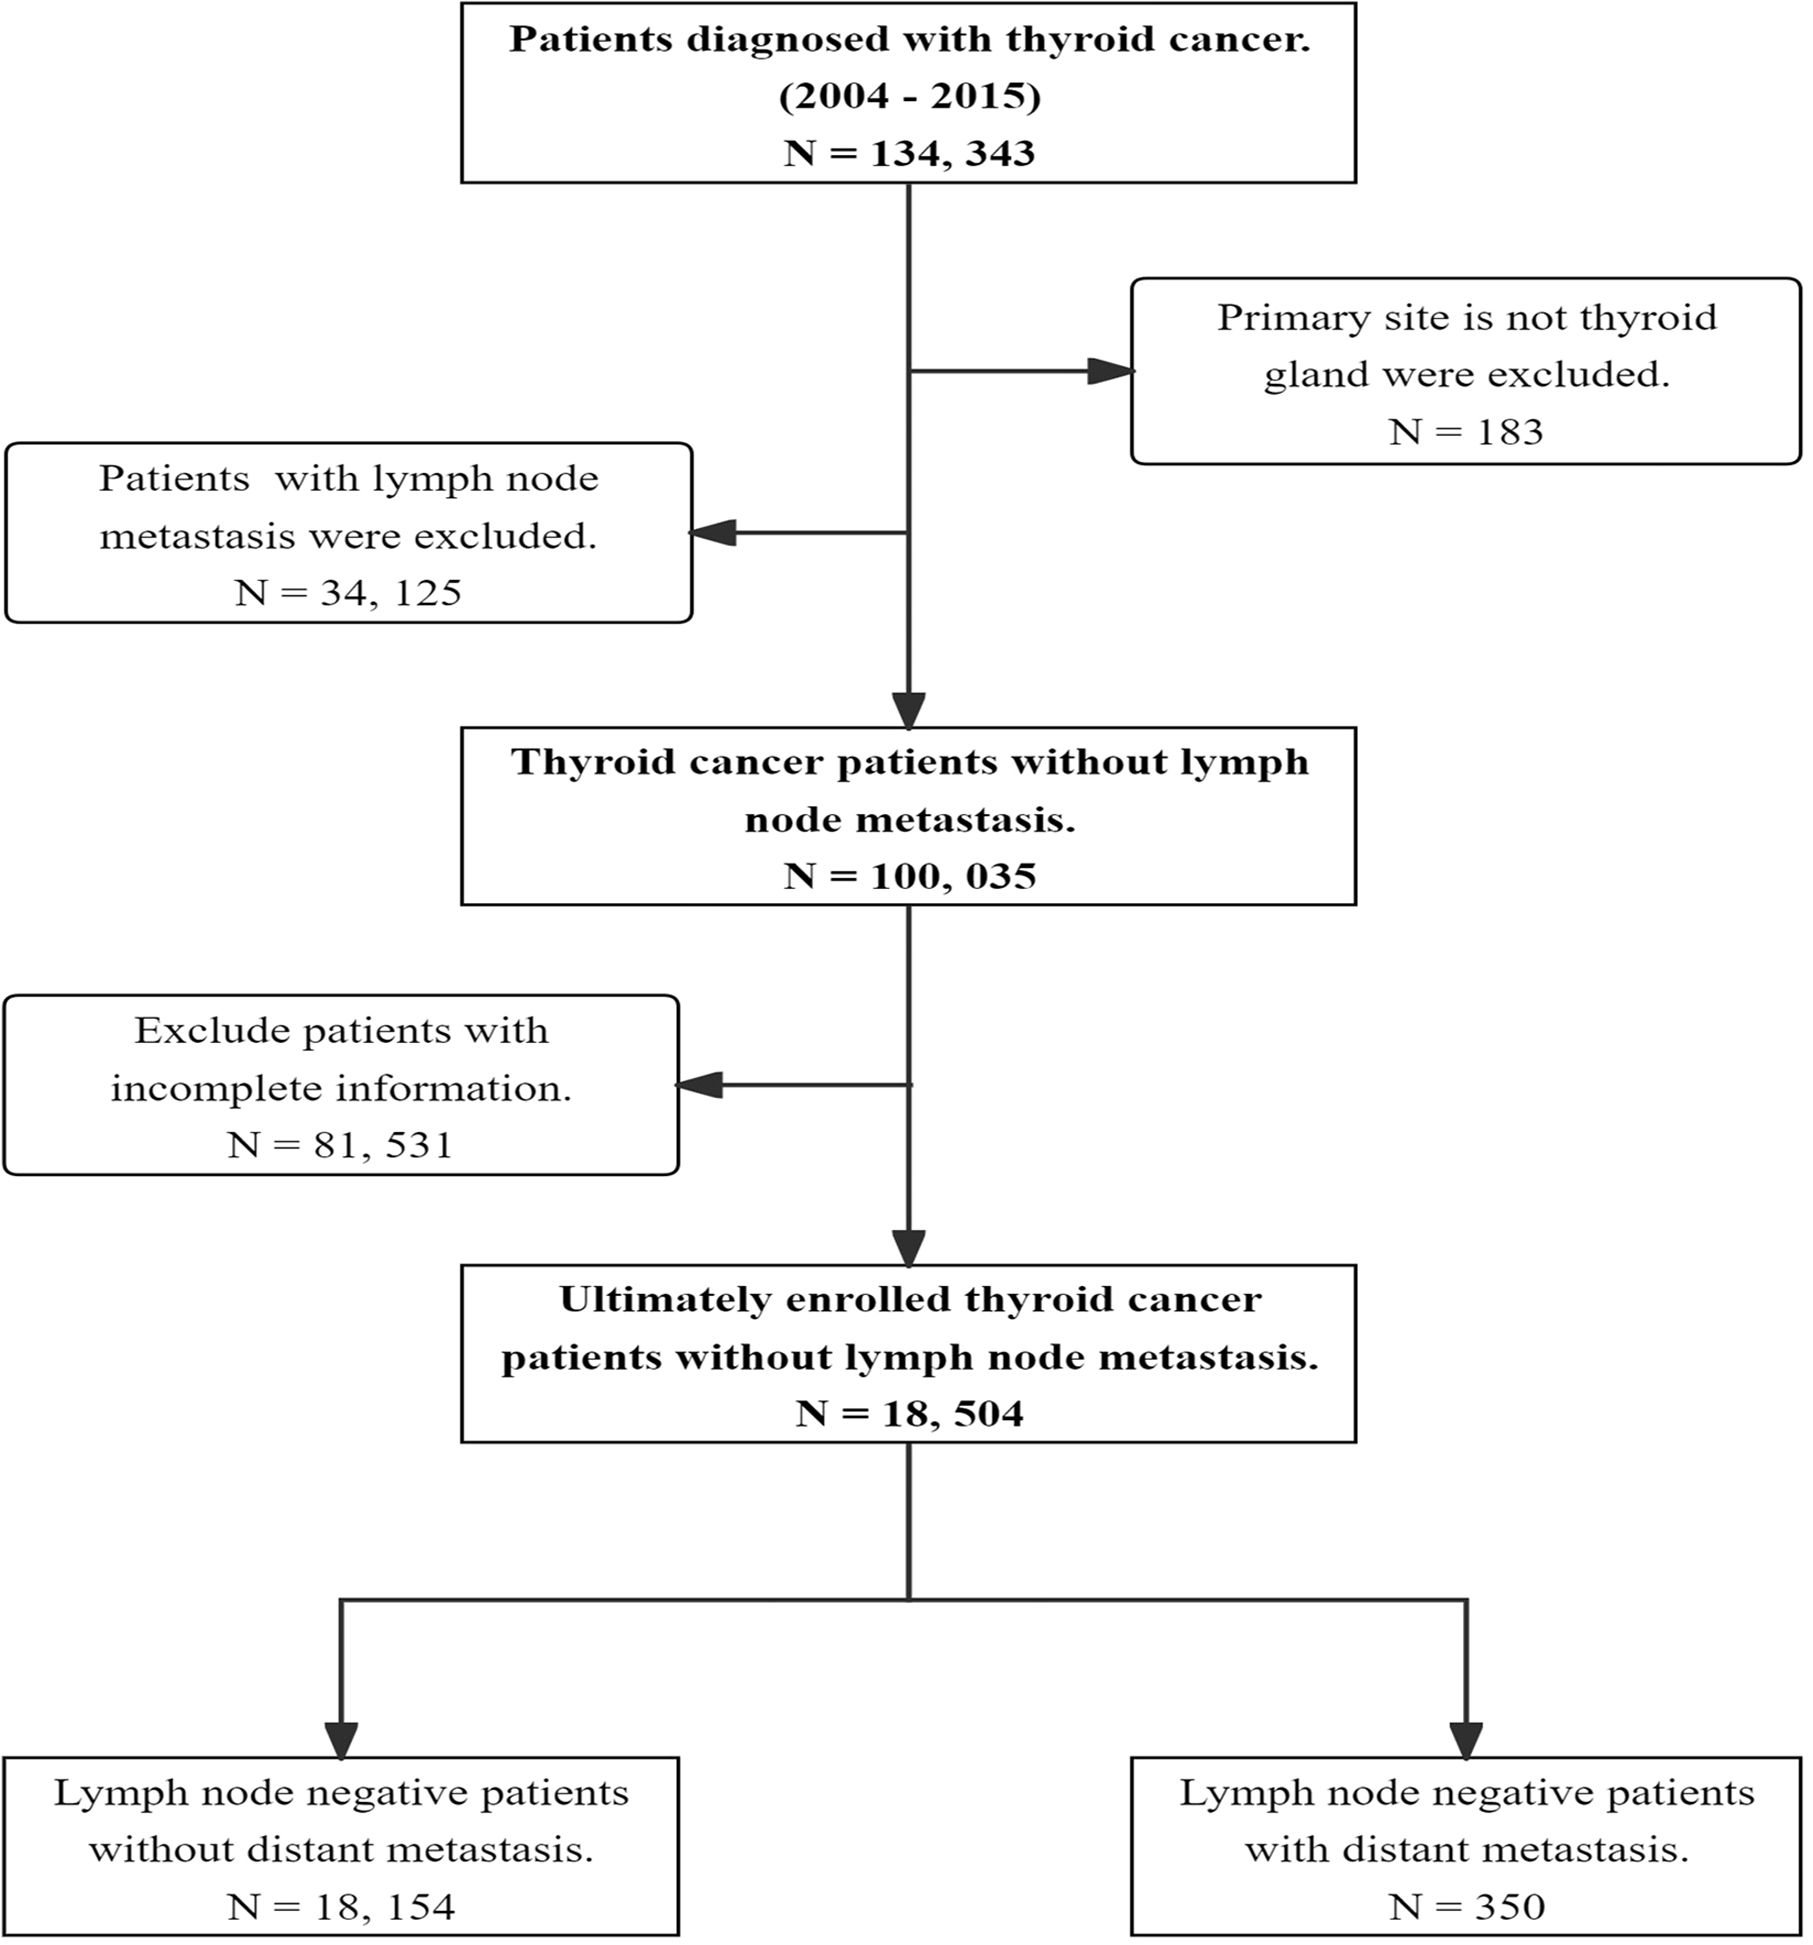
Figure 1. Flow chart illustrating the patient selection process in our study.
2.2 Statistical analysis
Statistical analysis was performed using SPSS 26.0 (IBM Corp, USA). Univariate and multivariate analyses were conducted to identify independent risk variables for DM or prognostic factors for OS. The Kaplan-Meier (K-M) technique was used to estimate OS, and log-rank tests were used to assess the significance of differences. A p-value of 0.05 (two-sided) indicated statistical significance. Patients from the SEER database were randomly allocated to an internal validation group. The nomogram, calibration curve, and K-M analysis were created using the results of multivariate Cox regression analysis with the R software packages “survival,” “rms,” “sure miner,” and “foreign” (R Foundation, Vienna, Austria, version 3.5.2, http://www.r-project.org). The discrimination performance of the current nomogram was evaluated using Harrell’s C-index.
2.3 Ethical approval
SEER data are deidentified before release and do not contain any personally identifying information. As the data are publicly available, no ethical approval is required. We received permission to access the research data file in the SEER program from the National Cancer Institute, USA.
3 Results
3.1 Clinicopathological characteristics of TC patients without lymph node metastasis status
A total of 18,504 TC patients without lymph node metastasis were included in this study between 2004 and 2015. Table 1 shows the clinicopathological characteristics of patients with and without DM, along with the distinctions between the two groups. In the TC N0 with DM subgroup, 95 patients (27.1%) were under 55 years old. Among the 350 patients (N0M1), 98 (28.0%) were diagnosed with an ATC pathological type, 91 (26.0%) with an FTC pathological type, 2 (0.6%) with an MTC pathological type, and 159 (45.4%) with a PTC pathological type. The majority of these patients were classified as T4 (143, 40.9%) and grade IV (117, 33.4%). In contrast, within the subgroup without DM, 10,844 individuals (59.7%) were younger than 55 years old, and only 226 patients (1.2%) had an ATC pathological type. The majority of these patients were categorized as T0-1 (11052, 60.9%) and Grade I (14522, 80.0%). Among the N0 patients, 350 cases (1.9%) were identified as coexisting with DM, with 99 cases in the validation cohort.
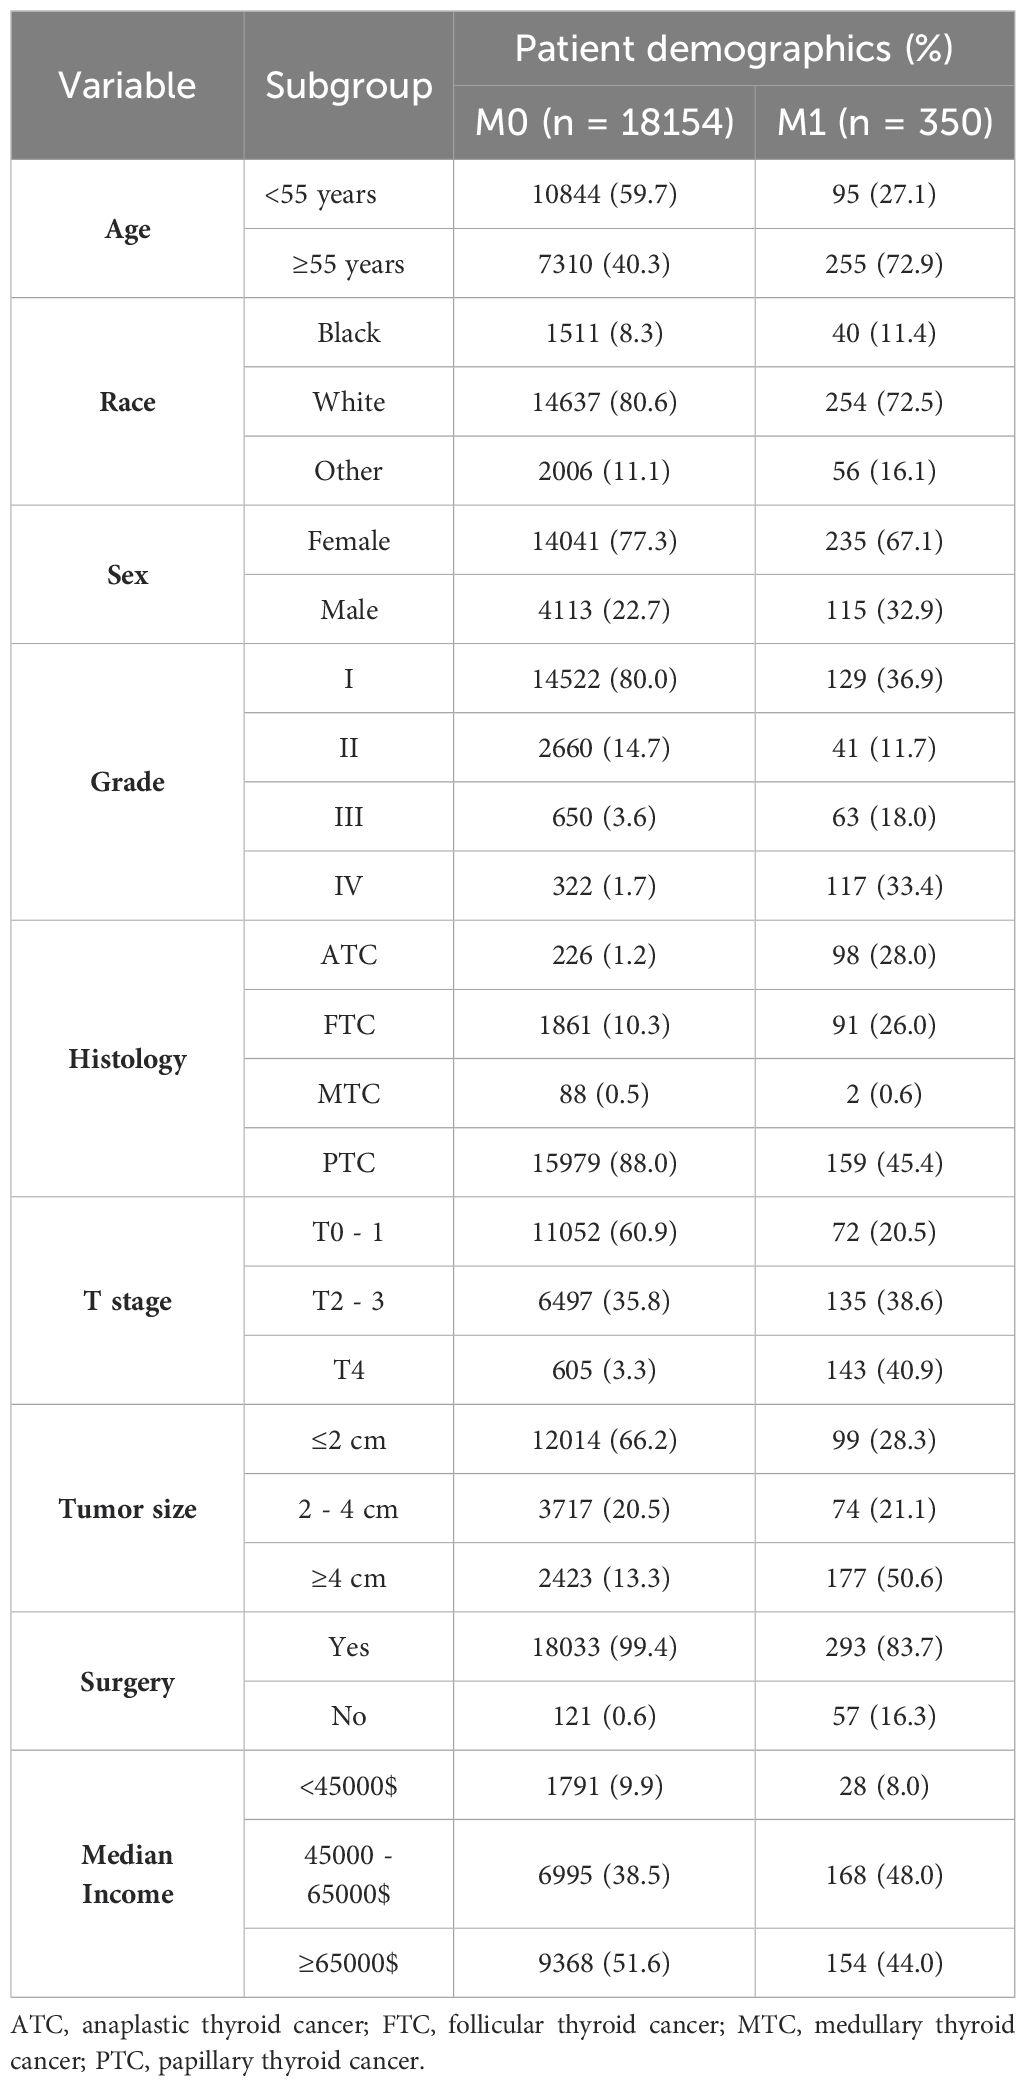
Table 1. Clinicopathological characteristics of the patients.
3.2 Univariate and multivariate logistic analyses
Logistic analysis was conducted to evaluate the clinical parameters associated with the risk of DM in TC patients with N0 status (Table 2). Age at diagnosis (P < 0.001), race (P = 0.001), sex (P = 0.014), grade (P < 0.001), histology (P < 0.001), T stage (P < 0.001), tumor size (P < 0.0001), and surgery (P < 0.001) were found to be significantly associated with DM during the univariate logistic analysis. Subsequently, these eight clinicopathological characteristics were included in the multivariate logistic analysis, which resulted in a satisfactory Receiver operating characteristics (ROC) value of 0.85 (95% confidence interval (CI): 0.82 - 0.88) for predicting the risk of DM in patients with negative lymph node status (Figure 2). Specifically, the findings indicated that age ≥55years [Odds Ratio (OR) = 2.11, 95% CI:1.55 - 2.88; <0.001], histology (PTC: OR = 0.47, 95% CI: 0.23 - 0.96, P = 0.037), grade (P < 0.001), T stage (P < 0.001) and surgery (P < 0.001) were independent predictors of DM.
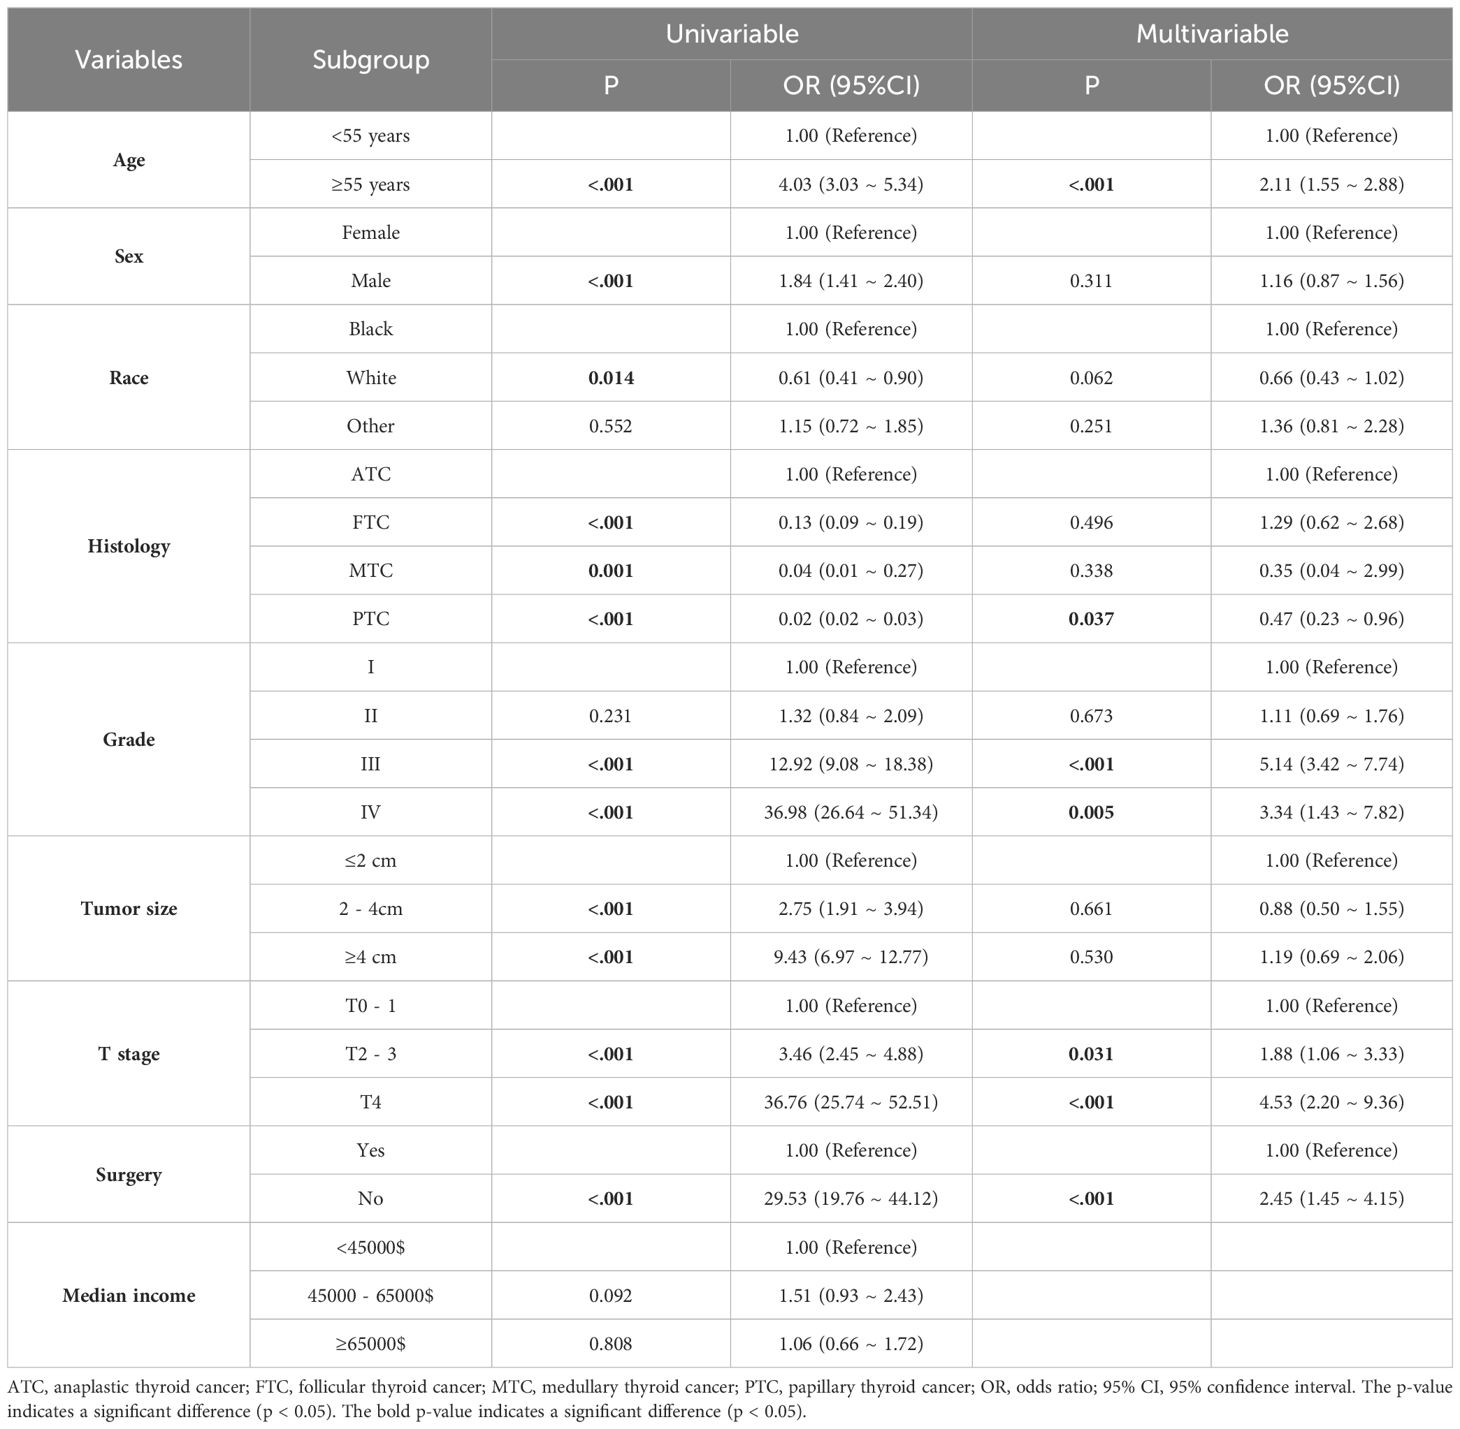
Table 2. Univariate and Multivariate Logistic Analyses of Risk Factors of DM.
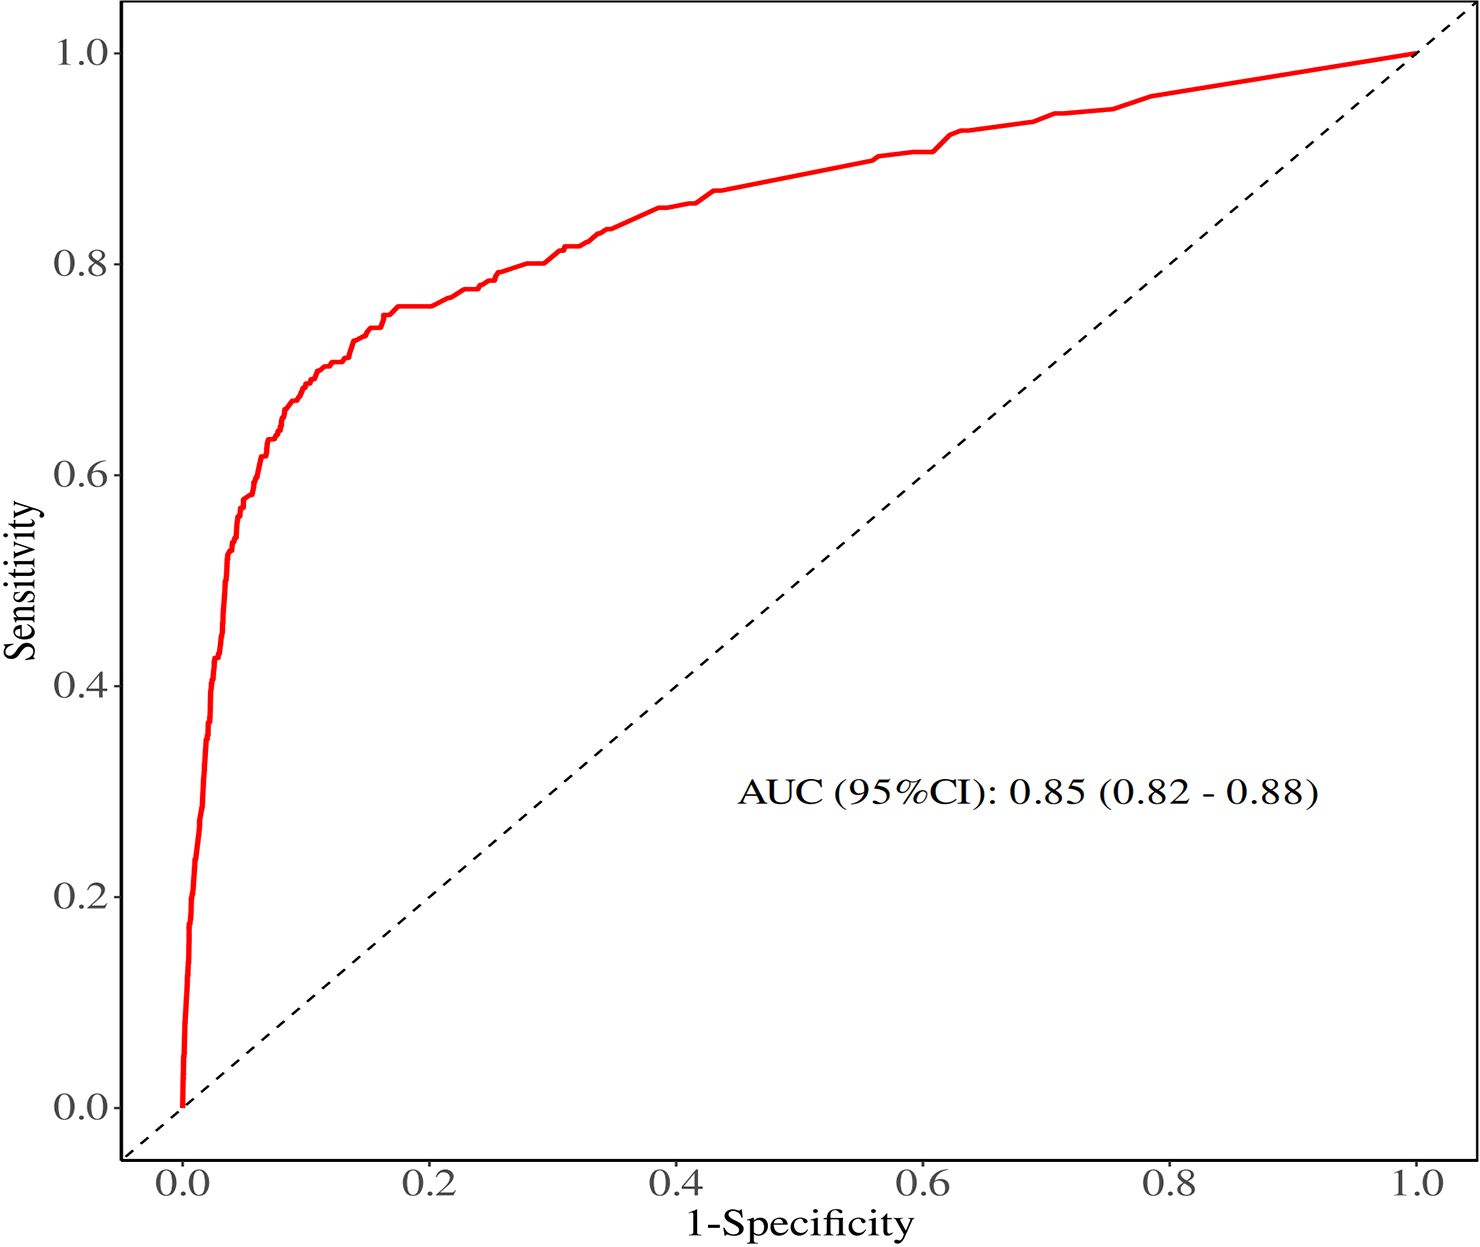
Figure 2. ROC curve of univariate and multivariate logistic analyses evaluating the risk factors for DM.
3.3 Univariate and multivariate cox analyses
The baseline data comparison between the training group and the validation group patients on various indicators showed that this difference was not statistically significant (Table 3). Relevant variables from the univariate Cox regression analysis were included in the multivariate Cox regression analysis to determine the independent risk factors for 1-, 3-, and 5-year OS in TC patients (N0) with DM during the follow-up. The multivariate Cox regression analysis identified age at diagnosis (P < 0.001), grade (P < 0.001), T stage (P = 0.014), and surgery (P < 0.001) as significant prognostic variables. Specifically, elderly age (≥55 years: OR = 2.99; 95% CI: 1.86 - 4.80; P < 0.001), grade (III: OR = 1.02, 95% CI: 1.09 - 3.76; IV: OR = 4.63, 95% CI: 1.92 - 11.18), T stage (T4: OR = 2.73, 95% CI:1.23 - 6.06) and surgery (No: OR = 2.53, 95% CI: 1.63 - 3.93, P < 0.001) were identified as independent risk factors for OS in this subgroup (Table 4). Furthermore, four factors (P ≤ 0.05) from the multivariate Cox proportional hazard model were used to construct the K-M survival curves to assess the survival probability and cumulative hazard in patients with different variables (Figure 3).
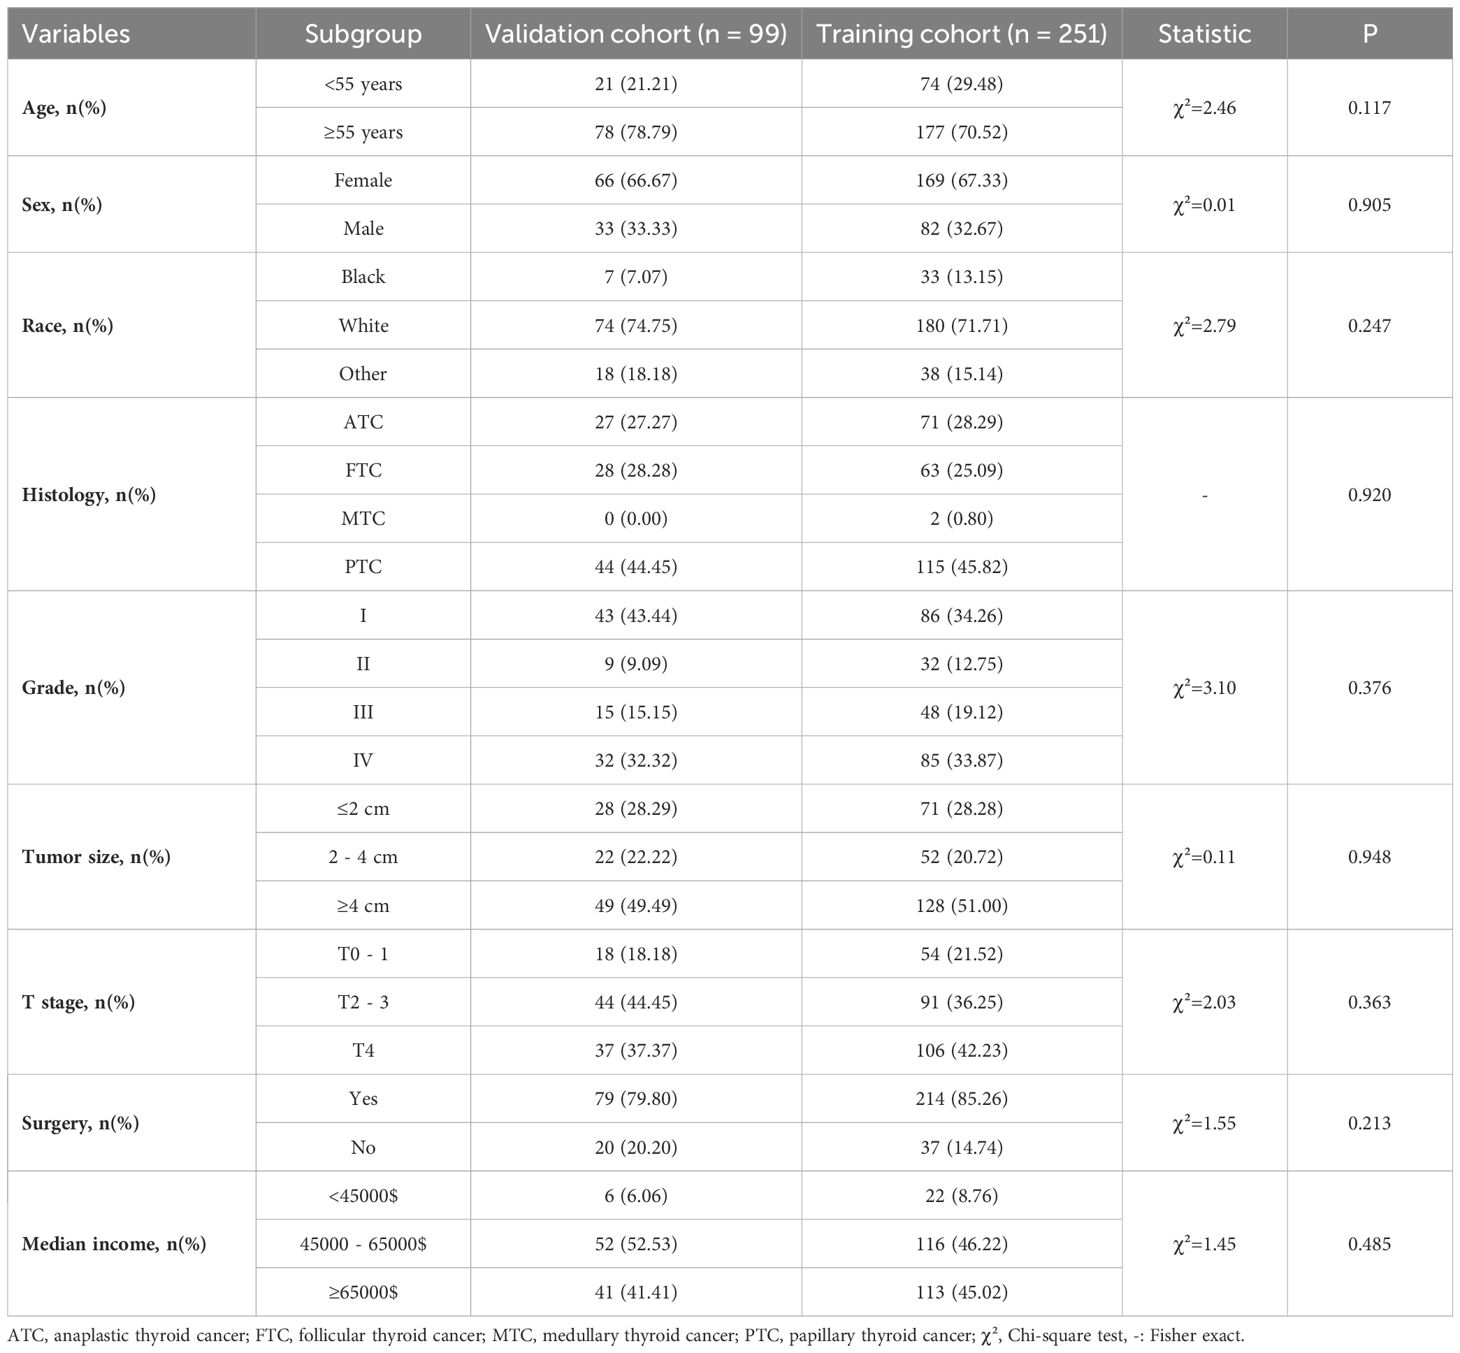
Table 3. Baseline demographic and clinical characteristics of TC patients (N0) with DM in the training and validation groups.
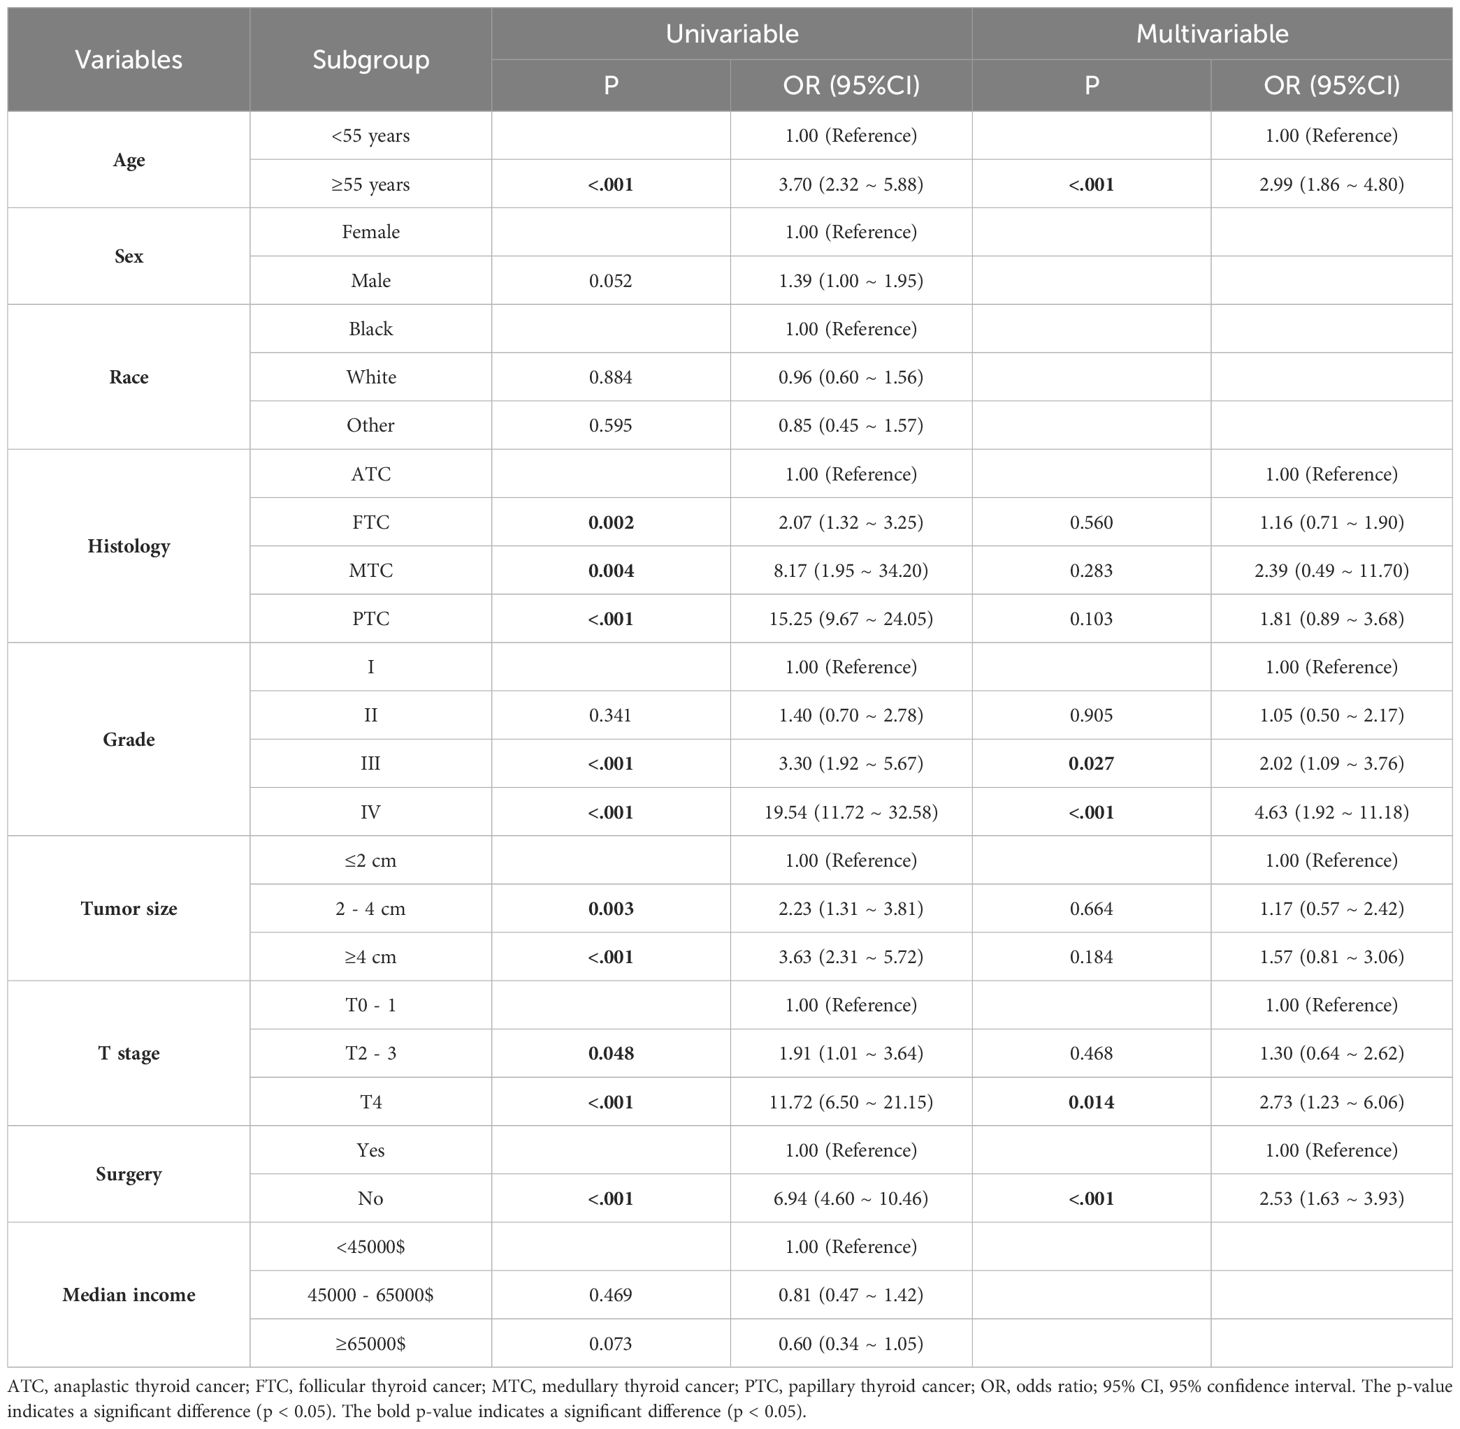
Table 4. Univariate and Multivariate Cox Analyses of Risk Factors for OS.
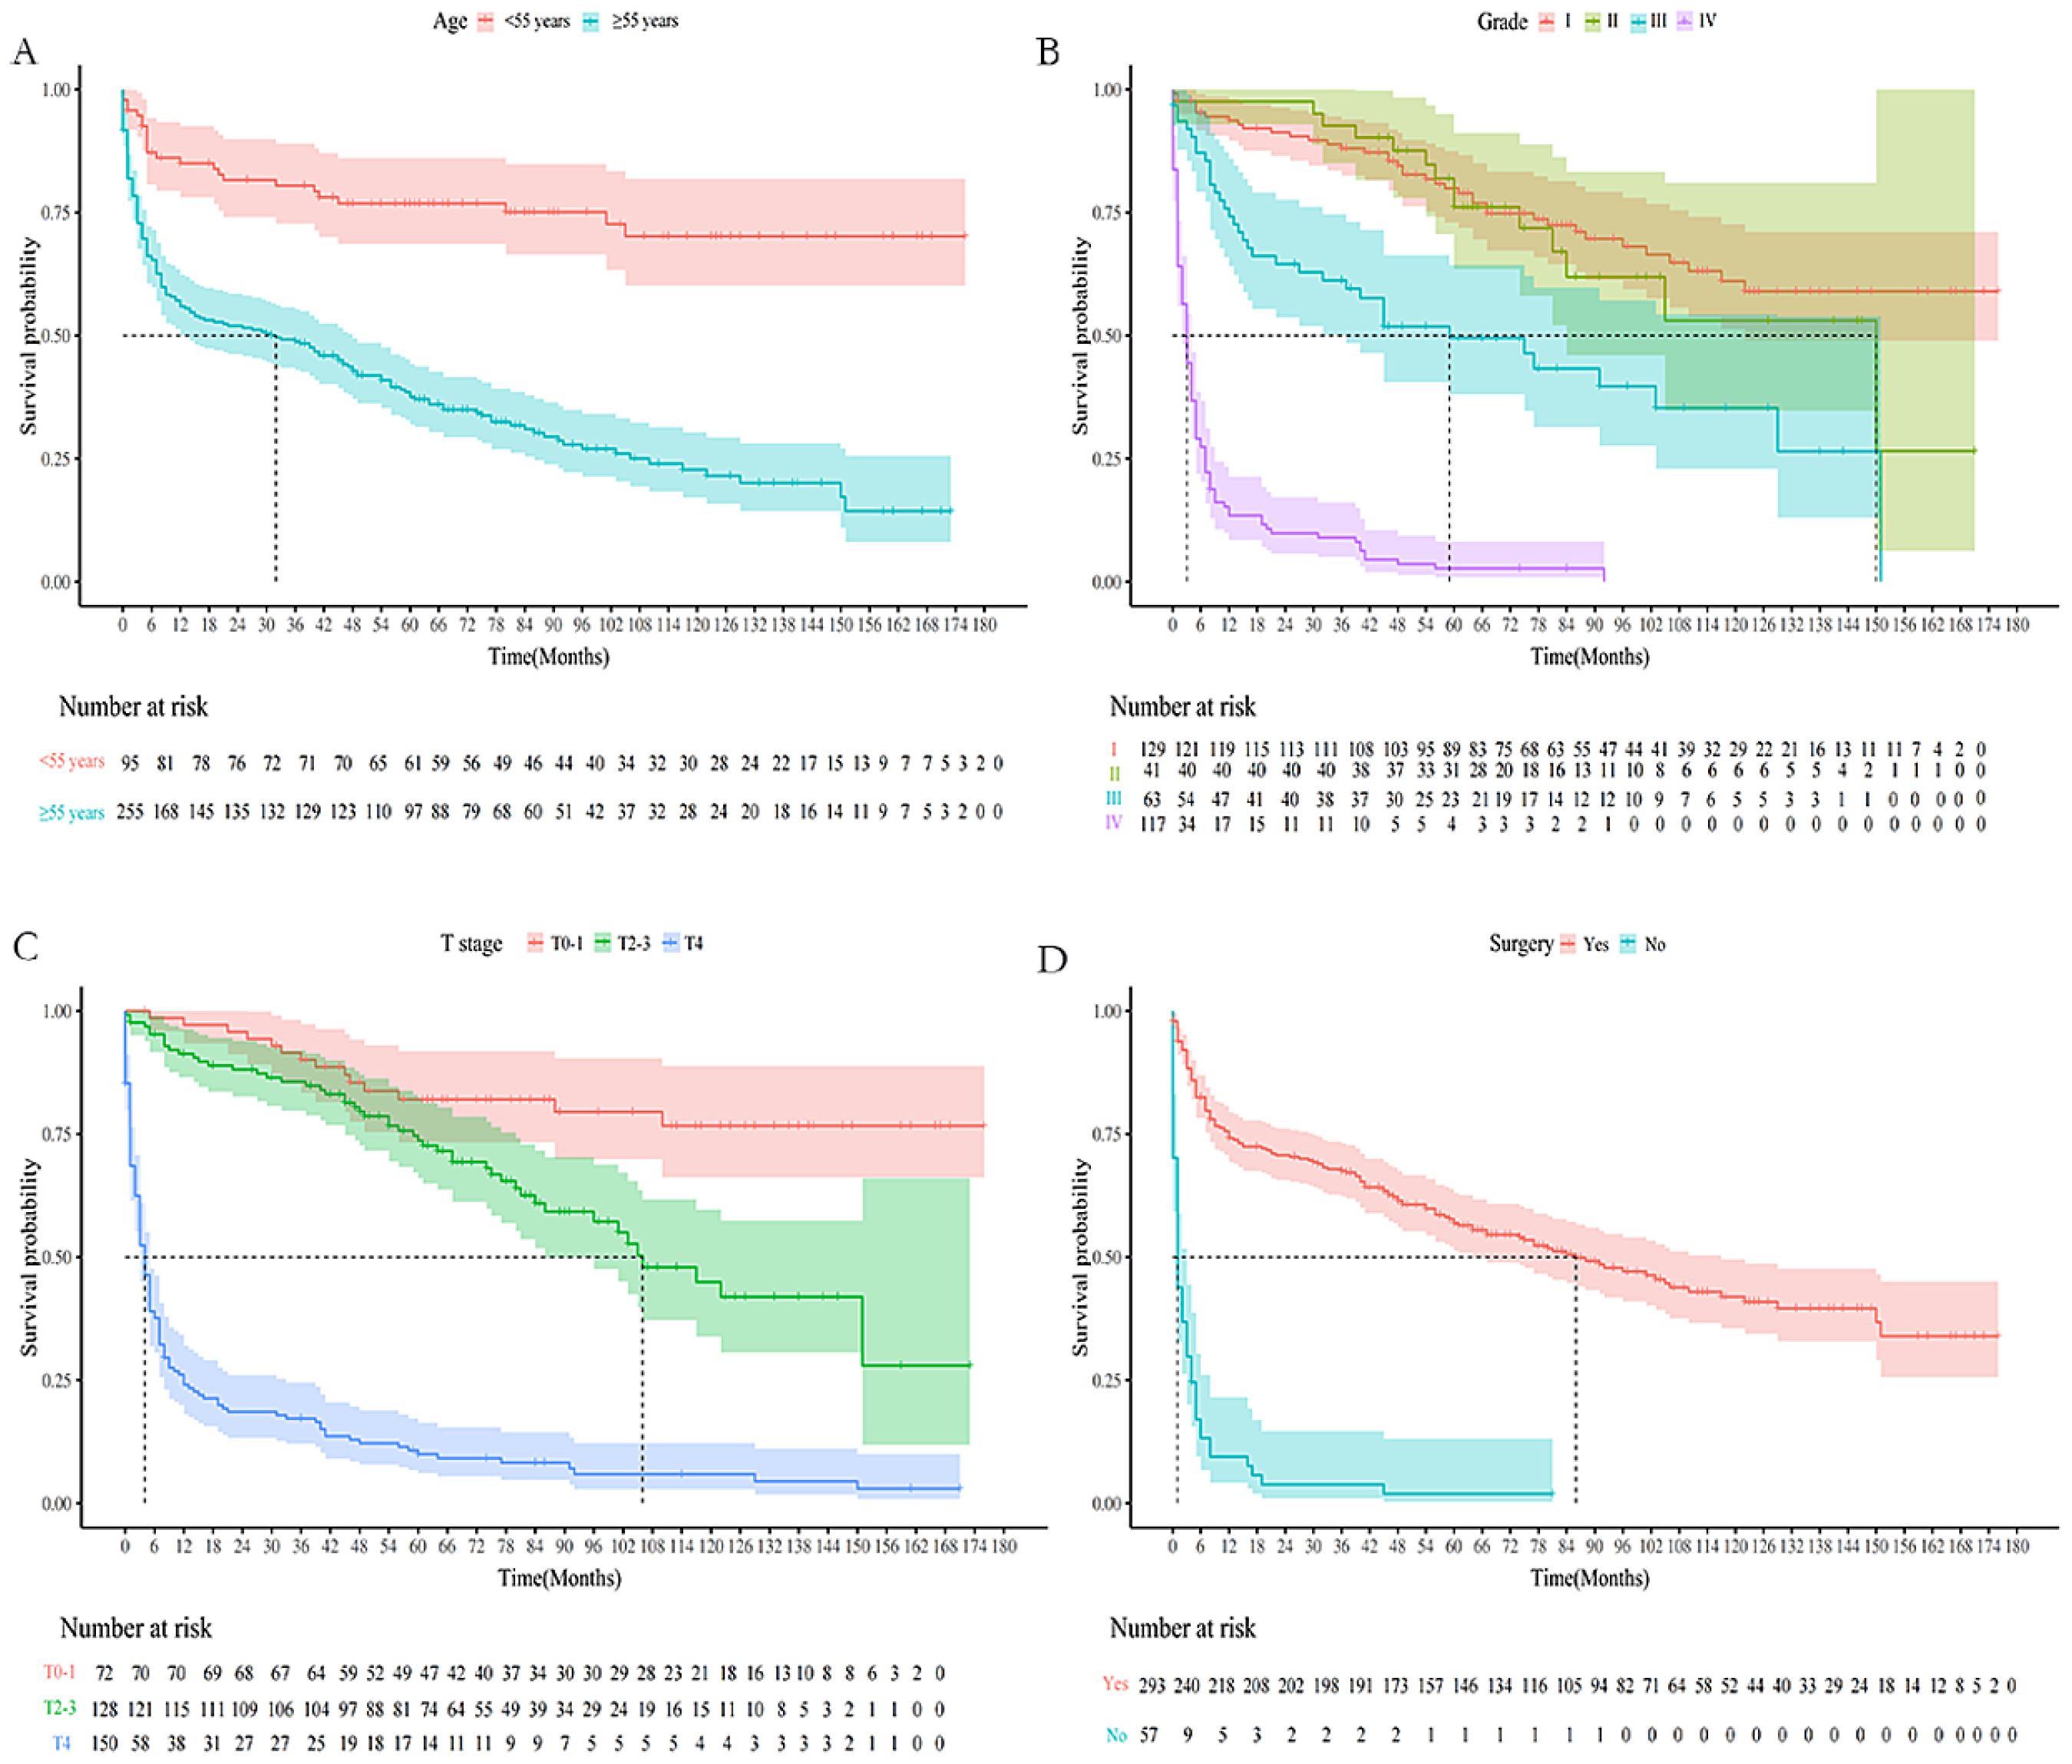
Figure 3. K-M survival curves predicting OS in lymph-node-negative thyroid cancer patients with DM. (A) Age; (B) Grade; (C) T stage; (D) Surgery.
3.4 Construction and validation of the prediction nomogram
The nomogram for OS was constructed based on the independent prognostic variables obtained from the multivariate Cox regression analysis (Figure 4). Each variable represented a specific number of points on the scale, and the total score could be computed by summing the points for all variables for an individual patient. In the training cohort, the Area Under Curve (AUC) of the 1-, 3-, and 5-year OS ROC were 0.951, 0.936, and 0.912, respectively, indicating good predictive ability (Figures 5A–C). The constructed nomogram was further validated using an internal validation cohort of 162 cases. The validation cohort data also showed significant discrimination, with an AUC of 0.941 for predicting 1-year OS (Figure 6A), an AUC of 0.901 for predicting 3-year OS (Figure 6B), and an AUC of 0.914 for predicting 5-year OS (Figure 6C). To further evaluate the nomogram’s accuracy, the calibration curves for the likelihood of OS revealed a high agreement between the predicted and observed outcomes for the 1-, 3-, and 5-year time points (Figures 7, 8). To assess the clinical applicability of the nomogram, we performed Decision Curve Analysis (DCA) (Figures 9, 10), which measures the net benefits of clinical decisions. The Y-axis represents net profit, while the X-axis represents the threshold for high-risk prediction. The horizontal green solid line represents the net benefit of assuming that all cases are negative, and the diagonal red solid line represents the net benefit of assuming that all cases are positive. The DCA shows that when the threshold probability is greater than 0.1, the model predicts a higher net benefit value, indicating good clinical prediction performance of the model.
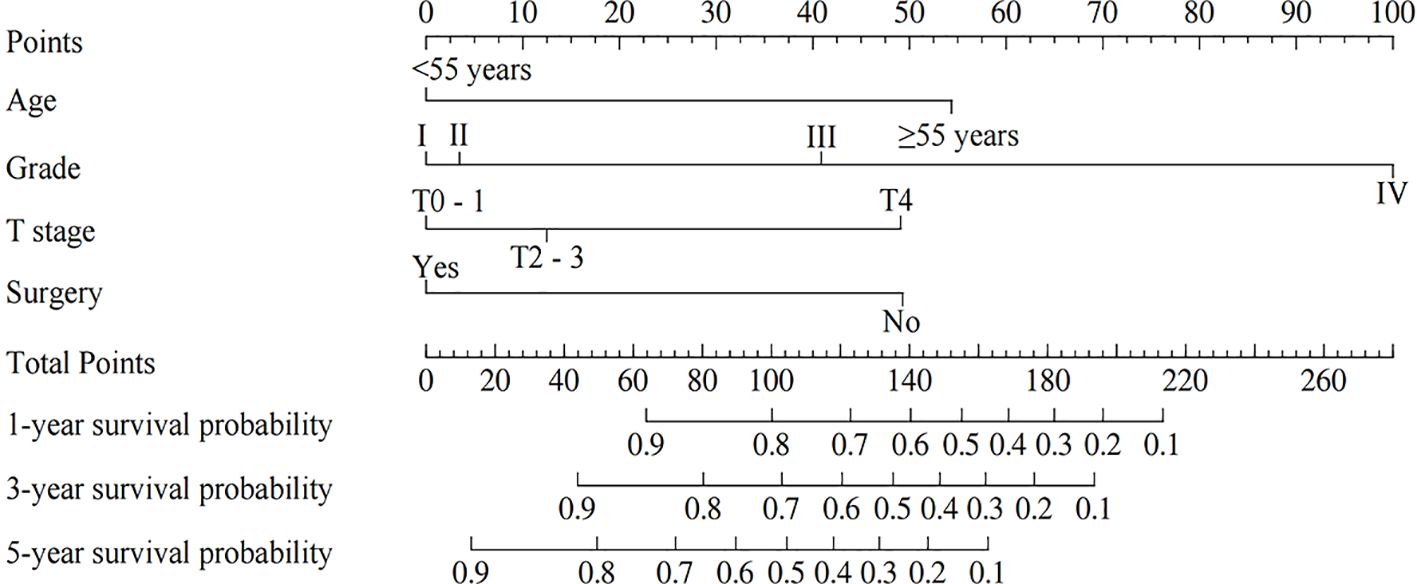
Figure 4. Nomogram predicting the probability of OS.
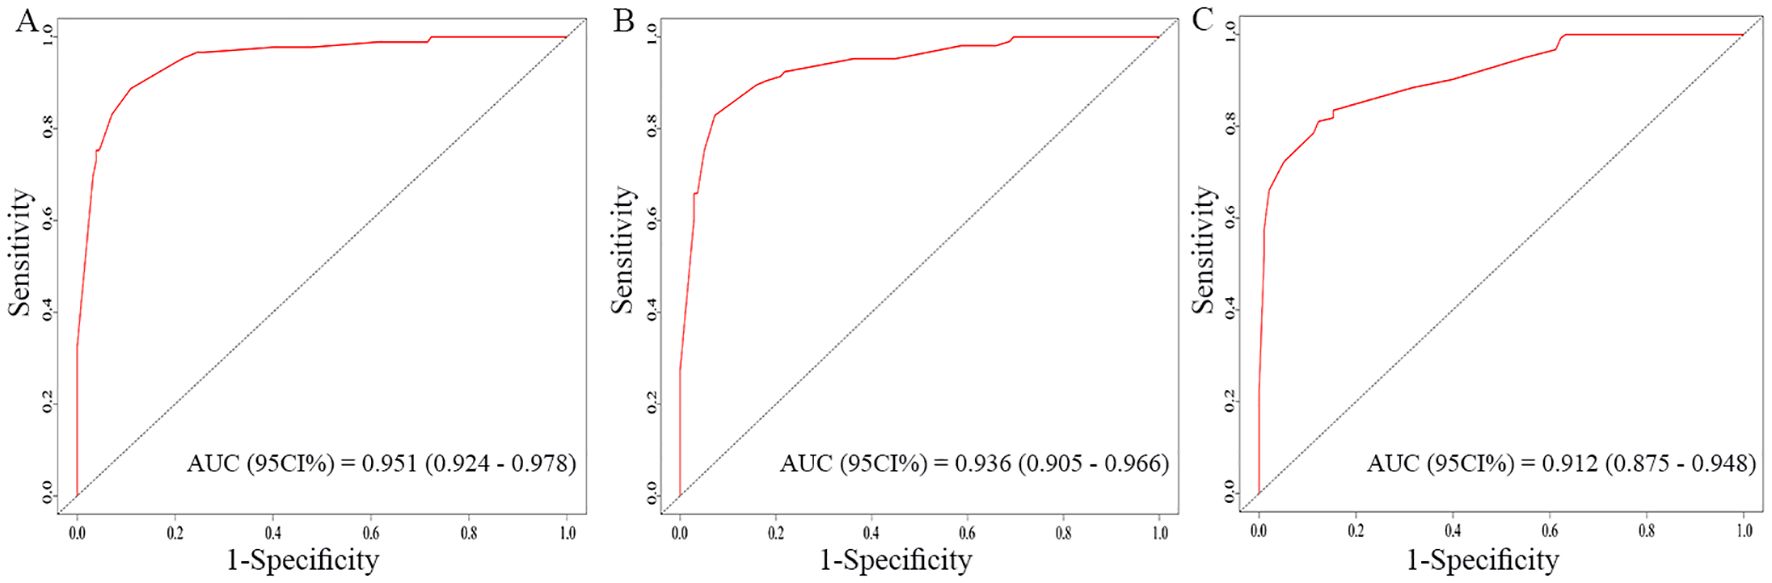
Figure 5. Receiver operating characteristics (ROC) curves of the nomogram for the 1-year, 3-year, and 5-year in the training cohort (A–C).
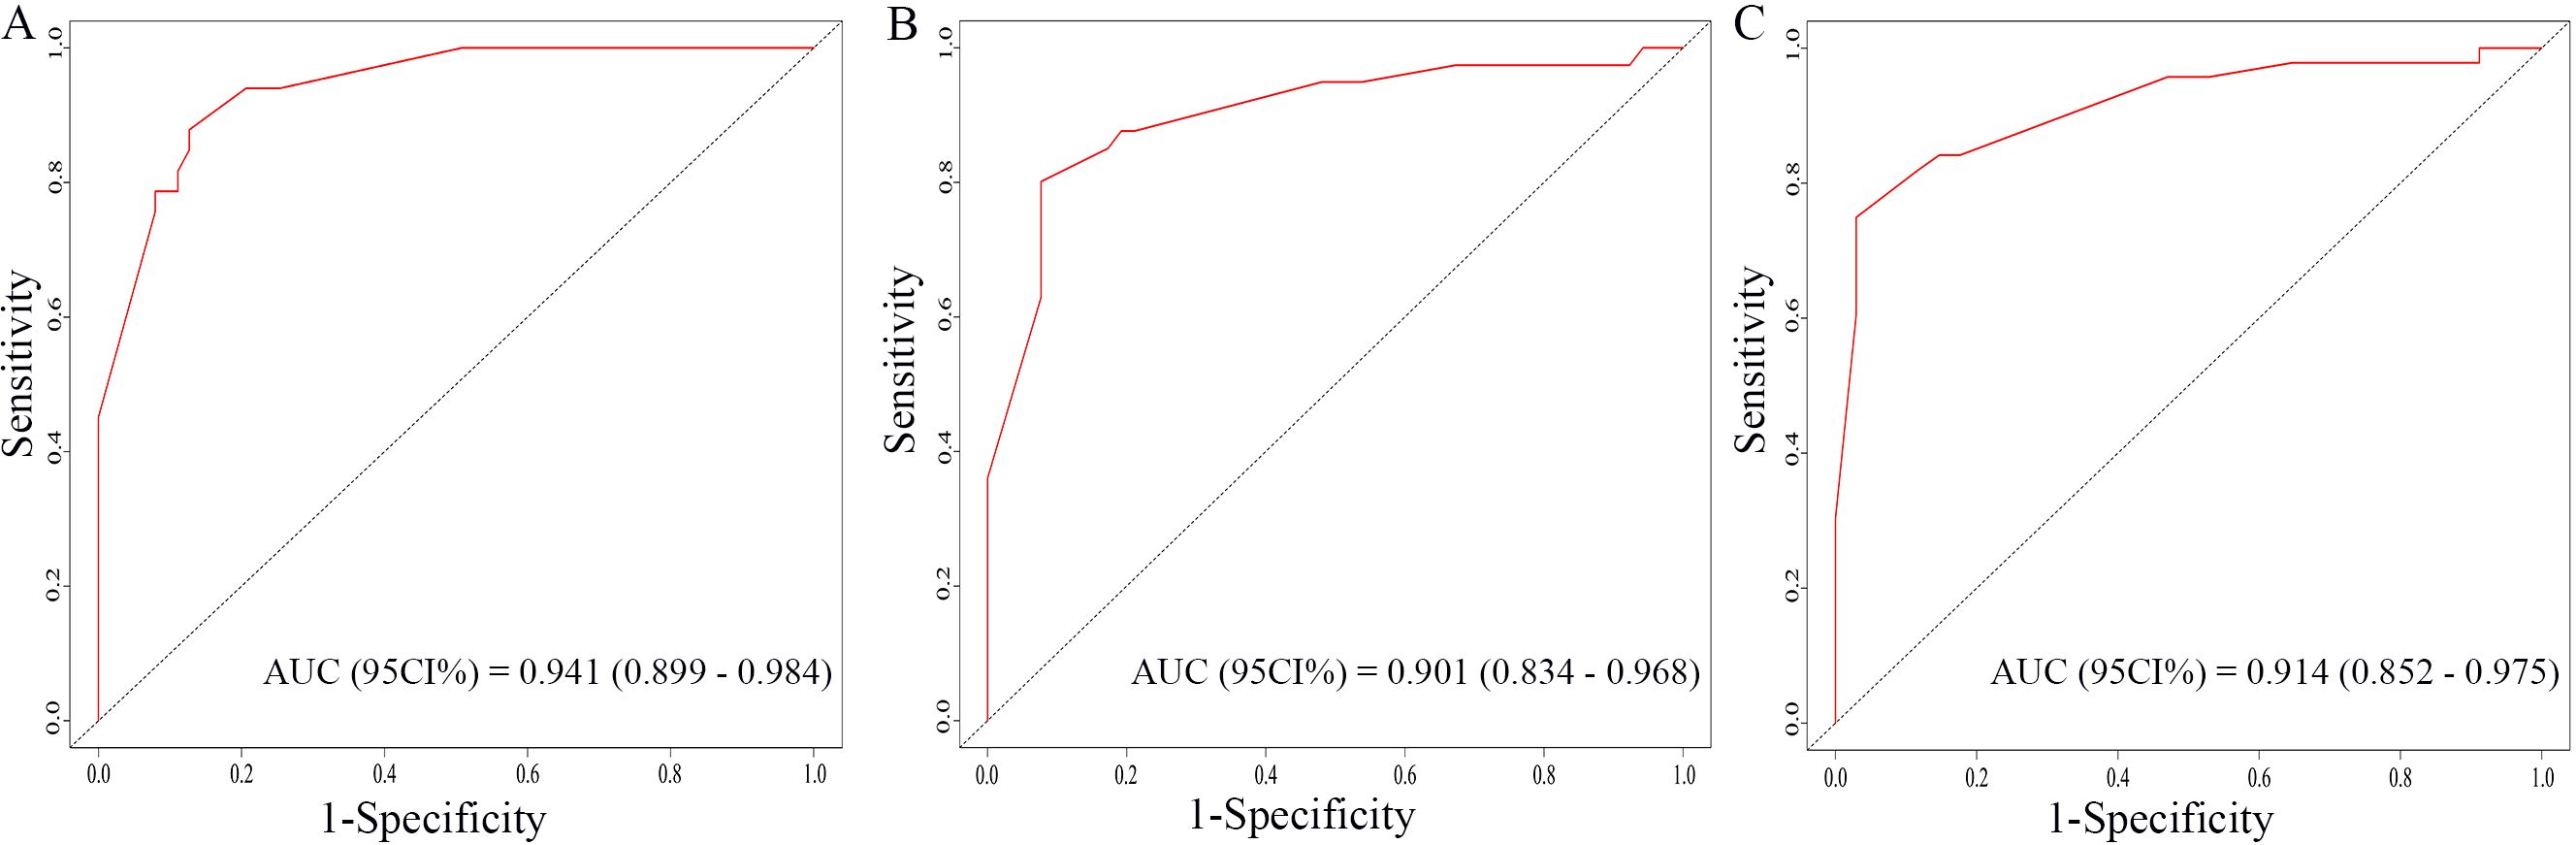
Figure 6. ROC curves of the nomogram for the 1-year, 3-year, and 5-year in the validation cohort (A–C).
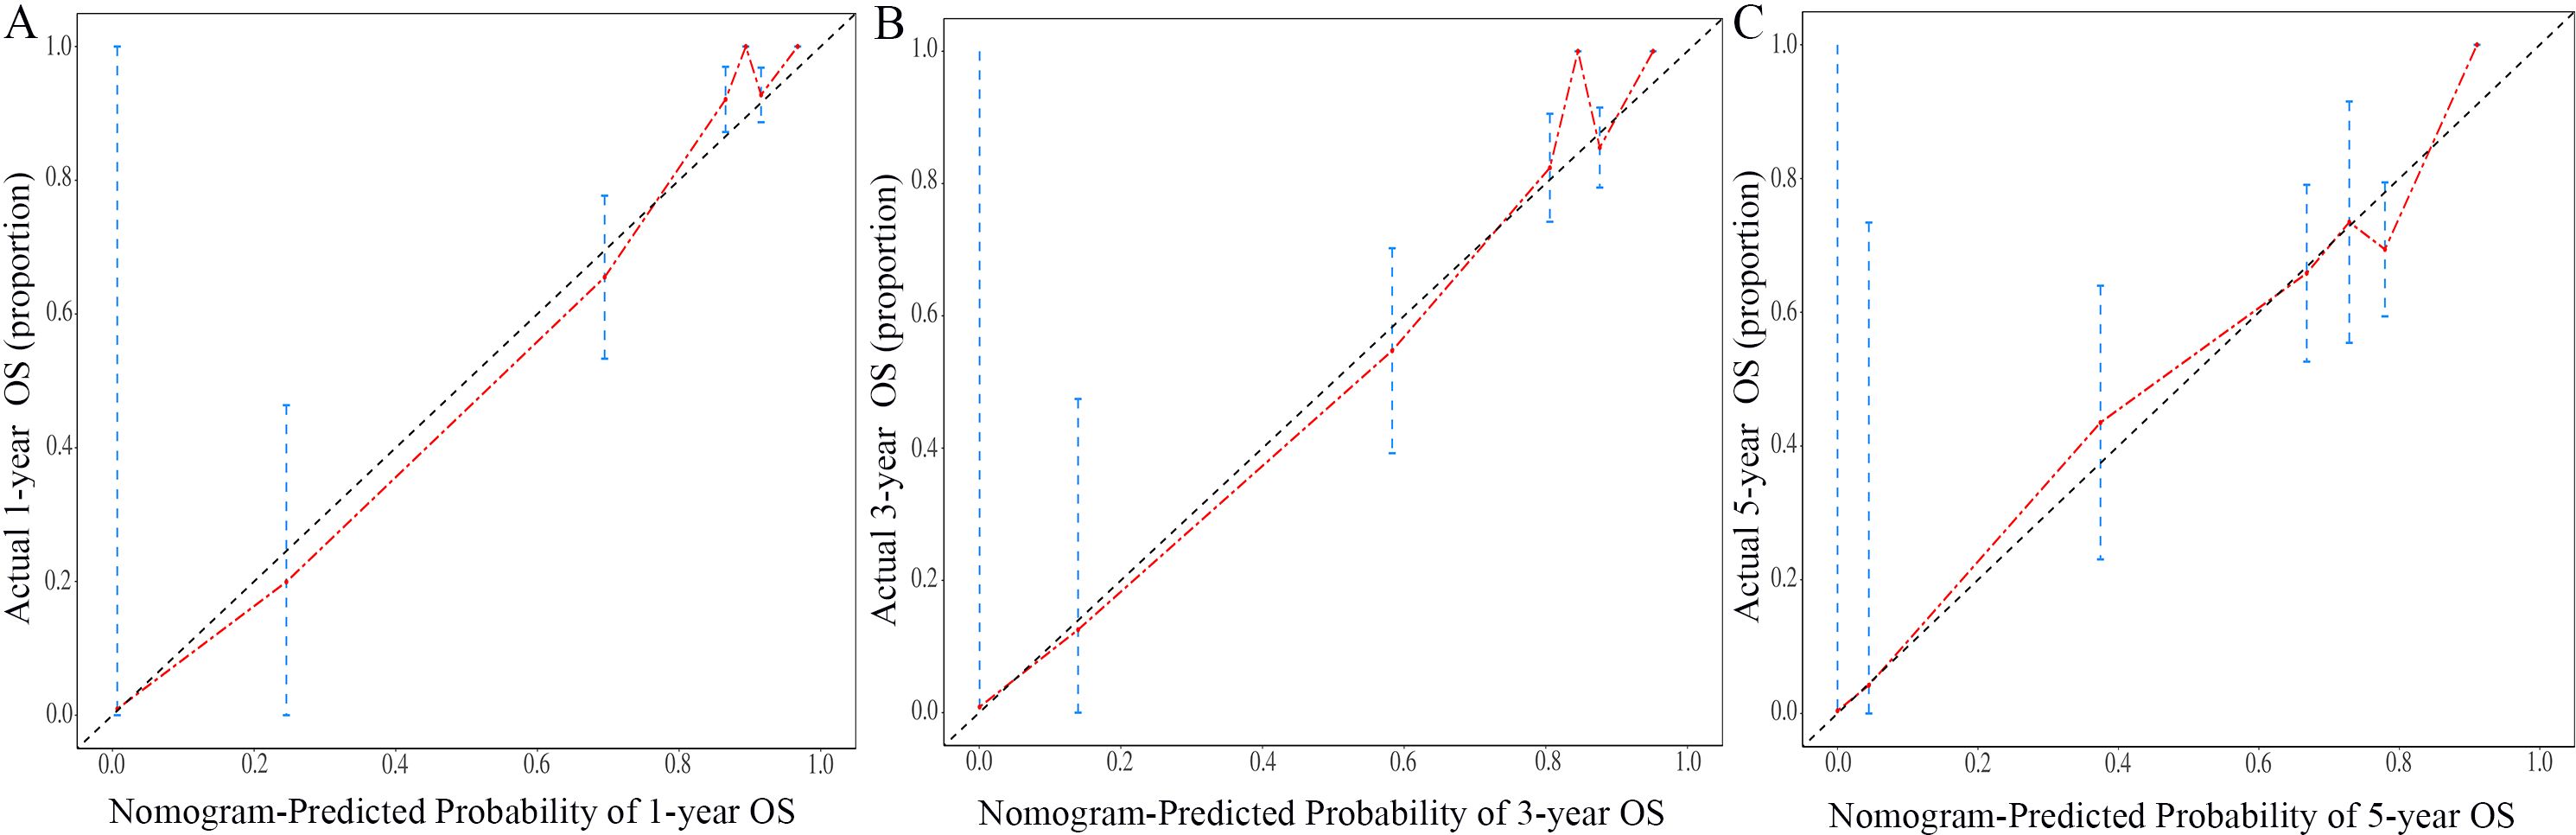
Figure 7. Calibration curves of the nomogram for the 1-year, 3-year, and 5-year in the training cohort (A–C).
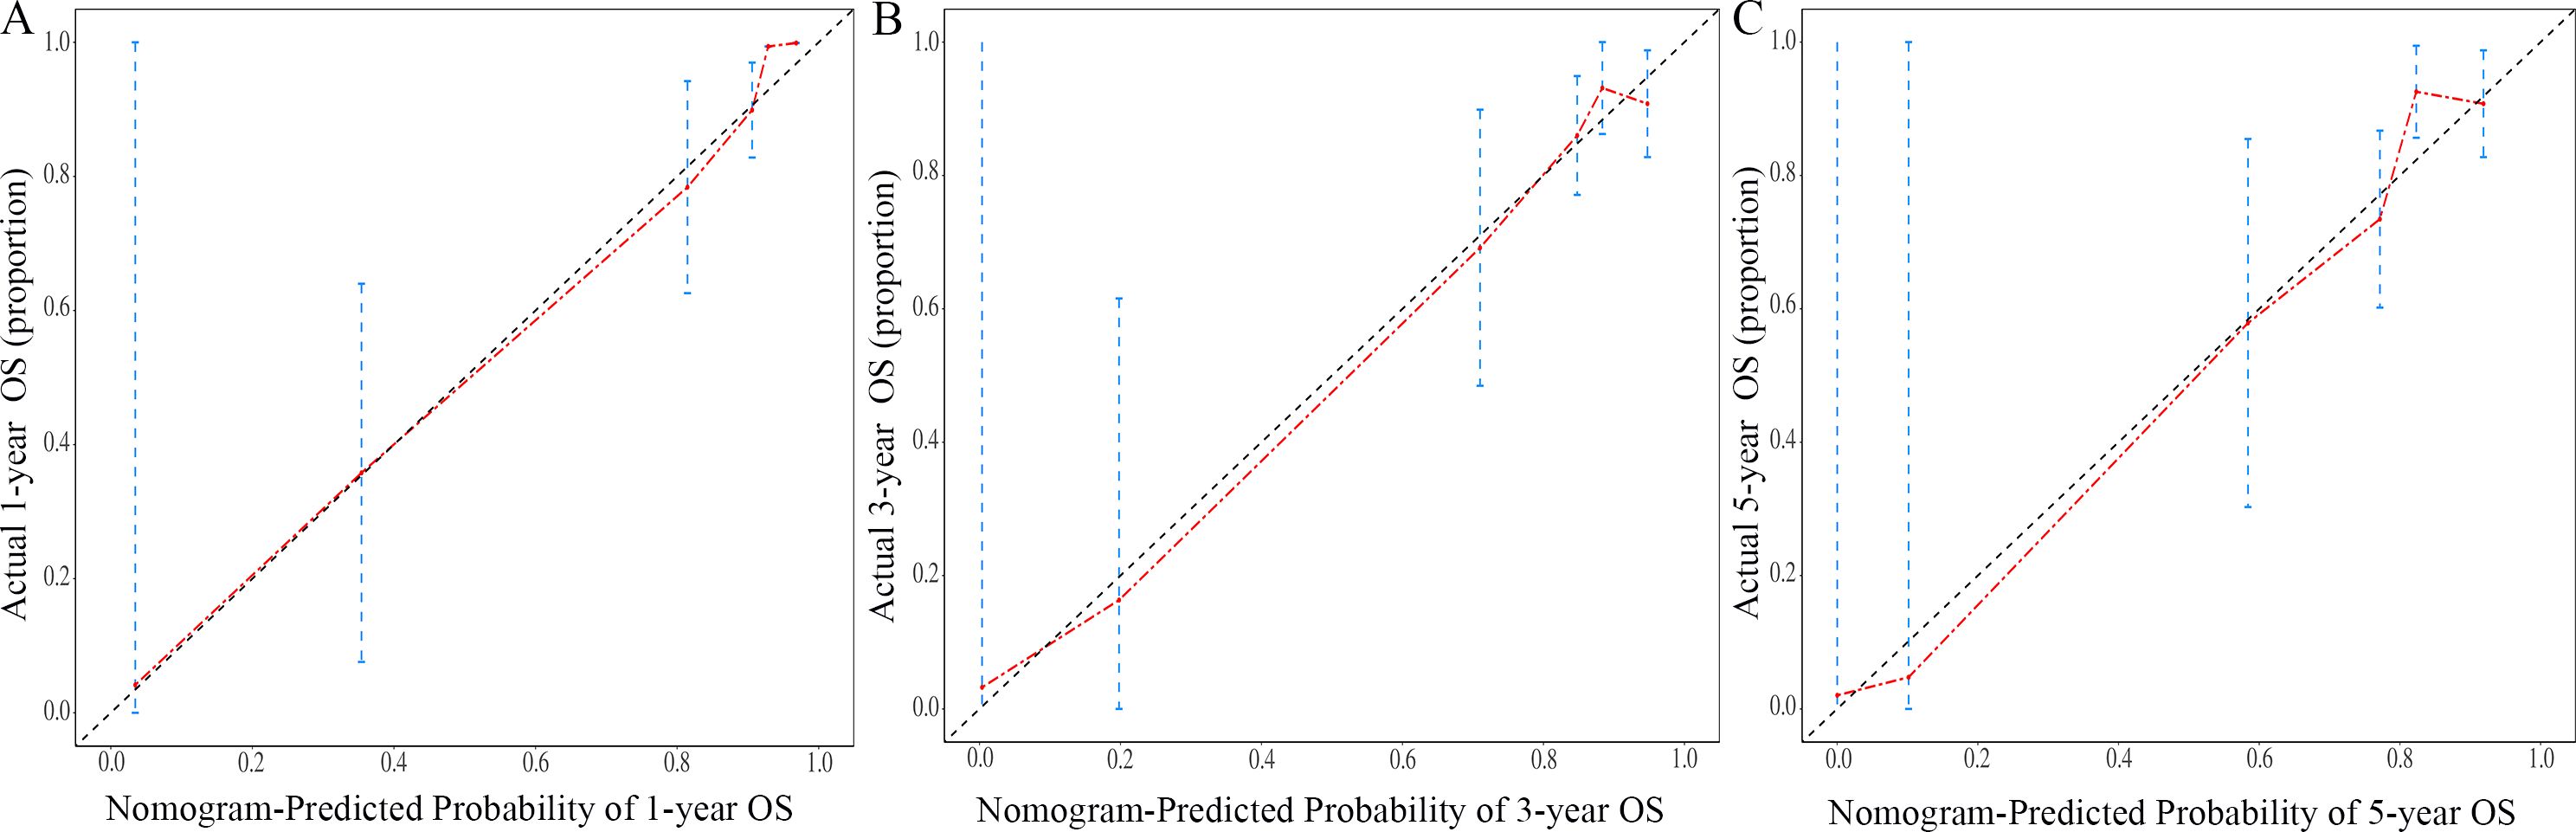
Figure 8. Calibration curves of the nomogram for the 1-year, 3-year, and 5-year in the validation cohort (A–C).
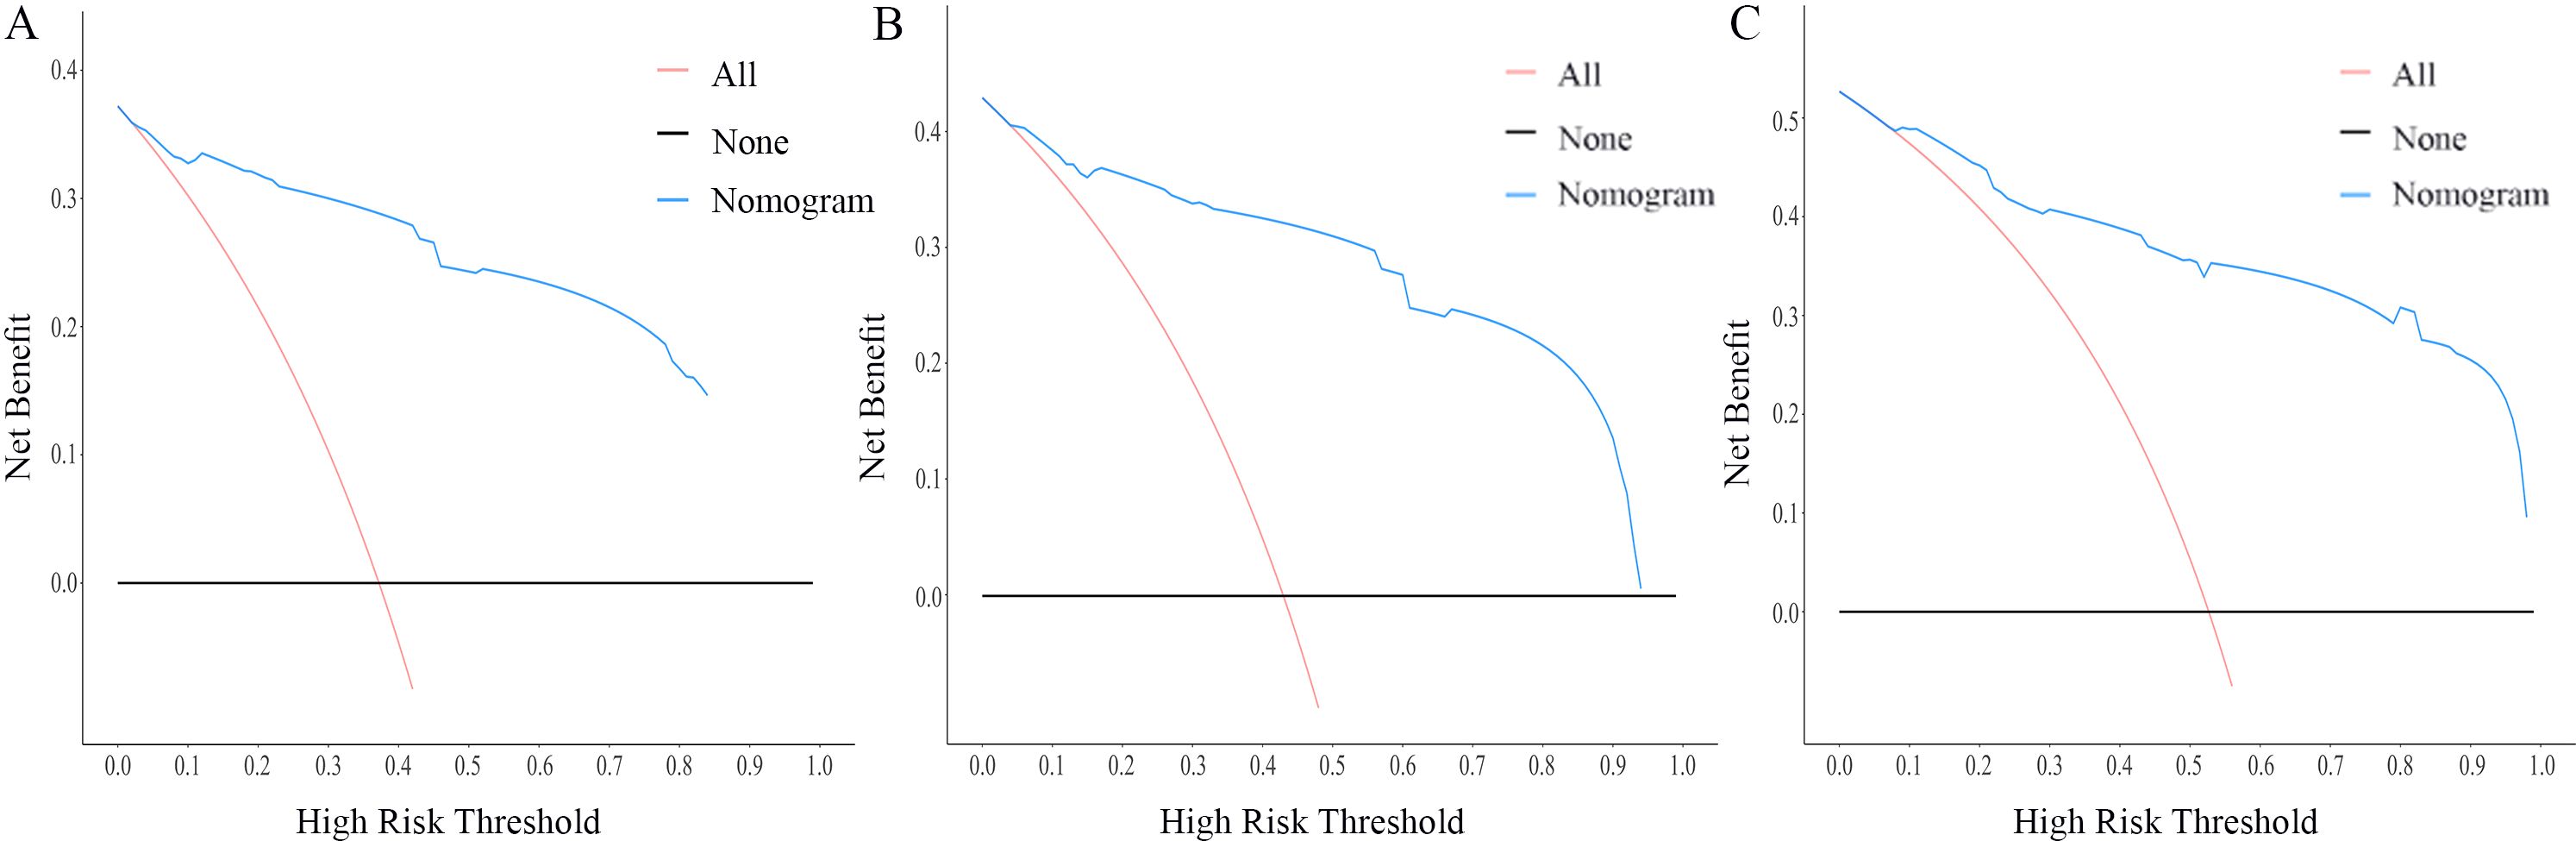
Figure 9. DCA curves of the nomogram for the 1-year, 3-year, and 5-year in the training cohort (A–C).
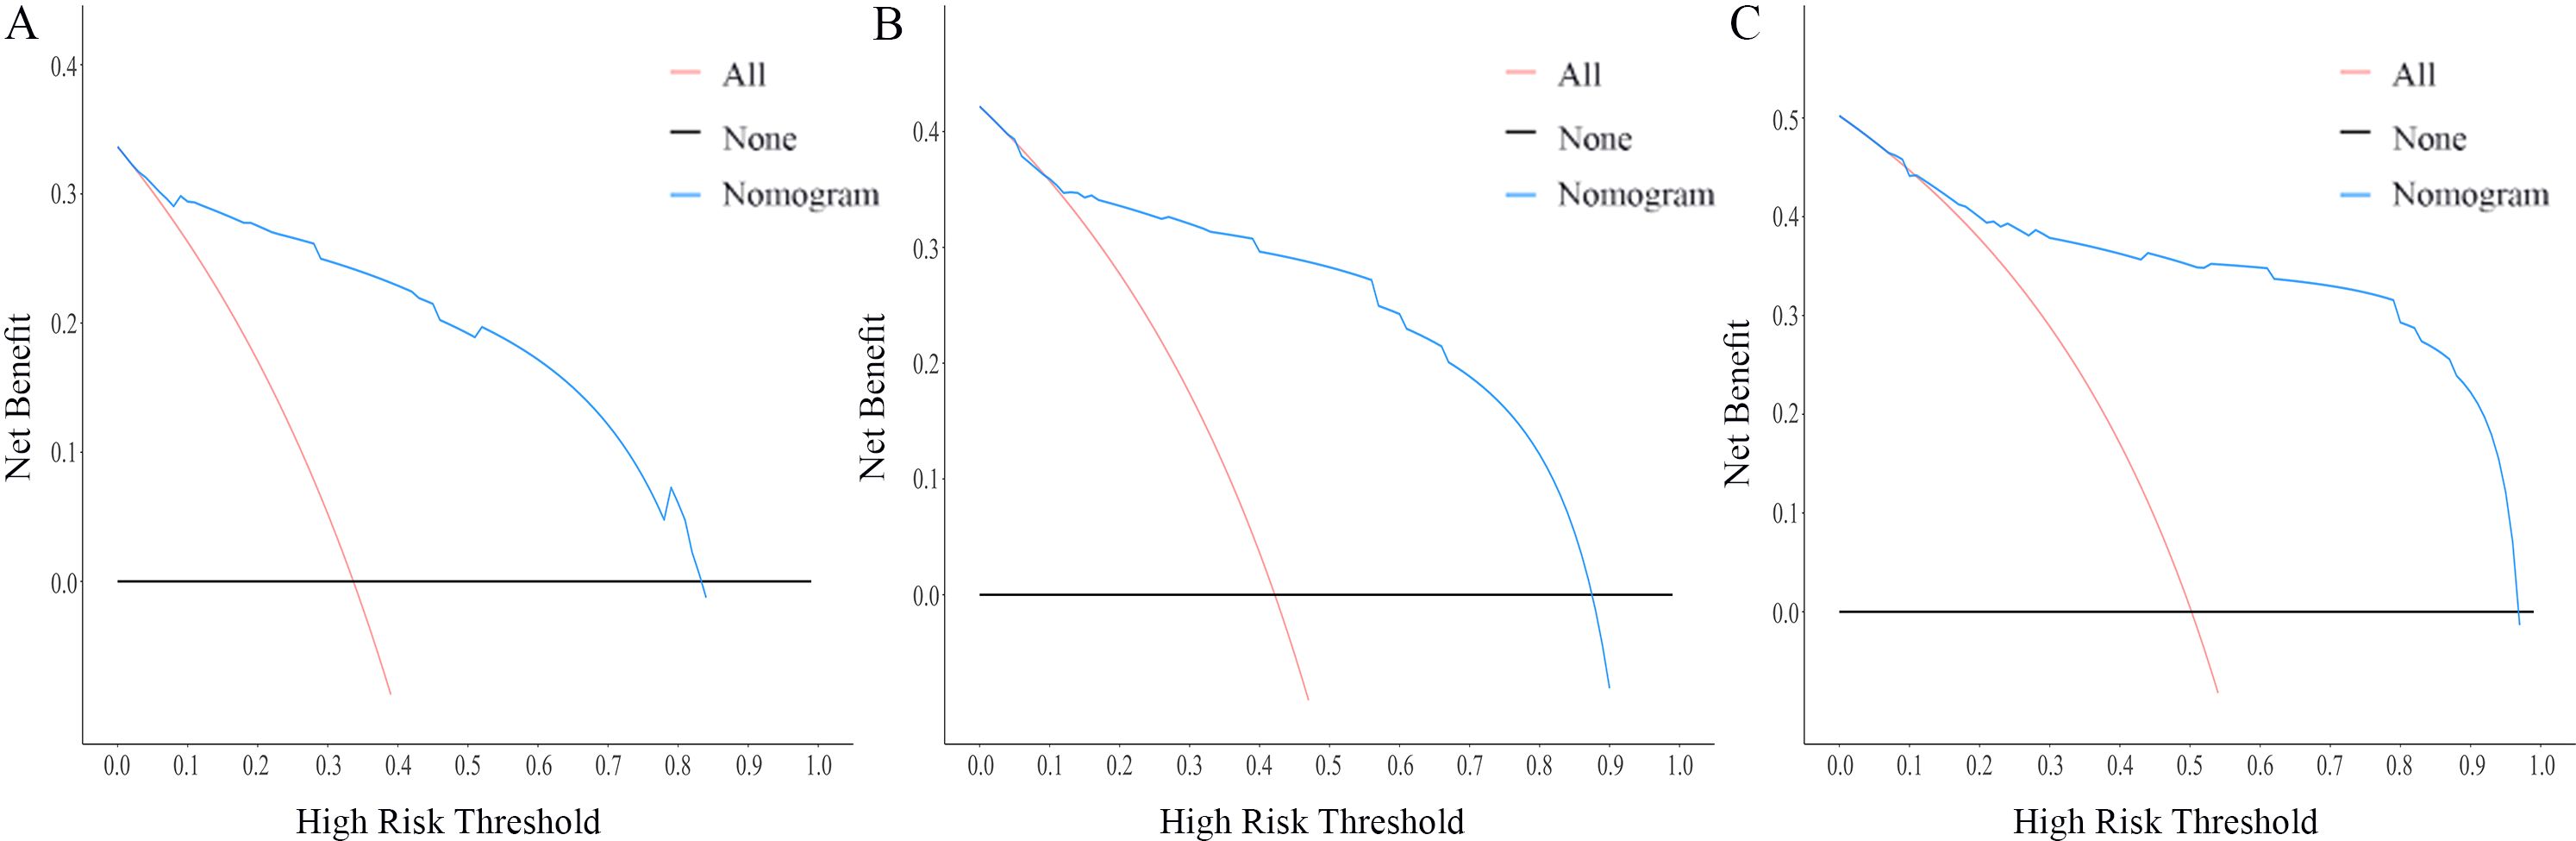
Figure 10. DCA curves of the nomogram for the 1-year, 3-year, and 5-year in the validation cohort (A–C).
4 Discussion
TC accounts for 2.3% of all new cancer cases in 2022, according to SEER, with a 5-year relative survival rate of 98.4% (17). Furthermore, TC is expected to surpass colorectal cancer and become the fourth most prevalent cancer by 2030, ranking second only to breast, prostate, and lung cancers (18). While the OS rate of TC patients has improved due to early detection and corresponding treatment (19, 20), the management of DM remains challenging, with a 10-year OS as low as 32%. Therefore, this study aimed to analyze the clinicopathological features of TC patients without lymph node metastases but with DM. The findings revealed associations between age at diagnosis, grade, histology, T stage, surgery, and the presence of DM in patients without lymph node metastasis. These findings can assist clinicians in better understanding the clinical manifestations and risk factors of TC patients with DM and N0, enabling early identification, improved risk stratification, and appropriate treatment to improve OS.
It is widely recognized that the overall prognosis for TC, especially differentiated TC, is generally favorable. Advances in physical examinations and imaging technology have led to increased detection of early-stage TC, particularly those with tumor diameters less than 1cm. These patients often do not exhibit lymph node metastasis, and the preferred surgical approach chosen by clinicians is usually unilateral lobectomy and central lymph node dissection (21, 22). However, our study analyzing the SEER database, which included 18,504 patients, identified 350 cases of M1, accounting for nearly 2% of the study population. While this percentage may not initially appear significant, it is important to consider the rising incidence of TC and the fact that N0 patients with DM often experience more rapid disease progression and have a poorer prognosis. Therefore, the presence of N0M1 patients cannot be overlooked.
Currently, there is very limited research on the clinical treatment and outcomes of TC patients with DM, with most of the literature consisting of individual case reports. Thus, our study aimed to analyze clinicopathological variables of the 2% of patients (N0M1), with the goal of identifying potential risk factors and evaluating the prognosis of DM. By stratifying patients based on the nomogram, clinicians can tailor treatment and follow-up strategies. Specifically, for high-risk patients, preoperative imaging of potential metastatic sites, such as lung CT, bone scanning, etc., may allow early detection and timely intervention, improving prognosis.
Additionally, for high-risk individuals, individualized adjustments to surgical methods and postoperative treatment strategies should be made to optimize patient outcomes. Although N0M1 patients accounted for only 2% of the total cohort in this study, pathological analysis showed that 30.2% (98/324) of ATC patients were N0M1 patients, 4.7% (91/1952) of FTC patients, 2.2% (2/90) of MTC patients, and approximately 1.0% (159/16138) of PTC patients. These findings emphasize the relatively higher proportion of N0M1 patients among ATC cases, highlighting the critical importance of precise treatment for high-risk N0M1 patients across different pathological types. Consensus guidelines typically recommend total thyroidectomy and regional lymph node dissection as the primary treatment for patients with DTC and DM. Surgical intervention is performed for metastatic lesions that are amenable to cure, followed by radioactive iodine (RAI) therapy using I-131 (22). TSH suppression therapy is administered to stable or slowly progressing asymptomatic patients. For those who cannot be cured by surgery or RAI, tyrosine kinase inhibitors (TKIs) such as sorafenib and lenvatinib are used, with evidence showing that TKI therapy extend the survival of patients with distant metastatic DTC (23–25). In the case of MTC, the primary focus lies in treating the primary lesion. For hereditary MTC, total thyroidectomy is typically the initial approach. In sporadic MTC cases, where the lesion often affects both sides, it is commonly recommended to opt for total thyroidectomy as the initial surgical intervention. However, the necessity of surgical treatment for DM in MTC remains controversial. Treatment options for MTC include targeted therapy and radiation. Targeted drugs like vandetanib and cabozantinib have shown efficacy in some cases by slowing tumor growth (26, 27). As for ATC, the 2021 guidelines from the American Thyroid Association emphasize that early evaluation of tumor mutations is crucial for expanding treatment options. The treatment strategy for ATC also encompasses chemotherapy and radiation therapy, with personalized targeted therapy, while personalized targeted therapy utilizing tumor genome information has progressively become the predominant treatment approach (28).
Hence, for TC patients at a high risk of DM, early and precise tumor staging and comprehensive systemic assessment are essential in formulating personalized treatment plans. However, the overall favorable prognosis of TC may sometimes lead surgeons to overlook comprehensive preoperative assessments. As a result, some N0M1 patients may not receive the recommended treatment of complete thyroidectomy followed by RAI, which can negatively impact their prognosis and OS (29). Hence, the findings of this study provide valuable guidance for clinical decision-making. For instance, when encountering patients aged ≥55 years, those with high-grade tumors, MTC, ATC, or advanced T stage in clinical practice, it is crucial to enhance preoperative evaluations to avoid missed diagnoses during the initial treatment. Such improvements can significantly influence the patient’s staging, treatment approach, and ultimate prognosis.
However, it is important to recognize the limitations of this study, which should be addressed in future research. Firstly, this study is retrospective in nature, introducing inherent selection bias. Secondly, the predictor of pathological types had a slightly lower weight on prognosis, which seems to differ from conventional understanding. This discrepancy could be due to significant variations in case numbers among the different pathological types included. If the number of cases is sufficient, subgroup analysis should also be performed for different pathological types. Thirdly, despite the SEER database containing approximately 28% of population-based cancer registries, other potential predictors such as thyroid function, gene status (BRAF, RET, RAS and P53, etc.), the extent of surgery and angioinvasion were not included in the analysis. Studies indicate that genes like BRAF are associated with an increased risk of extrathyroidal extension, lymph node metastasis, advanced disease, and recurrence (30, 31). Furthermore, angioinvasion is also closely linked to DM and may predict the efficacy of systemic RAI therapy (32, 33). Incorporating these factors can significantly enhance the predictive accuracy of the model, enabling clinicians to formulate more precise treatment strategies. Lastly, the lack of an external validation cohort is a notable limitation, limiting the reliability and clinical applicability to some extent. Therefore, future studies should aim to include more cases and predictors, as well as collect data from multiple centers to enhance credibility and applicability.
5 Conclusion
In conclusion, the N0 status with DM is a unique scenario that requires intensive study. This study is the first to identify potential clinicopathological features associated with DM in N0 patients and construct a prognosis nomogram for patients diagnosed with DM. Although there are some limitations in this study, the relevant statistical analysis and prediction model have shown good predictive effects, assisting clinicians in estimating the risk of DM and predicting prognosis. It is widely believed that with the inclusion of more data and predictors in future studies, the nomogram will demonstrate even greater clinical applicability.
Data availability statement
Publicly available datasets were analyzed in this study. This data can be found here: https://seer.cancer.gov/seerstat/.
Author contributions
XY: Conceptualization, Data curation, Methodology, Writing – original draft. QD: Conceptualization, Methodology, Writing – original draft. XG: Conceptualization, Methodology, Writing – original draft. LH: Conceptualization, Methodology, Writing – original draft. DH: Writing – review & editing. LY: Writing – review & editing.
Funding
The author(s) declare financial support was received for the research, authorship, and/or publication of this article. This study was supported by the Senior Medical Talents Program of Chongqing for Young and Middle-aged, the Science and Technology Bureau of Chongqing (grant no.CSTB2022NSCQ-MSX0055 and CSTB2024NSCQ-MSX0331), and the Kuanren Talents Program of the Second Affiliated Hospital of Chongqing Medical University.
Acknowledgments
The authors acknowledge the efforts of the SEER Program tumor registries in the creation of the SEER database and thank all the patients analyzed in this study.
Conflict of interest
The authors declare that the research was conducted in the absence of any commercial or financial relationships that could be construed as a potential conflict of interest.
Generative AI statement
The author(s) declare that no Generative AI was used in the creation of this manuscript.
Publisher’s note
All claims expressed in this article are solely those of the authors and do not necessarily represent those of their affiliated organizations, or those of the publisher, the editors and the reviewers. Any product that may be evaluated in this article, or claim that may be made by its manufacturer, is not guaranteed or endorsed by the publisher.
References
1. Hurst Z, Liyanarachchi S, He H, Brock P, Sipos J, Nabhan F, et al. Risk haplotypes uniquely associated with radioiodine-refractory thyroid cancer patients of high African ancestry. Thyroid. (2019) 29:530–9. doi: 10.1089/thy.2018.0687
2. Kim J, Gosnell JE, Roman SA. Geographic influences in the global rise of thyroid cancer. Nat Rev Endocrinol. (2020) 16(1):17–29. doi: 10.1038/s41574-019-0263-x
3. Li M, Dal Maso L, Vaccarella S. Global trends in thyroid cancer incidence and the impact of overdiagnosis. Lancet Diabetes Endocrinol. (2020) 8:468–70. doi: 10.1016/S2213-8587(20)30115-7
4. Lubitz CC, Sosa JA. The changing landscape of papillary thyroid cancer: Epidemiology, management, and the implications for patients. Cancer. (2016) 122:3754–9. doi: 10.1002/cncr.30201
5. Kim H, Park SY, Jung J, Kim JH, Hahn SY, Shin JH, et al. Improved survival after early detection of asymptomatic distant metastasis in patients with thyroid cancer. Sci Rep. (2019) 9:18745. doi: 10.1038/s41598-019-55370-w
6. Husemann Y, Geigl JB, Schubert F, Musiani P, Meyer M, Burghart E, et al. Systemic spread is an early step in breast cancer. Cancer Cell. (2008) 13:58–68. doi: 10.1016/j.ccr.2007.12.003
7. Yeh AC, Ramaswamy S. Mechanisms of cancer cell dormancy–another hallmark of cancer? Cancer Res. (2015) 75:5014–22. doi: 10.1158/0008-5472.CAN-15-1370
8. Fuhrmann C, Polzer B, Petronio M, Eils R, Klein CA. Genomic analysis of single cytokeratin-positive cells from bone marrow reveals early mutational events in breast cancer. Cancer Cell. (2005) 8:227–39. doi: 10.1016/j.ccr.2005.08.003
9. Kim MY, Oskarsson T, Acharyya S, Nguyen DX, Zhang XH, Norton L, et al. Tumor self-seeding by circulating cancer cells. Cell. (2009) 139:1315–26. doi: 10.1016/j.cell.2009.11.025
10. Sampieri K, Fodde R. Cancer stem cells and metastasis. Semin Cancer Biol. (2012) 22:187–93. doi: 10.1016/j.semcancer.2012.03.002
11. Valent P, Bonnet D, Wohrer S, Andreeff M, Copland M, Chomienne C, et al. Heterogeneity of neoplastic stem cells: theoretical, functional, and clinical implications. Cancer Res. (2013) 73:1037–45. doi: 10.1158/0008-5472.CAN-12-3678
12. Thiele J-A, Bethel K, Králíčková M, Kuhn P. Circulating tumor cells: fluid surrogates of solid tumors. Annu Rev Pathol: Mech Dis. (2017) 12:419–47. doi: 10.1146/annurev-pathol-052016-100256
13. Wang W, Shen C, Yang Z. Nomogram individually predicts the risk for distant metastasis and prognosis value in female differentiated thyroid cancer patients: A SEER-based study. Front Oncol. (2022) 12:800639. doi: 10.3389/fonc.2022.800639
14. Tang J, Jiang S, Gao L, Xi X, Zhao R, Lai X, et al. Construction and validation of a nomogram based on the log odds of positive lymph nodes to predict the prognosis of medullary thyroid carcinoma after surgery. Ann Surg Oncol. (2021) 28:4360–70. doi: 10.1245/s10434-020-09567-3
15. Huang X, Luo Z, Liang W, Xie G, Lang X, Gou J, et al. Survival nomogram for young breast cancer patients based on the SEER database and an external validation cohort. Ann Surg Oncol. (2022) 29:5772–81. doi: 10.1245/s10434-022-11911-8
16. Surveillance, Epidemiology, and End Results (SEER). Available online at: http://www.seer.cancer.gov (Accessed September 2, 2021).
17. National Cancer Institute. Surveillance E, and End Results Program, in: Cancer stat facts: thyroid cancer (2022). Available online at: https://seer.cancer.gov/statfacts/html/thyro.html (Accessed Oct 23, 2022).
18. Rahib L, Smith BD, Aizenberg R, Rosenzweig AB, Fleshman JM, Matrisian LM. Projecting cancer incidence and deaths to 2030: the unexpected burden of thyroid, liver, and pancreas cancers in the United States. Cancer Res. (2014) 74:2913–21. doi: 10.1158/0008-5472.CAN-14-0155
19. Giovanella L, Ceriani L. High-sensitivity human thyroglobulin (hTG) immunoradiometric assay in the follow-up of patients with differentiated thyroid cancer. Clin Chem Lab Med. (2002) 40(5):480–4. doi: 10.1515/cclm.2002.083
20. Schlumberger MJ. Papillary and follicular thyroid carcinoma. New Engl J Med. (1998) 338:297–306. doi: 10.1056/nejm199801293380506
21. Bilimoria KY, Bentrem DJ, Ko CY, Stewart AK, Winchester DP, Talamonti MS, et al. Extent of surgery affects survival for papillary thyroid cancer. Ann Surg. (2007) 246:375–81. doi: 10.1097/SLA.0b013e31814697d9
22. Haugen BR, Alexander EK, Bible KC, Doherty GM, Mandel SJ, Nikiforov YE, et al. 2015 American thyroid association management guidelines for adult patients with thyroid nodules and differentiated thyroid cancer: the American thyroid association guidelines task force on thyroid nodules and differentiated thyroid cancer. Thyroid. (2016) 26:1–133. doi: 10.1089/thy.2015.0020
23. Fountzilas G, Fragkoulidi A, Kalogera-Fountzila A, Nikolaidou M, Bobos M, Calderaro J, et al. A phase II study of sunitinib in patients with recurrent and/or metastatic non-nasopharyngeal head and neck cancer. Cancer Chemother Pharmacol. (2009) 65:649–60. doi: 10.1007/s00280-009-1070-1
24. Schlumberger M, Tahara M, Wirth LJ. Lenvatinib in radioiodine-refractory thyroid cancer. N Engl J Med. (2015) 372:1868. doi: 10.1056/NEJMc1503150
25. Iwasaki H, Yamazaki H, Takasaki H, Suganuma N, Sakai R, Nakayama H, et al. Treatment outcomes of differentiated thyroid cancer with distant metastasis improve by tyrosine kinase inhibitors. Oncol Lett. (2019) 17(6):5292–5300. doi: 10.3892/ol.2019.10180
26. Wells SA Jr, Robinson BG, Gagel RF, Dralle H, Fagin JA, Santoro M, et al. Vandetanib in patients with locally advanced or metastatic medullary thyroid cancer: a randomized, double-blind phase III trial. J Clin Oncol. (2012) 30:134–41. doi: 10.1200/JCO.2011.35.5040
27. Elisei R, Schlumberger MJ, Müller SP, Schöffski P, Brose MS, Shah MH, et al. Cabozantinib in progressive medullary thyroid cancer. J Clin Oncol. (2013) 31:3639–46. doi: 10.1200/JCO.2012.48.4659
28. Bible KC, Kebebew E, Brierley J, Brito JP, Cabanillas ME, Clark TJ Jr, et al. American thyroid association guidelines for management of patients with anaplastic thyroid cancer. Thyroid. (2021) 31:337–86. doi: 10.1089/thy.2020.0944
29. Tam S, Amit M, Boonsripitayanon M, Busaidy NL, Cabanillas ME, Waguespack SG, et al. Effect of tumor size and minimal extrathyroidal extension in patients with differentiated thyroid cancer. Thyroid. (2018) 28:982–90. doi: 10.1089/thy.2017.0513
30. Nikiforova MN, Wald AI, Roy S, Durso MB, Nikiforov YE. Targeted next-generation sequencing panel (ThyroSeq) for detection of mutations in thyroid cancer. J Clin Endocrinol Metab. (2013) 98:E1852–60. doi: 10.1210/jc.2013-2292
31. Yip L, Sosa JA. Molecular-directed treatment of differentiated thyroid cancer: advances in diagnosis and treatment. JAMA Surg. (2016) 151:663–70. doi: 10.1001/jamasurg.2016.0825
32. Ghossein R. Problems and controversies in the histopathology of thyroid carcinomas of follicular cell origin. Arch Pathol Lab Med. (2009) 133:683–91. doi: 10.5858/133.5.683
Keywords: thyroid cancer, distant metastasis, risk factor, nomogram, overall survival
Citation: Yu X, Deng Q, Gao X, He L, Hu D and Yang L (2025) A prognostic nomogram for distant metastasis in thyroid cancer patients without lymph node metastasis. Front. Endocrinol. 16:1523785. doi: 10.3389/fendo.2025.1523785
Received: 06 November 2024; Accepted: 28 January 2025;
Published: 17 February 2025.
Edited by:
Salvatore Sorrenti, Sapienza University of Rome, ItalyReviewed by:
Angelika Buczyńska, Medical University of Bialystok, PolandValerio D’Orazi, Sapienza University of Rome, Italy
Copyright © 2025 Yu, Deng, Gao, He, Hu and Yang. This is an open-access article distributed under the terms of the Creative Commons Attribution License (CC BY). The use, distribution or reproduction in other forums is permitted, provided the original author(s) and the copyright owner(s) are credited and that the original publication in this journal is cited, in accordance with accepted academic practice. No use, distribution or reproduction is permitted which does not comply with these terms.
*Correspondence: Daixing Hu, MzA2NTk1QGhvc3BpdGFsLmNxbXUuZWR1LmNu; Lu Yang, MzAyMTE4QGhvc3BpdGFsLmNxbXUuZWR1LmNu
†These authors have contributed equally to this work