 Adrian Bartoszek1
 Magdalena Sawic2
 Karol Pierzchała3Aleksandra Kudrycka3Piotr Białasiewicz3
 Wojciech Kuczyński3*
- 1Department of Bioanalytics, Medical University of Lublin, Lublin, Poland
- 2Independent Unit of Spectroscopy and Chemical Imaging, Medical University of Lublin, Lublin, Poland
- 3Department of Sleep Medicine and Metabolic Disorders, Medical University of Lodz, Lodz, Poland
Background: Sexual activity has been linked to various physical and psychological benefits, yet national surveys indicate a decrease in sexual engagement among American adults from the late 1990s to the early 2010s. The 2D:4D ratio, representing the relative lengths of the second and fourth digits, is commonly used as a biomarker for prenatal androgen exposure (PAE). This ratio may offer insights into the hormonal environment during fetal development, which could impact sexual attitudes and mental well-being. This study aimed to explore the associations between PAE, inferred via 2D:4D ratio, and various psychosocial factors, including sexual attitudes, mental health, and self-reported sexual satisfaction.
Methods: A cohort of male and female participants was assessed for 2D:4D ratios on both hands. Questionnaires captured a range of psychosocial and sexual measures, including the Arizona Sexual Experiences Scale (ASEX), the Sexual Satisfaction Questionnaire (SSI), the Sapiosexual Questionnaire (SapioQ), the Kinsey Scale for sexual orientation, and tools assessing mental health and quality of life (SF-12, PHQ-9, GAD-7, MDQ, PSQI). Statistical analyses were conducted to identify correlations between PAE, mental health, and sexuality, with gender differences considered.
Results: Women reported higher ASEX and SSI scores but lower SF-12 mental and physical health scores than men, consistent with smaller 2D:4D effect sizes reported in previous research. Overall, PAE did not correlate strongly with general mental health or sexual satisfaction. However, high PAE was associated with a greater openness to casual relationships, particularly among women, while low-PAE individuals prioritized intelligence over physical traits in partner preferences.
Conclusions: These findings suggest that PAE, as measured by the 2D:4D ratio, may be associated with certain adult psychosocial traits. Although correlations were weak, this study contributes to understanding the subtle role of PAE in shaping sexual attitudes and mental health, highlighting the need for further research in more diverse populations.
1 Introduction
Sexual function is a critical component of overall quality of life, with androgens playing a key role in its regulation for both men and women. Testosterone, often regarded as a male hormone, is vital for both sexes. It influences numerous physiological processes, including mood, motivation, muscle strength, cognitive performance, and memory formation (1). In a seminal study, Manning et al. proposed that a lower 2D:4D ratio, defined as the length ratio of the second to the fourth digit, indicates elevated prenatal testosterone exposure in humans (2). This parameter, also known as the digit ratio (DR), is proposed to reflect sexual satisfaction. A higher exposure to testosterone and a lower exposure to estrogen hormones are associated with a lower 2D:4D ratio (3). The DR remains relatively stable from birth or early infancy and shows no significant correlation with adult sex hormone levels. Rather than reflecting androgen concentrations, it appears to be associated with androgen sensitivity. Research has linked variations in DR to a wide range of behavioral traits (assertiveness, aggression, and anxiety), physiological characteristics (obesity, handedness, and sperm count), and various health outcomes (4). Moreover, several diseases from various medical branches have been correlated to the DR. To comprehend the neurobiological processes underlying sexual disorders fully, it is essential to understand the role of sex hormones during the prenatal period and how these hormones interact with sexual predispositions. The single finger lengths may also be a marker of the exposure. Literature emphasizes the importance of raw data (like single finger lengths) to improve accuracy and ensure the reliability of findings across different methodologies (5). Analyzing single finger lengths allows researchers to explore whether observed sex differences in traits are driven by absolute finger lengths, the 2D:4D ratio, or both. This is particularly relevant when assessing the robustness of sex-dimorphic traits.
The Organizational and Activational Hypothesis posits that the effects of sex hormones on behavior are twofold: early in development, they organize the brain and body in a sex-specific manner, and later in life, hormonal changes, particularly during puberty, activate these structures (6). This theory suggests that both prenatal hormone exposure and adult hormone levels contribute to sexual differentiation and related behaviors. Some evidence supports the Organizational and Activational Hypothesis concerning human sexuality; however, these studies have notable limitations. For instance, a significant majority (93%) of 46XY individuals with androgen insensitivity syndrome (AIS) exhibit androphilia, meaning they are primarily attracted to men (7). Moreover, several researchers explored the association between 2D:4D and sexual orientation (8). To our best knowledge, Breedlove et al. were the leading team to find the correlation of DR in anfrophilic females and no association in men (9). Another interesting finding was a meta-analysis from Siegmann et al. (10). A meta-analysis, including 17 samples and over 3,600 participants, reinforced these findings, showing a significant difference in 2D:4D between male to female (MtF) transgender identity individuals and male controls. These findings suggest that variations in 2D:4D, particularly in MtF individuals, reflect the influence of PAE on gender identity, adding evidence to the role of early hormone environment in shaping sexual and gender preferences.
In this study, sexual function was assessed through the Arizona Sexual Experiences Scale (ASEX), a brief, five-item measure that provides self-reported insights into key areas of sexual activity, including sexual desire, arousal, erectile function, orgasmic ease, and satisfaction. To deepen the understanding of sexual health, additional assessments were employed, such as the Sexual Satisfaction Questionnaire (SSQ) across domains of Closeness, Petting, and Sex, along with the Sapiosexual Questionnaire (SapioQ) and the Sexual Satisfaction Index (SSI), offering a comprehensive view of individual sexual function. The primary aim was to explore potential correlations between prenatal androgen exposure (PAE), indicated as the 2D:4D digit ratio (DR), and sexual disorders, using a broad range of assessments across sexuality, depression, anxiety, and sleep to capture the multifaceted aspects of sexual health and mental well-being.
2 Materials and methods
2.1 Study design
This study is part of the research project “Understanding the associations of PAE on sleep physiology, circadian proteins, anthropometric parameters, hormonal factors, quality of life and sex among healthy young adults – BOAT international, multicenter study (2021). This project involved collaboration with researchers from New Zealand, UK, and Japan. However, due to the challenges posed by the COVID-19 pandemic, data collection by the international teams was not feasible. Despite these setbacks, the Polish team successfully collected data, leading to the publication of the research protocol (8). Surveys were conducted from March 2020 to March 2022. The research protocol has been detailed in previous publications (8). Inclusion criteria consist of a full understanding of the study rules by the participant, confirmed by written informed consent to participate in the study and an age range of 18 to 30 years. Exclusion criteria consist of a diagnosis of chronic, hormonal, and mental health conditions, pregnancy and lactation, taking long-term medicines including hormonal contraception, injuries to the fingers of the upper limbs, deformation of the fingers of the upper limbs, diseases leading to deformation of the fingers of the upper limbs, and lack of consent or inability to follow recommendations related to participation in the study. Data was collected from 720 participants, with 290 completing all questionnaires. These respondents were subsequently invited to participate in a follow-up measurement session, with 138 attending and undergoing anthropometric measurements.
2.2 Measurements tools
Participants completed various questionaries, including:
● Demographic: Collected information on ethnicity, sex, and gender.
● Arizona Sexual Experiences Scale (ASEX): Validated five-item questionnaire designed to assess various aspects of sexual functioning, including sexual drive, arousal, penile erection or vaginal lubrication, ability to reach orgasm, and satisfaction with orgasm over the past week (11). The ASEX’s straightforward format allows for both self-reporting and clinician administration, making it a versatile tool for assessing sexual health.
● Sapiosexual Questionnaire (SapioQ) designed to assess individuals’ attraction to intelligence as a primary factor in their romantic and sexual preferences. This concept aligns with findings that suggest intelligence can significantly influence mate desirability, with research indicating that characteristics such as IQ can peak in desirability but may also exhibit threshold effects, where exceedingly high intelligence could detract from attractiveness (12).
● Sexual Satisfaction Questionnaire is a research tool designed to assess the level of sexual satisfaction within a relationship, with higher scores reflecting greater satisfaction. It consists of ten questions grouped into three main categories: closeness, petting, and sexual relations (13).
● Sexual Satisfaction Index (SSI) is a tool designed to measure an individual’s level of sexual satisfaction, with higher scores indicating a greater level of satisfaction. It serves not only to evaluate sexual satisfaction but also to explore its connection to overall quality of life, self-esteem, and relationship quality, making it valuable for both clinical assessments and research purposes (14).
● Kinsey Scale is a tool used to classify an individual’s sexual orientation on a continuum from exclusively heterosexual (0) to exclusively homosexual (6). This scale recognizes that sexual orientation is not binary but exists along a spectrum, allowing for a more nuanced understanding of human sexuality (15).
● Generalized Anxiety Disorder Screener (GAD-7) is a widely used seven-item screening tool for generalized anxiety disorder, quantifying the severity of anxiety symptoms experienced over the past two weeks (16).
● Mood Disorder Questionnaire (MDQ) is designed to screen for the presence of mood disorders, including bipolar disorder. It asks about a lifetime history of mood swings, diagnosis, and treatment, providing insights into the mental health status of participants (17).
● Patient Health Questionnaire-9 (PHQ-9) is a nine-item self-assessment tool for evaluating the severity of depressive symptoms in both clinical and research settings. It consists of nine items based on DSM-IV criteria for major depression, asking respondents to indicate the frequency of symptoms experienced over the past two weeks (18).
● Pittsburgh Sleep Quality Index (PSQI) assess sleep quality and disturbances over one month, evaluating seven domains: sleep latency, duration, efficiency, disturbances, medication use, daytime dysfunction, and overall sleep quality. This yields a comprehensive overview of an individual’s sleep patterns (19).
● Short Form Survey (SF-12) is a concise self-report questionnaire designed to assess health-related quality of life across two main dimensions: physical (PCS) and mental (MCS) health. Derived from the longer SF-36, the SF-12 retains essential items that allow it to effectively evaluate an individual’s perceived health status while being shorter and quicker to administer (20).
The direct measurements of the second and fourth fingers on both hands were performed by qualified staff using a sliding caliper (Vernier caliper) with an accuracy of 0.001 m. Based on the values of the fingers’ length, the 2D:4D index was calculated as a quotient of the length of the second digit and the fourth digit (mm). Measurements were performed on the palmar side of the hand using anthropometric points lying on the digit axis: pseudophalangion—a point in the finger metacarpophalangeal crease, dactylion—the most distal point on the fingertip. A 2D:4D ratio > 1 was considered as a low PAE, while a ratio <1 was considered as a high PAE. Handedness was defined via self-report.
2.3 Data collection
All participants were aware of the study conditions and gave informed consent to participate. Confidentiality and anonymity were maintained, and no data that could help identify a responder were collected. The study was conducted in accordance with the amended Declaration of Helsinki, and the Ethics Committee of the Medical University of Lodz approved the study protocol (RNN/394/19/KE); 2020/04/X/NZ4/00564.
2.4 Statistical analysis
Statistical analysis was performed using STATISTICA 13.1 (TIBCO, Palo Alto, Santa Clara, CA, USA). A level of 5% was used as a significance threshold for all the results unless stated otherwise. In the case of multiple testing, the Bonferroni correction was used. No data obtained had normal distribution (Shapiro–Wilk’s test, p < 0.05). The relationship between the independent subgroups was assessed using the Mann-Whitney U test, where the effect size was reported as r and interpreted as weak (r < 0.3), moderate (0.3 ≤ r < 0.5), or strong (r ≥ 0.5). In the tables, effect size was indicated using lowercase letters next to numerical values: w (weak), m (moderate), and s (strong). The relationship between continuous variables was assessed using the Spearman correlation coefficient. The false discovery rate (FDR) correction was applied when the Spearman correlation was used. If the p-value was not significant after FDR correction, an asterisk (*) was placed next to the corresponding value in the table.
3 Results
3.1 Study group
The study included 138 Polish students with an average age of 22.28 ± 1.99 years with no medical conditions and no previous hand-injury. Among them, 61.6% were women. 94.2% of the respondents were right-handed. Anthropometric measurements and PAE, considering the sex of the respondents, are presented in Table 1. Men have larger 2nd and 4th fingers, while women have a significantly larger 2D:4D ratio (Table 1). For subsequent analyses, measurements taken from the dominant hand were used.
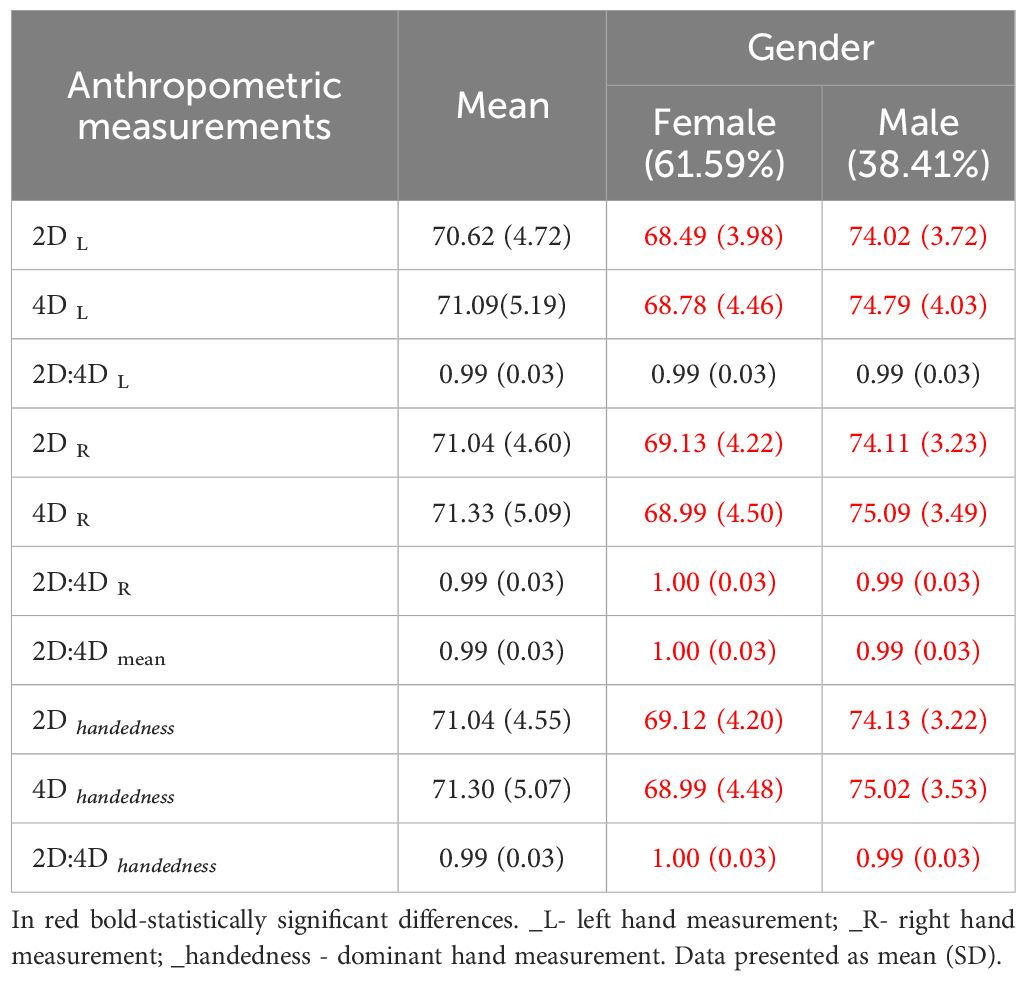
Table 1. Anthropometric measurements.
3.2 Relationship between anthropometric measurements, PAE, sexuality and mental disorders
Table 2 presents the average scores for the questionnaires used in the study. Women have significantly higher ASEX and SapioQ scores than men but lower SSQ (Sex), SF-12 (MCS) and SF-12 scores. No other gender differences were observed (Table 2). PAE (measured on the dominant hand) does not differentiate any of the questionnaires used in the study, also when considering gender (Table 2).
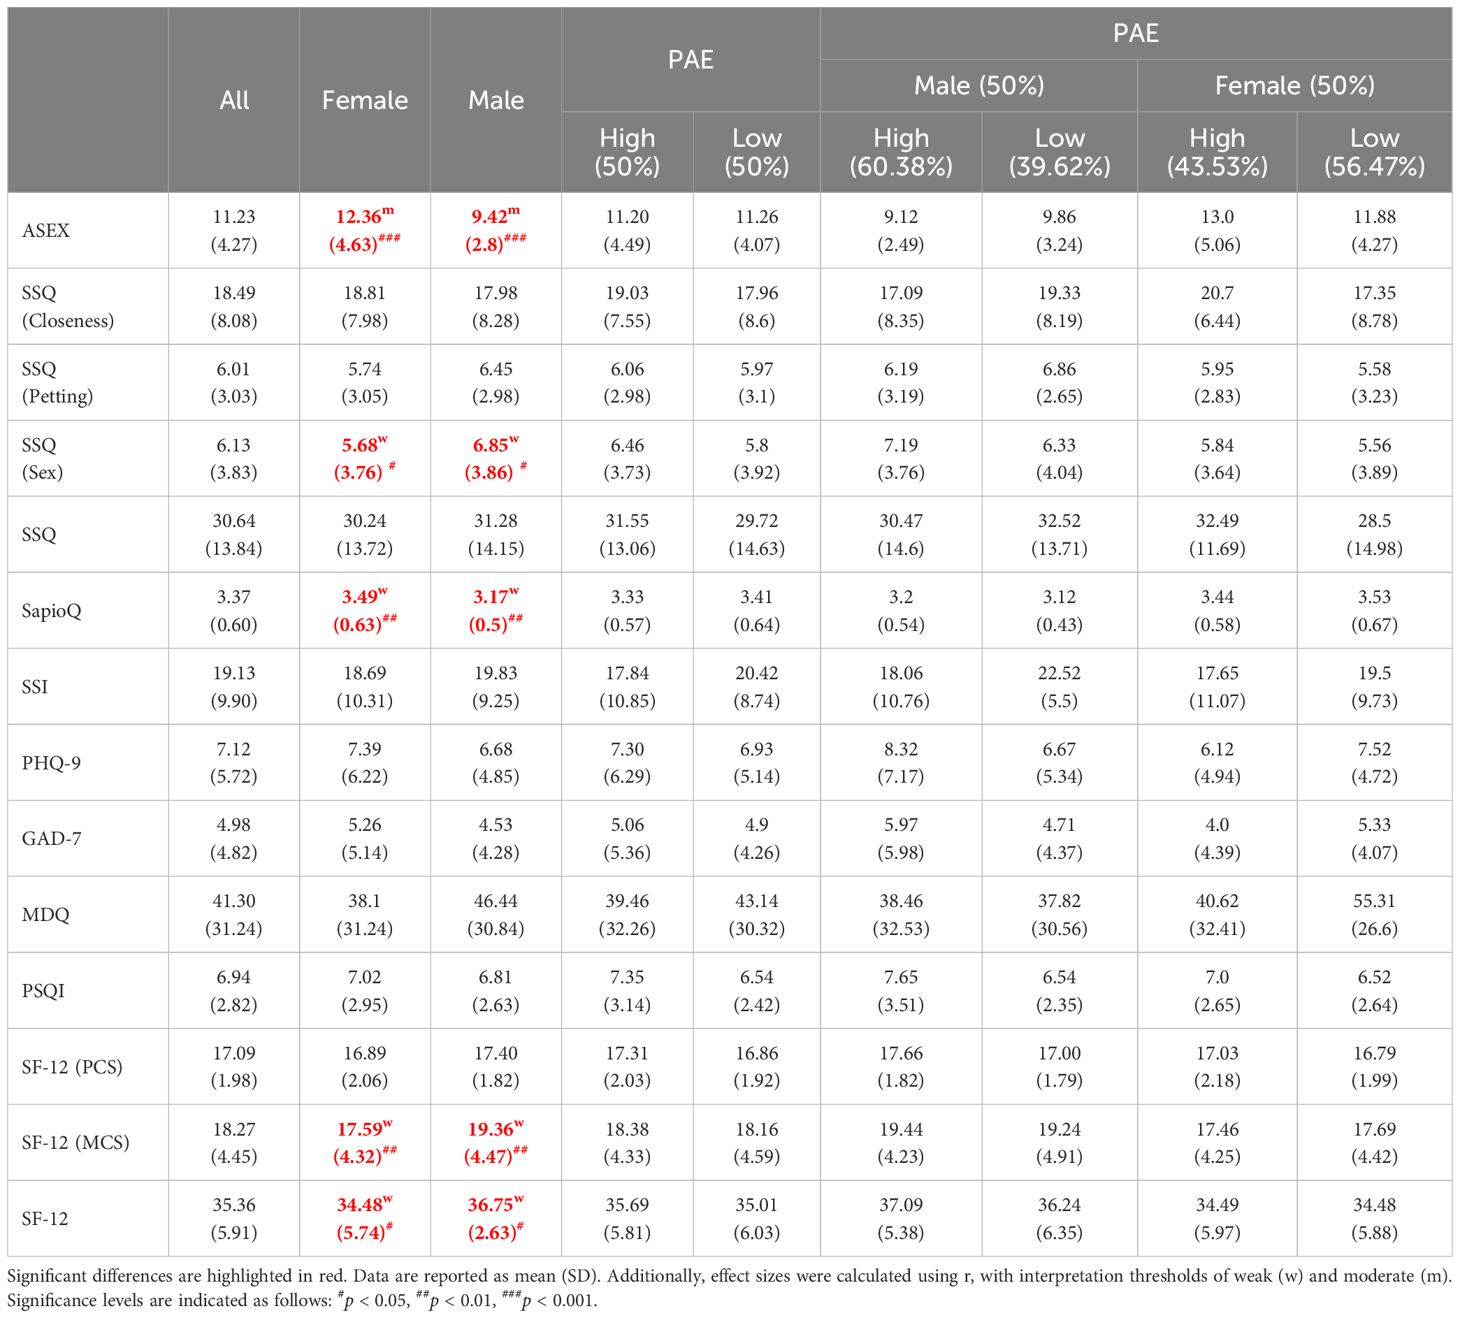
Table 2. Mann-Whitney test results for 2D:4D and PAE, where PAE is assessed on the dominant hand.
When taking into account the exact anthropometric measures taken on the dominant hand (Table 3), the initial analysis revealed statistically significant associations with the questionnaires. However, after applying the FDR correction, none of these correlations remained statistically significant (Table 3).
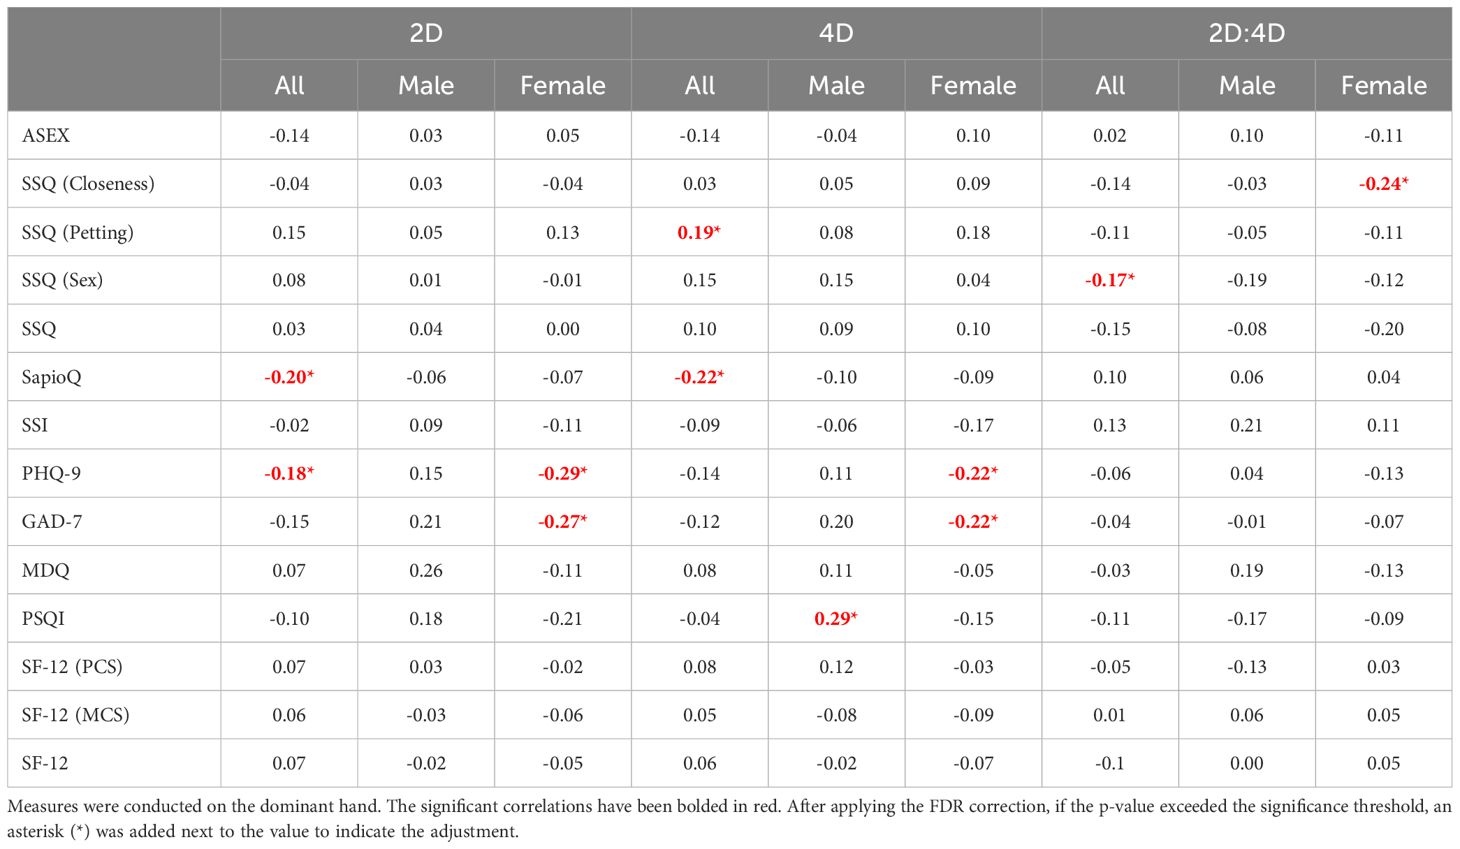
Table 3. Spearman Correlation between anthropometric measurements and scales regarding sexuality and mental disorders.
3.3 Relationship between sexuality and mental disorders
Then, questionnaires regarding sexuality were correlated with those assessing mental disorders (Table 4). In our study group, ASEX was negatively correlated with SF-12(MCS), but the correlations were weak. SSI was positively correlated with questionnaires regarding mental disorders (PHQ-9, GAD-7, MDQ) and negatively correlated with SF-12 and its subscales. The SapioQ questionnaire was negatively correlated with SF-12 and its subscales. In women, SSI was positively correlated with PHQ-9 and GAD-7 in both high and low participants, but MDQ was only correlated in the high PAE group. In men, SSI was also positively correlated in high PAE males with PHQ-9, GAD-7, and MDQ (Table 4).
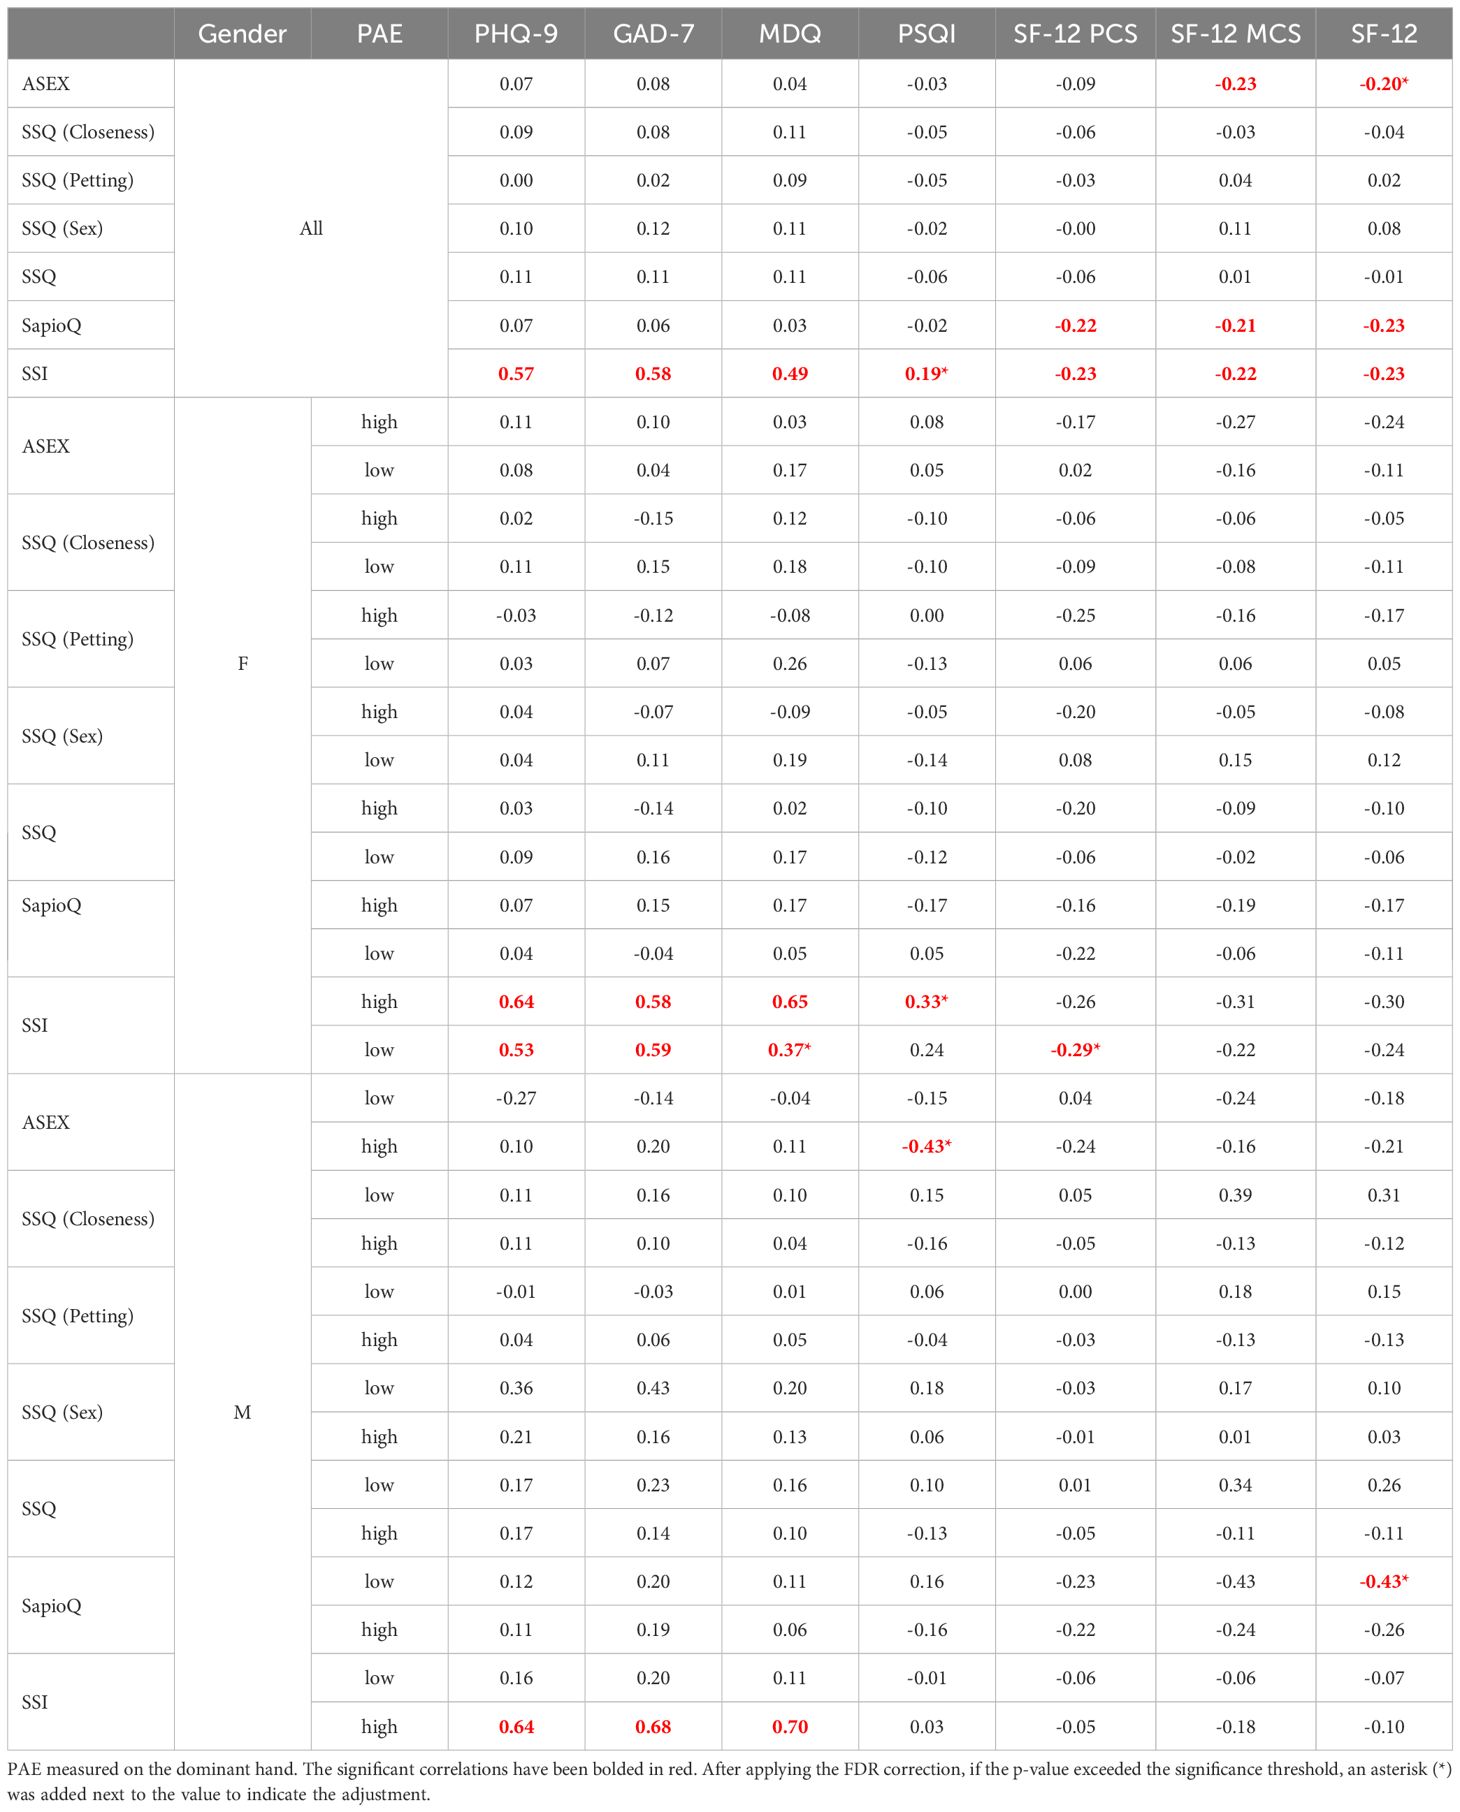
Table 4. Spearman Correlation between scales regarding sexuality and mental disorders.
3.4 Relationship between PAE and sexual orientation
No differences in sexual orientation were observed in participants when taking into account PAE and Gender (Table 5).

Table 5. Kinsey Scale. PAE is measured on the dominant hand.
3.5 Relationship between PAE and sexual behaviors
Individuals with high PAE were more likely to have engaged in a “friends with benefits” relationship (22%) compared to those with low PAE (15%), suggesting a greater openness to this type of relationship among those with higher PAE. Similarly, when considering the idea of a “one-night stand,” 30% of participants with high PAE reported having considered it, while only 22% of those with low PAE expressed similar thoughts. The same trend was observed in females but not males (Table 6A). Individuals with low PAE more often declared that intelligence and intriguing personalities attracted them to sexual partners, but less often it was physical attractiveness and self-confidence. No differences were observed when considering the gender (Table 6B).
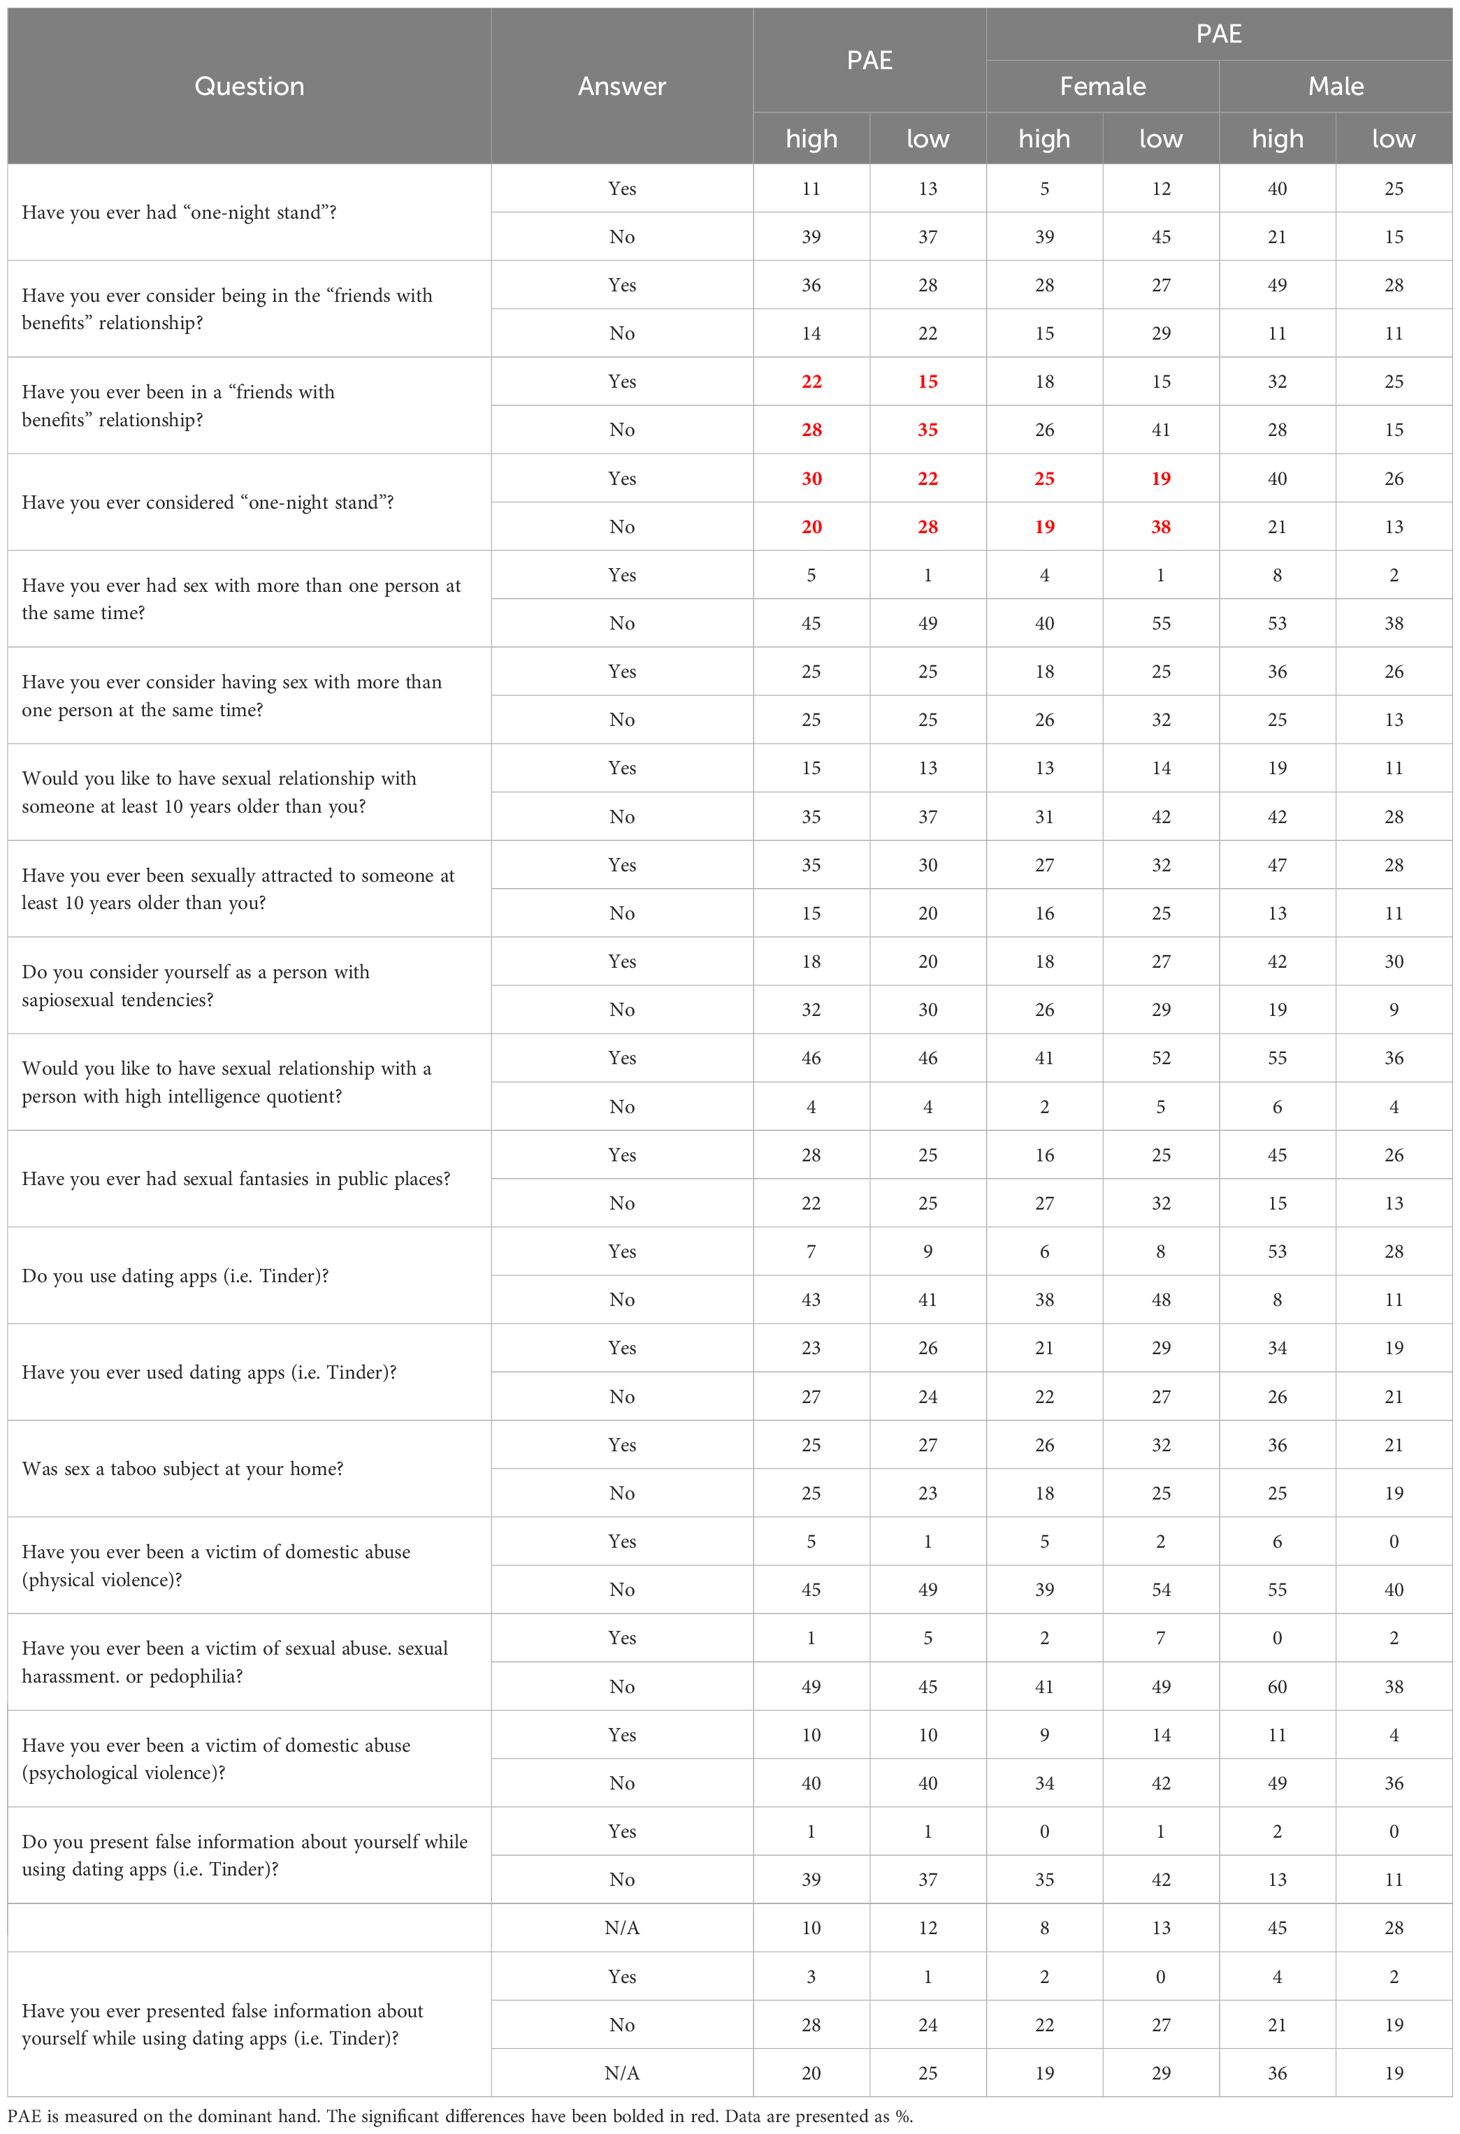
Table 6A. Self-created questionnaires regarding sexuality.
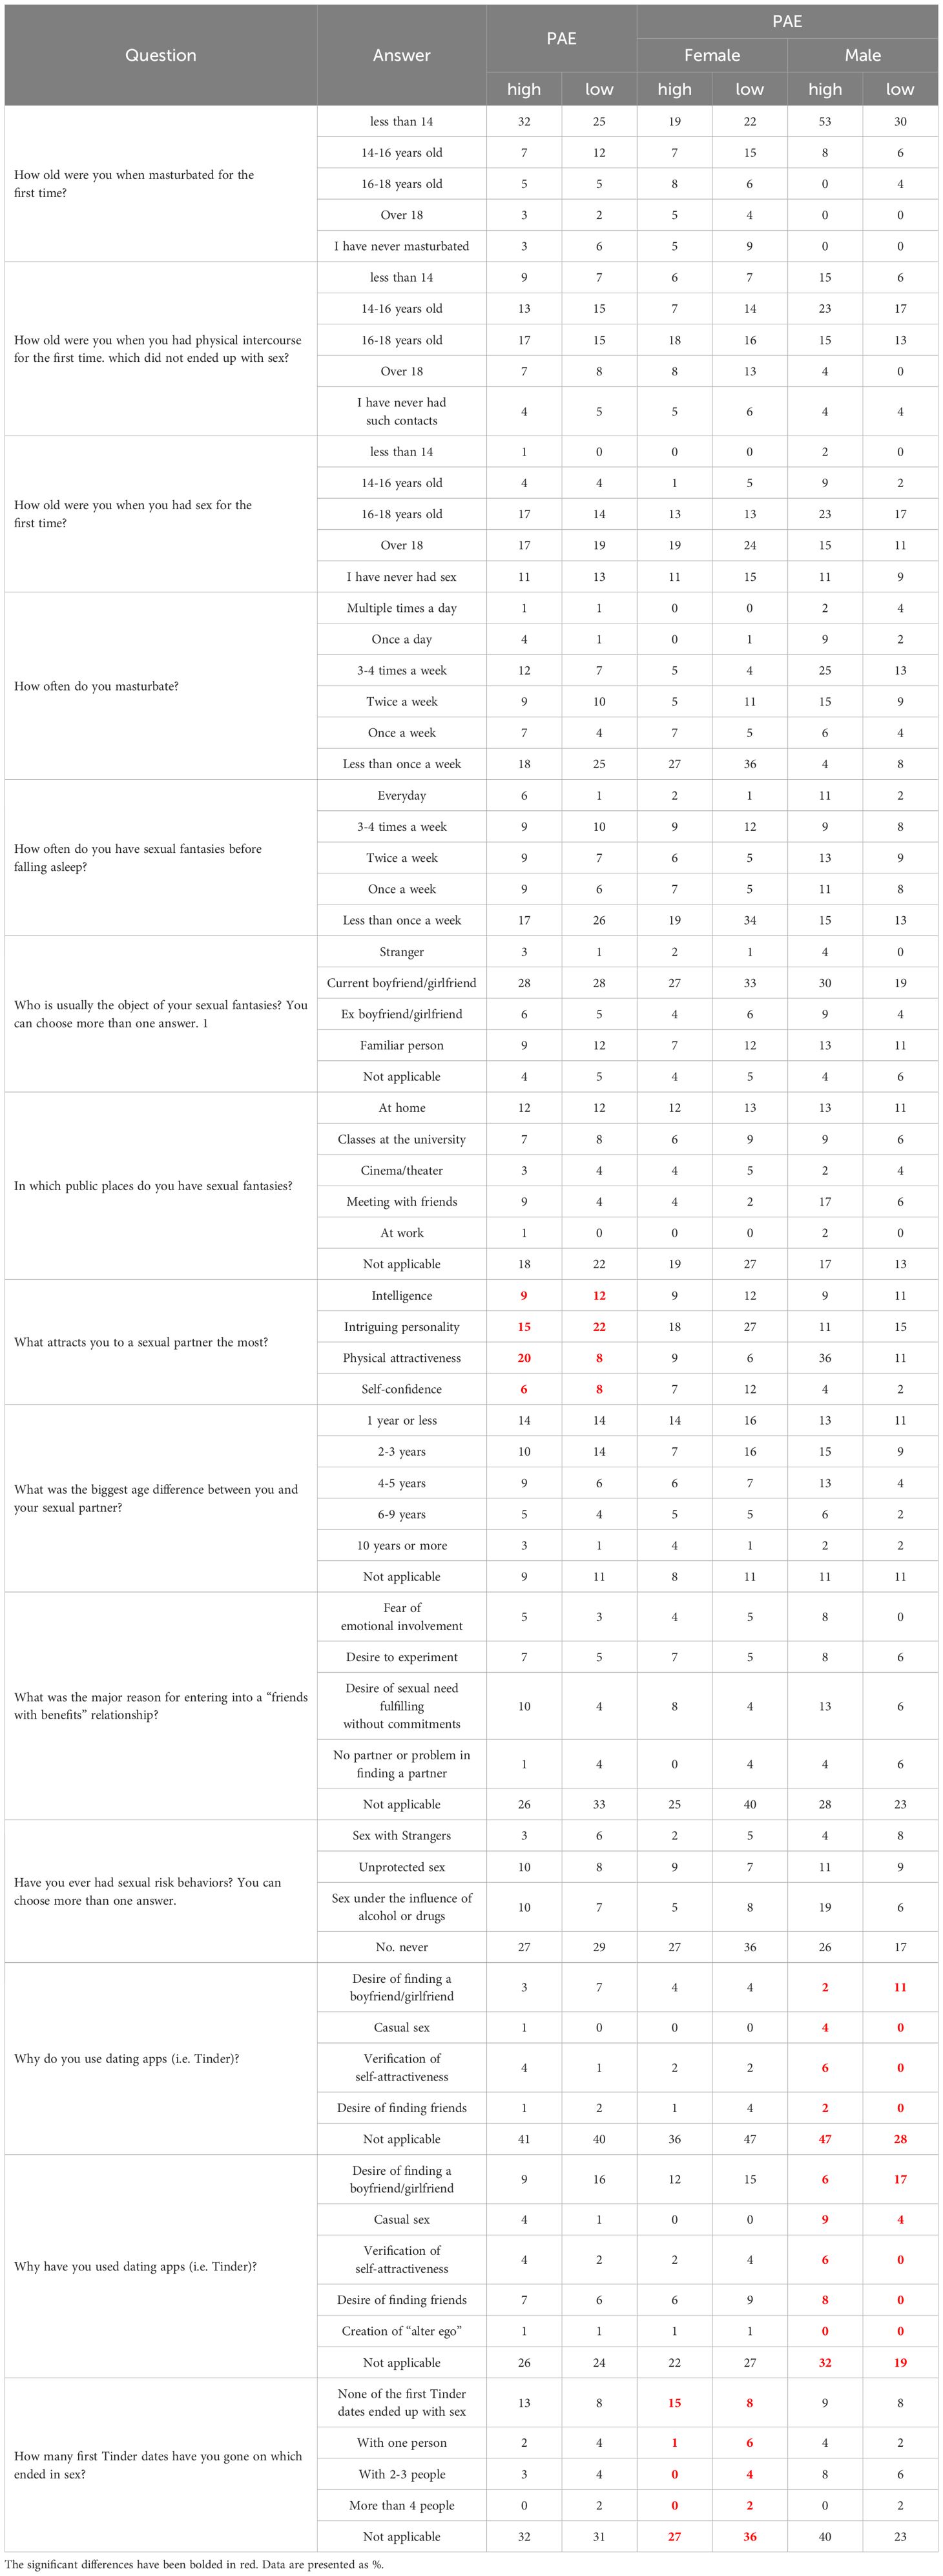
Table 6B. Self-created questionnaires regarding sexuality.
4 Discussion
According to data from the nationally representative General Social Survey, which included 26,620 participants from 1989 to 2014, American adults engaged in sexual activity approximately nine fewer times per year in the early 2010s compared to the late 1990s (21). Engaging in sexual activity has been linked to various physical and psychological health benefits (22). Furthermore, research indicates that happiness levels among adults over 30 have decreased since 2000 (23). Additionally, engaging in more frequent sexual activity is linked to increased well-being and greater happiness (24). Both men and women who maintain an active sex life experience improved physical fitness, enhanced happiness, better cognitive function, and increased life expectancy (24–26). There is a body of evidence that has shown inadequate sleep, sleep disturbances, and sleep disorders significantly impact various facets of human health, including sexual function (27). In our study, we pose a question: is there a correlation between mental disorders, sexual dysfunction, and PAE, as indicated by DR?
4.1 Relationship between PAE, sexuality and mental disorders
Recent research suggests correlations between PAE, often measured via the 2D:4D ratio, sexuality, and mental health traits. Studies have found that lower 2D:4D ratios, which indicate higher androgen exposure, are associated with traits like spatial abilities and, in some cases, sexual orientation. Sadr et al. (28) found that 2D:4D ratios in the right hand were more consistently associated with gender dysphoria (GD) than those in the left hand. The meta-analysis also highlighted smaller effect sizes for the left hand compared to the right hand, emphasizing the asymmetry between the two. Our study did not reveal any correlations between the anthropometric measurements taken on the dominant hand (2D, 4D, 2D:4D) with questionnaires regarding sexuality and mental disorders.
Research into PAE suggests that variations in early hormone levels can significantly impact mental health outcomes, with associations noted in conditions such as depression, anxiety, and gender dysphoria. For example, research on mental health has found that individuals with lower 2D:4D ratios may have a greater predisposition to certain behaviors linked to addictive tendencies or even mood disorders. As we studied literature, eighty-four females aged 18 to 40 years were assessed using the Female Sexual Function Index (FSFI), the Hospital Anxiety and Depression Scale (HADS), and the Type-D Personality Scale (DS14), which encompasses negative affectivity and social inhibition subscales. Additionally, subscales from the Eating Disorder Inventory-3 (EDI-3), specifically Drive for Thinness, Bulimia, and Body Dissatisfaction, were employed. Specifically, findings show that individuals with lower 2D:4D ratios may exhibit non-heterosexual orientations more often than those with higher ratios. This link supports theories of prenatal hormonal influences on sexual orientation. In our study, sexual function was assessed through the ASEX to gain insights into key areas of sexual activity, including sexual desire, arousal, erectile function, orgasmic ease, and satisfaction. To deepen the understanding of sexual health, SSQ across domains of Closeness, Petting, and Sex, along with the SapioQ and SSI, offering a comprehensive view of individual sexual function, were used. To capture changes in mental health, questionnaires regarding depression (PHQ-9), mood (MDQ), anxiety (GAD-7), general health (SF-12), and sleep (PSQI) were included. Unfortunately, in our study, no significant correlations were observed between PAE and questionnaires regarding sexuality and mental disorders. In the Mann-Whitney test analysis, women tend to have higher ASEX and SapioQ scores than men but lower SSQ, SF-12 (MCS) and SF-12 scores. Our analysis did not reveal significant correlations within the male samples. This aligns with prior research, which has consistently reported smaller effect sizes in studies examining the relationship between 2D:4D ratios and various traits in males compared to females. The potential link between a low 2D:4D ratio and traits like aggression, higher risk-taking, or impulsivity is thought to play a role in mental health vulnerability. For example, research on mental health has found that individuals with lower 2D:4D ratios may have a greater predisposition to certain behaviors linked to addictive tendencies or even mood disorders. The study by Buchholz et al. explored the relationship between markers of prenatal androgen exposure (PAE) and sexual behaviors in young men. It found significant correlations between PAE markers, such as the 2D:4D ratio, and online sexual compulsivity and erectile function. The study suggests that individuals with lower 2D:4D ratios, which are indicative of higher prenatal testosterone exposure, may be more prone to behaviors linked to sexual compulsivity. These findings align with previous research linking PAE to impulsive behaviors and risk-taking tendencies (29).
4.2 Relationship between sexuality and mental disorders
Mental disorders significantly impact patients’ quality of life with varying degrees of severity. In 2022, Leichsenring et al. published an umbrella review and meta-analytic evaluation of the efficacy of psychotherapies and pharmacotherapies for mental disorders in adults. A total of 102 meta-analyses were included, comprising 3,782 RCTs and 650,514 patients. These covered a range of conditions, including depression, anxiety, post-traumatic stress, etc. After over fifty years of research, thousands of RCTs, and significant financial investment, the effect sizes of psychotherapies and pharmacotherapies for mental disorders remain modest, suggesting a potential ceiling effect in current treatment approaches. To drive meaningful progress, a paradigm shift in research methodologies may be necessary (30). Mental disorders are often associated with sexual disorders, which further diminish the quality of life for affected individuals (21).
Sexual function disturbances can be easily correlated to depression. A reduction in the frequency of sexual activity can result in a mood decline and the onset of other psychological disorders (21). PAE (measured on the dominant hand) does not differentiate any of the questionnaires used in the study, also when considering gender (Table 2). Women have significantly higher ASEX and SapioQ scores than men but lower SSQ (Sex), SF-12 (MCS) and SF-12 scores. Consequently, questionnaires regarding sexuality were correlated with those assessing mental disorders (Table 4). In our study group, SSI was positively correlated with questionnaires regarding mental disorders (PHQ-9, GAD-7, MDQ) and negatively correlated with SF-12 and its subscales. In women, SSI was positively correlated with PHQ-9 and GAD-7 in both high and low participants, but MDQ was only correlated in the high PAE group. In our study group, ASEX was negatively correlated with SF-12(MCS), but the correlations are weak. In men, SSI was also positively correlated in high PAE males with PHQ-9, GAD-7, and MDQ (Table 4). The observed correlations in this study provide insights into the relationship between mental disorders, libido, and sexual satisfaction in young adults, particularly within a population largely composed of medical students. This may have influenced the inability to identify a correlation given the high demands and stress associated with medical training, this group may experience fluctuations in libido and sexual satisfaction due to external stressors. Stress, intense academic commitment, and limited personal time are known to impact sexual desire and satisfaction levels, potentially moderating the effects of PAE on sexual health outcomes in young adults. In our findings, females reported higher scores on sexual satisfaction indices compared to males, which may reflect differences in how men and women in this age and academic group perceive and prioritize sexual satisfaction amidst their studies. These results suggest that while PAE does not provide any insight into sexual satisfaction, libido in young adults appears to be significantly influenced by lifestyle and psychosocial factors intrinsic to high-stress academic environments. This interaction might explain why correlations between PAE, libido, and sexual satisfaction, though present, remain weak. Further research should explore how academic stress and lifestyle changes during early adulthood might either mask or amplify the biological influences of PAE on sexual health, as well as the gender-specific nature of these effects.
4.3 Relationship between PAE and sexual orientation
No differences in sexual orientation were observed in participants when taking into account PAE and Gender (Table 5). The study included participants with a mean age of 22.28 ± 1.99 years, primarily recruited at the university. This may have influenced the inability to identify a correlation between DR and sexual orientation. However, a review of the current literature shows that Leinung and Wu conducted a study in 2017 to investigate the correlation between DR and gender identification in the transgender New York clinic population (31). In a population of 118 transgender individuals undergoing hormone therapy, there were 50 FtM and 68 MtF for a 2D:4D ratio. Cisgender volunteers were chosen for the control group measurements. It was found that FtM individuals had a smaller dominant hand DR (0.983 ± 0.027) when linked with cisgender female controls (0.998 ± 0.021, p = 0.029). However, the ratio was similar to that of the control males. A distinctly different group of participants was recruited in comparison to our study. On the other hand, Richards et al. (32) conducted a study on self-measured 2D:4D ratio and gender variance, including 71 adults divided into four groups of participants: cisgender females, AFAB (assigned female at birth and includes female-to-male participants as well as those with other gender variant identities), cisgender males, and AMAB individuals (assigned male at birth and includes male-to-female participants as well as those with other gender variant identities). The study found that right-hand 2D:4D ratios were lower in cisgender males compared to the AMAB group and marginally lower in cisgender females relative to the AFAB group. Additionally, their study revealed a significant effect on the left-hand 2D:4D ratio. Heterosexuals’ left-hand 2D:4D ratio was lower than individuals who chose to specify gender as ‘other’ or ‘prefer not to say.’ However, no significant changes were observed with homosexuals. The limitations of this study include the small sample size and also observations made by Voracek et al. (33), suggesting that the reliability of self-measured DR may differ in accuracy from those taken by experienced researchers.
Additionally, Turan et al. investigated the 2D:4D ratio as a potential indicator of PAE in individuals with gender dysphoria (GD), comparing these individuals with same-sex siblings and cisgender controls. Individuals assigned female at birth transitioning to male and 22 individuals assigned male at birth transitioning to female (46 FtM, 22 MtF) and matched controls, FtM individuals displayed significantly masculinized 2D:4D ratios in the right hand compared to female controls, although no significant differences were observed between siblings or male controls. No feminization was observed in the MtF group’s 2D:4D ratios, suggesting that PAE may play a role in the FtM profiles but not MtF GD profiles. Our study did not include transgender participants, resulting in a relatively homogeneous sample that limited our ability to make similar observations.
As was mentioned in the Introduction section, Siegmann et al. (10) proposed an interesting finding from a meta-analysis of existing literature. A meta-analysis, including 17 samples and over 3,600 participants, showed a significant difference in 2D:4D between male-to-female (MtF) transgender individuals and male controls. These findings suggest that variations in 2D:4D, particularly in MtF individuals, reflect the influence of PAE on gender identity, adding evidence to the role of early hormone environment in shaping sexual and gender preferences. The study found a significantly higher (feminized) left-hand 2D:4D ratio in MtF transgender individuals compared to male controls. Both the original study and the meta-analysis found no significant differences in 2D:4D ratios between female-to-male (FtM) transgender individuals and female controls, indicating that prenatal androgen exposure may not play a similar role in FtM gender identity development (10).
Manning et al. (34) used data from a BBC Internet Study comprising 209,317 participants to examine whether prenatal sex steroids influence transgender identity via the 2D:4D ratio. The results indicated that natal males identifying as female (M→F) and male-to-female (MtF) individuals exhibited higher and more feminized 2D:4D ratios than natal males who identified as male (M→M), suggesting a reduction in prenatal testosterone exposure in M→F and MtF individuals. Furthermore, no significant differences in 2D:4D were observed between individuals assigned with female-to-male (F→M) to FtM individuals compared to natal females, suggesting a role of prenatal sex steroids in shaping gender identity in F→M of FtM individuals. A meta-analysis on 2D:4D ratios as a potential marker for PAE examined sexual orientation across 18 male and 16 female independent samples, totaling over 5,800 participants. Findings confirmed that heterosexual women displayed higher (more feminine) 2D:4D ratios than lesbians for both hands, while no significant differences were observed between heterosexual and gay men. Ethnicity emerged as a moderating factor in male samples, suggesting a complex interaction between early androgen exposure, sexual orientation, and ethnic background, particularly in men (35). Evidence indicates partial support for the hypothesis that PAE is associated with adult sexual orientation. This relationship appears to depend on the timing of androgen fluctuations, individual variability in androgen receptor characteristics, and potential nonlinear effects, where increased androgen may masculinize up to a threshold, beyond which feminization may occur. Additionally, androgen effects likely interact with other prenatal hormones and biochemical factors (36).
4.4 Relationship between PAE and sexual behaviors
In our study, we used self-created questionnaires regarding sexuality (Tables 6A, B). These questionaries included questions: Have you ever had a ‘one night stand’’? Have you ever considered being in a “friends with benefits” relationship? We show that higher PAE participants were more inclined toward casual relationships, with 22% reporting prior “friends with benefits” relationships compared to lower PAE counterparts (15%), particularly among females. These results suggest a greater openness to this type of relationship among those with higher PAE. Similarly, when considering the idea of a “one-night stand,” 30% of participants with high PAE reported having considered it, while only 22% of those with low PAE expressed similar thoughts. The same trend was observed in females but not males (Table 6A). No differences were observed when considering the gender (Table 6B). Participants with lower PAE more often preferred partners with intelligence and intriguing personalities over physical attributes, regardless of gender. However, Manning’s research group has been studying the correlation of DR with many diseases, inhibitions, or inclinations for many years. They were the first to note that 2D:4D has a relationship with sexual behaviors. In 2000, they proposed that right-hand DR in males is negatively correlated with family size across a number of ethnic groups (37). In 2001, research showed that high sex drive and a correlated number of sexual partners might shed some light on the association between low 2D:4D and family size in men (38). In 2006, they hypothesized a negative correlation between right-hand 2D:4D ratios and the number of sexual partners (NSP) per individual. The study found that the relationship between right-hand 2D:4D NSP was independent of free testosterone, although free testosterone had a weak positive association with NSP. In a sample of 79 heterosexual and 95 homosexual Austrian men, a significant negative association between right-hand 2D:4D and NSP was observed among heterosexual men but not homosexual men, and this association remained even when controlling for age, education, occupation, and relationship status. These findings suggest that prenatal testosterone may have a lasting impact on NSP, particularly in heterosexual men. On the other hand, Pearce et al. (2018) explore the genetic influences on 2D:4D ratios and their associations with sociosexual traits, analyzing 474 participants for single-nucleotide polymorphisms (SNPs) in nine neurochemical receptor genes. Significant associations were found between 2D:4D and genetic variations in the AR, OPRM1, and AVPR1A genes. Mediation analysis suggests that in women, variations in AR and OPRM1 are linked to 2D:4D ratios, which are further associated with increased impulsivity and, in the case of OPRM1, lower perceived romantic relationship quality. This study provides preliminary evidence that genetic factors may indirectly influence sociosexual behavior through their impact on 2D:4D ratios (39).
4.5 Limitations
The study primarily involved young, healthy adults, which may restrict the applicability of the findings to other age groups or those with existing health issues. Although several variables were considered in the study, other possible confounding factors—such as stress, dietary habits, and environmental impacts—were not analyzed, which might influence sleep quality. The cross-sectional design of the study limits our ability to make causal conclusions. Longitudinal studies would be essential for establishing the temporal links between PAE and sleep outcomes. Moreover, the sample size for objective sleep measures was relatively limited, so future investigations with larger participant groups would strengthen our conclusions. Additionally, using self-reported data for certain measures could lead to bias, despite our attempts to confirm these findings with objective data. Data collection was also affected by the COVID-19 pandemic, potentially introducing variability in study conditions and influencing overall participation rates.
5 Conclusions
In conclusion, this study offers insights into the relationship between prenatal androgen exposure (PAE), mental health, sexual functioning, and social attitudes toward sexuality. The analysis revealed that women exhibited higher ASEX and SSI scores than their male counterparts, with no significant gender differences observed in other domains. This indicates the nuanced effects of sex and gender on sexual satisfaction and mental health. PAE did not significantly distinguish overall questionnaire scores. Importantly, participants with higher PAE reported increased openness to casual relationships, such as “friends with benefits” and “one-night stands,” especially among women. This suggests a potential association between elevated prenatal androgen exposure and a broader acceptance of certain sexual and social relationship patterns. These findings highlight the necessity for ongoing research into the complex role of PAE in sexual and psychosocial development and suggest possible gender-specific pathways through which it impacts mental health and sexual attitudes.
Data availability statement
The raw data supporting the conclusions of this article will be made available by the authors, without undue reservation.
Ethics statement
The studies involving humans were approved by Ethics Committee of the Medical University of Lodz approved the study protocol (RNN/394/19/KE); 2020/04/X/NZ4/00564. The studies were conducted in accordance with the local legislation and institutional requirements. The participants provided their written informed consent to participate in this study.
Author contributions
AB: Conceptualization, Data curation, Formal analysis, Funding acquisition, Investigation, Methodology, Resources, Software, Writing – original draft, Writing – review & editing. MS: Writing – original draft, Writing – review & editing. KP: Data curation, Writing – review & editing. AK: Writing – review & editing. PB: Writing – review & editing. WK: Conceptualization, Investigation, Writing – review & editing.
Funding
The author(s) declare that financial support was received for the research and/or publication of this article. The study was funded by Miniatura 4, National Science Centre-no 2020/04/X/NZ4/00564.
Acknowledgments
Manuscript preparation was supported during Harvard Medical School’s Polish Clinical Scholars Research Training Program, organised by the Medical Research Agency.
Conflict of interest
The authors declare that the research was conducted in the absence of any commercial or financial relationships that could be construed as a potential conflict of interest.
Generative AI statement
The author(s) declare that no Generative AI was used in the creation of this manuscript.
Publisher’s note
All claims expressed in this article are solely those of the authors and do not necessarily represent those of their affiliated organizations, or those of the publisher, the editors and the reviewers. Any product that may be evaluated in this article, or claim that may be made by its manufacturer, is not guaranteed or endorsed by the publisher.
References
1. Andersen ML, Alvarenga TF, Mazaro-Costa R, Hachul HC, Tufik S. The association of testosterone, sleep, and sexual function in men and women. Brain Res. (2011) 1416:80–104. doi: 10.1016/j.brainres.2011.07.060
2. Manning JT, Scutt D, Wilson J, Lewis-Jones DI. The ratio of 2nd to 4th digit length: A predictor of sperm numbers and concentrations of testosterone, luteinizing hormone and oestrogen. Hum Reprod. (1998) 13:3000–4. doi: 10.1093/HUMREP/13.11.3000
3. Zamani Sani SH, Sadeghi-Bahmani D, Fathirezaie Z, Aghdasi MT, Abbaspour K, Badicu G, et al. Gender differences and relationship of 2D:4D-ratio, mental toughness and dark triad traits among active young adults. Biology. (2022) 11:864. doi: 10.3390/biology11060864
4. Jeevanandam S, Muthu PK. 2D:4D ratio and its implications in medicine. J Clin Diagn Res. (2016) 10:CM01–3. doi: 10.7860/JCDR/2016/21952.9000
5. Kratochvíl L, Flegr J. Differences in the 2nd to 4th digit length ratio in humans reflect shifts along the common allometric line. Biol Lett. (2009) 5:643–6. doi: 10.1098/rsbl.2009.0346
6. Wallen K. The Organizational Hypothesis: Reflections on the 50th anniversary of the publication of Phoenix, Goy, Gerall, and Young (1959). Horm Behav. (2009) 55:561–5. doi: 10.1016/j.yhbeh.2009.03.009
7. Meyer-Bahlburg HFL, Dolezal C, Baker SW, New MI. Sexual orientation in women with classical or non-classical congenital adrenal hyperplasia as a function of degree of prenatal androgen excess. Arch Sex Behav. (2008) 37:85–99. doi: 10.1007/s10508-007-9265-1
8. Kuczyński W, Wibowo E, Hoshino T, Kudrycka A, Małolepsza A, Karwowska U, et al. Understanding the associations of prenatal androgen exposure on sleep physiology, circadian proteins, anthropometric parameters, hormonal factors, quality of life, and sex among healthy young adults: protocol for an international, multicenter study. JMIR Res Protoc. (2021) 10:e29199. doi: 10.2196/29199
9. Breedlove SM. Replicable data for digit ratio differences. Science. (2019) 365:230. doi: 10.1126/science.aay3385
10. Siegmann E-M, Müller T, Dziadeck I, Mühle C, Lenz B, Kornhuber J. Digit ratio (2D:4D) and transgender identity: new original data and a meta-analysis. Sci Rep. (2020) 10:19326. doi: 10.1038/s41598-020-72486-6
11. McGahuey CA, Mcgahuey CA, Gelenberg AJ, Laukes CA, Moreno FA, Delgado PL, et al. The arizona sexual experience scale (ASEX): reliability an d validity. J Sex Marital Ther. (2000) 26:25–40. doi: 10.1080/009262300278623
12. Gignac GE, Darbyshire J, Ooi M. Some people are attracted sexually to intelligence: A psychometric evaluation of sapiosexuality. Intell. (2018) 66:98–111. doi: 10.1016/j.intell.2017.11.009
13. Plopa M. The sexual satisfaction questionnaire. Polskie Forum Psychologiczne. (2017) 22:519–43. doi: 10.14656/PFP20170401
14. Nomejko A, Dolińska-Zygmunt G. The Sexual Satisfaction Questionnaire – psychometric properties. Pol J Appl Psychol. (2014) 12:105–12. doi: 10.1515/pjap-2015-0017
15. Kinsey AC, Pomeroy WB, Martin CE. Sexual behavior in the human male. Oxford, England: Saunders (1948). p. 804.
16. Löwe B, Decker O, Müller S, Brähler E, Schellberg D, Herzog W, et al. Validation and standardization of the generalized anxiety disorder screener (GAD-7) in the general population. Med Care. (2008) 46:266–74. doi: 10.1097/MLR.0b013e318160d093
17. Hirschfeld RMA, Williams JBW, Spitzer RL, Calabrese JR, Flynn L, Keck PE, et al. Development and validation of a screening instrument for bipolar spectrum disorder: the mood disorder questionnaire. Am J Psychiatry. (2000) 157:1873–5. doi: 10.1176/appi.ajp.157.11.1873
18. Kroenke K, Spitzer RL, Williams JBW. The PHQ-9: validity of a brief depression severity measure. J Gen Intern Med. (2001) 16:606–13. doi: 10.1046/J.1525-1497.2001.016009606.X
19. Buysse DJ, Reynolds Ill CF, Monk TH, Berman SR, Kupfer DJ. The pittsburgh sleep quality index: A new instrument for psychiatric practice and research. Psychiatry Res. (1988) 28:193–5. doi: 10.1016/0165-1781(89)90047-4
20. Ware JE, Kosinski M, Keller SD. A 12-Item Short-Form Health Survey: construction of scales and preliminary tests of reliability and validity. Med Care. (1996) 34:220–33. doi: 10.1097/00005650-199603000-00003
21. Twenge JM, Sherman RA, Wells BE. Declines in sexual frequency among american adults, 1989–2014. Arch Sex Behav. (2017) 46:2389–401. doi: 10.1007/s10508-017-0953-1
22. Brody S. The relative health benefits of different sexual activities. J Sex Med. (2010) 7:1336–61. doi: 10.1111/j.1743-6109.2009.01677.x
23. Twenge JM, Sherman RA, Lyubomirsky S. More happiness for young people and less for mature adults: Time period differences in subjective well-being in the United States, 1972–2014. Soc Psychol Pers Sci. (2016) 7:131–41. doi: 10.1177/1948550615602933
24. Blanchflower DG, Oswald AJ. Money, sex and happiness: an empirical study. Scand J Econ. (2004) 106:393–415. doi: 10.1111/j.0347-0520.2004.00369.x
25. Ebrahim S, May M, Ben Shlomo Y, McCarron P, Frankel S, Yarnell J, et al. Sexual intercourse and risk of ischaemic stroke and coronary heart disease: the Caerphilly study. J Epidemiol Community Health. (2002) 56:99–102. doi: 10.1136/jech.56.2.99
26. Lorenz TK, Heiman JR, Demas GE. Interactions among sexual activity, menstrual cycle phase, and immune function in healthy women. J Sex Res. (2018) 55:1087–95. doi: 10.1080/00224499.2017.1394961
27. Cho JW, Duffy JF. Sleep, sleep disorders, and sexual dysfunction. World J Mens Health. (2019) 37:261–75. doi: 10.5534/wjmh.180045
28. Sadr M, Khorashad BS, Talaei A, Fazeli N, Hönekopp J. 2D:4D Suggests a Role of Prenatal Testosterone in Gender Dysphoria. Arch Sex Behav. (2020) 49(2):421–32. doi: 10.1007/s10508-020-01630-0
29. Buchholz VN, Mühle C. Cohort study on substance use risk factors, kornhuber J, lenz B. Markers of prenatal androgen exposure correlate with online sexual compulsivity and erectile function in young men. Front Psychiatry. (2021) 12:517411. doi: 10.3389/fpsyt.2021.517411
30. Leichsenring F, Steinert C, Rabung S, Ioannidis JPA. The efficacy of psychotherapies and pharmacotherapies for mental disorders in adults: an umbrella review and meta-analytic evaluation of recent meta-analyses. World Psychiatry. (2022) 21:133–45. doi: 10.1002/wps.20941
31. Leinung M, Wu C. The biologic basis of transgender identity: 2d:4d finger length ratios implicate a role for prenatal androgen activity. Endocr Pract. (2017) 23:669–71. doi: 10.4158/EP161528.OR
32. Richards G, Wei Y, Hendriks O. Self-measured digit ratio (2D:4D) and gender variance. Endocr Pract. (2020) 26:250–1. doi: 10.4158/1934-2403-26.2.250
33. Voracek M, Kaden A, Kossmeier M, Pietschnig J, Tran US. Meta-analysis shows associations of digit ratio (2d:4d) and transgender identity are small at best. Endocr Pract. (2018) 24:386–90. doi: 10.4158/EP-2017-0024
34. Manning JT, Trivers R, Fink B. Digit ratio (2D:4D), transgendered belief, and transsexual drug therapy in the BBC internet study. Evolutionary psychol Sci. (2020) 6:380–8. doi: 10.1007/s40806-020-00247-9
35. Grimbos T, Dawood K, Burriss RP, Zucker KJ, Puts DA. Sexual orientation and the second to fourth finger length ratio: a meta-analysis in men and women. Behav Neurosci. (2010) 124:278–87. doi: 10.1037/a0018764
36. Lippa RA. Are 2D:4D finger-length ratios related to sexual orientation? Yes for men, no for women. J Pers Soc Psychol. (2003) 85:179–88. doi: 10.1037/0022-3514.85.1.179
37. Manning JT, Barley L, Walton J, Lewis-Jones DI, Trivers RL, Singh D, et al. The 2nd:4th digit ratio, sexual dimorphism, population differences, and reproductive success. evidence for sexually antagonistic genes? Evol Hum Behav. (2000) 21:163–83. doi: 10.1016/s1090-5138(00)00029-5
38. Manning JT, Henzi P, Bundred PE. The ratio of 2nd to 4th digit length: a proxy for testosterone, and susceptibility to HIV and AIDS? Med Hypotheses. (2001) 57:761–3. doi: 10.1054/mehy.2001.1487
Keywords: digit ratio, sexuality disorders, 2D:4D, PAE, finger length
Citation: Bartoszek A, Sawic M, Pierzchała K, Kudrycka A, Białasiewicz P and Kuczyński W (2025) Prenatal androgen exposure predicts sexuality disorders: insights from anthropometric measurements and questionnaires. Front. Endocrinol. 16:1546385. doi: 10.3389/fendo.2025.1546385
Received: 16 December 2024; Accepted: 24 February 2025;
Published: 13 March 2025.
Edited by:
Wei Ge, University of Macau, ChinaReviewed by:
Bernhard Fink, University of Vienna, AustriaGeorgios Markantes, University of Patras, Greece
Copyright © 2025 Bartoszek, Sawic, Pierzchała, Kudrycka, Białasiewicz and Kuczyński. This is an open-access article distributed under the terms of the Creative Commons Attribution License (CC BY). The use, distribution or reproduction in other forums is permitted, provided the original author(s) and the copyright owner(s) are credited and that the original publication in this journal is cited, in accordance with accepted academic practice. No use, distribution or reproduction is permitted which does not comply with these terms.
*Correspondence: Wojciech Kuczyński, d29qY2llY2gua3Vjenluc2tpQHVtZWQubG9kei5wbA==