 Huiyi Liu
 Shuai Mao1,2†
 Tong Yin
- 1Institute of Geriatrics, Beijing Key Laboratory of Research on Comorbidity in the Elderly, National Clinical Research Center for Geriatric Diseases, Second Medical Center of Chinese PLA General Hospital, Beijing, China
- 2Medical School of Chinese PLA, Chinese PLA General Hospital, Beijing, China
Background: Cardiovascular-kidney-metabolic (CKM) syndrome reflects the interplay among metabolic risk factors, chronic kidney disease, and cardiovascular disease (CVD). While the hemoglobin glycation index (HGI) has demonstrated prognostic value for cardiovascular events, its clinical utility remains unexplored in early-stage CKM syndrome.
Methods: Participants with early-stage CKM syndrome (stage 0-3) were recruited from the China Health and Retirement Longitudinal Study (CHARLS) database. Using k-means clustering analysis, the participants were classified according to the values of HGI measured at baseline and 3 years later, respectively. The primary outcome was self-reported CVD during the follow-up of at least 3 years. Extreme gradient boosting (XGBoost) algorithm was applied, with the Shapley additive explanation (SHAP) method used to determine feature importance. Multivariable logistics proportional regression analysis the association between HGI and CVD, and restricted cubic spline (RCS) regression assessed potential nonlinear relationships.
Results: A total of 4676 eligible participants were included in the final analysis, with 944 (20.19%) progressed to CVD within 10 years. Among the baseline clinical features, HGI ranked the second for the impact on the occurrence of CVD. According to the changes of HGI values, the participants were clustered into 4 classes. Compared to the class 1 with lower level of HGI, higher risk of CVD was observed in class 3 (adjusted OR: 1.34, 95% CI: 1.06-1.69, P = 0.013) and class 4 (adjusted OR: 1.65, 95% CI: 1.01-2.45, P = 0.025) with higher and rapidly increasing level of HGI. RCS analysis showed cumulative HGI and the risk of CVD were linearly related (P for nonlinearity = 0.967). Subgroup analyses confirmed the stability of the association. Additionally, the SHAP plot revealed that HGI were the more important features than traditional risk factors such as FBG for predicting CVD.
Conclusion: HGI is associated with an elevated risk of CVD in participants with early-stage CKM syndrome. HGI can serve as an independent biomarker for guiding clinical decision-making and managing patient outcomes.
1 Introduction
Cardiovascular disease (CVD), chronic kidney disease (CKD), diabetes, and obesity are pathophysiologically interrelated that concurrently affect adult population with the prevalence of 5% in the United States (1), and 15% in China (2). In 2023, the American Heart Association defined this systemic condition as Cardiovascular-Kidney-Metabolic (CKM) syndrome, which may lead to premature mortality and increased morbidity (3). As reported, the combination of CKD and diabetes escalated the 10-year mortality rate markedly to 31.1% (4). The risk of CVD determines the staging and prognosis of CKM syndromes. Central to the CKM framework is the emphasis on risk-based primary prevention of CVD for individuals in CKM stages 0 to 3 (5). However, the prediction of the risk of CVD in the early stages of CKM syndromes is by far a challenge (6).
For patients with CKM syndromes, it is crucial to effectively control blood sugar levels and use reliable indicators to minimize diabetes-related complications and mortality (7). Glycosylated hemoglobin A1c (HbA1c) is strongly associated with the development of both microvascular and macrovascular diseases, likely due to its involvement in protein glycation (8). Despite standardized assays, discrepancies between HbA1c and other glycemic measures are well-documented and can affect the accuracy of glycemic control and management (9, 10). The mean erythrocyte lifespan, differences in cell membrane glucose transmembrane gradients and enzyme abnormalities can independently impact the reliability of HbA1c (11–13). Other genetic factors like genetic variation in hemoglobin can also affect the association of HbA1c with “true” average glucose exposure, particularly in the low (no diabetic) range (14). For most patients with metabolic disorders, a more tailored and individualized approach should be implemented to prevent vascular complications (10).
To solve these problems, the hemoglobin glycation index (HGI) was developed to directly reflect the individual glycemic variability by quantifying the difference between HbA1c and plasma glucose concentration (15). HGI could predict the risk of diabetic complications, including CVD, microvascular diseases, and mortality in patients with diabetes mellitus (16, 17). Presently, there have been few research that examined the correlation in patients with complex metabolic abnormalities. Prior research has shown that HGI was positively associated with the incidence of obesity, increased levels of low-density lipoprotein, triglyceride, and postprandial glycemic excursion, respectively (18). Therefore, in this study, we aimed to examine the association between HGI and the risk of CVD in the early stages of CKM syndromes.
2 Methods
2.1 Data source and study population
This prospective study used data from the China Health and Retirement Longitudinal Study (CHARLS), which includes clinical information from participants aged 45 years in China from 2011 to 2012 were considered as baseline (Wave 1), and follow-up each two years. Up to now, CHARLS has released three waves of follow-up data (Wave 2 in 2013, Wave 3 in 2015 and Wave 4 in 2018). The protocol of CHARLS study was approved by the Ethical Review Committee of Peking University (IRB00001052-11015). Informed consent was obtained in writing from all participants prior to their inclusion.
In the study, 17,635 individuals who completed the baseline survey were included in the analysis. We excluded 12,959 individuals for the following reasons: (1) lack of information on age and gender, (2) participants younger than 45 years, (3) absence of information on cardiovascular disease and chronic kidney disease, (4) participants with CKM stage 4 at baseline, already diagnosed with CVD, (5) participants with less than 3 years of follow-up, (6) lack of data on FBG or HbA1c. Ultimately, a total of 4,676 individuals were included in the analysis (Figure 1).
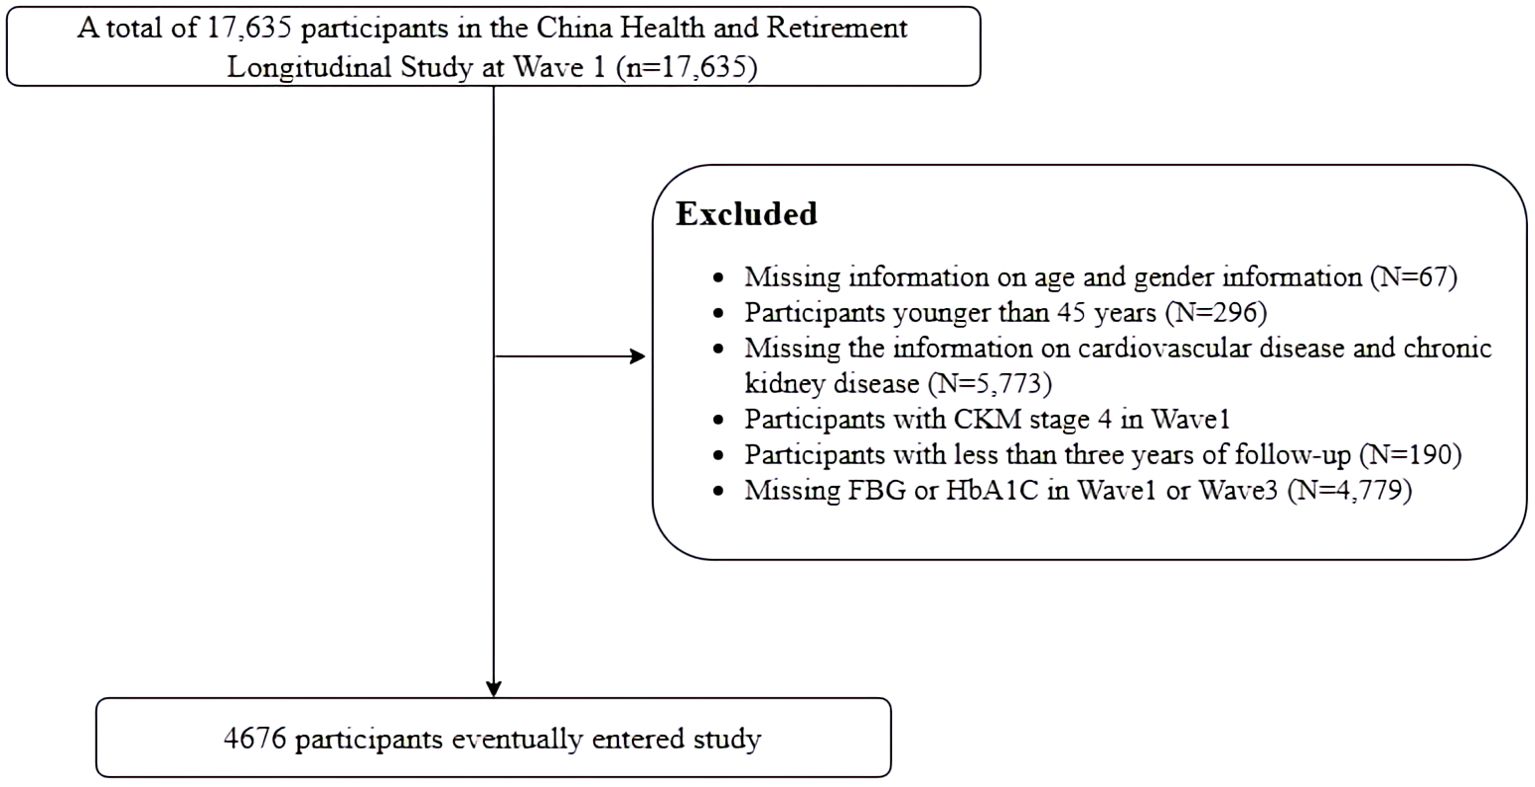
Figure 1. Flowchart of the study population.
2.2 Deriving HGI from the HbA1c versus FBG regression equation
HGI was calculated following the methodology established by Hempe et al. (19). To estimate the inter-individual variance in HbA1c levels, we utilized baseline FBG and HbA1c data for our calculations. The predicted HbA1c level was calculated for each participant through linear regression analysis (HbA1c = 0.017 × FBG + 3.41). HGI was then defined as the difference between the measured HbA1c and the predicted HbA1c (HGI = measured HbA1c – predicted HbA1c). Cumulative HGI was calculated using hematological data from Waves 1 and 3, derived with the formula: (HGI2012 + HGI2015)/2 × time.
2.3 Determination of endpoints
The primary outcome was the incidence of CVD, adhering to the previous protocols established with the CHARLS dataset. It was ascertained by the question “Did your doctor tell you that you have been diagnosed with a heart attack, angina pectoris, coronary heart disease, heart failure, or other heart problem?” (6).
2.4 Data collection and definitions
Baseline data regarding socio-demographic status and disease-related information were collected through in-person interviews conducted by trained interviewers using a structured questionnaire. The socio-demographic information gathered included age, gender, education, and marital status. Disease-related factors encompassed body mass index (BMI), systolic blood pressure (SBP), diastolic blood pressure (DBP), hypertension, dyslipidemia, diabetes, lifestyle factors (such as smoking and alcohol consumption). Participants were required to fast for at least 12 hours prior to the measurement of FBG, triglycerides (TG), total cholesterol (TC), high-density lipoprotein cholesterol (HDL-C), and low-density lipoprotein cholesterol (LDL-C). BMI was calculated as weight (kg) divided by height squared (m²). Participants were categorized into three groups based on their BMI: as normal weight (< 25 kg/m2), overweight (25–29.9 kg/m2), and obesity (≥ 30 kg/m2) (20).
Hypertension was defined as a history of diagnosis, the use of antihypertensive medication, systolic blood pressure ≥140 mmHg, or diastolic blood pressure ≥ 90 mmHg (21). Diabetes was defined as self-reported diagnosis history, use of any insulin or oral hypoglycemic agents, and fasting glucose ≥ 7.0 mmol/L or an HbA1c of ≥ 6.5% at baseline (22). Dyslipidemia was defined by lipid abnormalities, including TC ≥ 240 mmol/L, LDL-C >160 mmol/L, TG>150 mmol/L, or HDL-C < 40 mmol/L or use of any lipid-lowering treatment (23).
The classification of CKM syndrome, as outlined in the AHA Statement, provides a comprehensive framework for the early assessment of risk factors and disease progression. Stage 0 is defined as the absence of CKM syndrome risk factors in healthy subjects. Stage 1 is characterized by overweight, abdominal obesity (waist circumference ≥ 80 cm in women and ≥ 90 cm in men), or prediabetes. Stage 2 involves the presence of at least one metabolic risk factor (such as hypertriglyceridemia, dyslipidemia, hypertension, metabolic syndrome, diabetes) or CKD. Stage 3 encompasses subclinical cardiovascular disease with a high predicted CVD risk calculated using the Framingham risk score. The estimated glomerular filtration rate (eGFR) was calculated using the Chinese Modification of Diet in Renal Disease (C-MDRD) equation to classify renal function according to the Kidney Disease Improving Global Outcomes (KDIGO) (3).
2.5 Statistical analysis
This study investigated HGI changes participants from Wave 1 and Wave 3 using k-means clustering within a logistic regression equation. K-means clustering, an unsupervised machine learning technique, groups data by minimizing distances within clusters, thereby partitioning the dataset into K distinct classes (24, 25). Each cluster was represented by a clustering center, defined as the mean value of all points within that cluster. The inflection point on the curve is considered the optimal number of clusters, representing the best division of the dataset. In our analysis, when K = 4, the curve tends to be steady (Supplementary Figure S1), so a four-cluster solution provided the optimal fit compared to other cluster counts (Figure 2). Data were presented as means ± standard deviation (SD) or median and interquartile range for continuous variables and percentages for categorical variables. Based on the result, we classified the participants into four groups: sustained low level (Class1); sustained medium level (Class2); high level and stable increasing (Class3); high level and fasting increasing (Class4). In Class 1 (n = 1305), the HGI ranged from -0.53 ± 0.39 in 2012 to 0.43 ± 0.46 in 2015, and the cumulative HGI was -0.10 ± 0.49, representing a consistently low and stable HGI; for Class 2 (n = 2334), the HGI ranged from 0.03 ± 0.25 in 2012 to 0.79 ± 0.31 in 2015, and the cumulative HGI was 0.82 ± 0.29, representing a sustained moderate HGI; for Class 3 (n = 902), the HGI ranged from 0.46 ± 0.44 in 2012 to 1.38 ± 0.49 in 2015, and the cumulative HGI was 1.83 ± 0.47, representing a high HGI with a slowly increasing trend (Figure 2). For Class 4 (n = 135), the HGI ranged from 1.51 ± 1.11 in 2012 to 3.46 ± 1.26 in 2015, and the cumulative HGI was 4.97 ± 1.36, representing a consistently high and fast increasing trend HGI.
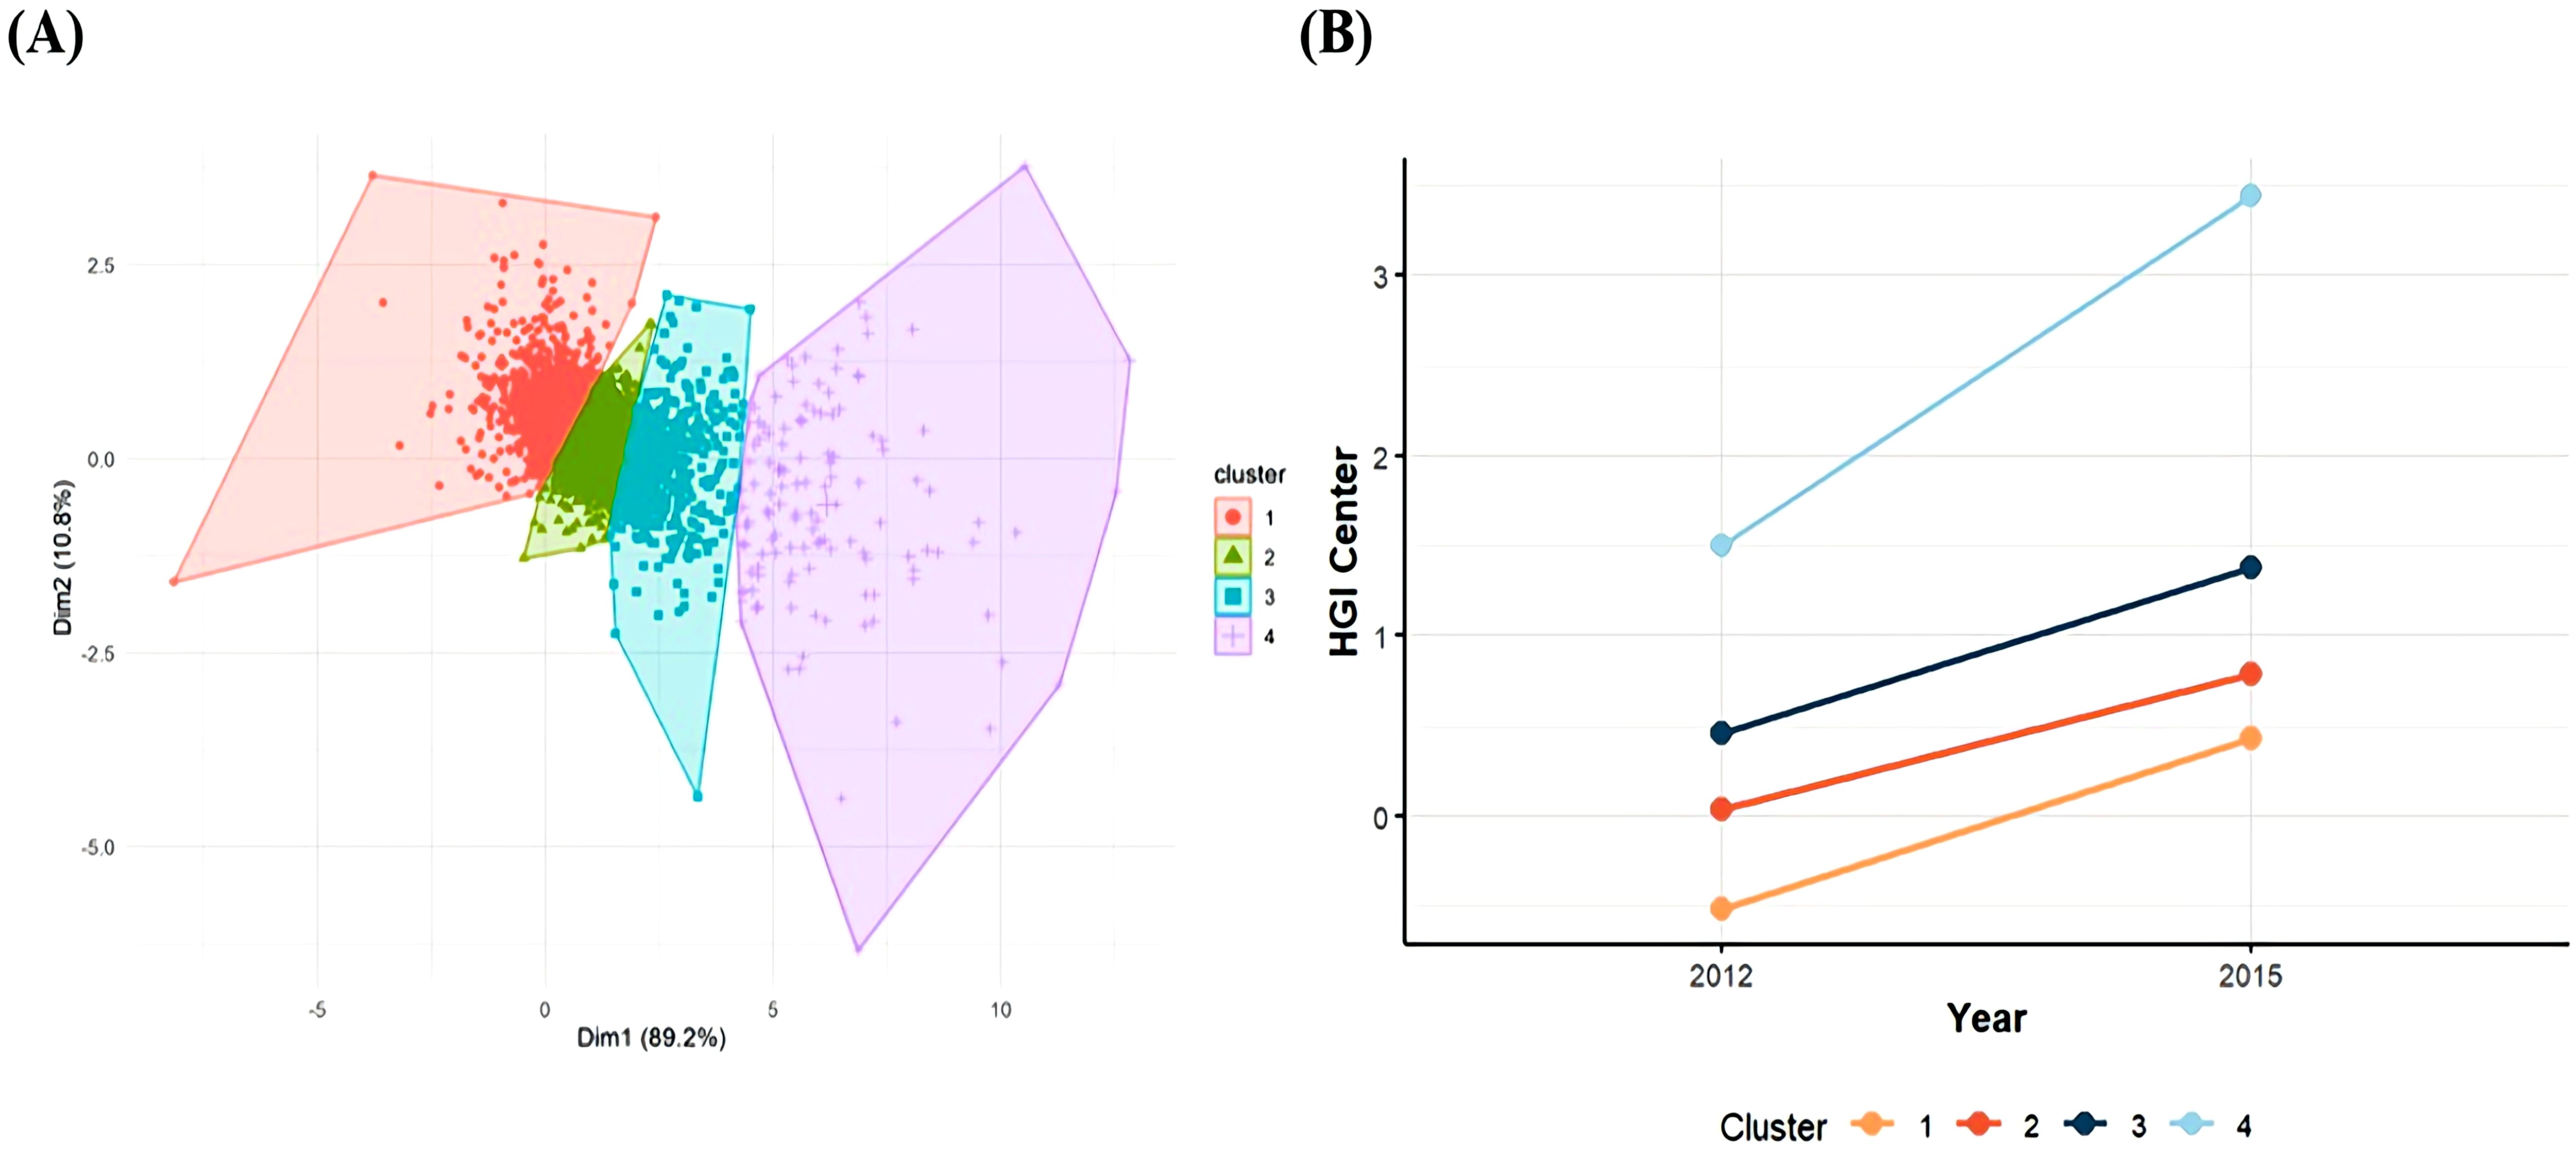
Figure 2. (A) The HGI clustering by k-means; (B) The trend of HGI changes in different clusters.
Before investigating the association between HGI and incident CVD, we first employed machine learning algorithms for feature selection to determine their importance in the prognostic model (26). To improve the accuracy of feature selection, the eXtreme Gradient Boosting (XGBoost) model combined with SHapley Additive extension (SHAP) values was employed for feature screening and dimensionality reduction through Python package (version 3.11.10), identifying key features associated with CVD incident. The importance and the contribution of each feature can be directly observed by plotting the SHAP summary plot. Multiple imputations were used to fill in missing data to maximize statistical power and mitigate any bias that may result from missing data (27). Two logistic regression models were used to estimate the association between changes and cumulative measures in HGI with CVD, quantified through odds ratio (ORs) and 95% confidence intervals (CIs).
To investigate potential nonlinear associations between cumulative HGI and CVD events, we employed a RCS regression model with four knots. Interaction analyses were conducted to determine whether the association between cumulative HGI and CVD varied across covariates.
Mediation analysis was conducted to determine whether this association was mediated by risk factors, such as BMI and triglyceride glucose (TyG) index (28). Mediation analysis was performed using the ‘mediation’ package.
All statistical analyses were performed using R version 4.3.3 software (http://www.R-project.org/). Statistical significance was set as a two-sided p value < 0.05.
3 Result
3.1 Baseline characteristics of participants
In this study, a total of 4,676 participants were included for analysis. The mean age at baseline was 58.62 ± 8.65 years, with 2,170 participants (46.41%) identifying as men. The mean HGI was 0.00 ± 0.58 in 2012 and 0.88 ± 0.71 in 2015. Table 1 presents the baseline characteristics of participants in each group based on the cluster analysis.
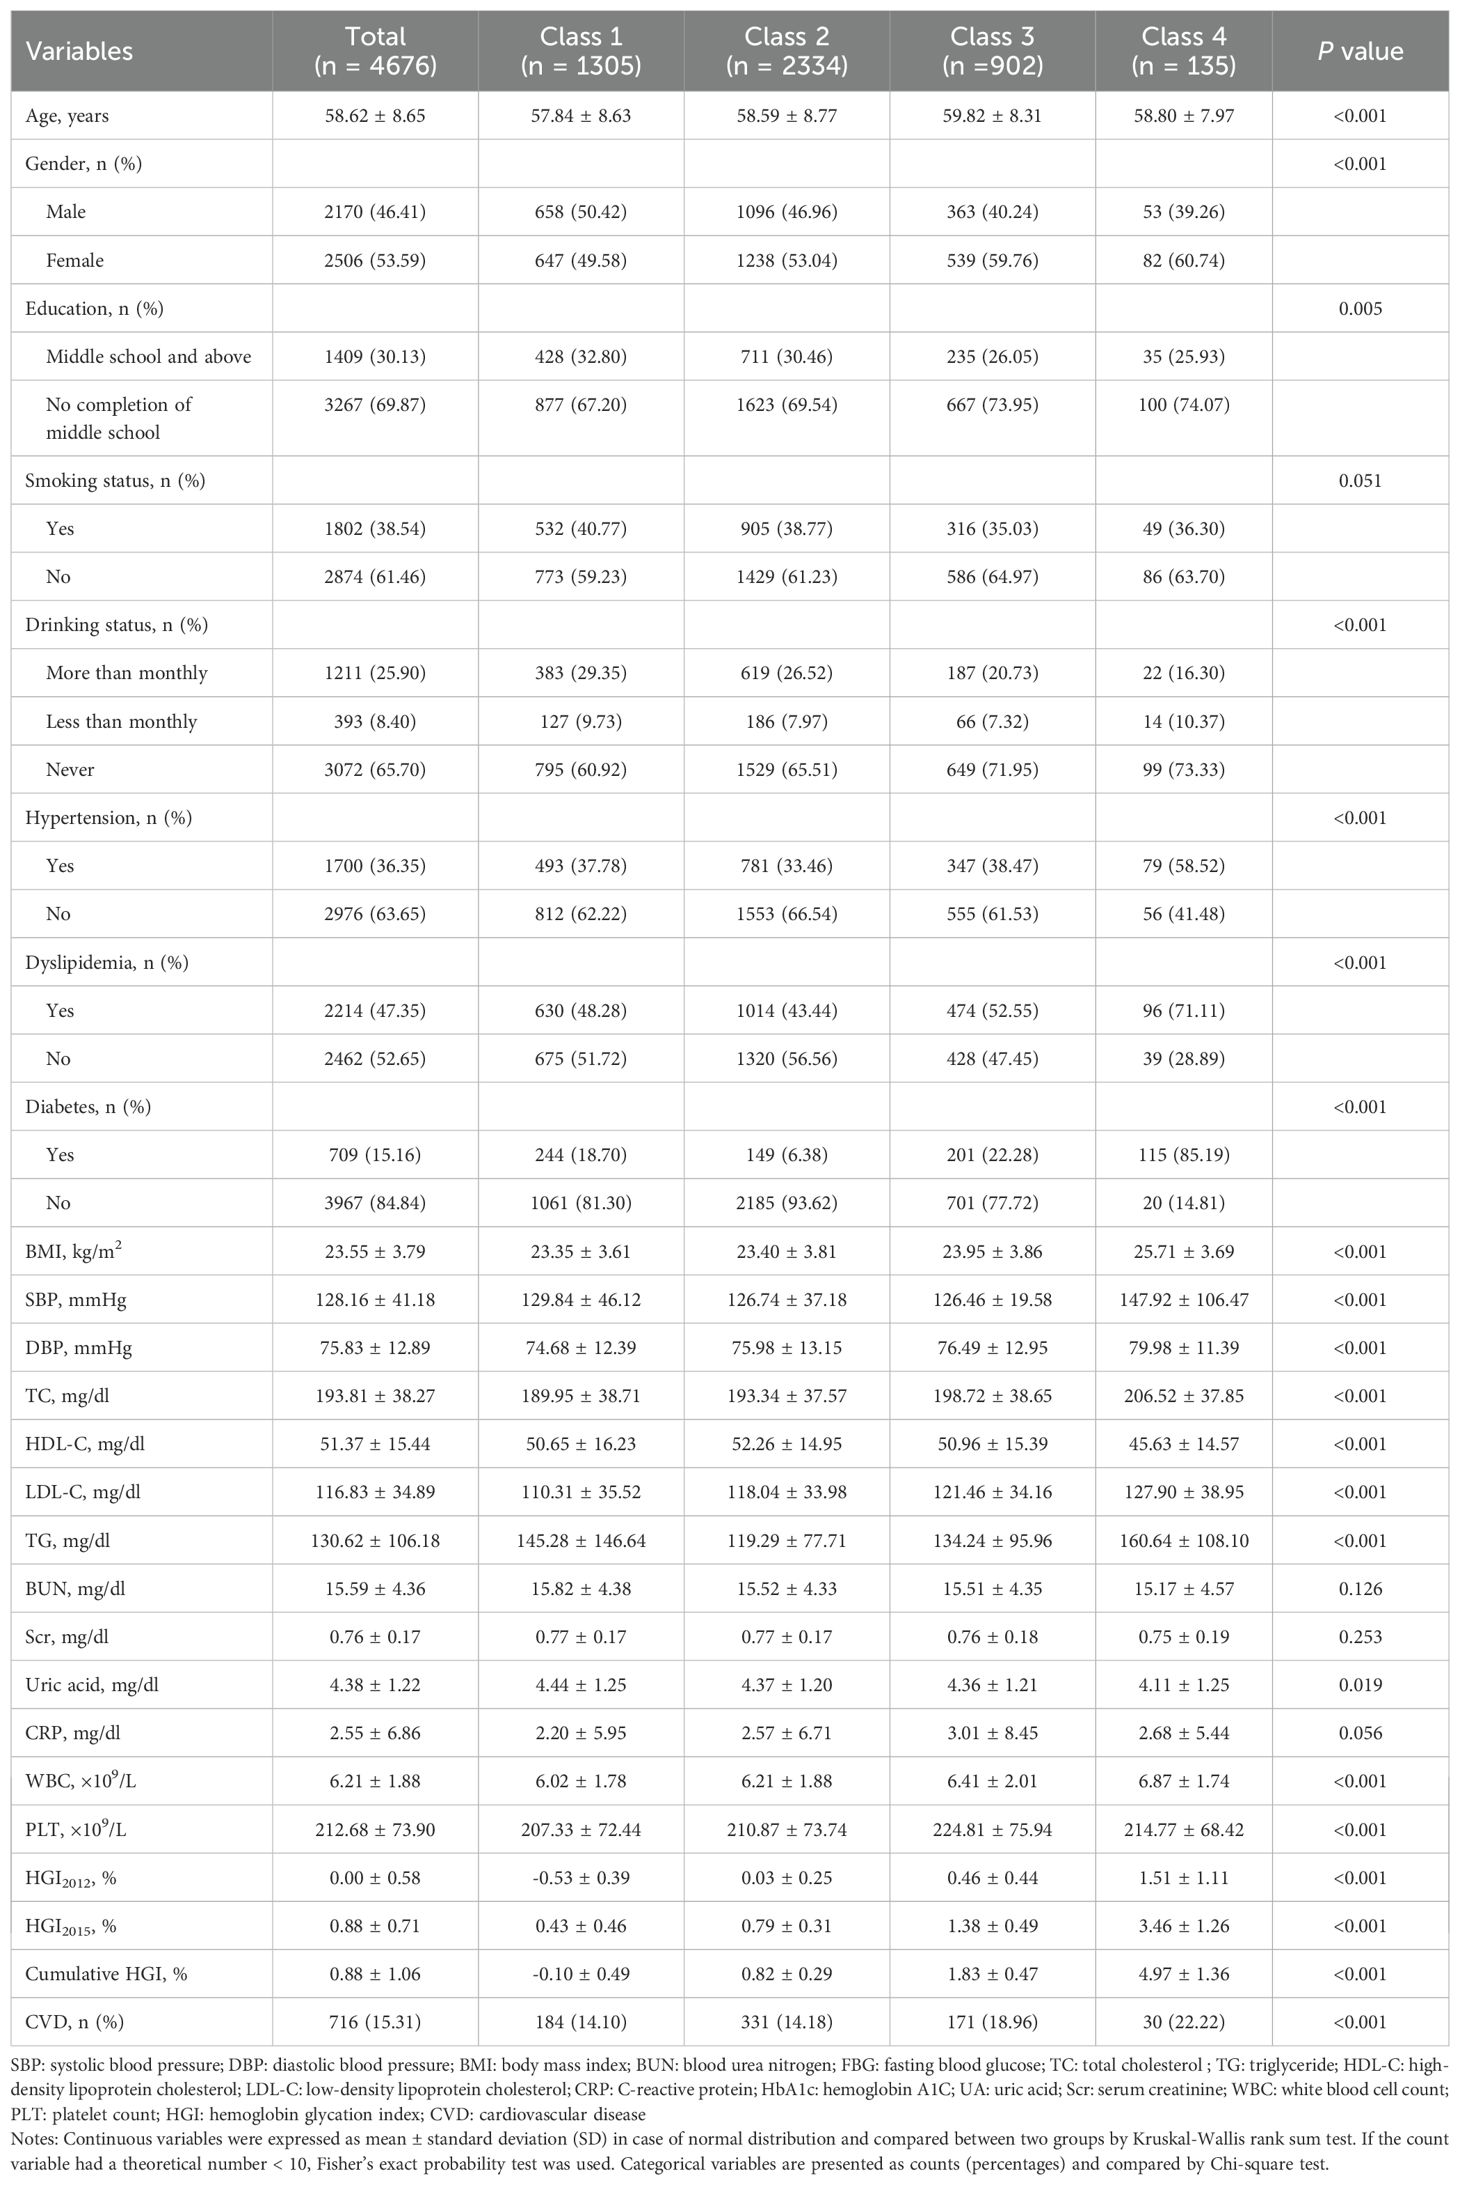
Table 1. Baseline characteristics of participants classified according to the changes of HGI.
Participants with higher and rapidly increasing levels of HGI were more likely to be female, older, and obese. Those also exhibited a greater prevalence of metabolic disorders, with significantly elevated levels of serum creatinine (Scr), serum uric acid (UA), TC, LDL-C, FBG, and HbA1c compared to participants in the lower-level clusters.
3.2 Association between the changes of HGI and CVD risk
The incidence of 944 CVD during the follow-up period was presented in Table 2. The regression models were developed based on clinical expertise and feature importance selection results from the XGBoost algorithms, as shown in Figure 3. After adjusting for age, gender, smoking status, drink status, education, SBP, TG, TC, UA, platelet (PLT), Scr, blood urea nitrogen(BUN), FBG, and C-reactive protein (CRP) in Model 2, the multivariate-adjusted OR and 95% CI from lowest stable group to highest rapid increasing group were1.00 (reference), 0.97 (0.80, 1.18), 1.32 (1.05, 1.67), and 1.63 (1.01, 2.64), respectively.

Table 2. Association between HGI and the risk of CVD in patients with early-stage CKM syndrome.
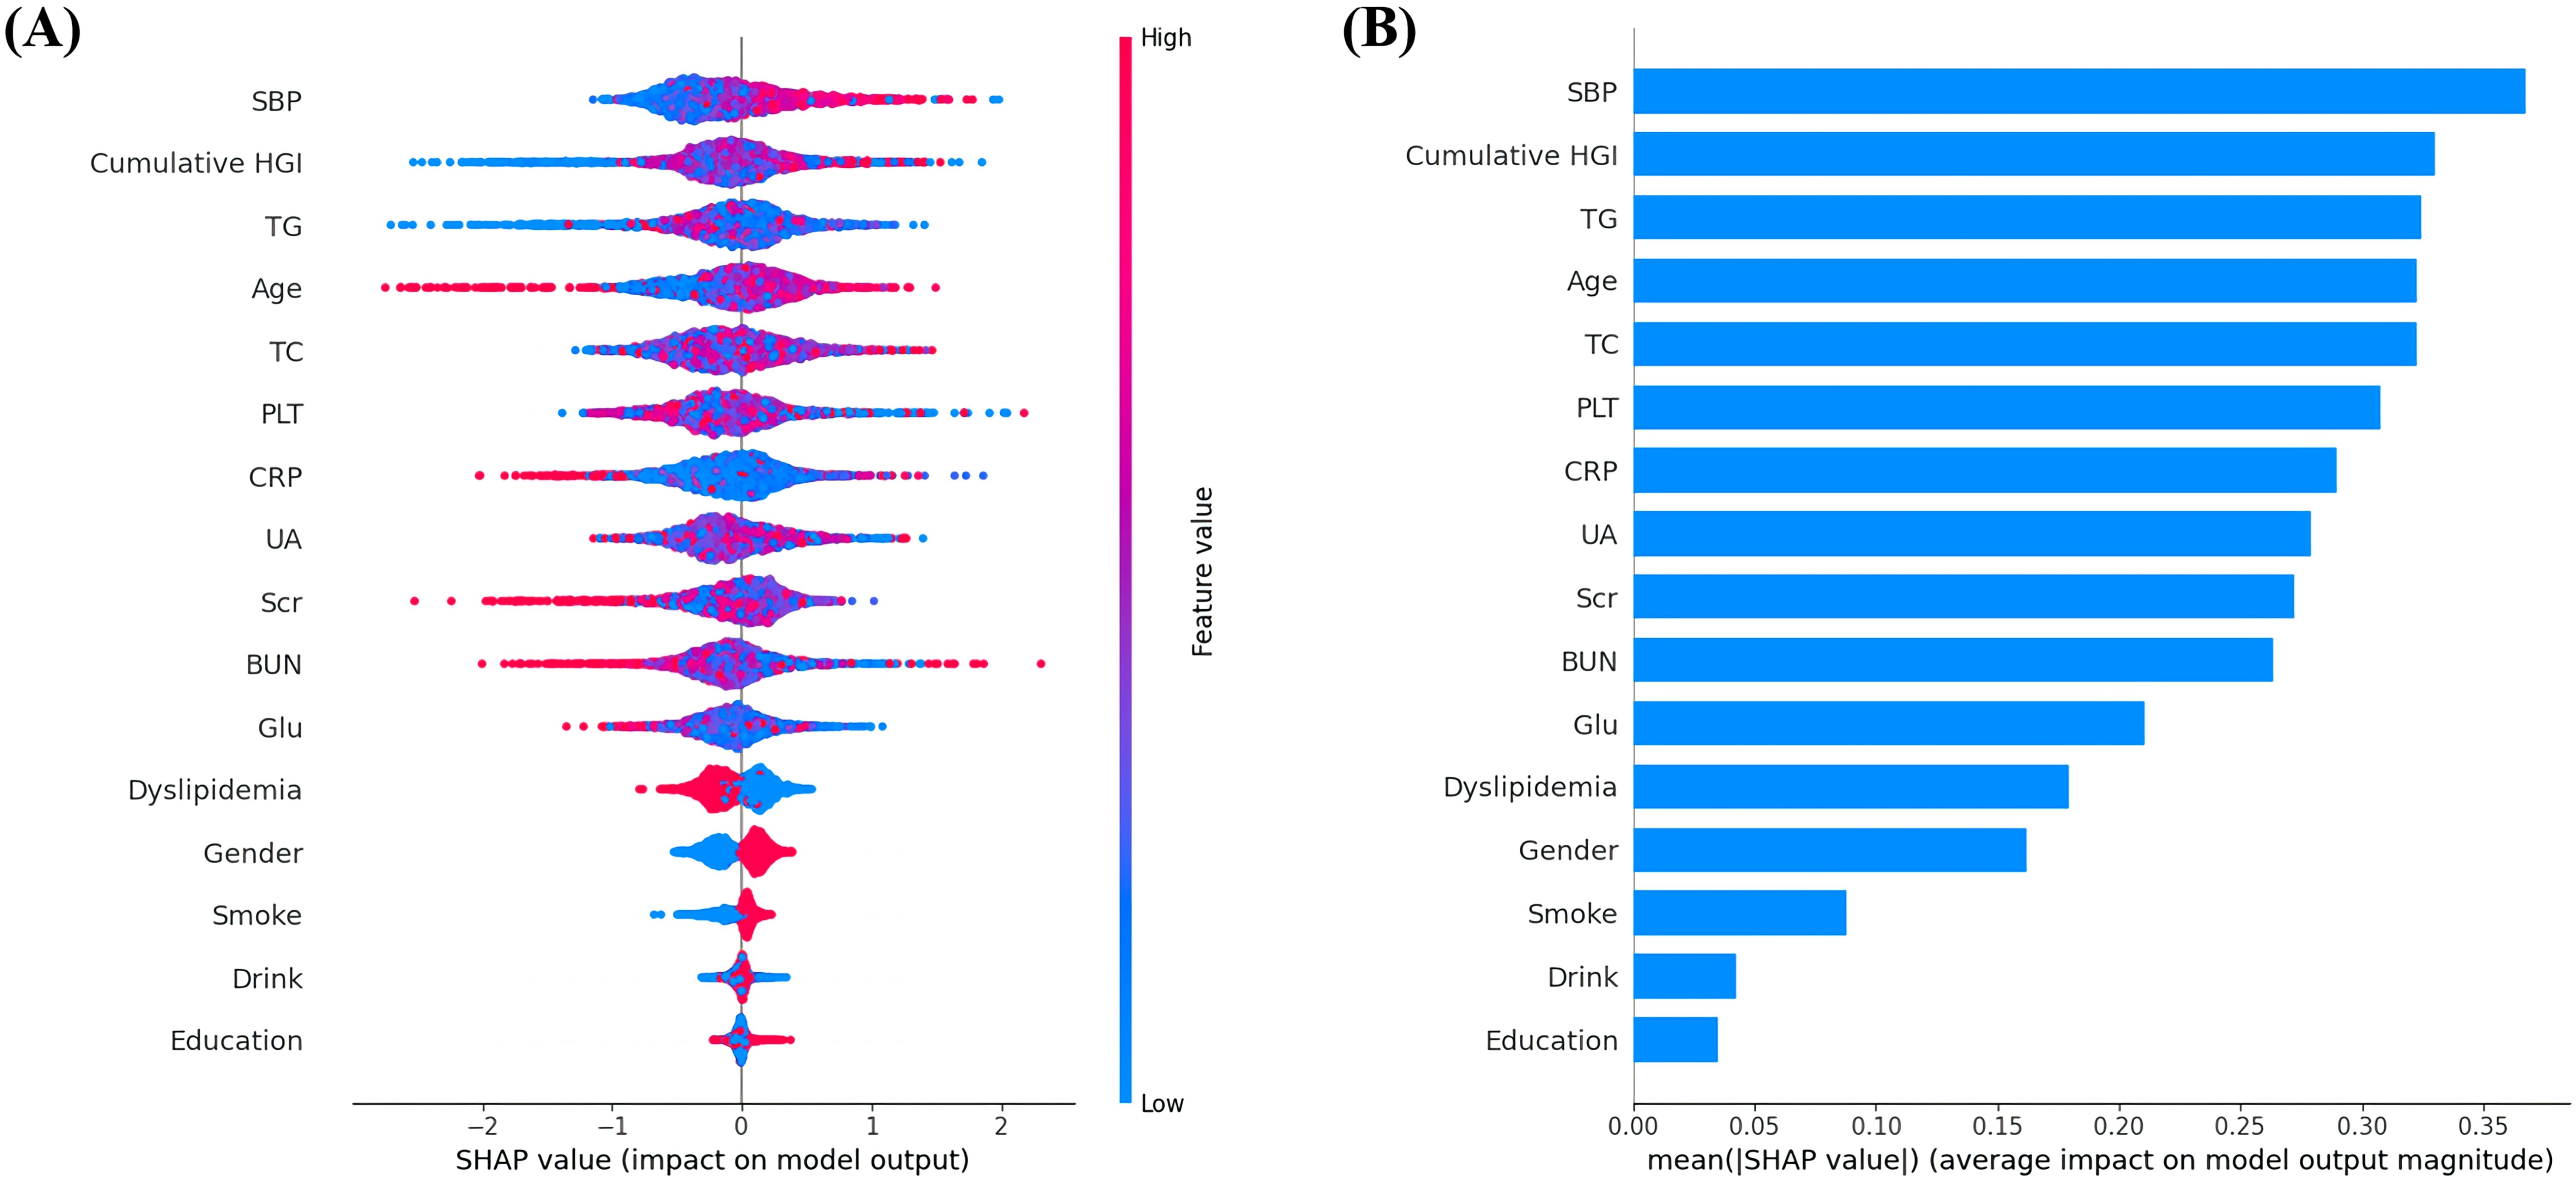
Figure 3. (A) Featured clinical variables screened by SHAP calculated by XGBoost model. Distribution of the impact of each feature on the model output. Each dot represents a patient in a row. The colors of the dots represent the feature values: red represents larger values and blue represents lower values. (B) The vertical axis shows the name of each variable, whereas the horizontal axis represents the feature value of each variable.
3.3 Association between the value of cumulative HGI and CVD risk
Multivariable logistic regression analyses also indicated a positive relationship between the cumulative HGI and CVD risk, with an adjusted OR of 1.08 (95% CI: 1.04, 1.13) (Table 2). RCS regression analysis further confirmed the linear increase in CVD risk associated with higher values of the cumulative HGI (P for nonlinearity = 0.967, Supplementary Figure S2).
Subgroup analyses and interaction tests were conducted to evaluate the consistency of the association between cumulative HGI and the risk of CVD across various individual subgroups, including age, gender, smoking status, hypertension, diabetes, dyslipidemia, and stage of CKM. Interaction terms were utilized to assess heterogeneity within each subgroup. No statistically significant interactions were identified regarding the association between cumulative HGI and CVD (Figure 4 and Supplementary Table S1).
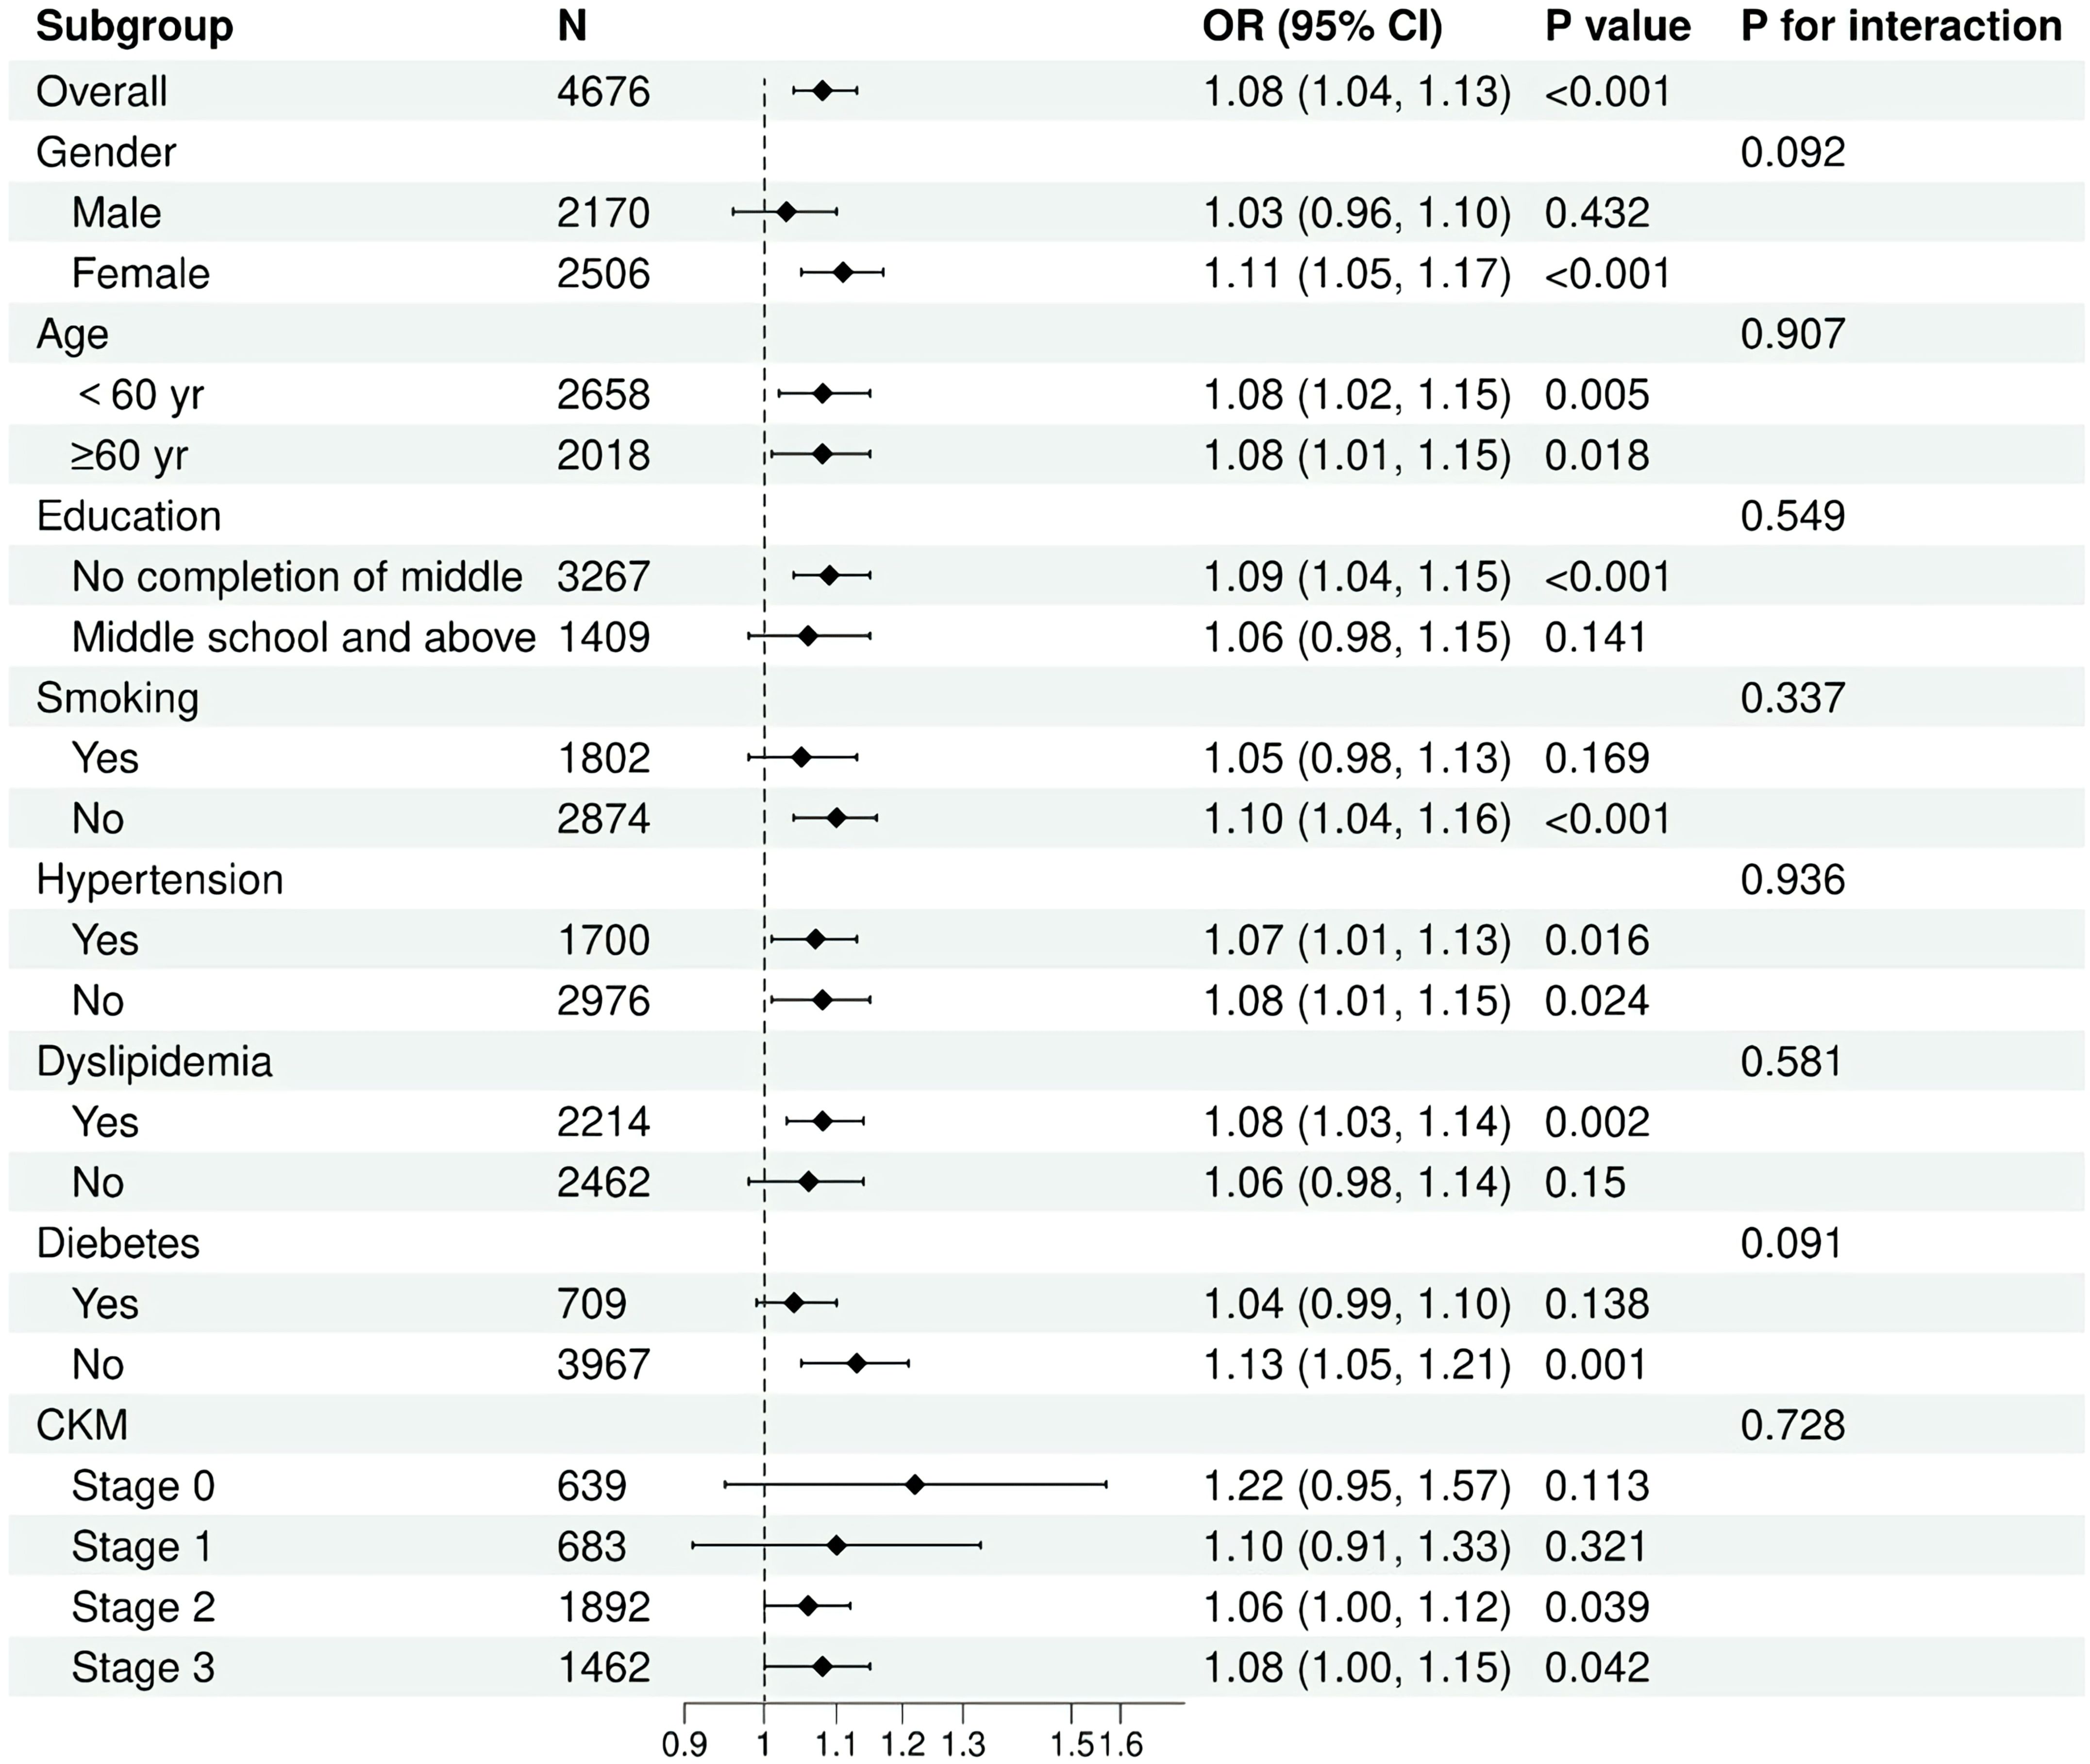
Figure 4. Forest plot of association between HGI and CVD in different subgroups.
Overall, our results indicated that the positive association between cumulative HGI and CVD risk remains consistent across different population subgroups and is applicable in various settings.
3.4 Mediation analysis
In mediation analysis, it was suggested that BMI partially mediates the relationship between the cumulative HGI index and CVD, accounting for approximately 18.6% of the effect. The mediating role of the TyG index in the association was 6.9%. Dyslipidemia also played a significant role in mediating the association between the HGI index and new-onset CVD, contributing approximately 11.0% to the effect. However, diabetes, hypertension, and the chronic inflammation biomarker CRP did not demonstrate a significant mediating effect (Table 3).
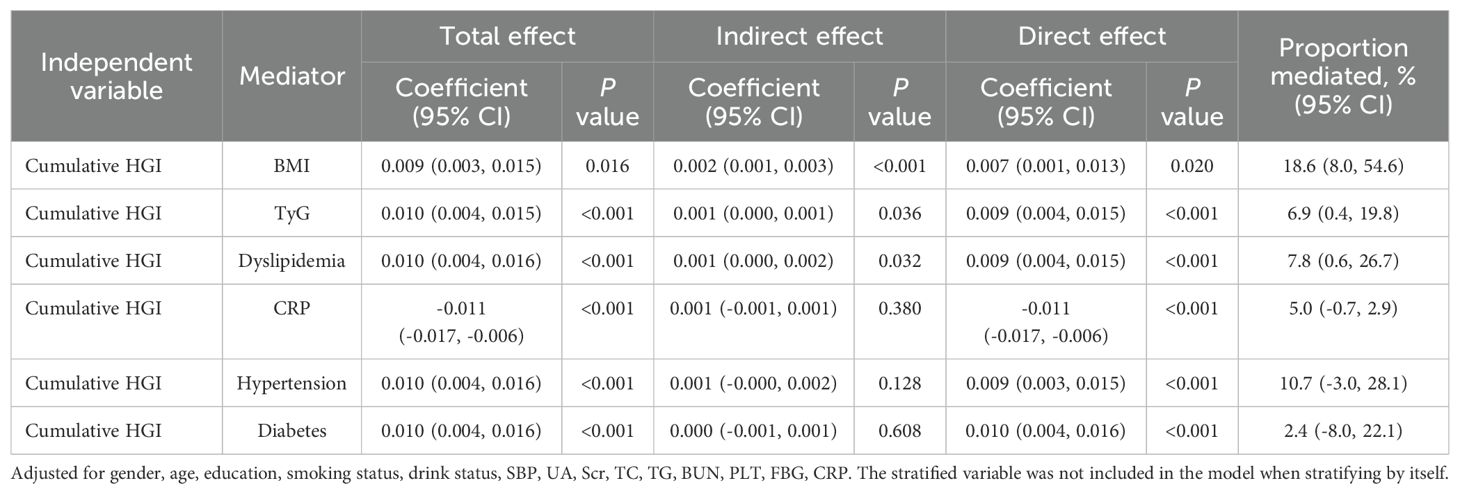
Table 3. Mediation analysis for the associations between Cumulative HGI and CVD in patients with early-stage CKM syndrome.
These findings emphasize the necessity of considering BMI and insulin resistance (IR) as an important risk factors in the development of strategies for preventing CVD in individuals with early-stage CKM syndrome, in conjunction with lipid control.
4 Discussion
This large prospective cohort study, based on data from CHARLS, is the first to investigate the association between HGI and the risk of CVD in early-stage CKM syndrome. Patients with CKM stages 0–3 who have not yet developed cardiovascular disease exhibit significant differences in clinical and metabolic characteristics across various groups. Individuals with high and rapidly increasing HGI levels demonstrate a greater prevalence of cardiovascular risk factors, leading to more complex comorbidities. HGI were the more important features than traditional risk factors such as FBG for predicting CVD. Additionally, we enhanced the understanding of the linear relationship between cumulative HGI and the incidence of CVD. TyG index, BMI and dyslipidemia showed potential mediating roles in the association between cumulative HGI and CVD. These findings further emphasize the crucial role of longitudinal monitoring of HGI in predicting CVD.
For patients with metabolic disorders, blood glucose levels are closely associated with the incidence and progression of vascular diseases. Hyperglycemia accelerates the non-enzymatic glycation of crucial proteins, causing the formation of glycated proteins. In addition to hemoglobin, other structural proteins are also susceptible to non-enzymatic glycation, leading to the formation of advanced glycation end products (AGEs) (29). AGEs trigger inflammatory signaling, enhance oxidative stress, and ultimately contribute to the development of atherosclerosis by damaging arterial endothelial cells and accelerating lipid oxidation (30). Although HbA1c remains a crucial tool for managing metabolic disorders, its limitations must be acknowledged. HGI could minimize clinical errors and optimize patient treatment, as a more personalized approach (19). Enhancing the management of HGI may not only help confirm the role of glycemic variability in the prevention and management of CKM syndrome, but also help make early lifestyle adjustments such as controlling glucose and cholesterol level.
This study is the first to investigate the association between cumulative HGI and CVD in a CKM syndrome population. Our results show that high cumulative level and rapidly growth of HGI is positively linked to the risk of CVD, consistent with previous research on single-measure HGI (31). In the Action to Control Cardiovascular Risk in Diabetes (ACCORD) trial, individual with high HGI values had a higher incidence of CVD (15). The ACCORD trial suggested that HGI could serve as a reference for adjusting treatment options to achieve improved CVD outcomes. Another study from Korea suggested that the development of CVD was significantly associated with baseline HGI in patients with type 2 diabetes (HR, 1.74; 95% CI, 1.08-2.81) (32). Due to the inter-individual variability of HGI, the large-scale studies are required to determine whether HGI can serve as a universality marker to assess CVD risk.
Asian populations bear a disproportionately high burden of diabetes and cardiovascular diseases. Due to genetic, dietary, and lifestyle factors, the relationship between HbA1c and blood glucose levels may exhibit unique characteristics in these populations (33). Longitudinal monitoring of the HGI can more accurately reflect glycemic variability and reduce the errors associated with relying solely on HbA1c. Our analysis also revealed this critical finding that the cumulative HGI demonstrated superior predictive capacity for CVD risk stratification in patients with CKM syndrome compared to conventional glucose metrics, including FBG. Some patients with diabetes exhibit higher postprandial glucose fluctuations and lower HbA1c levels, which may lead to an increased risk of inadequate glycemic control. By promoting the use of HGI monitoring, more precise glycemic assessment and personalized treatment strategies can be provided for Asian populations, thereby reducing the risk of cardiovascular diseases associated with CKM syndrome and minimizing potential harm caused by inaccurate glycemic evaluation and inappropriate therapeutic interventions.
Our findings revealed no statistical association between the HGI and CVD incidence during the ultra-early stages of CKM syndrome (stages 0 to 1). In individuals at stages 2 and 3 with elevated metabolic risk factors, the association between cumulative HGI and CVD incidence was more pronounced. This may be attributed to the fact that, metabolic disturbances in individuals may not yet reach the threshold level required to trigger cardiovascular risk in the early stages of CKM. Specifically, studies have shown that metabolic abnormalities, such as insulin resistance and chronic inflammation, need to accumulate to a certain extent before they can significantly impact vascular function and tissue damage (34). As an indicator reflecting long-term glycemic variability and hemoglobin glycation heterogeneity, HGI may lack sufficient sensitivity in the early stages when metabolic disturbances are relatively mild. This hypothesis is consistent with previous research, which indicates that the predictive ability of HbA1c and HGI is weaker in the prediabetic or early metabolic syndrome stages but becomes significantly enhanced as the disease progresses (35). During CKM stages 0-1, individuals may partially offset the vascular damage caused by glycemic fluctuations through compensatory mechanisms, such as enhanced insulin secretion or antioxidant capacity, thereby masking the predictive value of HGI. As the disease progresses to CKM stages 2-3, the decline in metabolic compensatory capacity allows the association between HGI and CVD risk to become more apparent. The latter stages of CKM are often accompanied by more pronounced chronic inflammation and oxidative stress, which may amplify the predictive role of HGI in CVD risk.
Reduced insulin sensitivity is considered as a significant risk factor for atherosclerotic disease (36), and serves as a central contributor to cardiovascular risk factors such as visceral obesity, atherogenic dyslipidemia, and hypertension, which frequently co-occur in individuals with metabolic disorders (37). In our study, an essential finding is that IR related indicators (TyG), BMI and dyslipidemia partially mediated the relationship between cumulative HGI and CVD. There is evidence that elevated HGI relate to the IR and increased risk of vascular atherosclerosis (38). The promotion of AGEs may alter insulin receptor signaling and impair glucose-uptake. In animal models, oral advanced AGEs have been shown to induce insulin resistance, contributing to metabolic disorders and lipid toxicity (39, 40).
IR can affect glucose metabolism through inflammatory factors, macrophage and adipocyte activation, and the renin–angiotensin–aldosterone system, can contribute to cardiac dysfunction and myocardial injury, ultimately leading to various cardiovascular diseases. Previous research has established that individuals with a metabolically healthy obesity phenotype face a higher risk of CVD compared to those with a metabolically healthy normal-weight profile (41). Marini et al. reported that elevated HGI may reflect the risk of metabolic disease associated with obesity (38). Our research further corroborates this finding. A study involving patients in American showed that BMI interacts with HGI, such that lower levels are associated with cardiovascular benefits (42). Regarding blood pressure, previous studies confirmed that BP status significantly modified the associations between cardiometabolic risk factors and CVD (43). HGI was found to be linked to arterial stiffening, independent of diabetes status (44).
With the progression of population aging, declining metabolic function and heightened chronic inflammatory states may amplify the impact of glycemic variability on CVD risk (45). Age is a non-modifiable risk factor for vascular diseases such as coronary heart disease and stroke, but metabolic abnormalities may represent critical modifiable targets for risk reduction (46). In age-stratified analyses, although the interaction P-value did not reach statistical significance, it is noteworthy that the strength of the association between HGI levels and CVD risk was more pronounced in the older age group compared to the middle-aged group. Based on the CHARLS database of older adults, this study demonstrates that HGI serves as a robust independent predictor of coronary heart disease risk. Given the accelerating global aging population, HGI is expected to play an increasingly significant role in risk stratification, offering valuable insights for early identification of high-risk individuals and the development of personalized intervention strategies.
To our knowledge, this is the first study to explore the mediating effects of these risk factors in the relationship between the HGI and adverse health outcomes. Although CRP was not identified as mediators in this association, this does not negate their potential relationship with HGI and CVD.
The potential limitations of this study should not be overlooked. First, the exclusion of individuals without FBG and HbA1c measurements led to the omission of a significant portion of the diabetic metabolic population, which may affect the findings. Second, CVD diagnoses in CHARLS were self-reported, and no further adjudication of CVD events was conducted. Third, HbA1c measurements in CHARLS were only taken at two time points (2012 and 2015), which may not adequately capture short-term fluctuations or the complete metabolic trajectory, potentially influencing the observed relationship. Fourthly, due to the limited variables available in the database, residual confounding from unmeasured inflammatory mediators or adipose-derived hormones might partially mediate the observed HGI-CVD association. Lastly, since HGI may have ethnic variability, multinational multicenter validation studies are necessary to establish its broader clinical applicability.
5 Conclusion
This study found that a rapidly increasing and high cumulative level of HGI was associated with an elevated risk of CVD progression in individuals with early-stage CKM syndrome. This association was partially mediated by BMI, TyG and dyslipidemia. HGI can serve as an independent predictor for assessing cardiovascular risk in patients with CKM syndrome. Our findings offer new insights into the potential relationship between blood glucose control, insulin resistance, lipid metabolism, and CVD in individuals with CKM syndrome. Clinicians should consider regular HGI monitoring to facilitate timely lifestyle interventions or therapy adjustments.
Data availability statement
The original contributions presented in the study are included in the article/Supplementary Material. Further inquiries can be directed to the corresponding author.
Author contributions
HL: Conceptualization, Data curation, Methodology, Writing – original draft. SM: Conceptualization, Writing – original draft. YZ: Conceptualization, Writing – original draft. LD: Data curation, Writing – original draft. YW: Data curation, Writing – original draft. CL: Writing – review & editing. TY: Conceptualization, Writing – review & editing.
Funding
The author(s) declare that financial support was received for the research and/or publication of this article. This work was supported by grants from the National Natural Science Foundation, China (No. 82170352), the Logistic Health Care Foundation, China (No. 22BJZ31), the Logistics Scientific Research Foundation of China (No. BLB21J004), PLA General Hospital Youth Independent Innovation Science Fund project (No. 22QNFC040), National Clinical Research Center for Geriatric Diseases Fund Open Project (No. NCRCG-PLAGH-2024004) and National Health Commission pharmaceutical Department purchase service subject.
Acknowledgments
The authors thank all the members of the CHALRS for their contributions and the participants who contributed their data.
Conflict of interest
The authors declare that the research was conducted in the absence of any commercial or financial relationships that could be construed as a potential conflict of interest.
Generative AI statement
The author(s) declare that no Generative AI was used in the creation of this manuscript.
Publisher’s note
All claims expressed in this article are solely those of the authors and do not necessarily represent those of their affiliated organizations, or those of the publisher, the editors and the reviewers. Any product that may be evaluated in this article, or claim that may be made by its manufacturer, is not guaranteed or endorsed by the publisher.
Supplementary material
The Supplementary Material for this article can be found online at: https://www.frontiersin.org/articles/10.3389/fendo.2025.1554032/full#supplementary-material
References
1. Ostrominski JW, Arnold SV, Butler J, Fonarow GC, Hirsch JS, Palli SR, et al. Prevalence and overlap of cardiac, renal, and metabolic conditions in US adults, 1999-2020. JAMA Cardiol. (2023) 8:1050–60. doi: 10.1001/jamacardio.2023.3241
2. Wang Y, Yu Y, Zhang H, Chen C, Wan H, Chen Y, et al. Cardiovascular and renal burdens among patients with MAFLD and NAFLD in China. Front Endocrinol (Lausanne). (2022) 13:968766. doi: 10.3389/fendo.2022.968766
3. Ndumele CE, Rangaswami J, Chow SL, Neeland IJ, Tuttle KR, Khan SS, et al. Cardiovascular-kidney-metabolic health: A presidential advisory from the American heart association. Circulation. (2023) 148:1606–35. doi: 10.1161/cir.0000000000001184
4. Afkarian M, Sachs MC, Kestenbaum B, Hirsch IB, Tuttle KR, Himmelfarb J, et al. Kidney disease and increased mortality risk in type 2 diabetes. J Am Soc Nephrol. (2013) 24:302–8. doi: 10.1681/asn.2012070718
5. Khan SS, Coresh J, Pencina MJ, Ndumele CE, Rangaswami J, Chow SL, et al. Novel prediction equations for absolute risk assessment of total cardiovascular disease incorporating cardiovascular-kidney-metabolic health: A scientific statement from the American heart association. Circulation. (2023) 148:1982–2004. doi: 10.1161/cir.0000000000001191
6. Li W, Shen C, Kong W, Zhou X, Fan H, Zhang Y, et al. Association between the triglyceride glucose-body mass index and future cardiovascular disease risk in a population with Cardiovascular-Kidney-Metabolic syndrome stage 0-3: a nationwide prospective cohort study. Cardiovasc Diabetol. (2024) 23:292. doi: 10.1186/s12933-024-02352-6
7. ElSayed NA, Aleppo G, Aroda VR, Bannuru RR, Brown FM, Bruemmer D, et al. 2. Classification and diagnosis of diabetes: standards of care in diabetes-2023. Diabetes Care. (2023) 46:S19–s40. doi: 10.2337/dc23-S002
8. Brownlee M. Glycation products and the pathogenesis of diabetic complications. Diabetes Care. (1992) 15:1835–43. doi: 10.2337/diacare.15.12.1835
9. Campbell L, Pepper T, Shipman K. HbA1c: a review of non-glycaemic variables. J Clin Pathol. (2019) 72:12–9. doi: 10.1136/jclinpath-2017-204755
10. Macdonald DR, Hanson AM, Holland MR, Singh BM. Clinical impact of variability in HbA1c as assessed by simultaneously measuring fructosamine and use of error grid analysis. Ann Clin Biochem. (2008) 45:421–5. doi: 10.1258/acb.2008.007259
11. Khera PK, Joiner CH, Carruthers A, Lindsell CJ, Smith EP, Franco RS, et al. Evidence for interindividual heterogeneity in the glucose gradient across the human red blood cell membrane and its relationship to hemoglobin glycation. Diabetes. (2008) 57:2445–52. doi: 10.2337/db07-1820
12. Brown SM, Smith DM, Alt N, Thorpe SR, Baynes JW. Tissue-specific variation in glycation of proteins in diabetes: evidence for a functional role of amadoriase enzymes. Ann N Y Acad Sci. (2005) 1043:817–23. doi: 10.1196/annals.1333.094
13. Malka R, Nathan DM, Higgins JM. Mechanistic modeling of hemoglobin glycation and red blood cell kinetics enables personalized diabetes monitoring. Sci Transl Med. (2016) 8:359ra130. doi: 10.1126/scitranslmed.aaf9304
14. Dunn TC, Xu Y, Bergenstal RM, Ogawa W, Ajjan RA. Personalized glycated hemoglobin in diabetes management: closing the gap with glucose management indicator. Diabetes Technol Ther. (2023) 25:S65–s74. doi: 10.1089/dia.2023.0146
15. Hempe JM, Liu S, Myers L, McCarter RJ, Buse JB, Fonseca V. The hemoglobin glycation index identifies subpopulations with harms or benefits from intensive treatment in the ACCORD trial. Diabetes Care. (2015) 38:1067–74. doi: 10.2337/dc14-1844
16. Klein KR, Franek E, Marso S, Pieber TR, Pratley RE, Gowda A, et al. Hemoglobin glycation index, calculated from a single fasting glucose value, as a prediction tool for severe hypoglycemia and major adverse cardiovascular events in DEVOTE. BMJ Open Diabetes Res Care. (2021) 9(2)::e002339. doi: 10.1136/bmjdrc-2021-002339
17. Wang Y, Liu H, Hu X, Wang A, Wang A, Kang S, et al. Association between hemoglobin glycation index and 5-year major adverse cardiovascular events: the REACTION cohort study. Chin Med J (Engl). (2023) 136:2468–75. doi: 10.1097/cm9.0000000000002717
18. Lin L, Wang A, He Y, Wang W, Gao Z, Tang X, et al. Effects of the hemoglobin glycation index on hyperglycemia diagnosis: Results from the REACTION study. Diabetes Res Clin Pract. (2021) 180:109039. doi: 10.1016/j.diabres.2021.109039
19. Hempe JM, Gomez R, McCarter RJ Jr., Chalew SA. High and low hemoglobin glycation phenotypes in type 1 diabetes: a challenge for interpretation of glycemic control. J Diabetes Complications. (2002) 16:313–20. doi: 10.1016/s1056-8727(01)00227-6
20. Liang D, Liu C, Wang Y. The association between triglyceride-glucose index and the likelihood of cardiovascular disease in the U.S. population of older adults aged ≥ 60 years: a population-based study. Cardiovasc Diabetol. (2024) 23:151. doi: 10.1186/s12933-024-02248-5
21. Cui C, Liu L, Qi Y, Han N, Xu H, Wang Z, et al. Joint association of TyG index and high sensitivity C-reactive protein with cardiovascular disease: a national cohort study. Cardiovasc Diabetol. (2024) 23:156. doi: 10.1186/s12933-024-02244-9
22. Wu X, Gao Y, Wang M, Peng H, Zhang D, Qin B, et al. Atherosclerosis indexes and incident T2DM in middle-aged and older adults: evidence from a cohort study. Diabetol Metab Syndr. (2023) 15:23. doi: 10.1186/s13098-023-00992-4
23. Huo RR, Zhai L, Liao Q, You XM. Changes in the triglyceride glucose-body mass index estimate the risk of stroke in middle-aged and older Chinese adults: a nationwide prospective cohort study. Cardiovasc Diabetol. (2023) 22:254. doi: 10.1186/s12933-023-01983-5
24. Rodriguez A, Laio A. Machine learning. Clustering by fast search and find of density peaks. Science. (2014) 344:1492–6. doi: 10.1126/science.1242072
25. Chandrasekar V, Mohammad S, Aboumarzouk O, Singh AV, Dakua SP. Quantitative prediction of toxicological points of departure using two-stage machine learning models: A new approach methodology (NAM) for chemical risk assessment. J Hazard Mater. (2025) 487:137071. doi: 10.1016/j.jhazmat.2024.137071
26. Singh AV, Bhardwaj P, Laux P, Pradeep P, Busse M, Luch A, et al. AI and ML-based risk assessment of chemicals: predicting carcinogenic risk from chemical-induced genomic instability. Front Toxicol. (2024) 6:1461587. doi: 10.3389/ftox.2024.1461587
27. Patrician PA. Multiple imputation for missing data. Res Nurs Health. (2002) 25:76–84. doi: 10.1002/nur.10015
28. Hou XZ, Lv YF, Li YS, Wu Q, Lv QY, Yang YT, et al. Association between different insulin resistance surrogates and all-cause mortality in patients with coronary heart disease and hypertension: NHANES longitudinal cohort study. Cardiovasc Diabetol. (2024) 23:86. doi: 10.1186/s12933-024-02173-7
29. Ahmed N, Thornalley PJ. Advanced glycation endproducts: what is their relevance to diabetic complications? Diabetes Obes Metab. (2007) 9:233–45. doi: 10.1111/j.1463-1326.2006.00595.x
30. Yang P, Feng J, Peng Q, Liu X, Fan Z. Advanced glycation end products: potential mechanism and therapeutic target in cardiovascular complications under diabetes. Oxid Med Cell Longev. (2019) 2019:9570616. doi: 10.1155/2019/9570616
31. Yang J, Shangguan Q, Xie G, Yang M, Sheng G. Sex-specific associations between haemoglobin glycation index and the risk of cardiovascular and all-cause mortality in individuals with pre-diabetes and diabetes: A large prospective cohort study. Diabetes Obes Metab. (2024) 26:2275–83. doi: 10.1111/dom.15541
32. Kim MK, Jeong JS, Yun JS, Kwon HS, Baek KH, Song KH, et al. Hemoglobin glycation index predicts cardiovascular disease in people with type 2 diabetes mellitus: A 10-year longitudinal cohort study. J Diabetes Complications. (2018) 32:906–10. doi: 10.1016/j.jdiacomp.2018.08.007
33. Lucke-Wold B, Misra R, Patel TG. Risk factors for low high-density lipoprotein among Asian Indians in the United States. World J Diabetes. (2017) 8:297–303. doi: 10.4239/wjd.v8.i6.297
34. Nielsen RV, Fuster V, Bundgaard H, Fuster JJ, Johri AM, Kofoed KF, et al. Personalized intervention based on early detection of atherosclerosis: JACC state-of-the-art review. J Am Coll Cardiol. (2024) 83:2112–27. doi: 10.1016/j.jacc.2024.02.053
35. Rodriguez-Segade S, Rodriguez J, García-López JM, Casanueva FF, Coleman IC. Alonso de la Peña C, et al. Influence of the glycation gap on the diagnosis of type 2 diabetes. Acta Diabetol. (2015) 52:453–9. doi: 10.1007/s00592-014-0666-z
36. Rutter MK, Meigs JB, Sullivan LM, D’Agostino RB Sr., Wilson PW. Insulin resistance, the metabolic syndrome, and incident cardiovascular events in the Framingham Offspring Study. Diabetes. (2005) 54:3252–7. doi: 10.2337/diabetes.54.11.3252
37. Reaven GM. Banting lecture 1988. Role of insulin resistance in human disease. Diabetes. (1988) 37:1595–607. doi: 10.2337/diab.37.12.1595
38. Marini MA, Fiorentino TV, Succurro E, Pedace E, Andreozzi F, Sciacqua A, et al. Association between hemoglobin glycation index with insulin resistance and carotid atherosclerosis in non-diabetic individuals. PloS One. (2017) 12:e0175547. doi: 10.1371/journal.pone.0175547
39. Felipe DL, Hempe JM, Liu S, Matter N, Maynard J, Linares C, et al. Skin intrinsic fluorescence is associated with hemoglobin A(1c)and hemoglobin glycation index but not mean blood glucose in children with type 1 diabetes. Diabetes Care. (2011) 34:1816–20. doi: 10.2337/dc11-0049
40. Goldin A, Beckman JA, Schmidt AM, Creager MA. Advanced glycation end products: sparking the development of diabetic vascular injury. Circulation. (2006) 114:597–605. doi: 10.1161/circulationaha.106.621854
41. Eckel N, Li Y, Kuxhaus O, Stefan N, Hu FB, Schulze MB. Transition from metabolic healthy to unhealthy phenotypes and association with cardiovascular disease risk across BMI categories in 90 257 women (the Nurses’ Health Study): 30 year follow-up from a prospective cohort study. Lancet Diabetes Endocrinol. (2018) 6:714–24. doi: 10.1016/s2213-8587(18)30137-2
42. Basu S, Raghavan S, Wexler DJ, Berkowitz SA. Characteristics associated with decreased or increased mortality risk from glycemic therapy among patients with type 2 diabetes and high cardiovascular risk: machine learning analysis of the ACCORD trial. Diabetes Care. (2018) 41:604–12. doi: 10.2337/dc17-2252
43. Qiu W, Cai A, Nie Z, Wang J, Ou Y, Feng Y. Cardiometabolic factors and population risks of cardiovascular disease in community-dwelling adults with varied blood pressure statuses. Diabetes Obes Metab. (2024) 26:3261–71. doi: 10.1111/dom.15653
44. Nagayama D, Watanabe Y, Yamaguchi T, Saiki A, Shirai K, Tatsuno I. High hemoglobin glycation index is associated with increased systemic arterial stiffness independent of hyperglycemia in real-world Japanese population: A cross-sectional study. Diabetes Vasc Dis Res. (2020) 17:1479164120958625. doi: 10.1177/1479164120958625
45. Dahlquist KJV, Camell CD. Aging leukocytes and the inflammatory microenvironment of the adipose tissue. Diabetes. (2022) 71:23–30. doi: 10.2337/dbi21-0013
Keywords: HGI, glycemic variability, cardiovascular kidney metabolic syndrome, CVD, CHARLS
Citation: Liu H, Mao S, Zhao Y, Dong L, Wang Y, Lv C and Yin T (2025) Association between hemoglobin glycation index and the risk of cardiovascular disease in early-stage cardiovascular-kidney-metabolic syndrome: evidence from the China health and retirement longitudinal study. Front. Endocrinol. 16:1554032. doi: 10.3389/fendo.2025.1554032
Received: 31 December 2024; Accepted: 16 April 2025;
Published: 08 May 2025.
Edited by:
Jaideep Menon, Amrita Vishwa Vidyapeetham University, IndiaReviewed by:
Brandon Peter Lucke-Wold, University of Florida, United StatesAjay Vikram Singh, Federal Institute for Risk Assessment (BfR), Germany
Mostafa Vaghari-Tabari, Tabriz University of Medical Sciences, Iran
Copyright © 2025 Liu, Mao, Zhao, Dong, Wang, Lv and Yin. This is an open-access article distributed under the terms of the Creative Commons Attribution License (CC BY). The use, distribution or reproduction in other forums is permitted, provided the original author(s) and the copyright owner(s) are credited and that the original publication in this journal is cited, in accordance with accepted academic practice. No use, distribution or reproduction is permitted which does not comply with these terms.
*Correspondence: Tong Yin, eWludG9uZzMwMUAxNjMuY29t
†These authors have contributed equally to this work