 Shixue Bao1
 Qiankai Jin
 Yushan Mao
- 1Department of Endocrinology, The First Affiliated Hospital of Ningbo University, Ningbo, Zhejiang, China
- 2Department of Endocrinology, Beilun People's Hospital, Ningbo, Zhejiang, China
Background: Non-alcoholic fatty liver disease (NAFLD) is the most common chronic liver disease, seriously threatening the public health. Although the proportion of patients with lean NAFLD is lower than that of patients with obese NALFD, it should not be overlooked. This study aimed to construct interpretable machine learning models for predicting lean NAFLD risk in type 2 diabetes mellitus (T2DM) patients.
Methods: This study enrolled 1,553 T2DM individuals who received health care at the First Affiliated Hospital of Ningbo University, Ningbo, China, from November 2019 to November 2024. Feature screening was performed using the Boruta algorithm and the Least Absolute Shrinkage and Selection Operator (LASSO). Linear discriminant analysis (LDA), logistic regression (LR), Naive Bayes (NB), random forest (RF), support vector machine (SVM), and extreme gradient boosting (XGboost) were used in constructing risk prediction models for lean NAFLD in T2DM patients. The area under the receiver operating characteristic curve (AUC) was used to assess the predictive capacity of the model. Additionally, we employed SHapley Additive exPlanations (SHAP) analysis to unveil the specific contributions of individual features in the machine learning model to the prediction results.
Results: The prevalence of lean NAFLD in the study population was 20.3%. Eight variables, including age, body mass index (BMI), and alanine aminotransferase (ALT), were identified as independent risk factors for lean NAFLD. Ten predictive factors, including BMI, ALT, and aspartate aminotransferase (AST), were screened for the construction of risk prediction models. The random forest model demonstrated superior performance compared to alternative machine learning (ML) algorithms, achieving an AUC of 0.739 (95% confidence interval [CI]: 0.676–0.802) in the training set, and it also exhibited the best predictive value in the internal validation set with an AUC of 0.789 (95% CI: 0.722–0.856). In addition, the SHAP method identified TG, ALT, GGT, BMI, and UA as the top five variables influencing the predictions of the RF model.
Conclusion: The construction of lean NAFLD risk models based on the Chinese T2DM population, particularly the RF model, facilitates its early prevention and intervention, thereby reducing the risks of intrahepatic and extrahepatic adverse outcomes.
Introduction
In recent years, type 2 diabetes mellitus (T2DM) and Non-alcoholic fatty liver disease (NAFLD) have been the two most challenging public health issues worldwide. T2DM is a metabolic disease characterized by chronic elevated blood glucose caused by many factors, such as heredity and environment. Approximately 537 million (10.5%) adults (aged 20–79) in the world have T2DM according to the latest research results of the International Diabetes Federation (IDF) (1). NAFLD refers to a clinicopathological syndrome primarily characterized by excessive intrahepatic fat deposition, excluding alcohol consumption and other well-defined liver-damaging factors (2). It is estimated that the global prevalence of NAFLD has increased from 25% in 2016 to over 30% at present and continues to rise (3, 4). It is well-known that there is a close relationship between T2DM and NAFLD. They not only share common risk factors but also frequently serve as comorbidities or target organ damages for each other. T2DM and NAFLD are known to frequently coexist and act synergistically to increase the risk of adverse clinical outcomes (5). A meta-analysis revealed that the prevalence rates of NAFLD in T2DM were 65.04% (95% CI:61.79%–68.15%), and the prevalence of NAFLD in the Chinese population with T2DM is 52.56% (6). Another study result showed that compared with T2DM patients without NAFLD, the risks of cardiovascular disease (CVD), chronic kidney disease (CKD) and proliferative retinopathy in T2DM patients with NAFLD are 1.96, 1.87 and 1.75 times higher respectively (7). Furthermore, it has been demonstrated that patients with NAFLD exhibit a more than twofold increased risk of developing T2DM compared to the general population (5).
Although NAFLD is commonly associated with obesity, around 10%–20% of NAFLD cases occur in non-obese or non-overweight individuals, a condition often described as lean NAFLD (8). A Meta-analysis encompassing 33 observational studies reported that the prevalence of lean NAFLD was the highest among Asian individuals (9). Compared to obese NAFLD, lean NAFLD has milder metabolic abnormalities but a higher incidence of advanced liver disease and all-cause mortality (10, 11). Due to the absence of obesity phenotypes, lean NAFLD is prone to being overlooked in clinical diagnosis. Currently, there are no formal recommendations for the treatment of lean NAFLD (12), early lifestyle intervention remains the cornerstone of the management of lean NAFLD (13). Certain relevant guidelines recommend that it is necessary to conduct screening for NAFLD in T2DM patients (14, 15). Therefore, it is particularly crucial to conduct early identification and effective management of lean NAFLD in a Chinese T2DM population.
The approach for lean NAFLD diagnosis is identical to any NAFLD patient. Excluding excessive alcohol consumption and other causes of hepatic steatosis and damage, detection is carried out through ultrasound, computed tomography (CT), or magnetic resonance (MR), and pathological diagnosis is performed using liver biopsy when necessary. Serum indices (NFS score and FIB-4 score) and imaging techniques (transient elastography and magnetic resonance elastography) can serve as alternative approaches to liver biopsy for fibrosis staging and patient follow-up (16–18). However, the above-mentioned diagnostic methods inevitably lead to the waste of medical resources and an increase in time costs. Therefore, it is of great significance to establish an assessment tool that can screen out high-risk individuals with lean NAFLD at an early stage.
With the development of technology, the utilization of artificial intelligence (AI) and machine learning (ML) technology in the healthcare sector has experienced significant growth in recent years (19). The analysis of extensive clinical data through ML algorithms can assist clinicians in identifying potential disease progression patterns and facilitating personalized treatment strategies (20). Currently, a substantial body of research has explored the utilization of various ML techniques for the prediction and diagnosis of diseases, such as T2DM, breast cancer, and heart disease (21–23). Pei-Yuan Su et al. developed ML models for the prediction of fatty liver disease in lean individuals. The results indicated that the ML model comprising a two-class neural network using 10 features had the highest area under the receiver operating characteristic curve (AUC) value (0.885) among all other algorithms (24). However, there are few studies on the risk prediction models for lean NAFLD in T2DM patients. The purpose of this study was to establish lean NAFLD risk prediction models based on interpretable machine learning algorithms, which would facilitate the early identification of lean NAFLD and guide appropriate preventive and intervention measures.
Materials and methods
Study population
This study enrolled 4,056 T2DM individuals who received health care through routine physical examinations, outpatient visits, and inpatient admissions at the First Affiliated Hospital of Ningbo University, Ningbo, China, from November 2019 to November 2024. Demographic data, relevant complications, biochemical parameters, etc., were obtained through questionnaire surveys and laboratory examinations. Ultimately, 1,553 participants were included in the study. The specific exclusion criteria were as follows: (1) patients without liver ultrasound results; (2) patients with body mass index (BMI) ≤ 18 or BMI ≥ 24; (3) patients with heavy alcohol consumption (exceeding 140 grams per week for men and 70 grams per week for women); (4) diagnosis of liver disease, such as viral hepatitis, and autoimmune hepatitis. We used the multiple imputation method (linear regression, polynomial logistic regression, and five iterations to create an interpolation model) to process missing values, in order to reduce bias toward missing data (Supplementary Figure 1) (25). The study’s flow diagram is depicted in Figure 1.
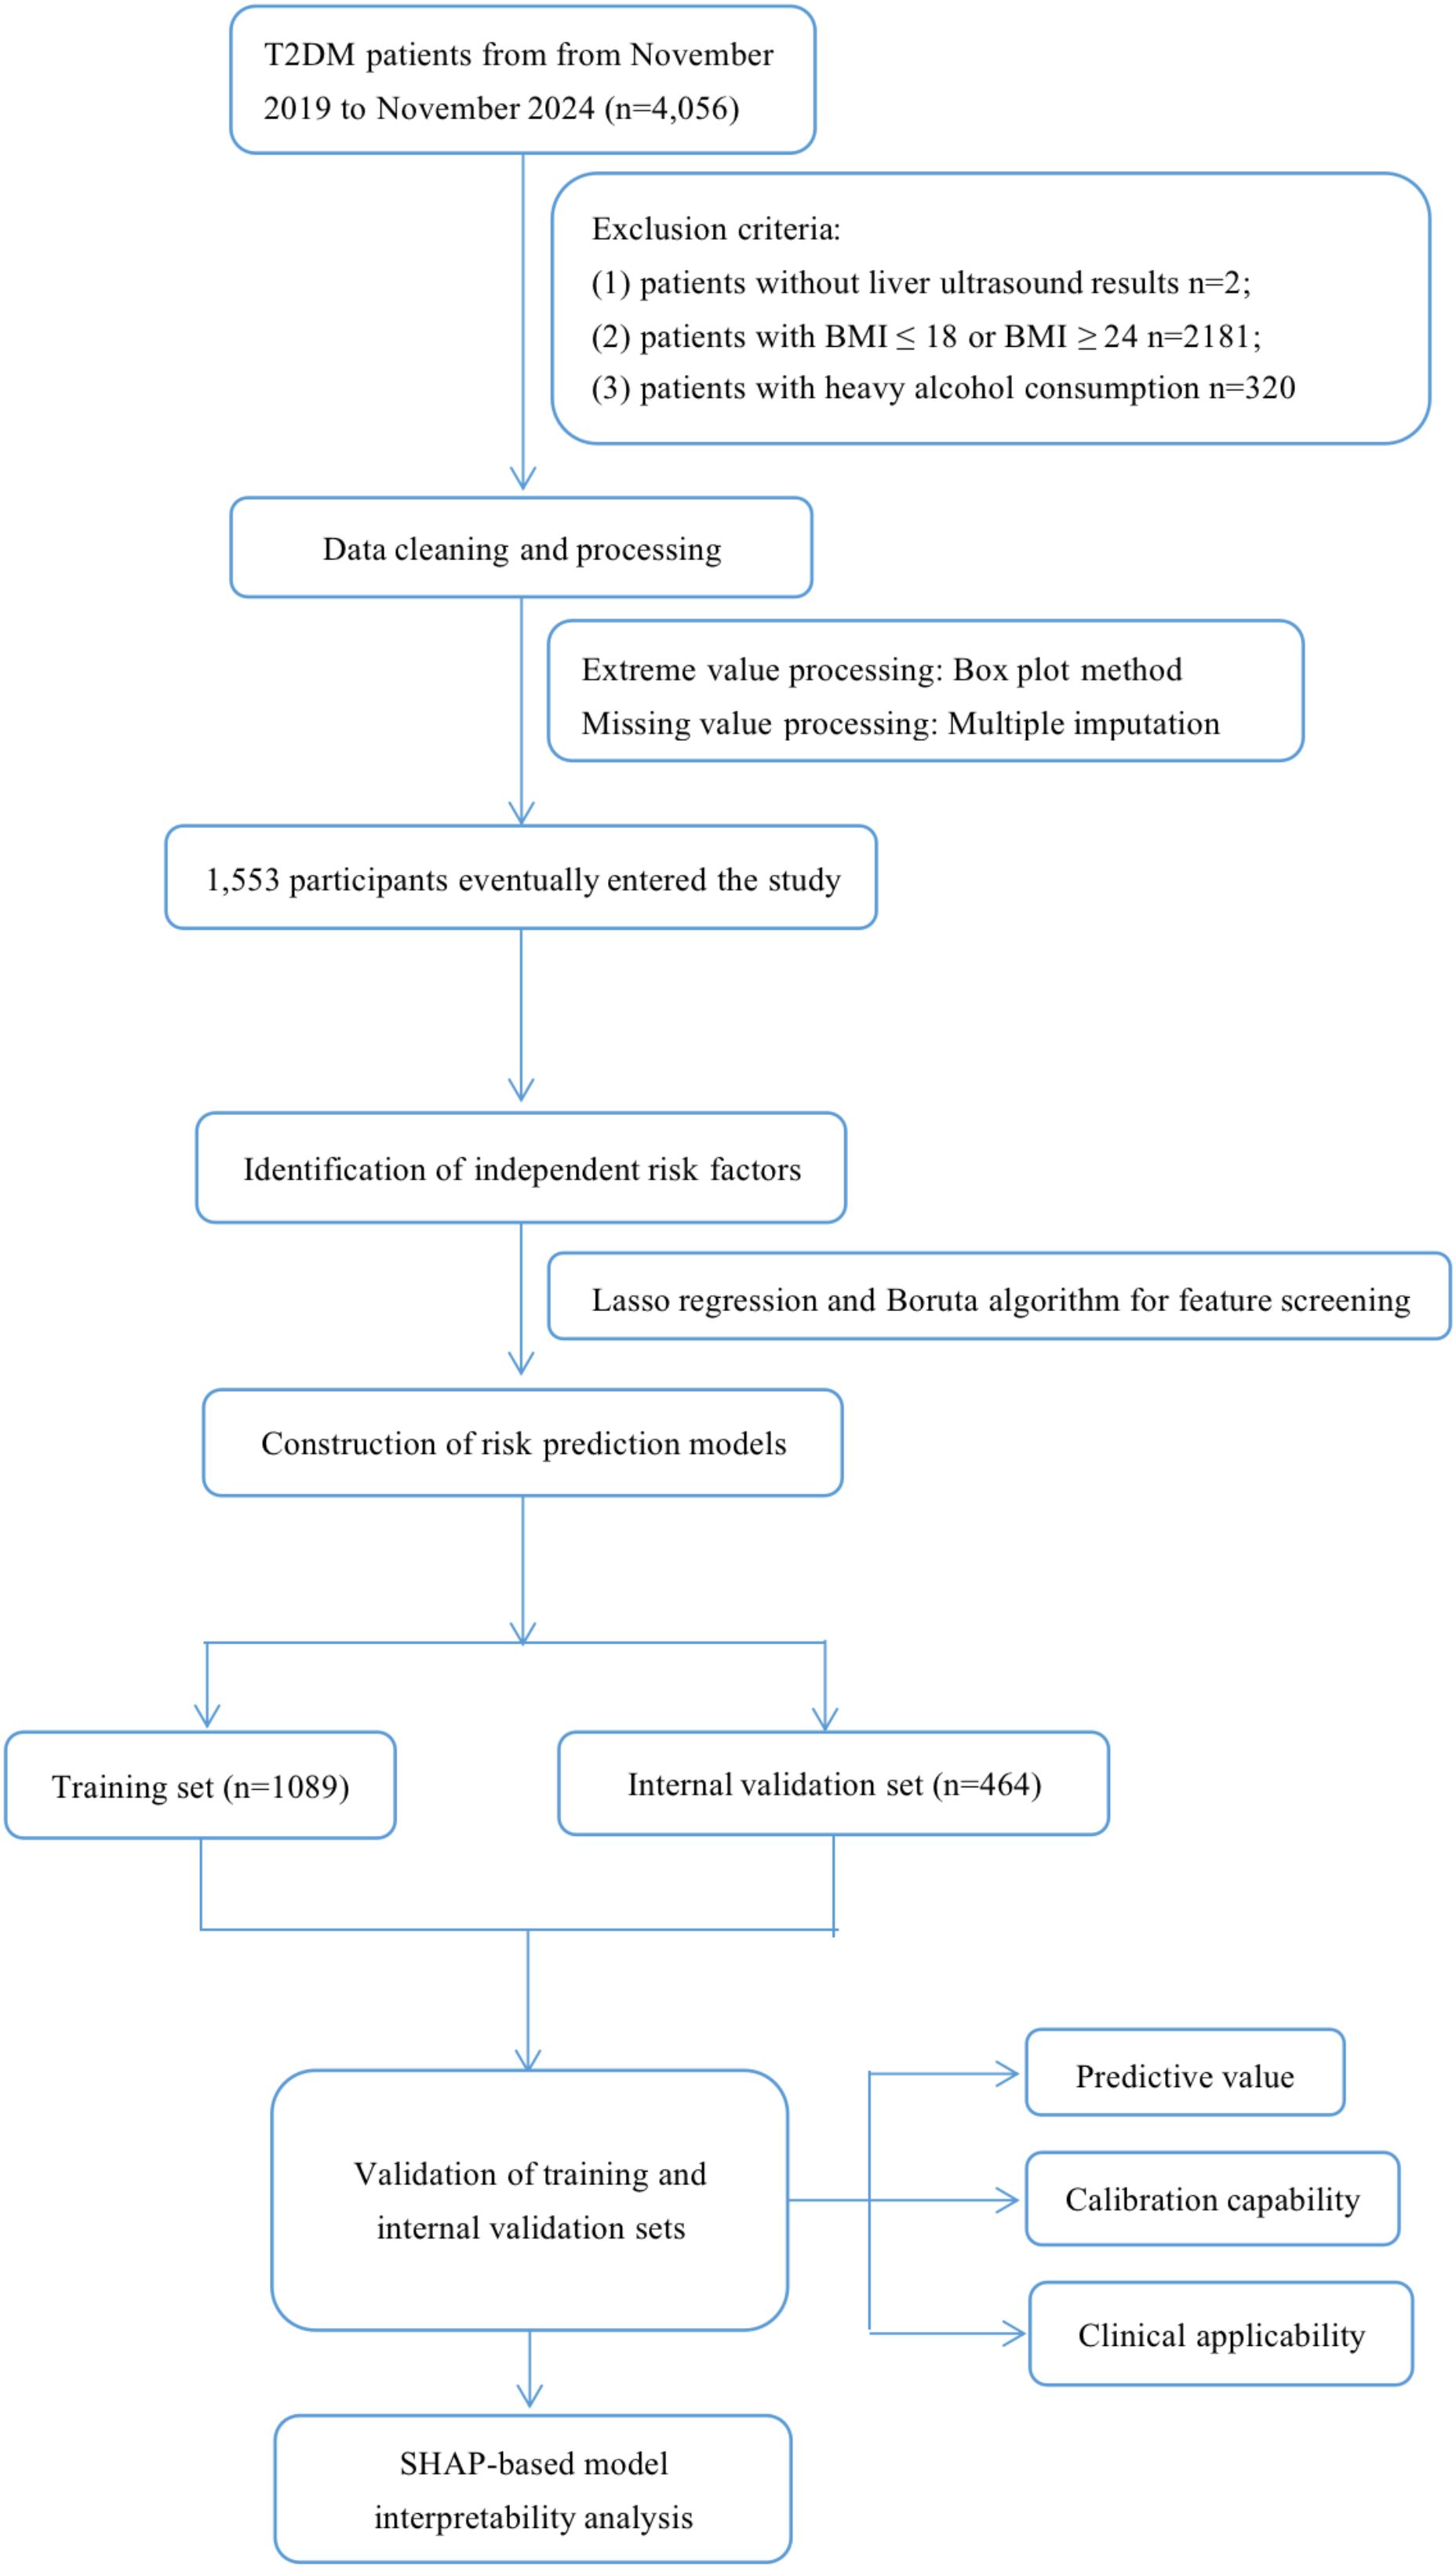
Figure 1. Flow diagram of the study.
Definition
The diagnostic criteria for DM were fasting blood glucose (FBG) levels of ≥ 7.0 mmol/L, 2-hour blood glucose levels of ≥ 11.1 mmol/L, or a glycated hemoglobin level of ≥ 6.5% (26).
Clinical baseline data
Clinical baseline data encompassed the Participants’ general characteristics (gender, age, BMI, systolic blood pressure [SBP], diastolic blood pressure [DBP], and heart rate [HR]), lifestyle habits(history of smoking), blood cell counts (white blood cell count [WBC], red blood cell count [RBC], mean red blood cell volume [MCV], lymphocyte count [LYMPH], monocyte count[MONO], neutrophil count [NEUT], eosinophil count [EOS], basophil count [BASO], hemoglobin [HB], platelet count [PLT], mean platelet volume [MPV], and platelet distribution width [PDW]), biochemical indicators (alanine aminotransferase [ALT], aspartate aminotransferase [AST], gamma-glutamyl transpeptidase [GGT], total bilirubin [TBIL], direct bilirubin [DBIL], indirect bilirubin [IBIL], albumin [ALB], globulin [GLO], total protein [TP], creatinine [CREA], uric acid [UA], total cholesterol [TC], triglycerides [TG], high-density lipoprotein cholesterol [HDL-C], low-density lipoprotein cholesterol [LDL-C], and glucose [GLU]), and other laboratory value(glycosylated hemoglobin [HBA1C]).
Statistical analysis
The preliminary analysis of the dataset involves the application of descriptive statistics. The Kolmogorov-Smirnov (K-S) test was used to test the normality of the continuous variables. Continuous variables with a normal distribution were expressed as means (standard deviations, SD), continuous variables with a skewed distribution were expressed as medians (interquartile ranges, IQR), and categorical variables were expressed as percentages (percentage, %). Independent-samples T test (continuous variables with a normal distribution), Mann-Whitney U test (continuous variables with a skewed distribution), and chi-square test (categorical variables) were used to evaluate the differences between groups, and the standardized mean difference (SMD) was used to evaluate balance between groups (27).
We used multivariate logistic regression to identify independent risk factors for lean NAFLD. The Boruta algorithm and the Least Absolute Shrinkage and Selection Operator (LASSO) were utilized to screen for characteristic variables. To construct a prediction model, the entire dataset was partitioned into a training set and an internal validation set at a ratio of 6:4. Subsequently, six ML algorithms including linear discriminant analysis (LDA), logistic regression (LR), Naive Bayes (NB), random forest (RF), support vector machine (SVM), and extreme gradient boosting (XGboost), were employed to train the model. During the model training process, a 10-fold cross-validation method was utilized to optimize the model parameters and prevent the occurrence of overfitting. In addition, we employed the AUC to evaluate the predictive ability of the model. Calibration curves and the Brier score were utilized to assess the calibration ability, while decision curve analysis (DCA) was applied to evaluate the clinical applicability. Additionally, the Shapley Additive exPlanations (SHAP) was used to interpret the best predictive model.
Statistical analyses were conducted using the R language (version 4.2.3, http://www.R-project.org/) and Python (version 3.9.0, https://www.python.org/). All data were analyzed using two-sided tests, and statistical significance was defined as P < 0.05.
Results
Baseline characteristics of participants
A total of 1,553 participants were recruited in this study, including 1,237 T2DM patients without lean NAFLD and T2DM 316 patients with complicated by lean NAFLD. The median age of the patients was 59.00 years (IQR:50.00–67.00), among whom 713 cases (45.9%) were male and 840 cases (54.1%) were female. When comparing the baseline characteristics between the two groups of patients, statistically significant differences were observed in terms of gender, BMI, DBP, routine blood tests, liver and kidney functions, blood lipid levels, and blood glucose levels (p < 0.05). As shown in Table 1.
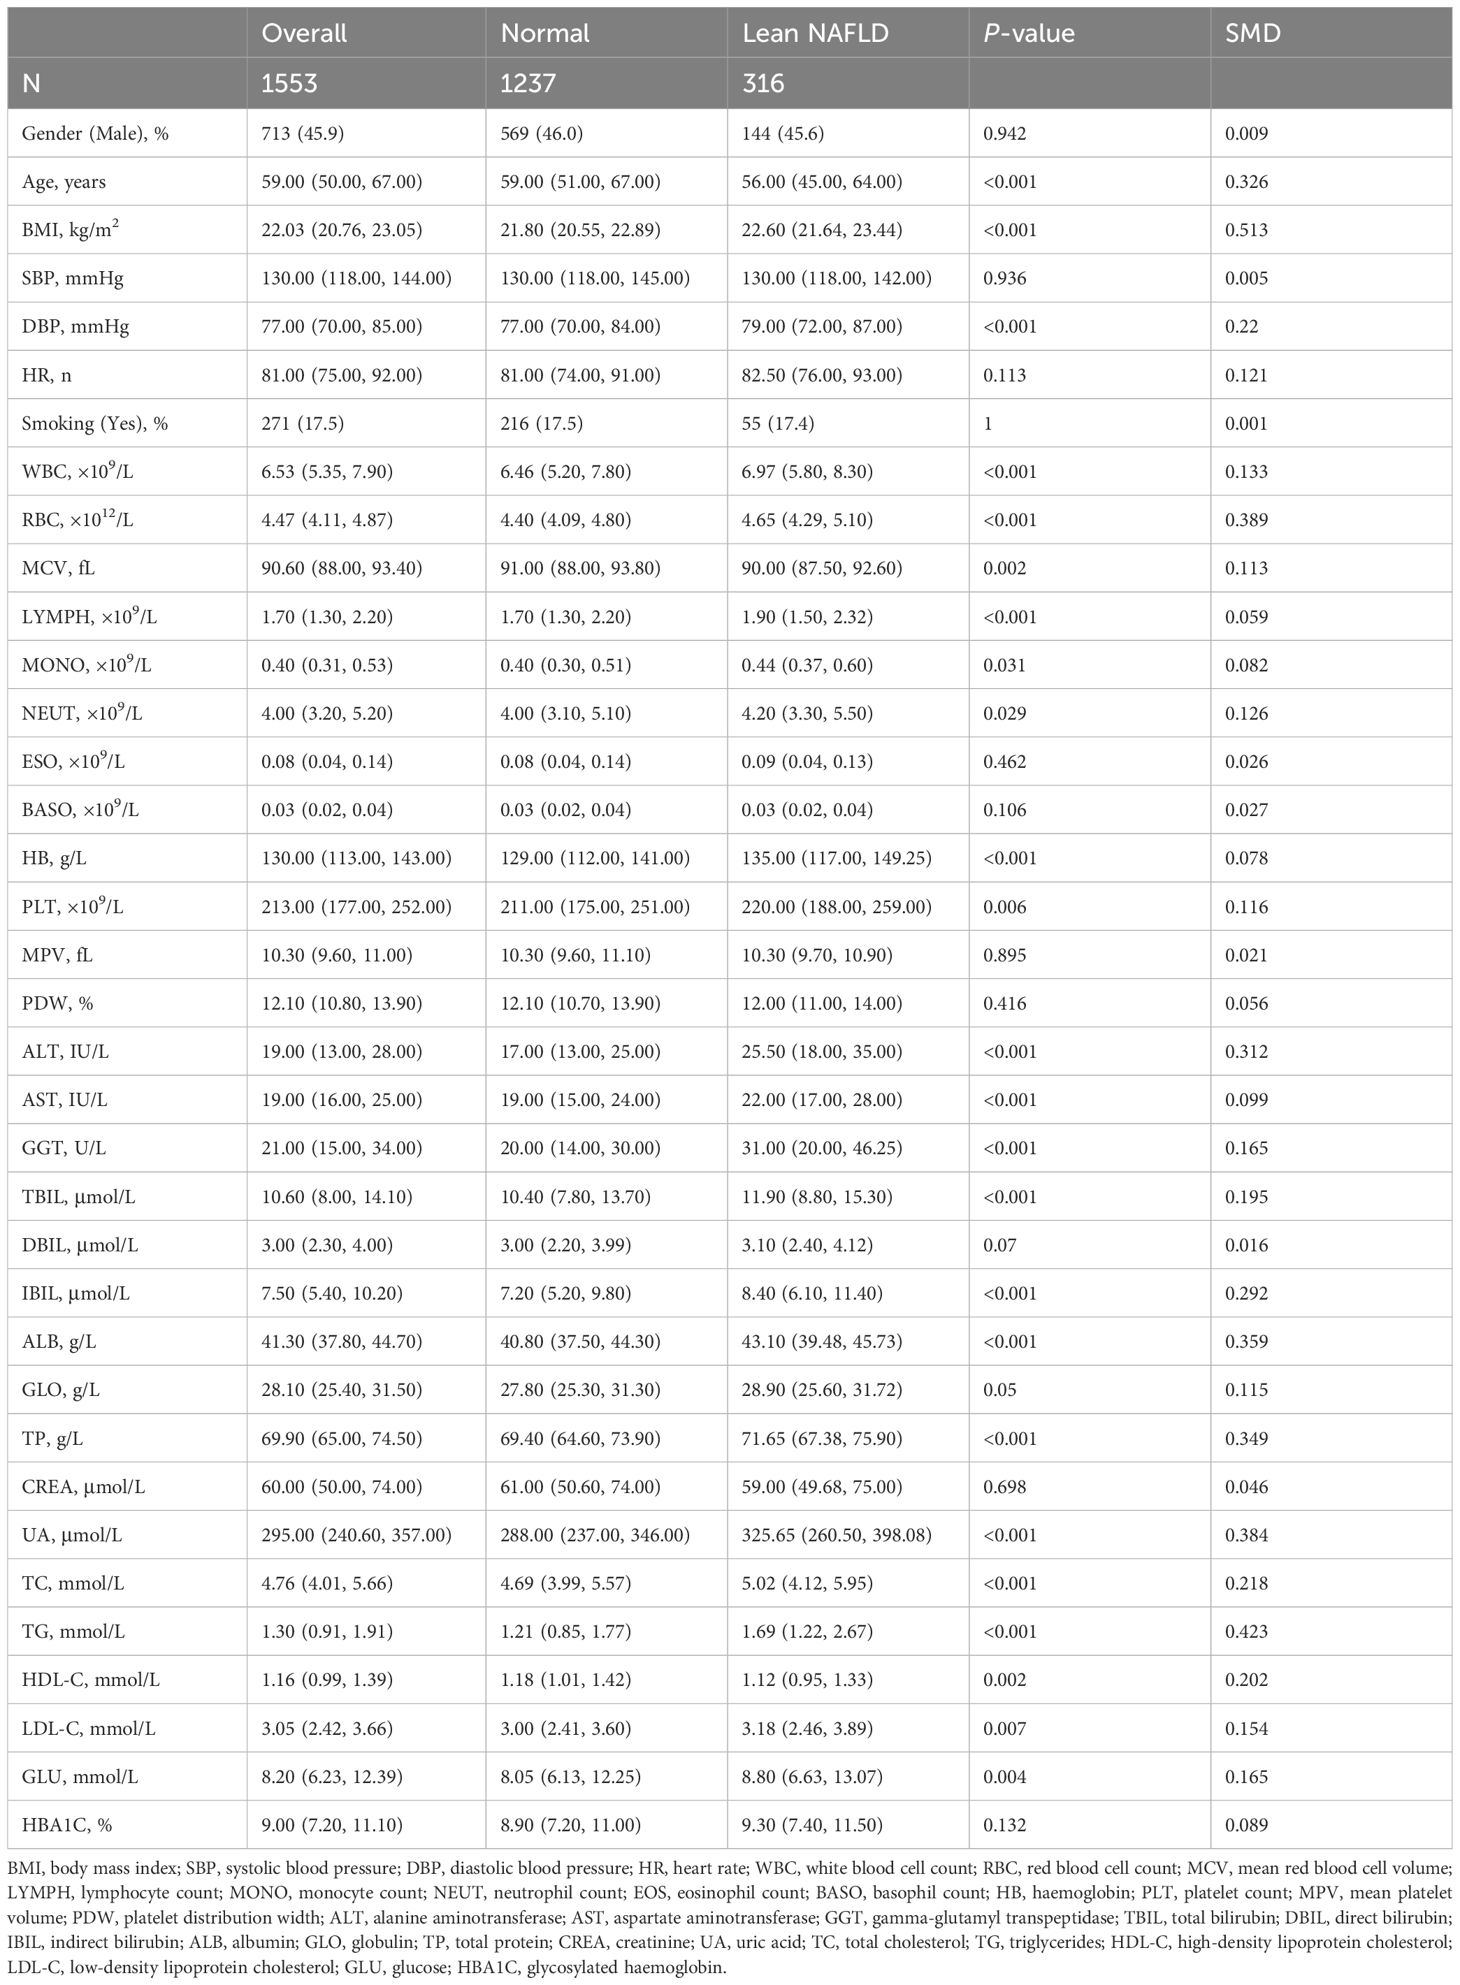
Table 1. Univariate analysis of lean NAFLD.
Figure 2 presented the prevalence rate of lean NAFLD in the study population. The overall prevalence rate of lean NAFLD is 20.3%, with the prevalence rate among females (20.5%) being slightly higher than that among males (20.2%) (Figure 2A). Age pattern analysis showed that the prevalence of lean NAFLD decreased with increasing age (Figure 2B).
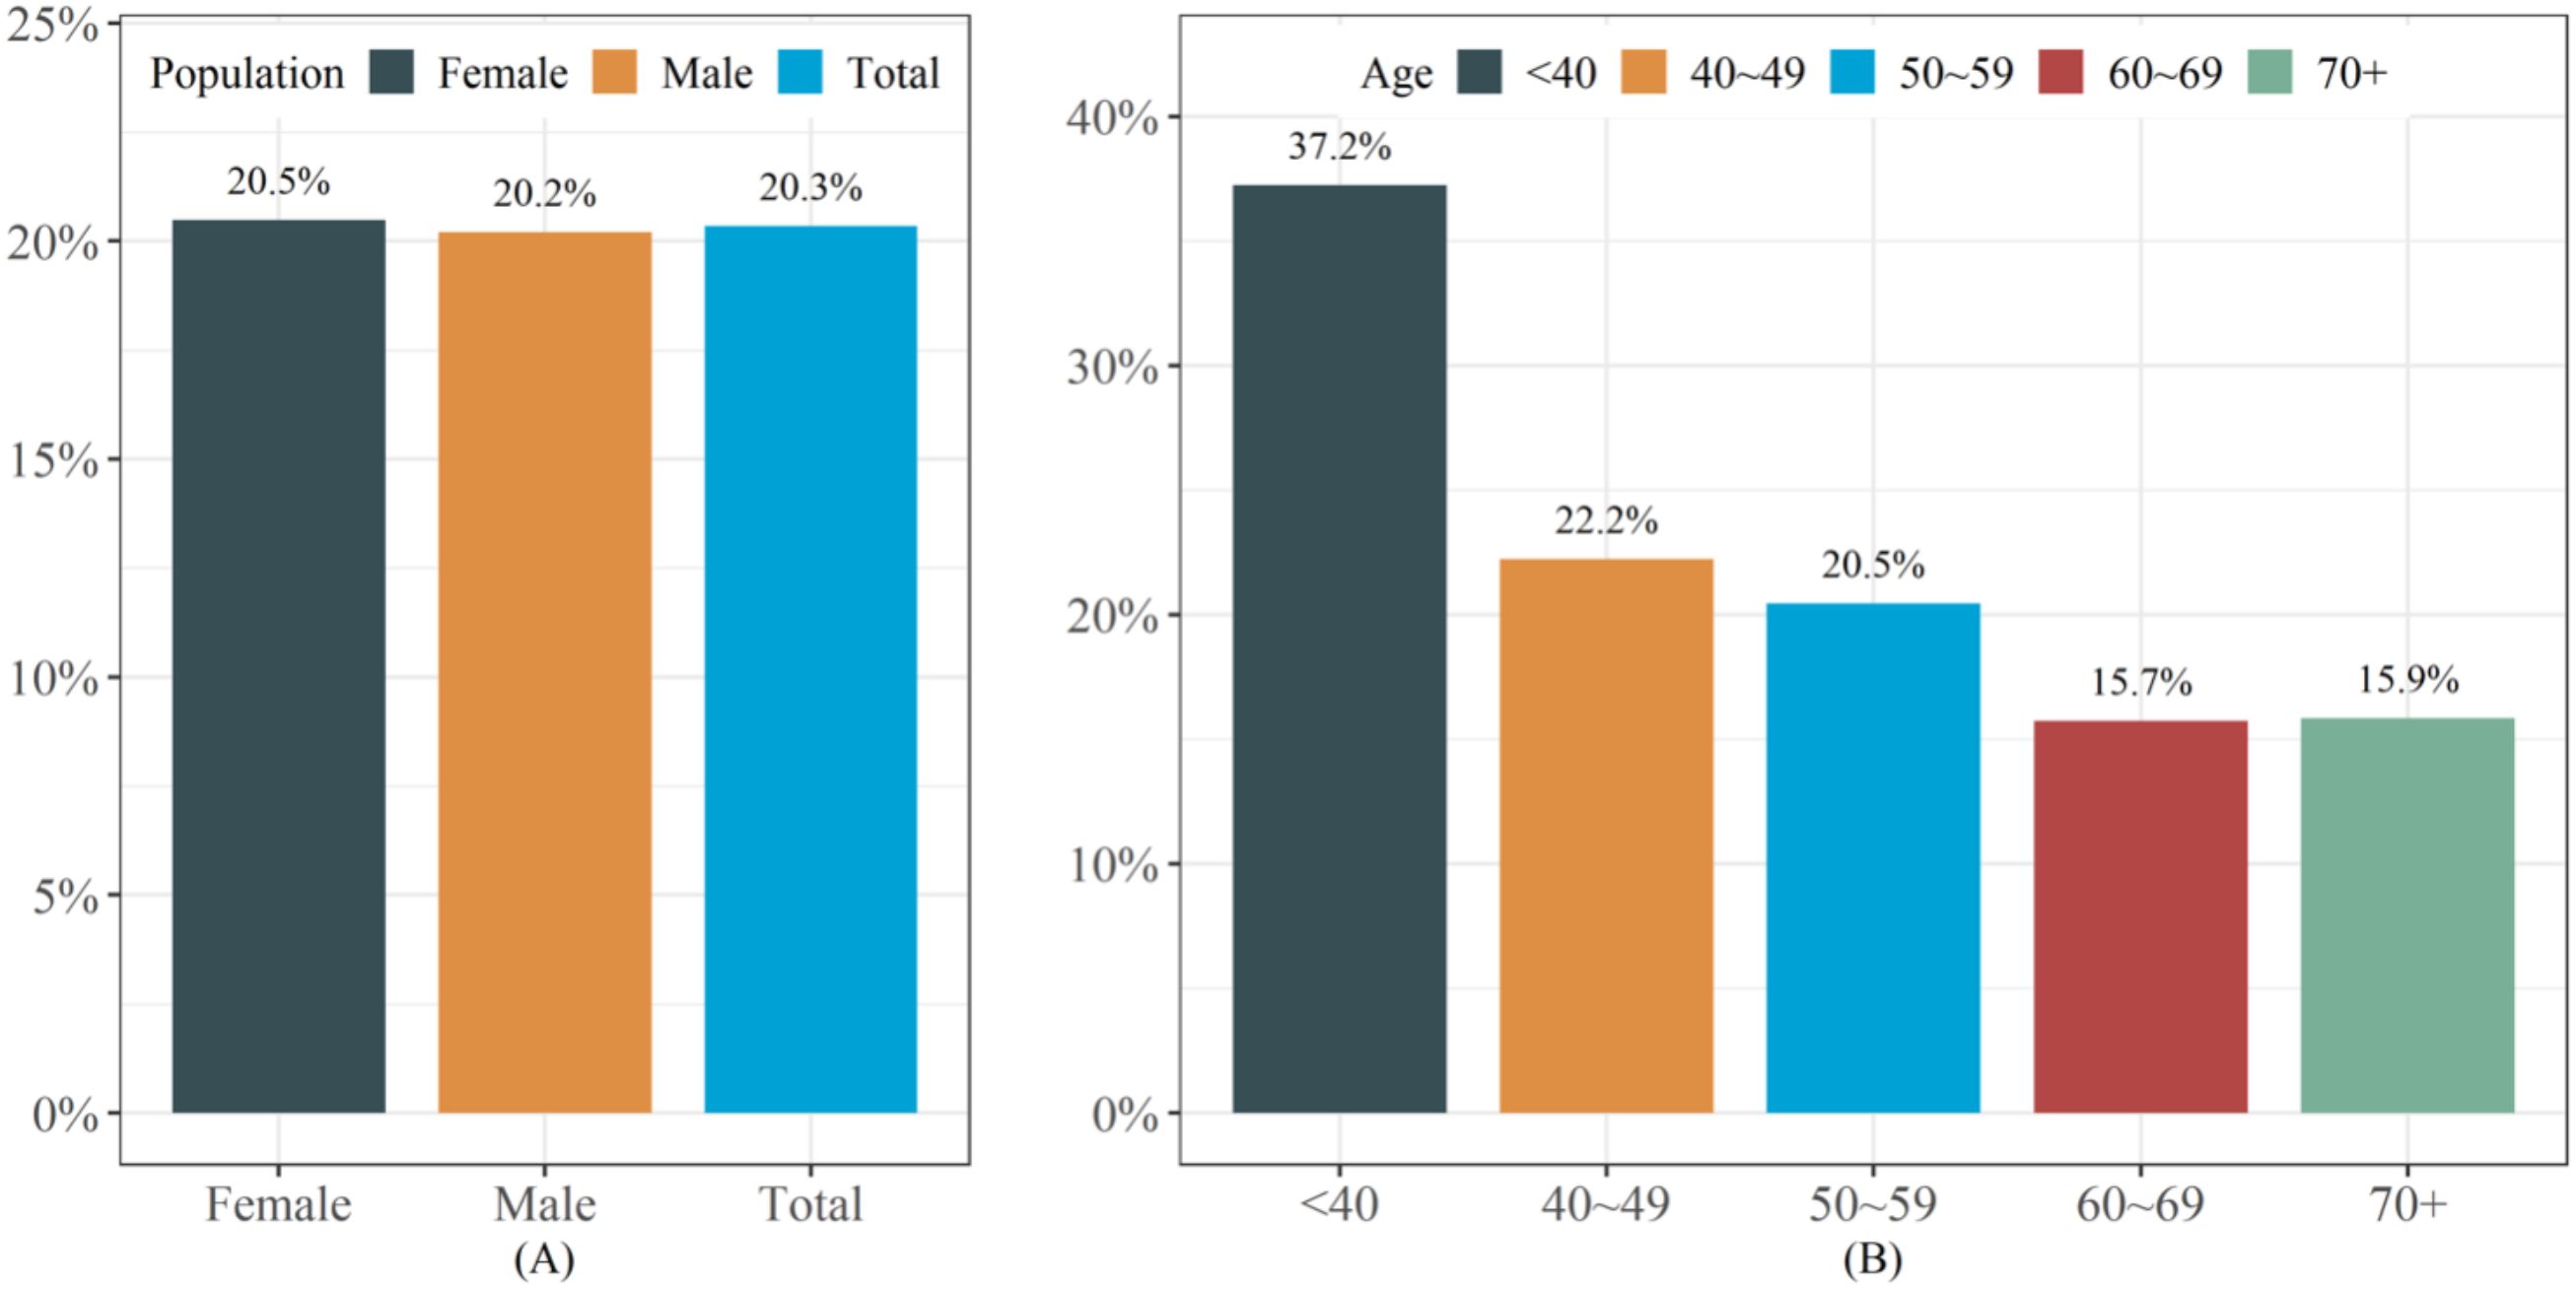
Figure 2. The prevalence of lean NAFLD in the study population. (A) The prevalence of lean NAFLD in different populations (B) The prevalence of lean NAFLD in different age groups.
Independent risk factors
Twenty potential risk factors associated with lean NAFLD were screened through univariate analysis (p < 0.05 and SMD > 0.1) (Table 1). To ensure the accuracy and reliability of the research results, the variance inflation factor (VIF) of each variable was calculated. Variables with a VIF value exceeding 10 typically exhibit severe multicollinearity (Supplementary Table 1). Subsequently, we employed stepwise backward logistic regression analysis with the Akaike information criterion to filter and remove multicollinear variables. Ultimately, twelve variables were included for the multivariate logistic regression analysis, and eight variables such as Age, BMI, ALT, GGT, IBIL, ALB, UA, and TG were identified as independent risk factors for lean NAFLD (p < 0.05). The results were presented in Figure 3.
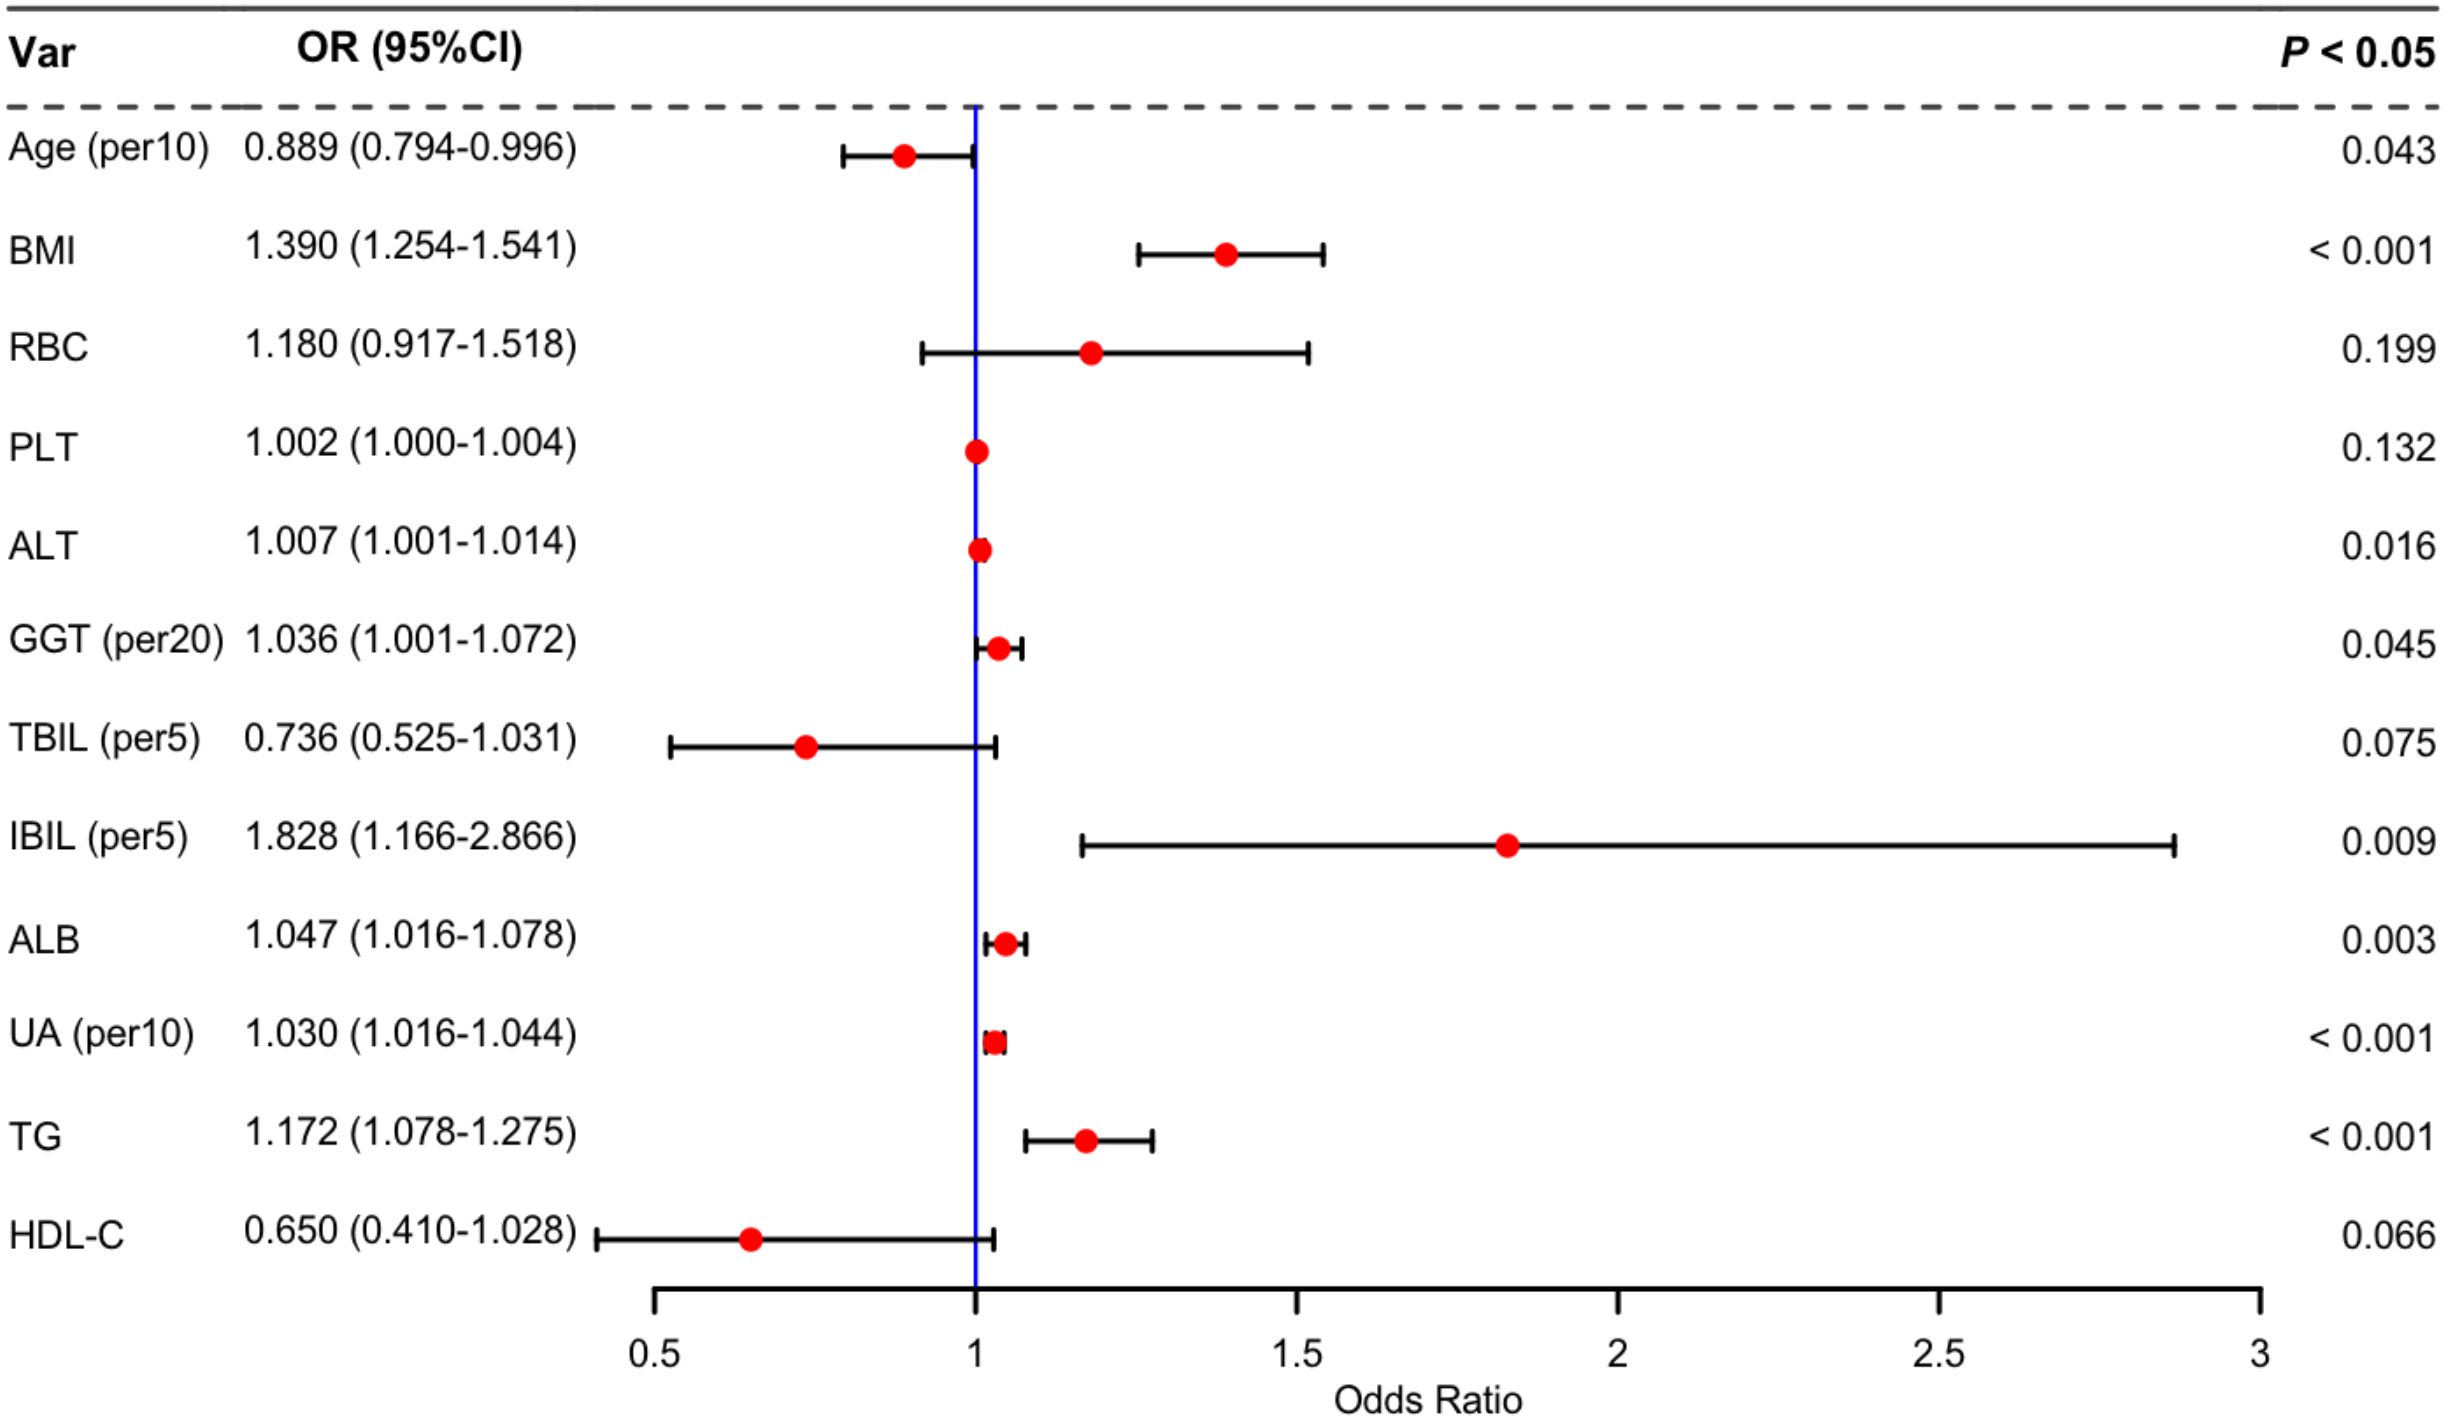
Figure 3. Multivariate logistic regression analysis of lean NAFLD.
Predictor screening and construction of risk prediction models
The study population was divided into a training set and an internal validation set at a ratio of 6:4. Statistical analysis revealed no significant differences between the two groups (Table 2).
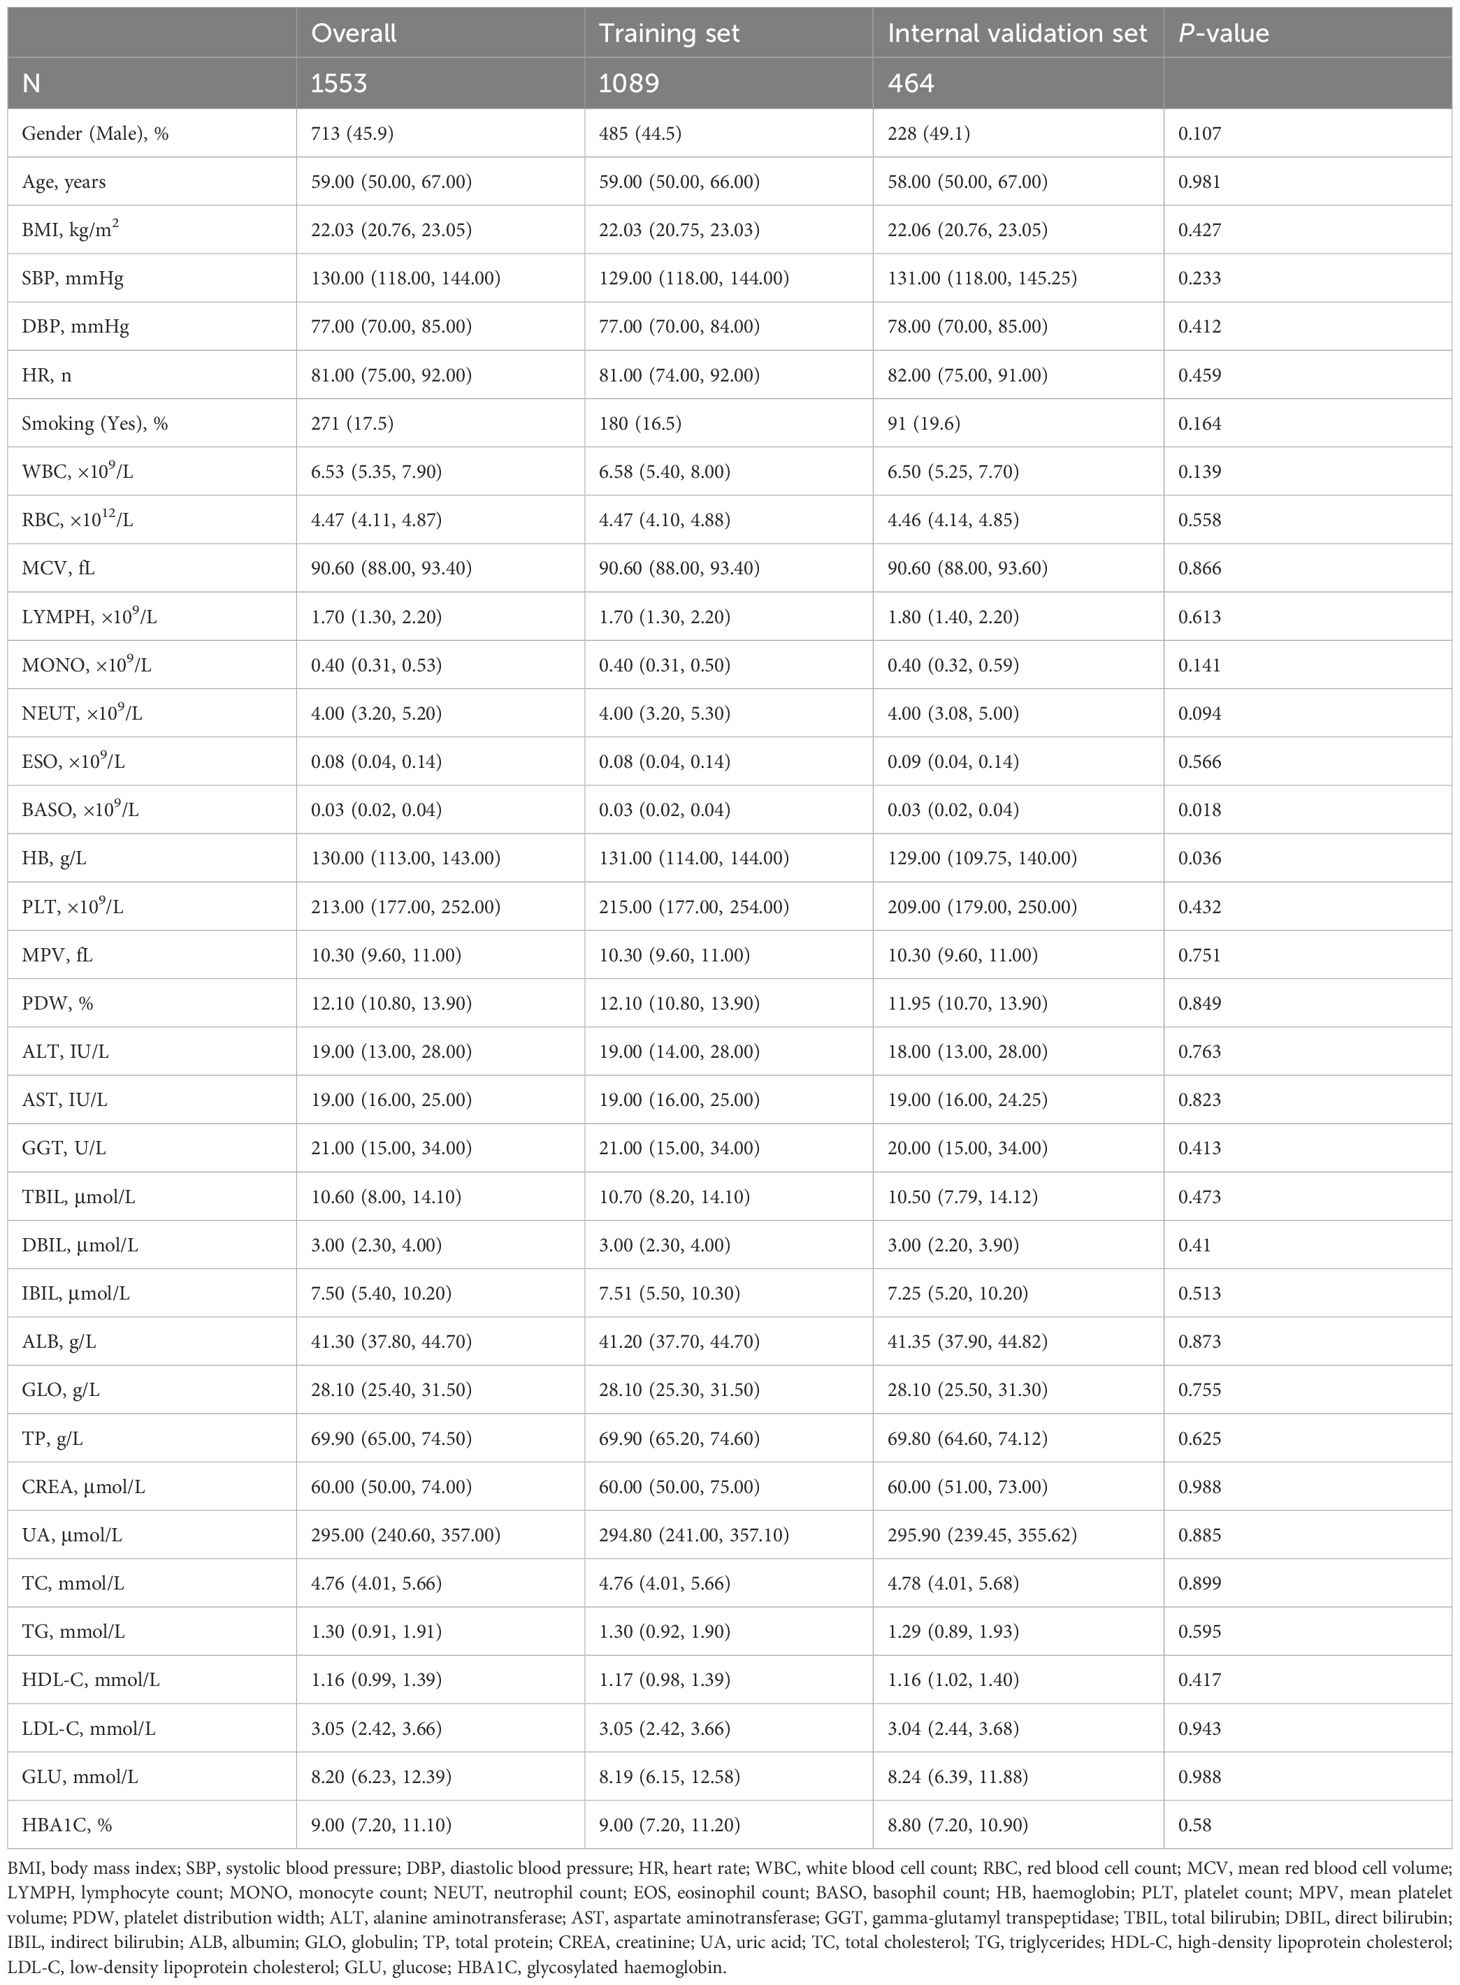
Table 2. Characteristics of participants in different sets.
LASSO regression is a data reduction method that reduces the complexity of the model, prevents overfitting, and selects important feature variables by formulating an optimized objective function with a penalty term (28). In this study, 22 characteristic factors were identified by using LASSO regression (Figure 4A).
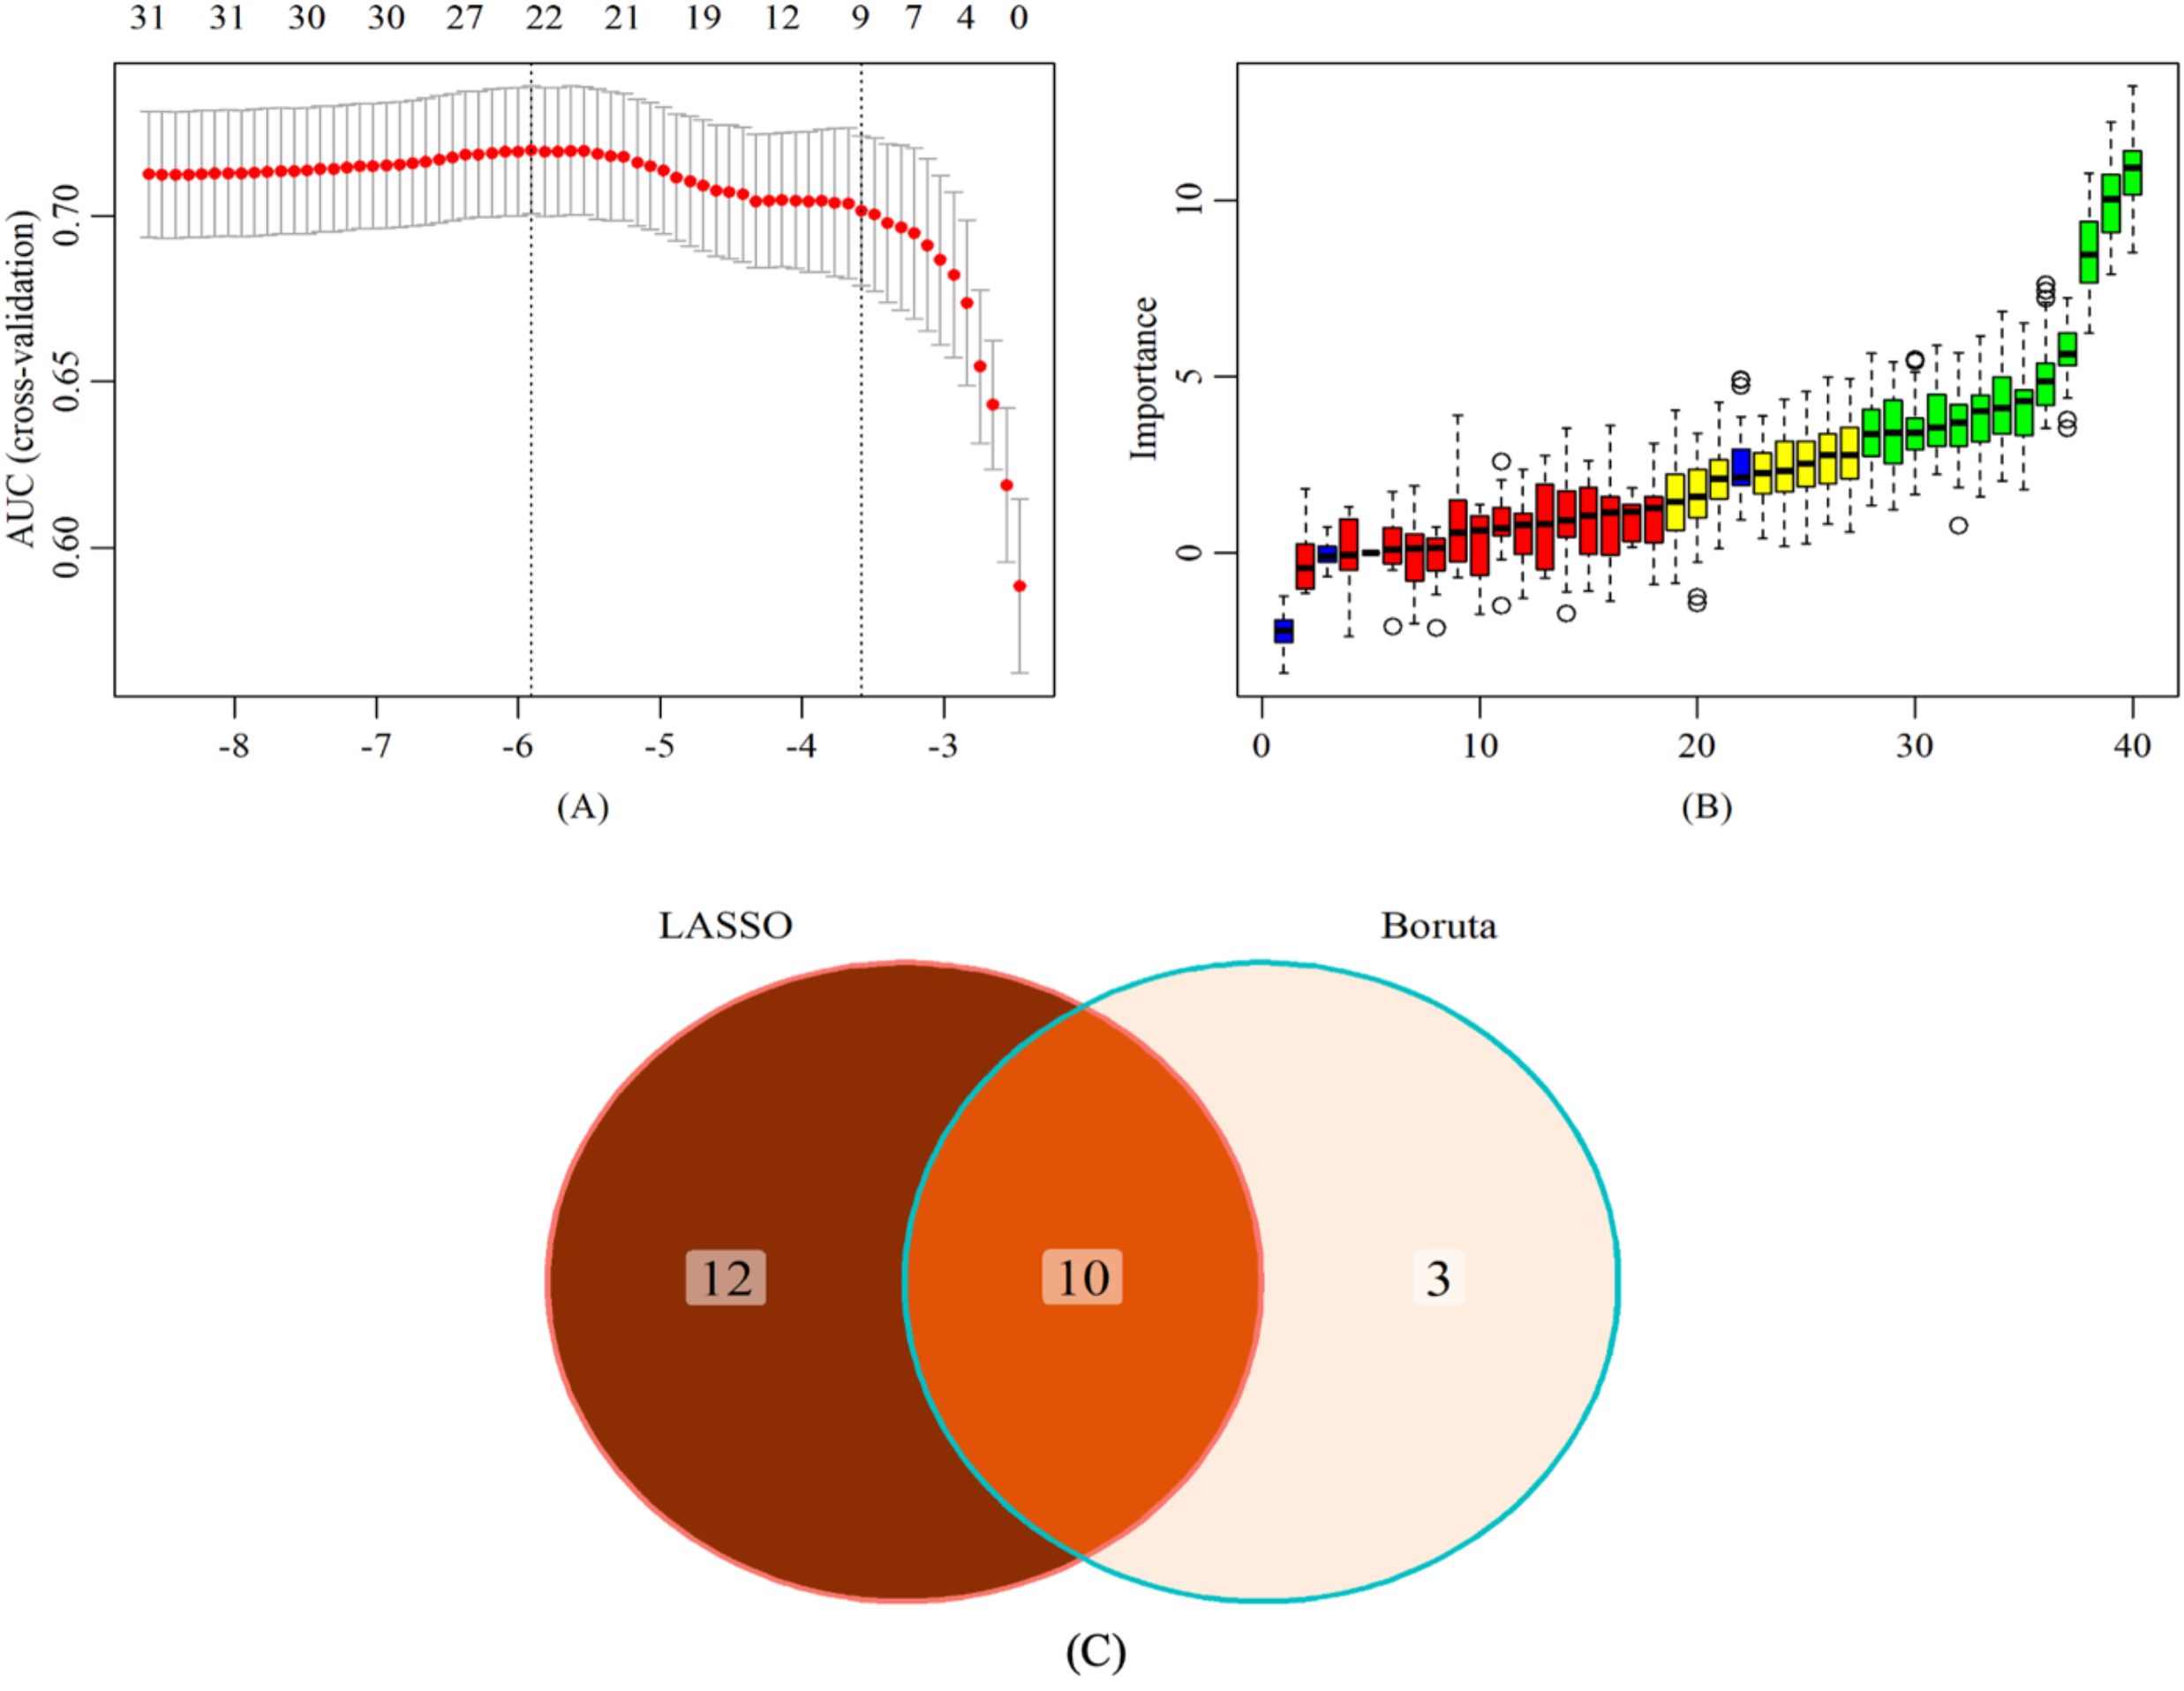
Figure 4. Screening of characteristic predictors. (A) Characteristic variables screening based on LASSO (B) Characteristic variables screening based on Boruta (C) LASSO combined Boruta. LASSO, least absolute shrinkage and selection operator.
The Boruta algorithm is a feature selection method based on random forests, aiming to identify truly significant features from a given feature set and distinguish irrelevant features (29). Thirteen key factors were identified through the Boruta algorithm (Figure 4B).
In the training set, through a comparative analysis of the screening results of the LASSO regression and the Boruta algorithm, we identified the common subset of feature variables selected by the two methods (Figure 4C). These selected variables were used as predictors to construct a risk prediction model for lean NAFLD, including BMI, LYMPH, HB, ALT, AST, GGT, IBIL, ALB, UA, and TG. In addition, the optimal model was determined among the risk prediction models constructed by six machine learning algorithms, namely LDA, LR, NB, RF, SVM, and XGboost.
Model performance
Within the training set, the RF model exhibited outstanding predictive performance [AUC: 0.739 (95%CI: 0.676–0.802)]. In contrast, the AUC values of the remaining five models were as follows: 0.723 (95%CI: 0.682–0.764) for LDA, 0.723 (95%CI: 0.691–0.755) for LR, 0.694 (95%CI: 0.647–0.741) for NB, 0.635 (95%CI: 0.579–0.727) for SVM, and 0.733 (95%CI:0.69–0.776) for XGboost (Figure 5A). In the internal validation set, the RF model also demonstrated robust clinical predictive value [AUC: 0.789 (95%CI: 0.722–0.856)] (Figure 5B). Furthermore, we conducted a comprehensive comparative analysis of additional clinical performance metrics, including accuracy, sensitivity, specificity, precision, recall, and F1 score, across various predictive models in both the training set and internal validation set (Tables 3, 4). The table revealed that the RF model demonstrates superior performance across all evaluated parameters. Concurrently, cut-off values were respectively established for the predictive probabilities of six ML models in both the training set and internal validation set (Figure 6). Patients were classified as positive if the predicted probability exceeded the cut-off value; otherwise, they were categorized as negative. Consequently, confusion matrixes of the predicted probabilities and the actual values were plotted, as illustrated in the Figures 7, 8.
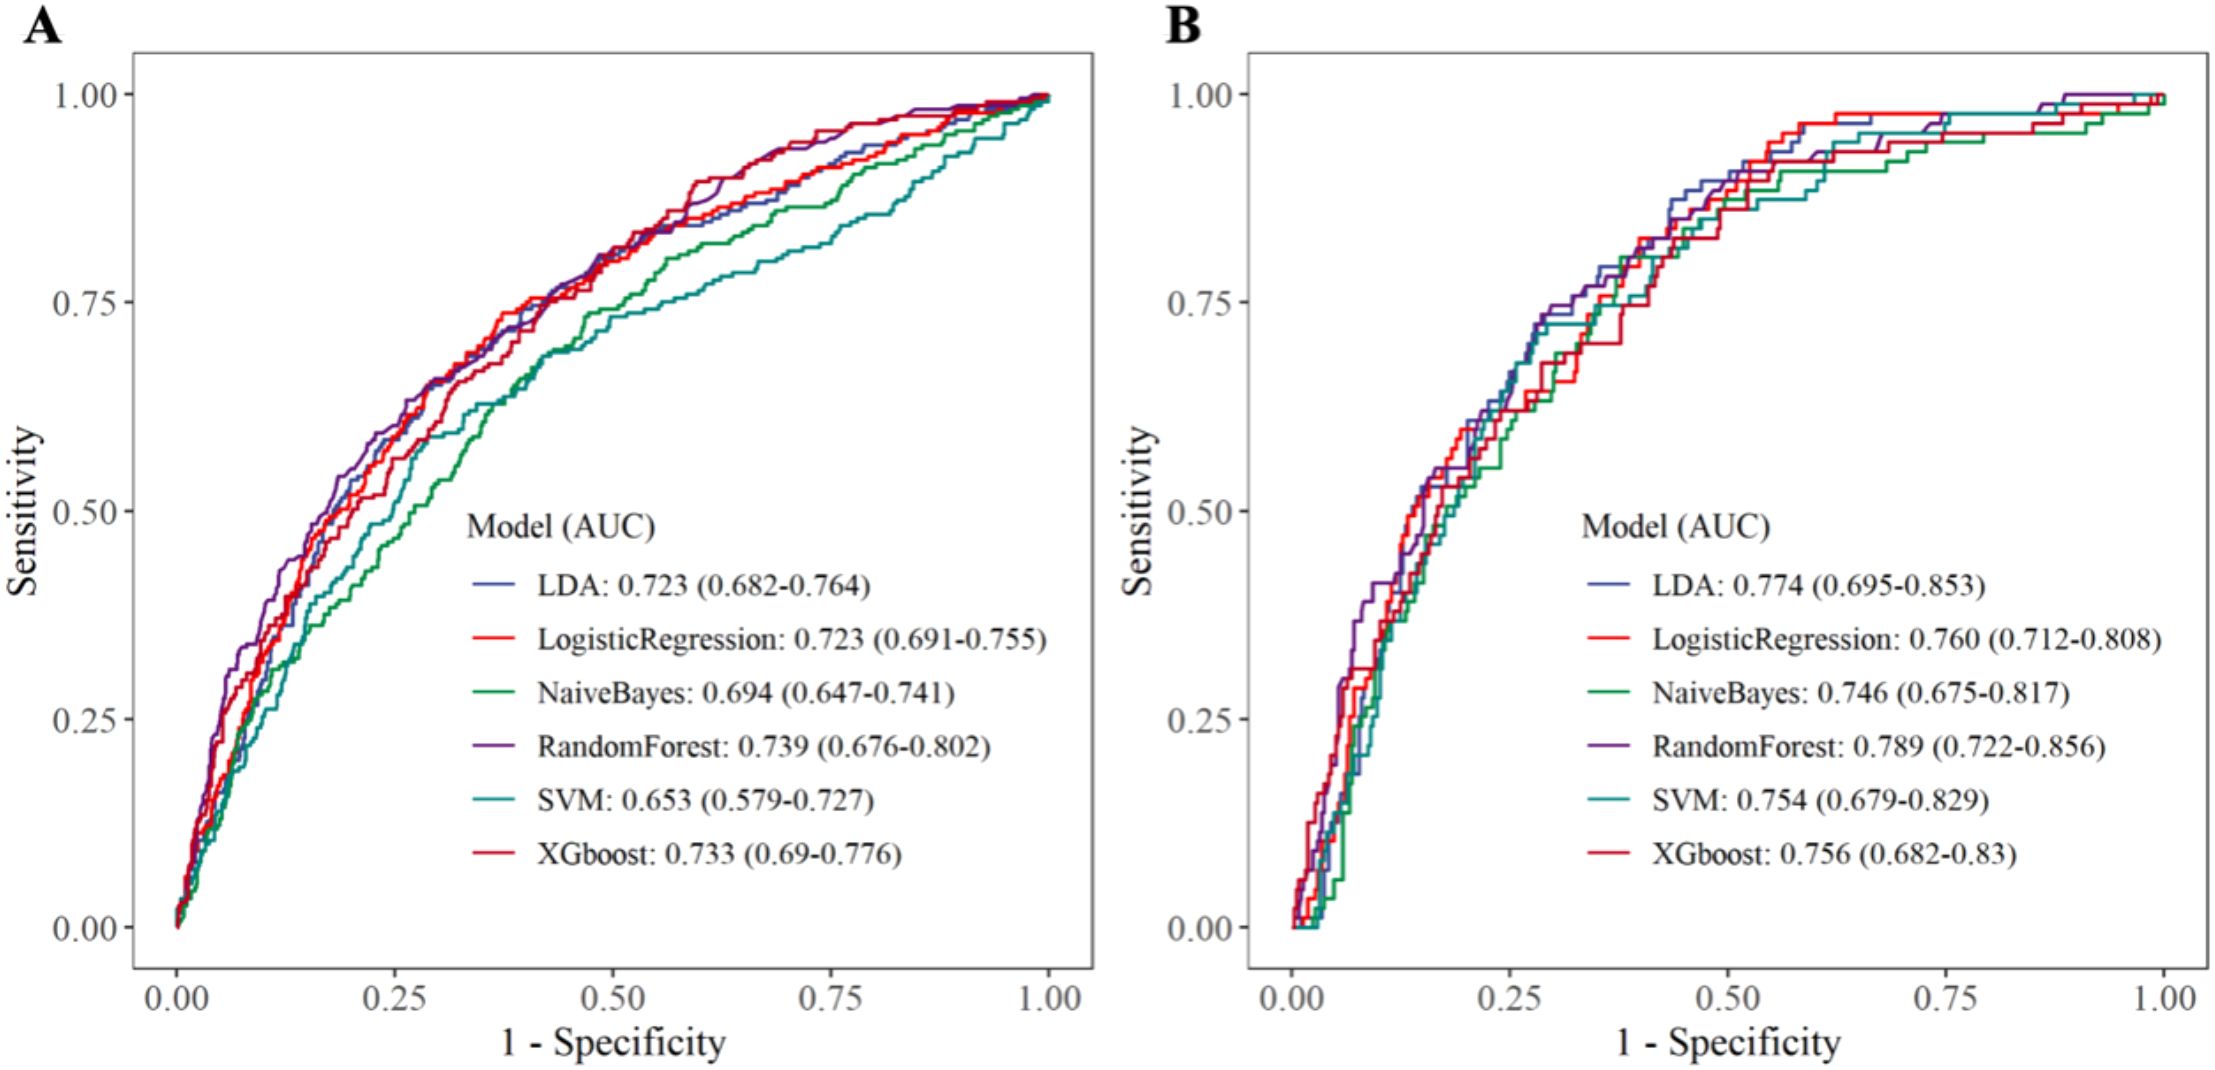
Figure 5. Receiver operating characteristic curve. (A) Training set (B) Internal validation set.
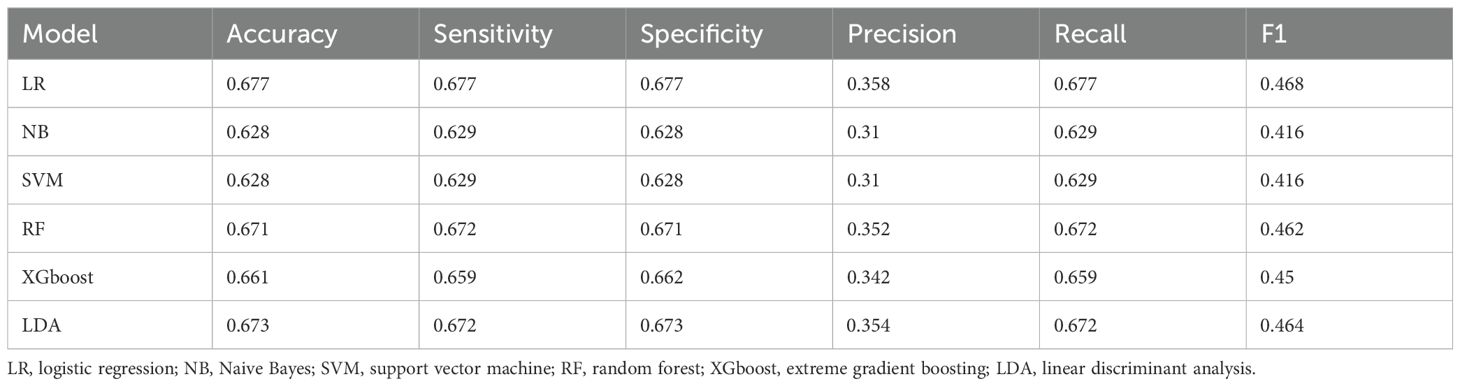
Table 3. Performance parameters of six machine learning prediction models in the training set.
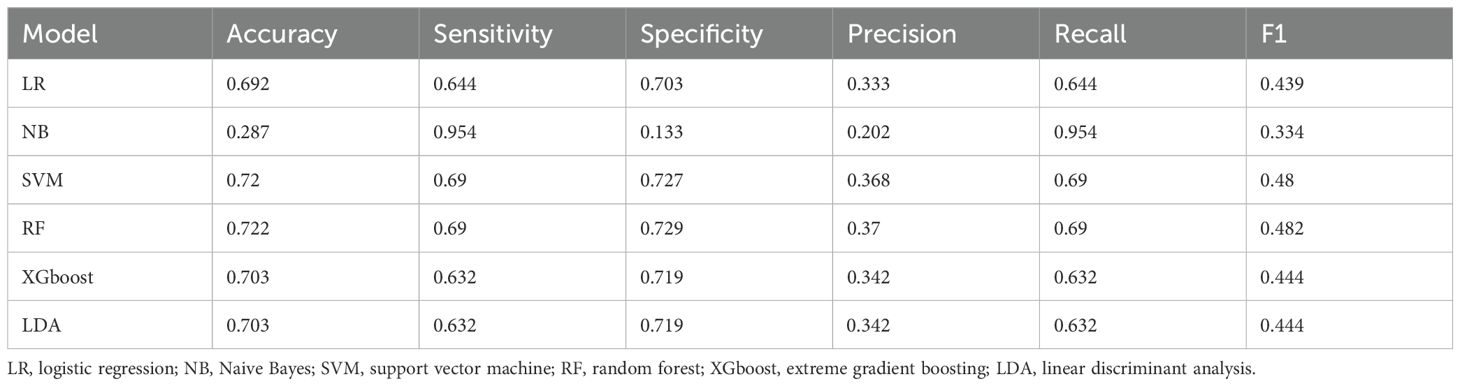
Table 4. Performance parameters of six machine learning prediction models in the internal validation set.
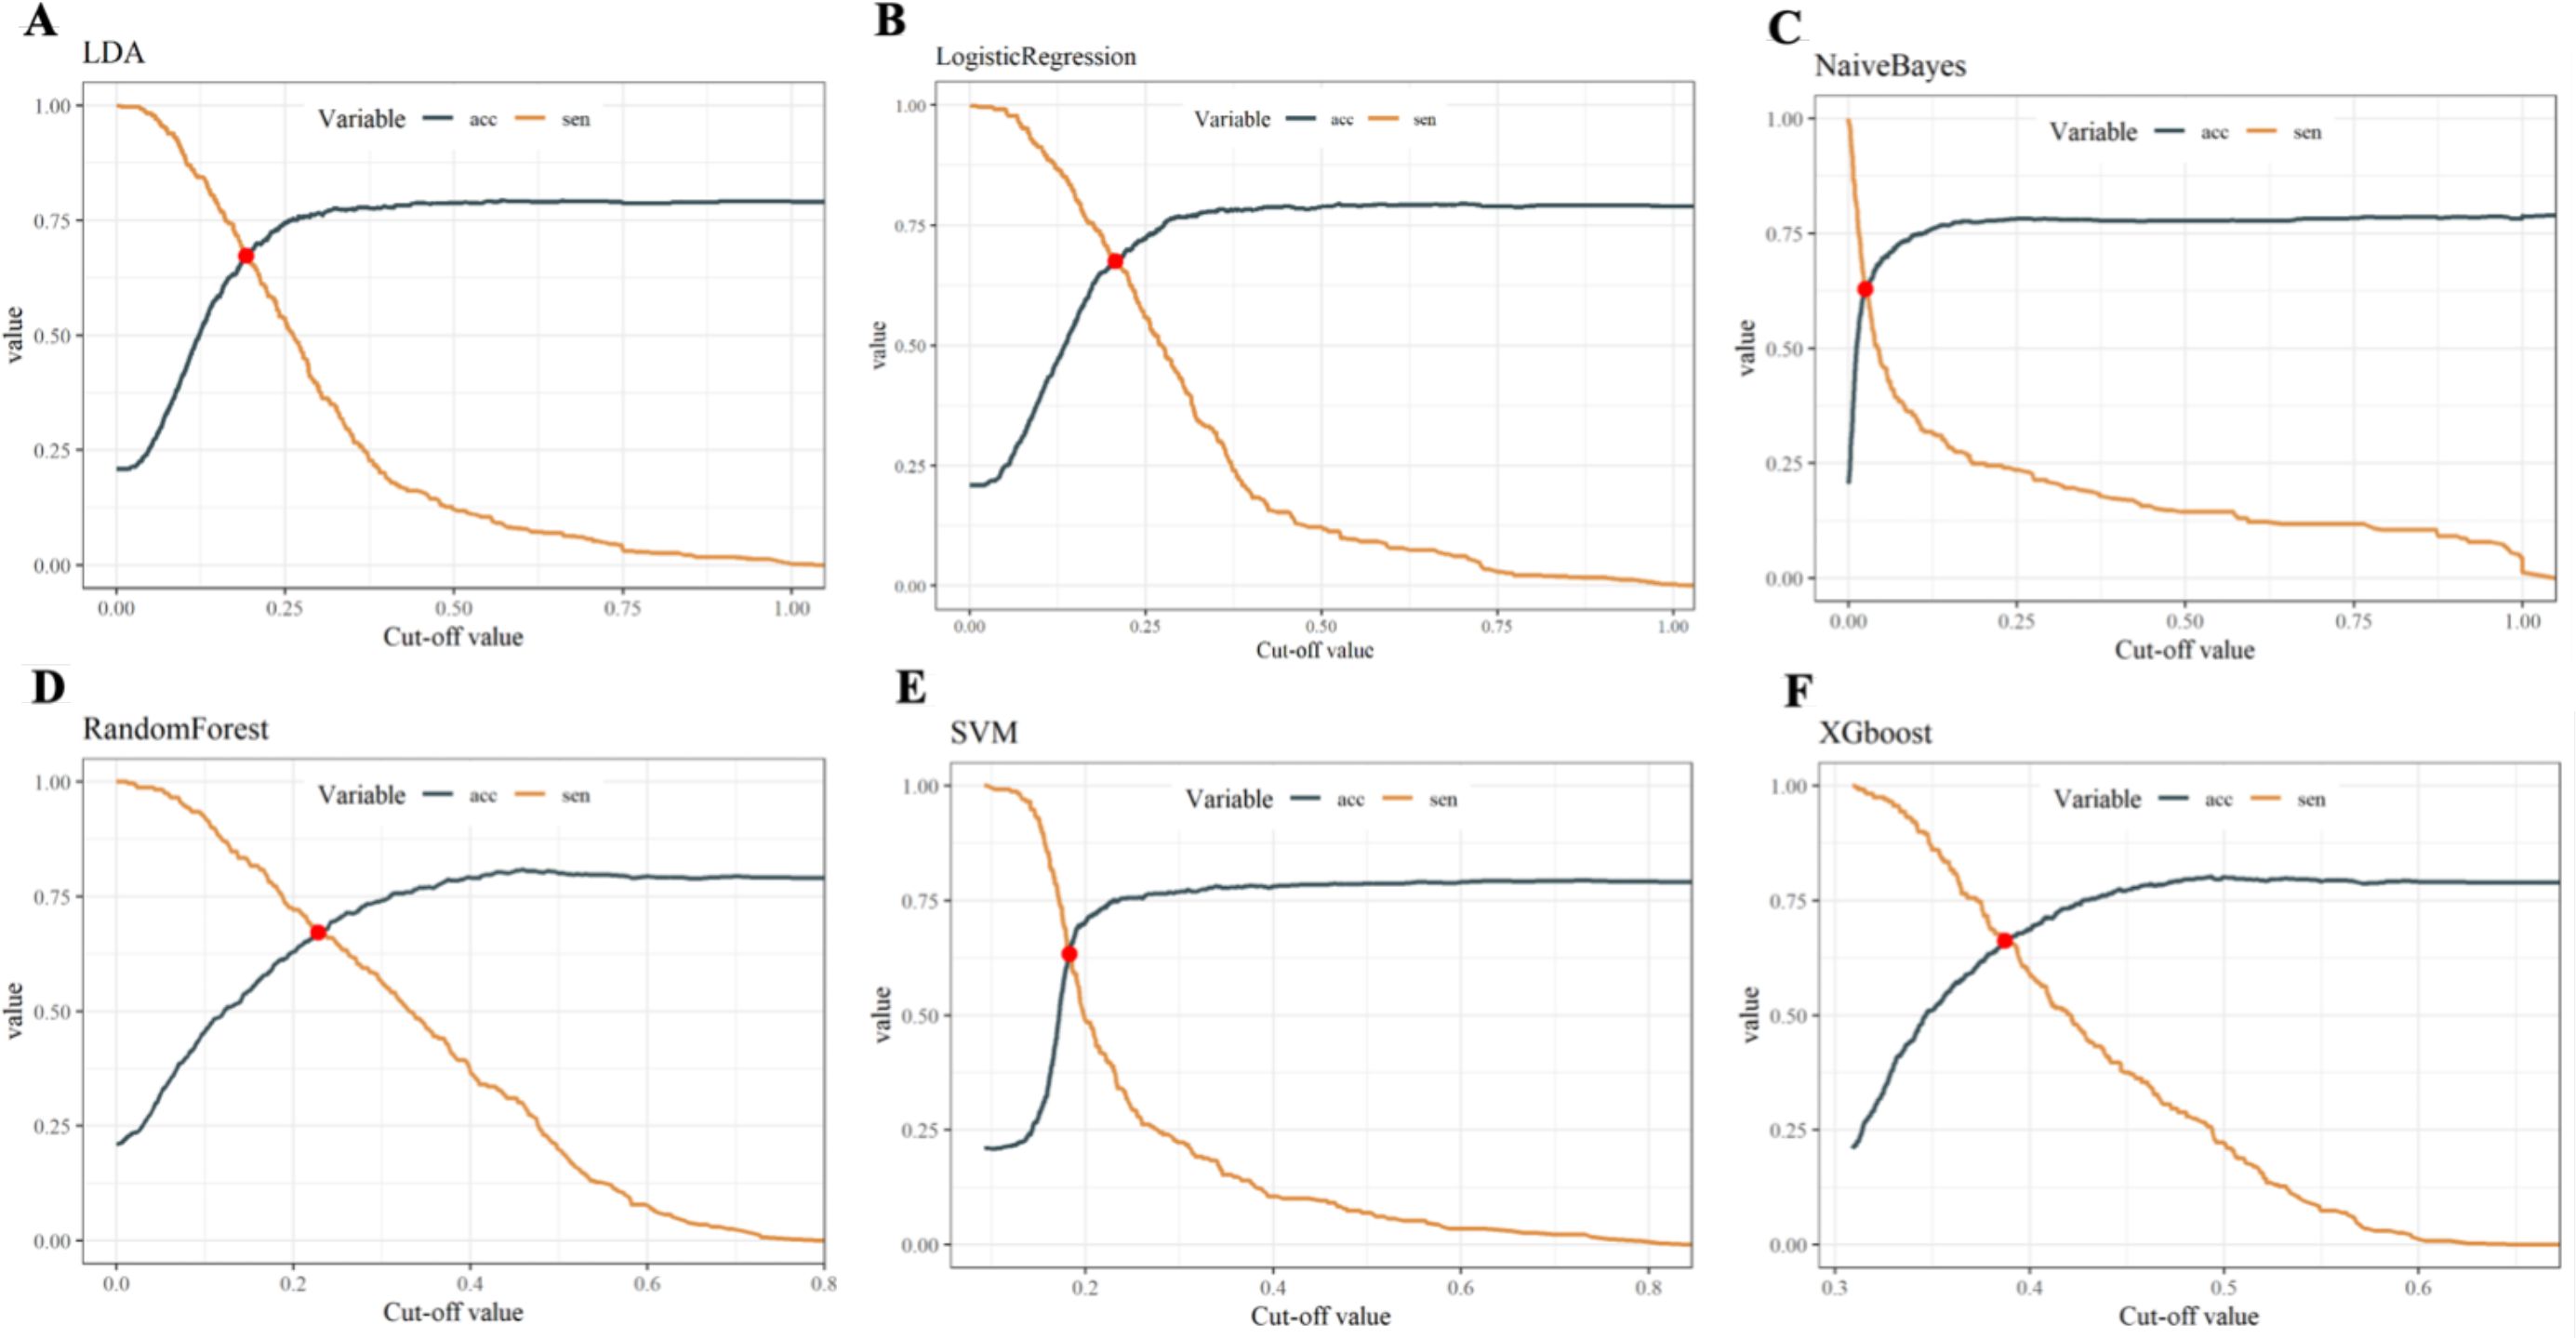
Figure 6. Cut-off values of six ML models in both the training set and internal validation set. (A) Linear discriminant analysis (B) Logistic regression (C) Naive Bayes (D) Random forest (E) Support vector machine (F) Extreme gradient boosting.
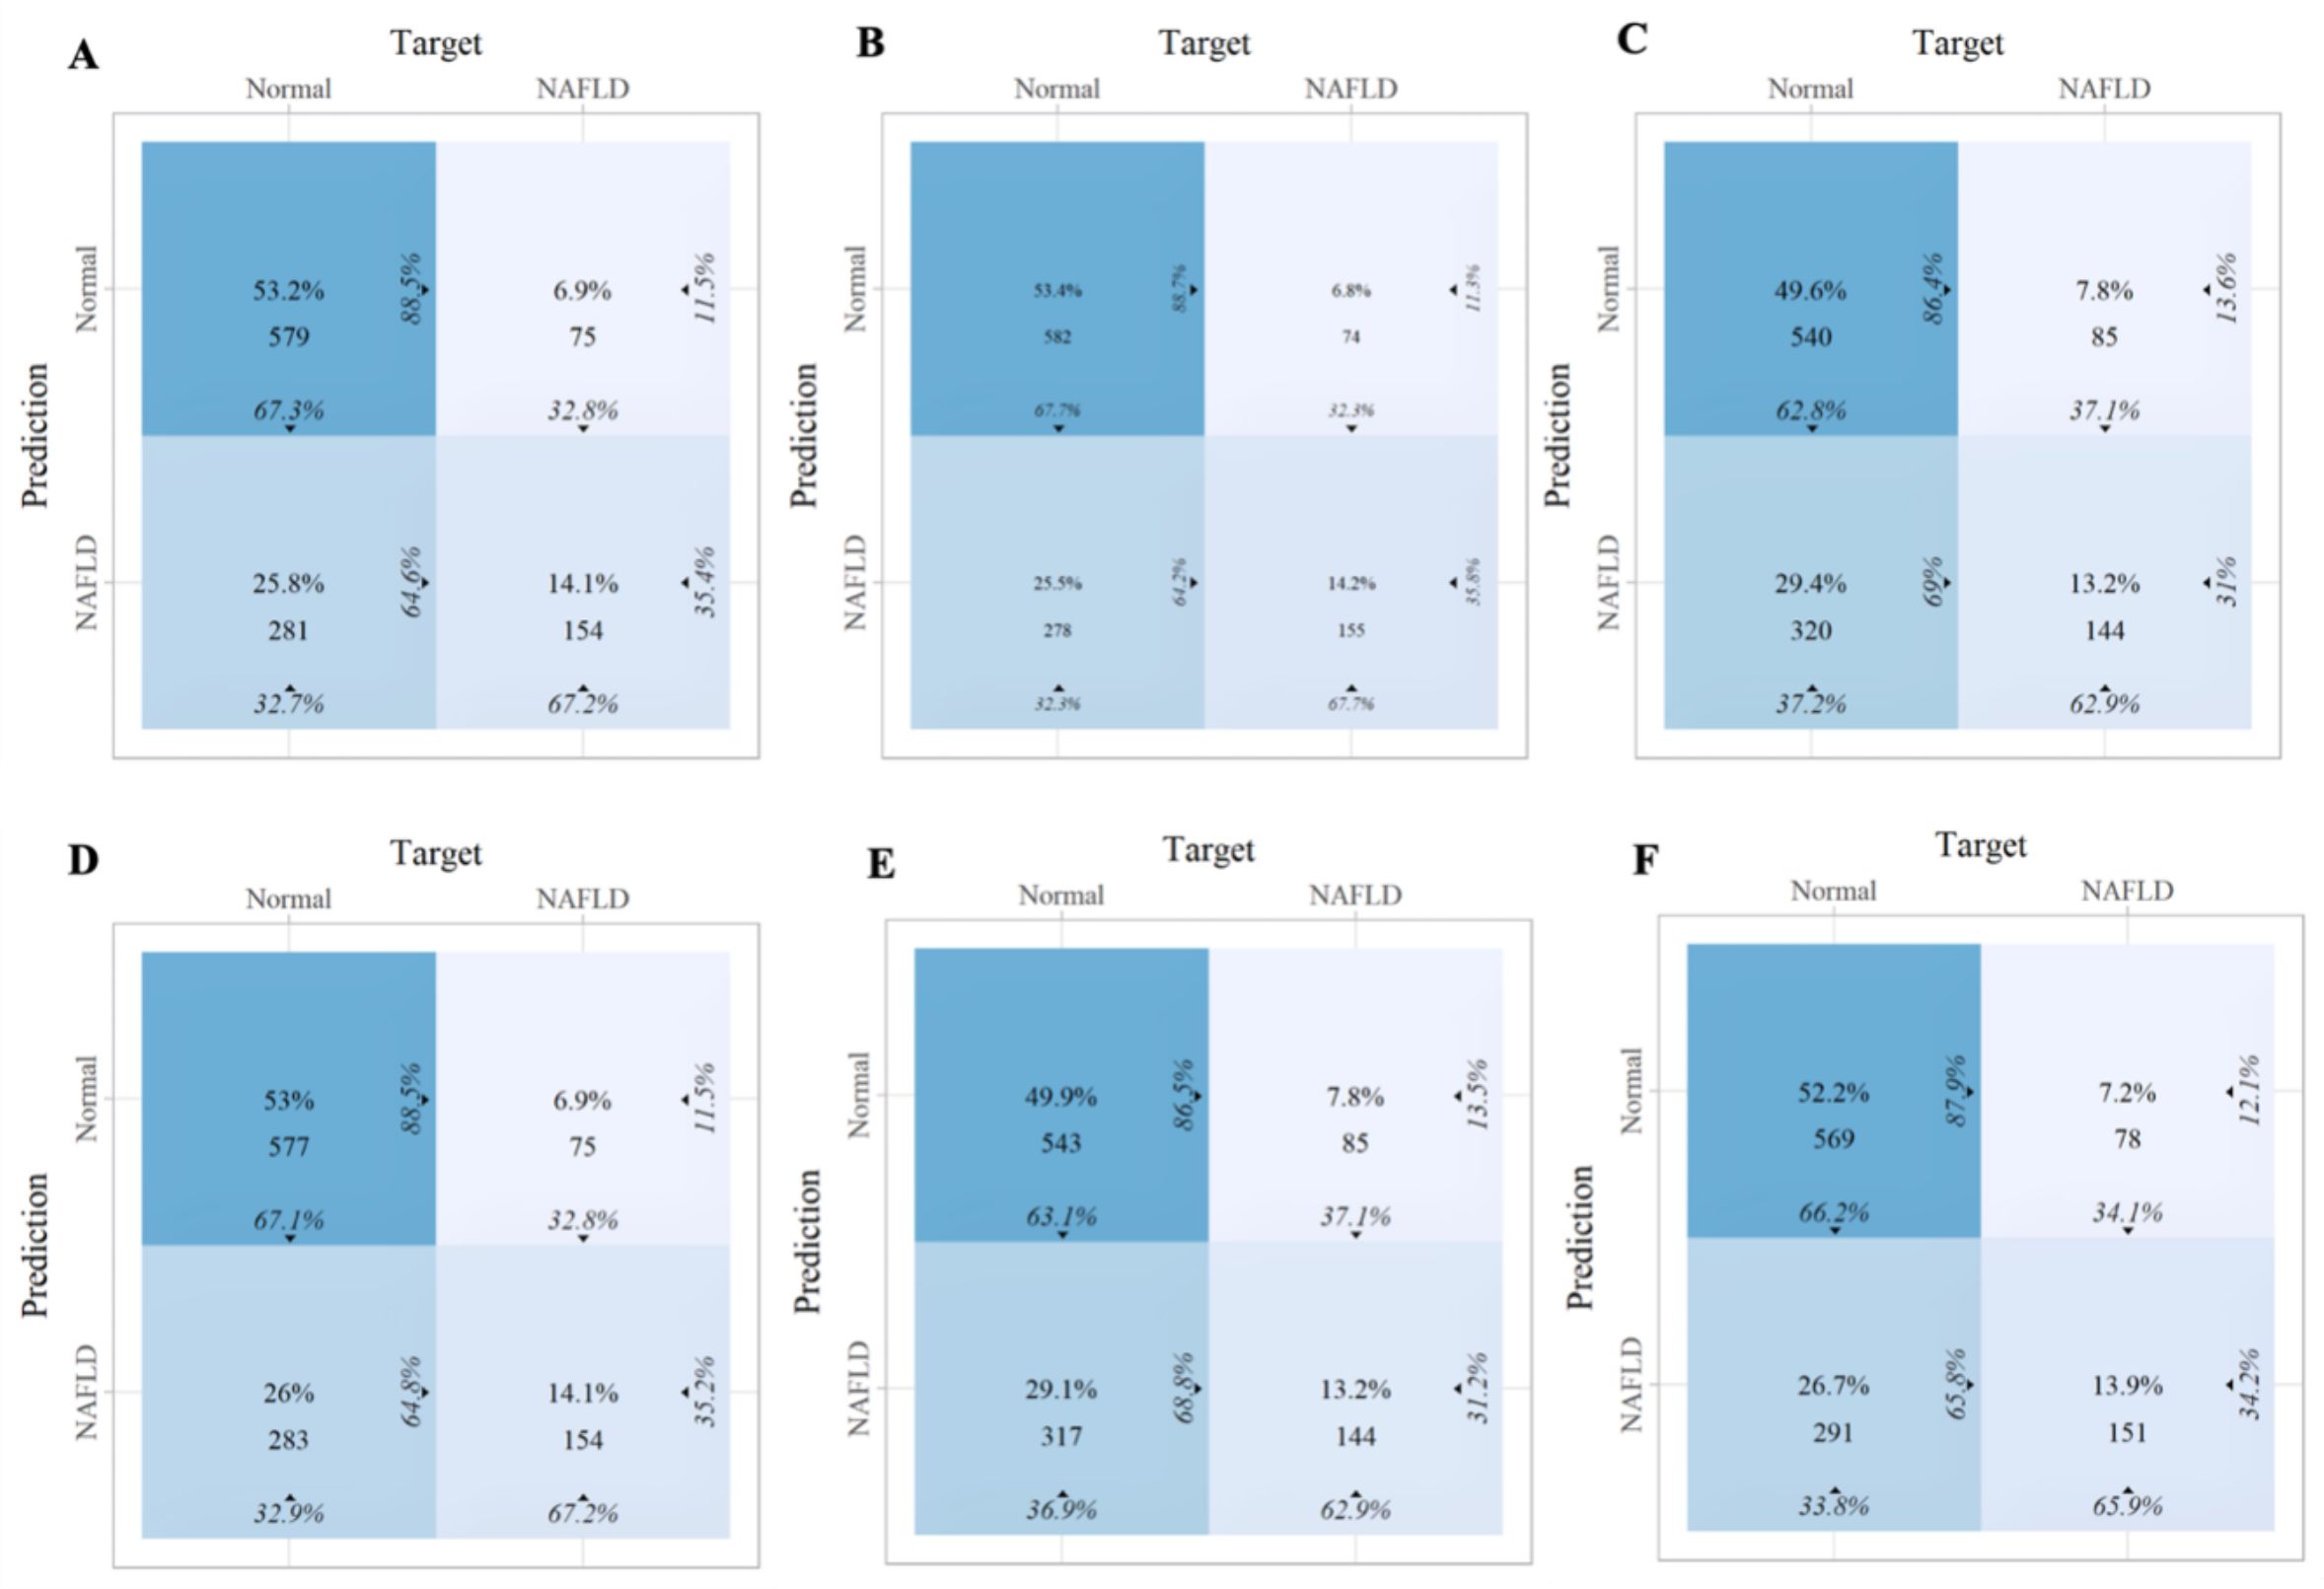
Figure 7. The confusion matrix of the six machine learning models in the training set. (A) Linear discriminant analysis (B) Logistic regression (C) Naive Bayes (D) Random forest (E) Support vector machine (F) Extreme gradient boosting.
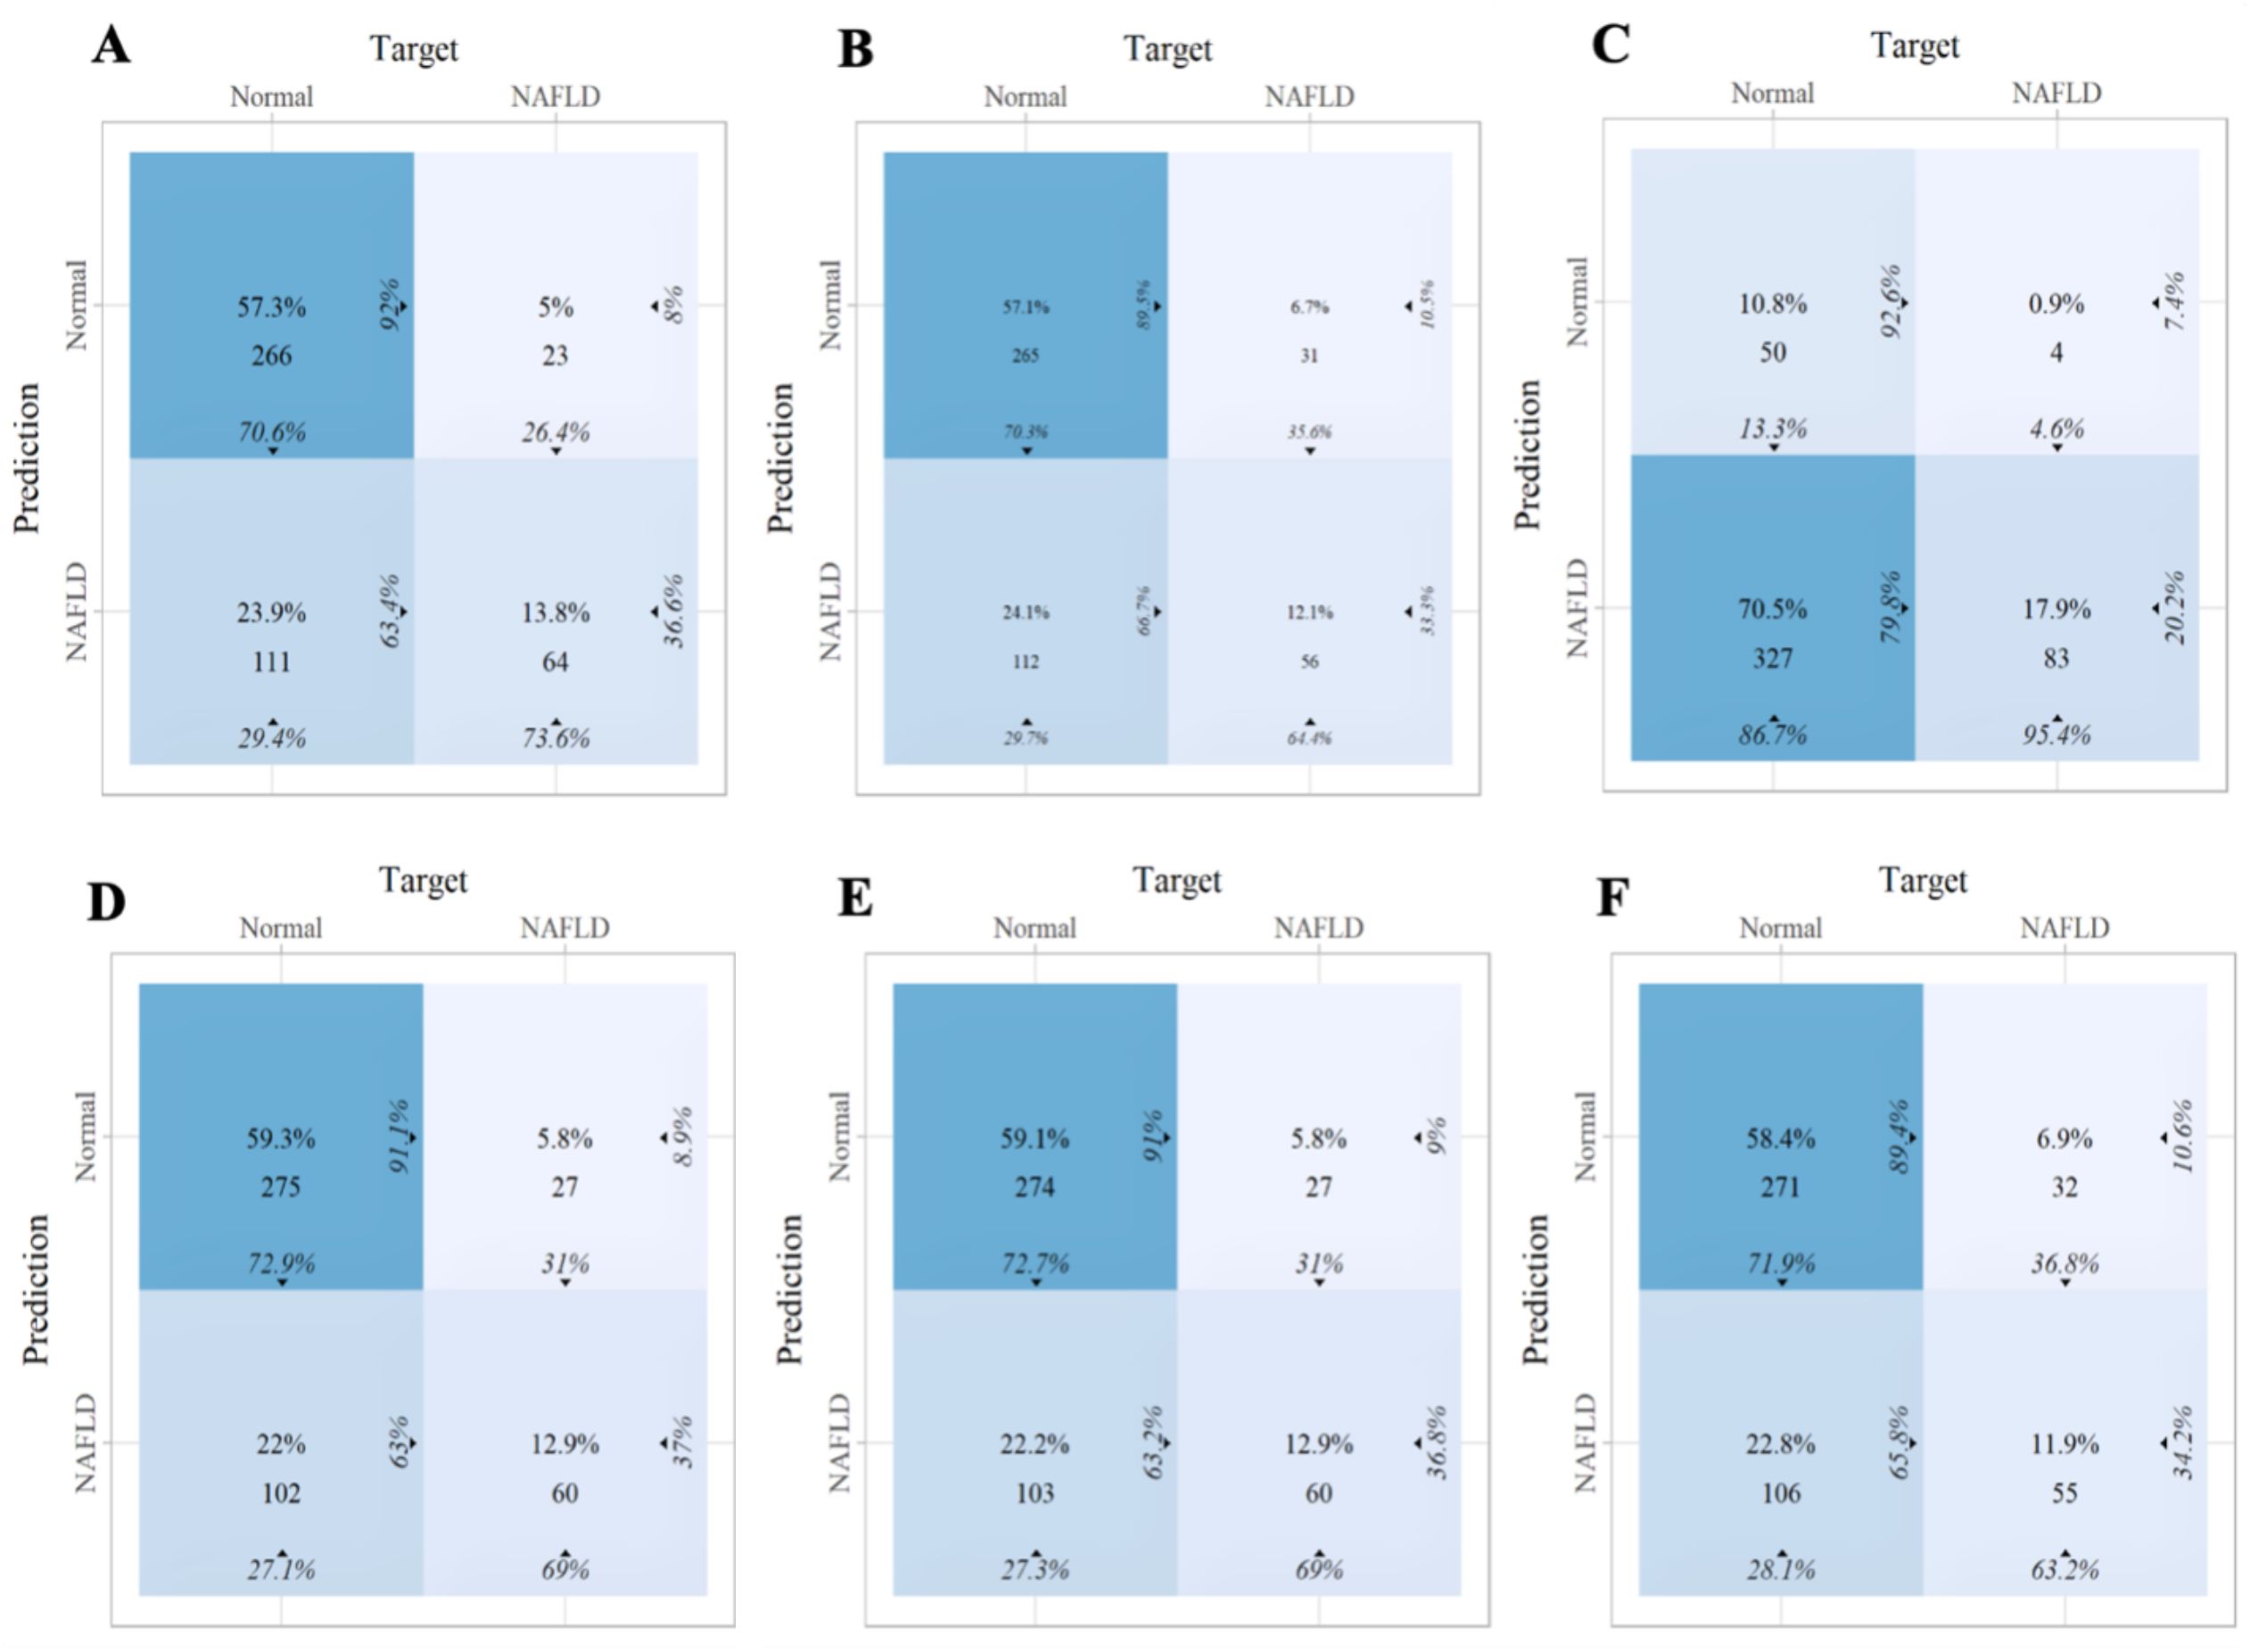
Figure 8. The confusion matrix of the six machine learning models in the internal validation set. (A) Linear discriminant analysis (B) Logistic regression (C) Naive Bayes (D) Random forest (E) Support vector machine (F) Extreme gradient boosting.
In this study, we evaluated the consistency between the model’s predicted probabilities and the actual occurrence probabilities through the analysis of calibration curves for the training set and the internal validation set. As shown in Figure 9, in both the training set and the internal validation set, except for the NB and XGboost models, the predicted values of the remaining models were in good agreement with the theoretical values, indicating favorable clinical calibration. Among them, the Brier score of RF model was the smallest, which reflected the high reliability of the model’s prediction.
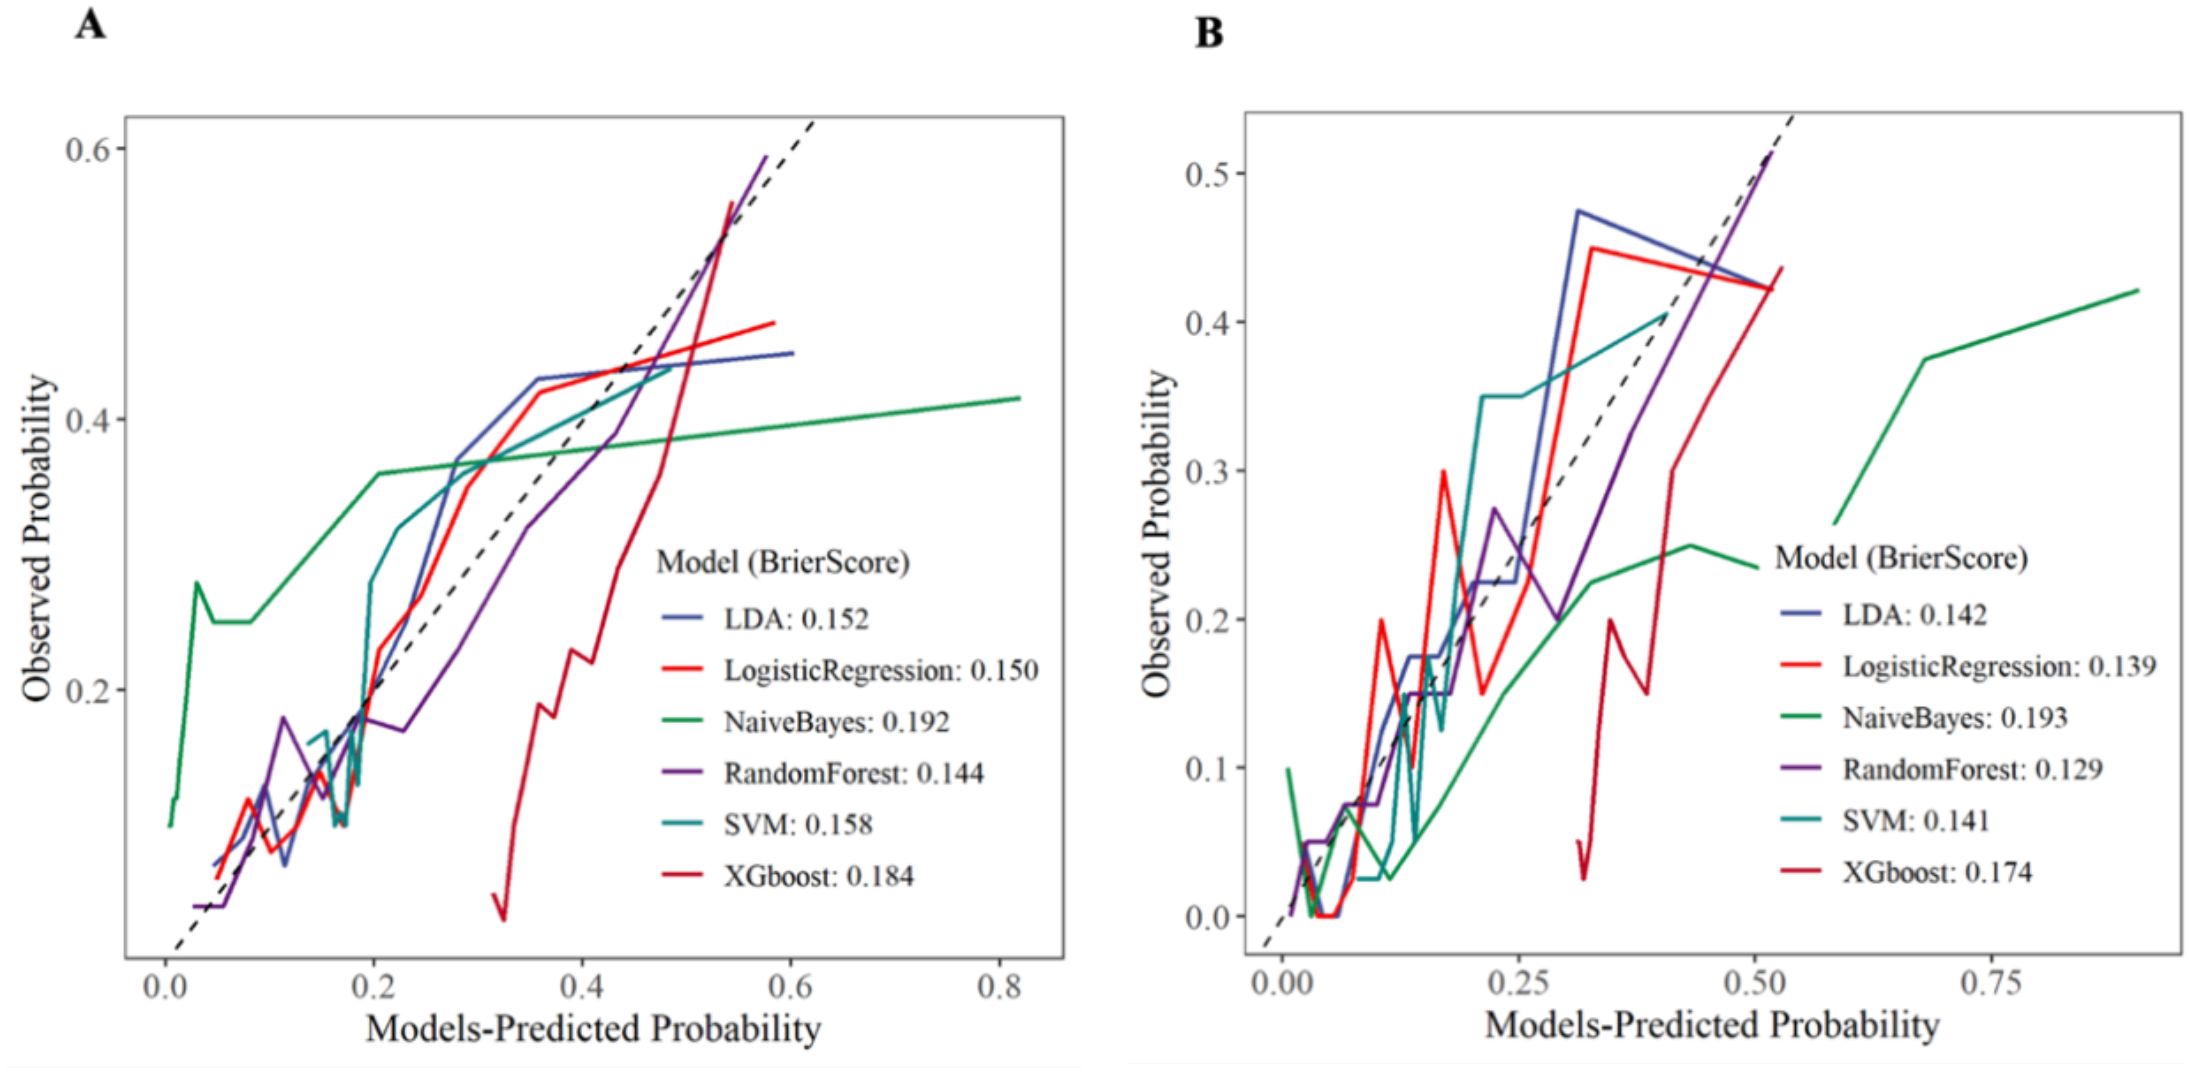
Figure 9. Calibration curve. (A) Training set (B) Internal validation set.
The DCA curve assessed the clinical decision-making value of the model under different thresholds through the net benefit. In the training set and internal validation set, except for the NB and XGboost models, the remaining models (especially the RF model) exhibited favorable clinical decision-making value. The results were presented in Figure 10. We further calculated the risk threshold probabilities of the RF model in the training set. The results indicated that when the threshold probability ranged between 1% and 55%, the net benefit provided by the model was significantly higher than that of the baseline strategy. In the internal validation set, the model also exhibited favorable net benefits, particularly demonstrating clinical advantages within the threshold probability range of 1% to 50%.
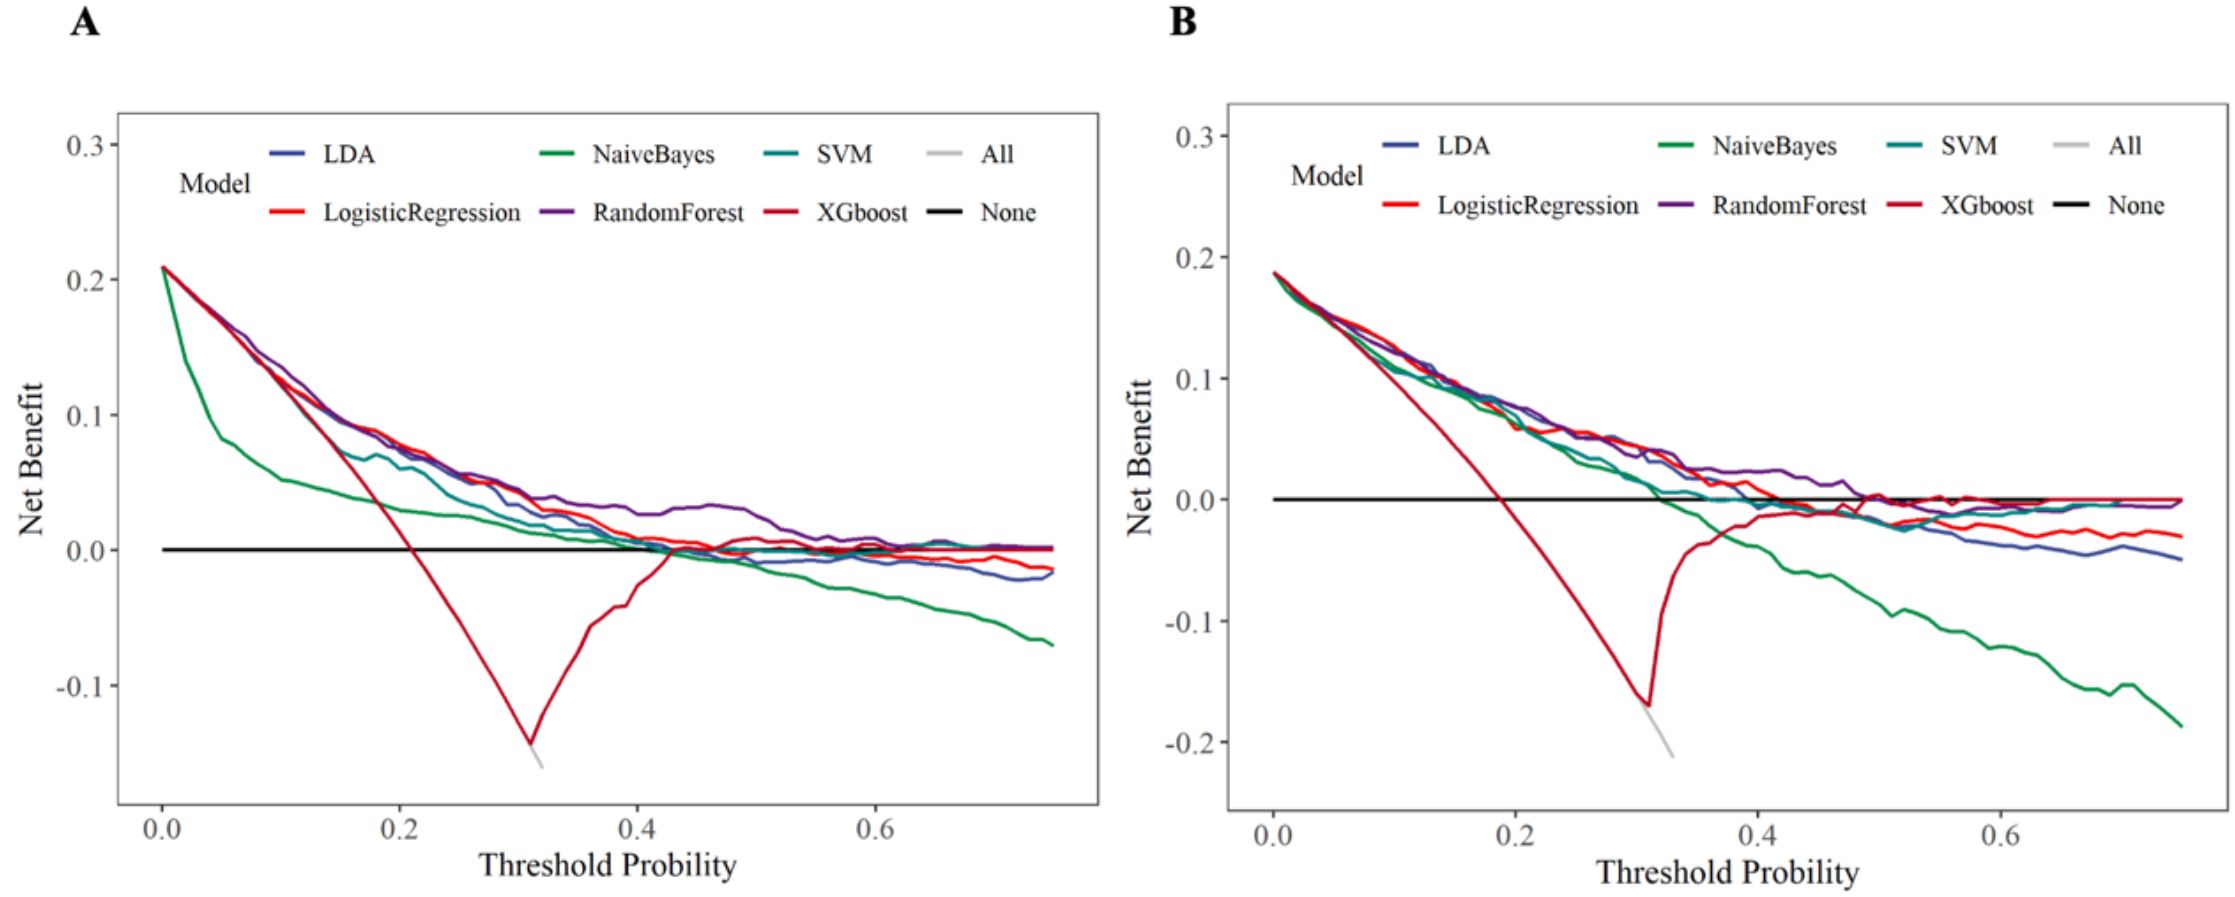
Figure 10. Decision curve analysis. (A) Training set (B) Internal validation set.
SHAP-based model interpretability analysis
ML models achieve favorable performance by capturing data patterns through intricate mathematical structures. However, their complexity makes it difficult to interpret their internal decision - making processes, and they are commonly regarded as “black-box” models. SHAP is a tool designed for interpreting machine learning models. It explains the prediction results of a model by assigning a “contribution value” (Shapley value) to each feature, thereby rendering the decision-making process of black-box models transparent and controllable (30). Based on the above results, the RF model emerged as the optimal predictive model, demonstrating stable performance in both the training set and the internal validation set. Therefore, we further employed interpretable tools to analyze the contributions of characteristic predictors to the RF model. Figure 11A illustrated the contribution of characteristic predictors to the prediction model in the RF model, where TG, ALT, GGT, BMI, and UA were the top five variables in terms of importance. From Figure 11B, we could observe that the larger the TG, ALT, GGT, BMI, and UA, the greater the SHAP value and the higher the risk of disease.
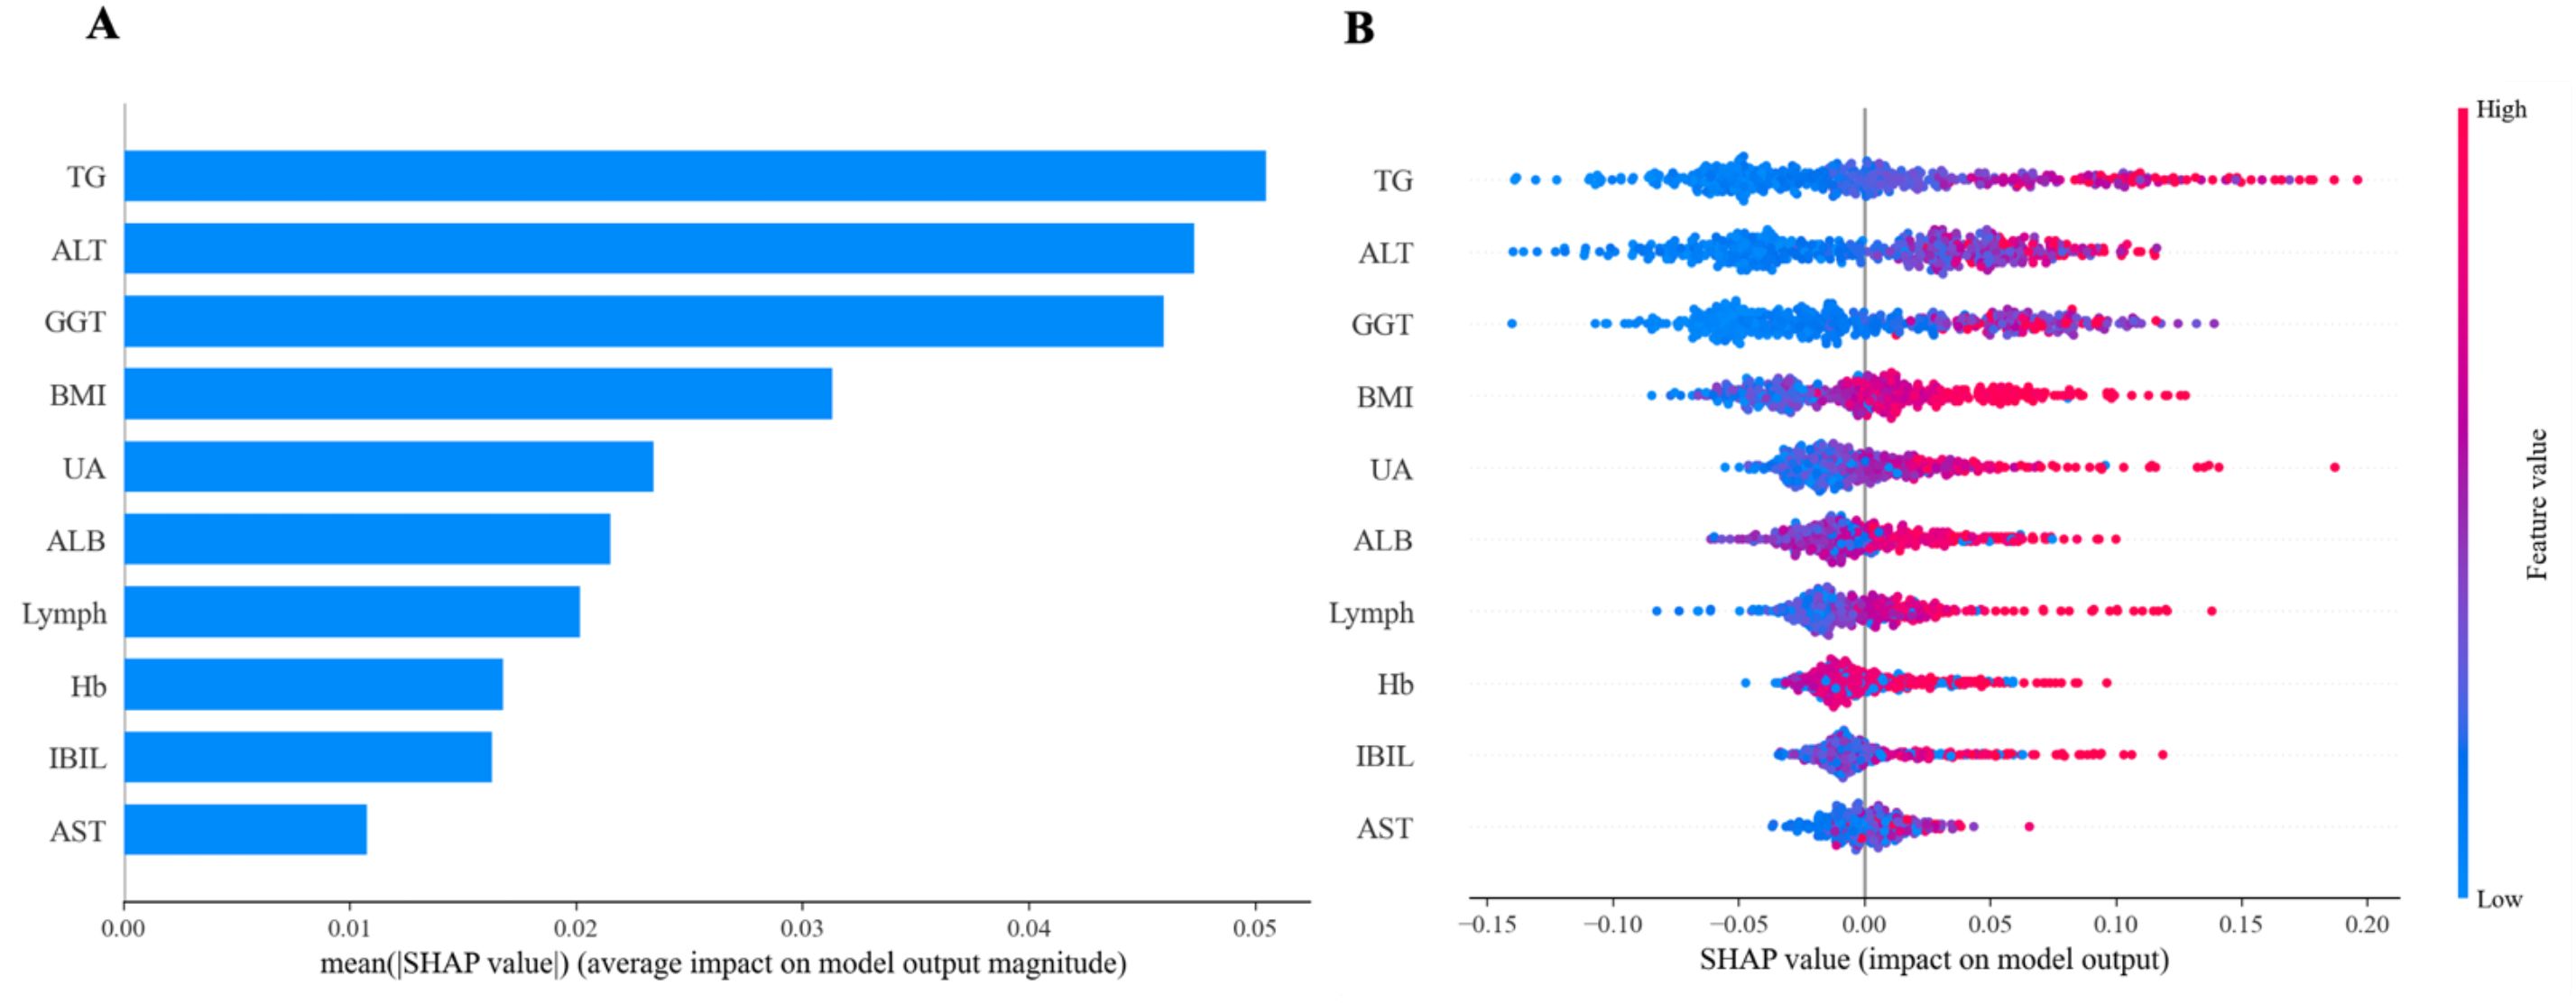
Figure 11. Feature importance of random forest model. (A) The importance ranking of the features according to the mean absolute SHAP value (B) The effect of features on the outcome of the model.
Discussion
A total of 1,553 patients with T2DM were included in this study. Ultimately, 316 patients (20.3%) were diagnosed with lean NAFLD. The prevalence rate was lower than the 33.18% reported by Zhang X et al. (31), which might be associated with sample size and the region. Multivariate logistic regression analysis revealed that eight variables including Age, BMI, ALT, GGT, IBIL, ALB, UA, and TG, were independent risk factors for lean NAFLD in patients with T2DM (p < 0.05), which was generally consistent with the findings of previous studies (32–35). We employed a dual methodology of Boruta’s algorithm and LASSO regression to identify ten predictors for accurate feature selection and model stability, namely BMI, LYMPH, HB, ALT, AST, GGT, IBIL, ALB, UA, and TG. These variables have all been shown to be related to lean NAFLD in previous studies (13, 36, 37). Meanwhile, we established and validated the clinical performance of six ML models. The results showed that the RF model demonstrated the highest clinical predictive value in the training set [AUC: 0.739 (95%CI: 0.676–0.802)] and performed exceptionally well in terms of accuracy, sensitivity, specificity, precision, recall, and F1 score. This was consistent with the results of the study by M et al. on the evaluation of diabetes using ML techniques (38). The SHAP explanation of the RF model showed that TG, ALT, GGT, BMI, and UA were the top five most contributive variables in the predictive model.
Most patients with T2DM are the potential population at risk of lean NAFLD. Patients with T2DM are particularly prone to non-alcoholic steatohepatitis (NASH) and face a higher risk of progressing to liver cirrhosis and hepatocellular carcinoma (39, 40). Research indicated that lipid metabolism in the liver has already been disrupted during the pre-diabetic stage (41). Insulin resistance (IR) plays a crucial role in the occurrence and development of T2DM complicated with lean NAFLD. IR in adipose tissue increases lipolysis and the release of free fatty acids (FFA) and glycerol, leading to the accumulation of triglycerides in the liver. Subsequently, chronic inflammation, up-regulation of hepatotoxic cytokines, oxidative stress, and alterations in the gut microbiota, which damage the liver and cause it to develop into NASH (42–44). Among them, the dysregulation of the spleen-liver immune axis serves as a crucial driving force for the progression of lean NAFLD. Specifically, FFA and pro-inflammatory factors (such as TNF-α and IL-6) enter the spleen via the portal vein circulation, leading to the activation of splenic natural killer T (NKT) cells and the accumulation of myeloid - derived suppressor cells (MDSCs). These abnormally activated immune cells and inflammatory mediators migrate to the liver through the portal vein. On one hand, they exacerbate IR in hepatocytes by inhibiting the insulin signaling pathway. On the other hand, they activate hepatic Kupffer cells, thereby inducing chronic inflammatory responses (45, 46).
Therefore, the identification and screening of lean NAFLD should be incorporated into the routine treatment of patients with T2DM. Due to the lack of reliable methods for detecting steatosis, lean NAFLD is mostly incidentally detected during imaging examinations. However, the large-scale promotion of imaging examinations will inevitably lead to the waste of medical resources and an increase in time costs. Serum indices and imaging techniques are employed for the general screening of diabetic patients to detect advanced fibrosis. However, Qadri S et al. found that serum indices lack high specificity and imaging techniques yield a high rate of false positives (47). In this study, we developed a risk prediction model for lean NAFLD in patients with T2DM based on interpretable ML algorithms. The aim was to identify high-risk individuals at an early stage, thereby reducing the occurrence of adverse events and optimizing medical resources.
This study has certain limitations. Firstly, the sample size of this study was relatively small and confined to a specific populations and regions, which may limit the generalizability of the research findings. Secondly, the collection of clinical data was incomplete, potentially leaving out some latent predictive factors. Finally, the risk prediction model had only been validated using the internal dataset, without external dataset validation or temporal validation. Therefore, in future research, it is advisable to integrate multi-center data and utilize more advanced machine learning techniques to enhance the performance of the model.
Conclusion
This study has effectively developed a risk prediction model for lean NAFLD in patients with T2DM, which holds significant clinical implications for reducing and preventing adverse events. Among them, the performance of the RF model outperforms that of other ML algorithms.
Data availability statement
The original contributions presented in the study are included in the article/Supplementary Material. Further inquiries can be directed to the corresponding authors.
Ethics statement
The studies involving humans were approved by the Ethics Committee of the First Affiliated Hospital of Ningbo University, Ningbo, China (2025010RS). The studies were conducted in accordance with the local legislation and institutional requirements.
Author contributions
SB: Data curation, Formal analysis, Methodology, Visualization, Writing – original draft. QJ: Data curation, Formal analysis, Methodology, Writing – review & editing. TW: Data curation, Formal analysis, Methodology, Writing – review & editing. YM: Conceptualization, Data curation, Funding acquisition, Supervision, Writing – review & editing. GH: Conceptualization, Data curation, Methodology, Validation, Visualization, Writing – review & editing.
Funding
The author(s) declare that financial support was received for the research and/or publication of this article. This project was supported by the Ningbo Natural Science Foundation (2022J233), Ningbo Social Welfare Research (2022S047), and Ningbo medical and health brand discipline (PPXK2024-03).
Acknowledgments
We would like to express our gratitude to the researchers and participants in this study.
Conflict of interest
The authors declare that the research was conducted in the absence of any commercial or financial relationships that could be construed as a potential conflict of interest.
Generative AI statement
The author(s) declare that no Generative AI was used in the creation of this manuscript.
Publisher’s note
All claims expressed in this article are solely those of the authors and do not necessarily represent those of their affiliated organizations, or those of the publisher, the editors and the reviewers. Any product that may be evaluated in this article, or claim that may be made by its manufacturer, is not guaranteed or endorsed by the publisher.
Supplementary material
The Supplementary Material for this article can be found online at: https://www.frontiersin.org/articles/10.3389/fendo.2025.1626203/full#supplementary-material
Glossary
ALB: albumin
ALT: alanine aminotransferase
AST: aspartate aminotransferase
AUC: area under the receiver operating characteristic curve
BMI: body mass index
DCA: decision curve analysis
FFA: free fatty acids
GGT: gamma-glutamyl transpeptidase
HB: hemoglobin
IBIL: indirect bilirubin
IR: Insulin resistance
LASSO: Least Absolute Shrinkage and Selection Operator
LDA: linear discriminant analysis
LR: logistic regression
LYMPH: lymphocyte count
ML: machine learning
NAFLD: Non-alcoholic fatty liver disease
NASH: non-alcoholic steatohepatitis
NB: Naive Bayes
RF: random forest
SHAP: Shapley Additive exPlanations
SVM: support vector machine
TBIL: total bilirubin
T2DM: type 2 diabetes mellitus
TG: triglycerides
UA: uric acid
VIF: variance inflation factor
XGboost: extreme gradient boosting
References
1. Sun H, Saeedi P, Karuranga S, Pinkepank M, Ogurtsova K, Duncan BB, et al. IDF Diabetes Atlas: Global, regional and country-level diabetes prevalence estimates for 2021 and projections for 2045. Diabetes Res Clin Pract. (2022) 183:109119. doi: 10.1016/j.diabres.2021.109119
2. Han SK, Baik SK, and Kim MY. Non-alcoholic fatty liver disease: Definition and subtypes. Clin Mol Hepatol. (2023) 29:S5–S16. doi: 10.3350/cmh.2022.0424
3. Younossi ZM, Golabi P, Paik JM, Henry A, Van Dongen C, and Henry L. The global epidemiology of nonalcoholic fatty liver disease (NAFLD) and nonalcoholic steatohepatitis (NASH): a systematic review. Hepatology. (2023) 77:1335–47. doi: 10.1097/HEP.0000000000000004
4. Wong VW, Ekstedt M, Wong GL, and Hagstrom H. Changing epidemiology, global trends and implications for outcomes of NAFLD. J Hepatol. (2023) 79:842–52. doi: 10.1016/j.jhep.2023.04.036
5. Targher G, Corey KE, Byrne CD, and Roden M. The complex link between NAFLD and type 2 diabetes mellitus - mechanisms and treatments. Nat Rev Gastroenterol Hepatol. (2021) 18:599–612. doi: 10.1038/s41575-021-00448-y
6. En Li Cho E, Ang CZ, Quek J, Fu CE, Lim LKE, Heng ZEQ, et al. Global prevalence of non-alcoholic fatty liver disease in type 2 diabetes mellitus: an updated systematic review and meta-analysis. Gut. (2023) 72:2138–48. doi: 10.1136/gutjnl-2023-330110
7. Xia MF, Bian H, and Gao X. NAFLD and diabetes: two sides of the same coin? Rationale for gene-based personalized NAFLD treatment. Front Pharmacol. (2019) 10:877. doi: 10.3389/fphar.2019.00877
8. Francque S and Wong VW. NAFLD in lean individuals: not a benign disease. Gut. (2022) 71:234–6. doi: 10.1136/gutjnl-2021-324162
9. Lu FB, Zheng KI, Rios RS, Targher G, Byrne CD, and Zheng MH. Global epidemiology of lean non-alcoholic fatty liver disease: A systematic review and meta-analysis. J Gastroenterol Hepatol. (2020) 35:2041–50. doi: 10.1111/jgh.15156
10. Wongtrakul W, Charatcharoenwitthaya N, and Charatcharoenwitthaya P. Lean non-alcoholic fatty liver disease and the risk of all-cause mortality: An updated meta-analysis. Ann Hepatol. (2024) 29:101288. doi: 10.1016/j.aohep.2024.101288
11. Souza M, Diaz I, and Al-Sharif L. Liver and cardiovascular outcomes in lean non-alcoholic fatty liver disease: an updated systematic review and meta-analysis of about 1 million individuals. Hepatol Int. (2024) 18:1396–415. doi: 10.1007/s12072-024-10716-z
12. Chalasani N, Younossi Z, Lavine JE, Charlton M, Cusi K, Rinella M, et al. The diagnosis and management of nonalcoholic fatty liver disease: Practice guidance from the American Association for the Study of Liver Diseases. Hepatology. (2018) 67:328–57. doi: 10.1002/hep.29367
13. Wang AY, Dhaliwal J, and Mouzaki M. Lean non-alcoholic fatty liver disease. Clin Nutr. (2019) 38:975–81. doi: 10.1016/j.clnu.2018.08.008
14. American Diabetes Association Professional Practice C. 4. Comprehensive medical evaluation and assessment of comorbidities: standards of care in diabetes-2025. Diabetes Care. (2025) 48:S59–85. doi: 10.2337/dc25-S004
15. European Association for the Study of the L, European Association for the Study of D, and European Association for the Study of O. EASL-EASD-EASO Clinical Practice Guidelines for the management of non-alcoholic fatty liver disease. Diabetologia. (2016) 59:1121–40. doi: 10.1007/s00125-016-3902-y
16. Papastergiou V, Tsochatzis E, and Burroughs AK. Non-invasive assessment of liver fibrosis. Ann Gastroenterol. (2012) 25:218–31.
17. Vilar-Gomez E and Chalasani N. Non-invasive assessment of non-alcoholic fatty liver disease: Clinical prediction rules and blood-based biomarkers. J Hepatol. (2018) 68:305–15. doi: 10.1016/j.jhep.2017.11.013
18. Papatheodoridi M and Cholongitas E. Diagnosis of non-alcoholic fatty liver disease (NAFLD): current concepts. Curr Pharm Des. (2018) 24:4574–86. doi: 10.2174/1381612825666190117102111
19. Prakash S, Balaji JN, Joshi A, and Surapaneni KM. Ethical conundrums in the application of artificial intelligence (AI) in healthcare-A scoping review of reviews. J Pers Med. (2022) 12. doi: 10.3390/jpm12111914
20. Shamout F, Zhu T, and Clifton DA. Machine learning for clinical outcome prediction. IEEE Rev BioMed Eng. (2021) 14:116–26. doi: 10.1109/RBME.4664312
21. Bhat SS, Ansari GA, and Ansari MD. Performance analysis of machine learning based on optimized feature selection for type II diabetes mellitus. Multimedia Tools Applications. (2025) 84:4945–64. doi: 10.1007/s11042-024-19000-6
22. Ansari GA, Shafi Bhat S, Dilshad Ansari M, Ahmad S, and A. M. Abdeljaber H. Prediction and diagnosis of breast cancer using machine learning techniques. Data Metadata. (2024) 3:.346. doi: 10.56294/dm2024.346
23. Ansari GA, Bhat SS, Ansari MD, Ahmad S, Nazeer J, and Eljialy AEM. Performance evaluation of machine learning techniques (MLT) for heart disease prediction. Comput Math Methods Med. (2023) 2023:8191261. doi: 10.1155/2023/8191261
24. Su PY, Chen YY, Lin CY, Su WW, Huang SP, and Yen HH. Comparison of machine learning models and the fatty liver index in predicting lean fatty liver. Diagnostics (Basel). (2023) 13. doi: 10.3390/diagnostics13081407
25. Enders CK, Mistler SA, and Keller BT. Multilevel multiple imputation: A review and evaluation of joint modeling and chained equations imputation. Psychol Methods. (2016) 21:222–40. doi: 10.1037/met0000063
26. ElSayed NA, Aleppo G, Aroda VR, Bannuru RR, Brown FM, Bruemmer D, et al. Addendum. 2. Classification and diagnosis of diabetes: standards of care in diabetes-2023. Diabetes Care. (2023) 46:S19–40. doi: 10.2337/dc23-ad08
27. Schober P, Mascha EJ, and Vetter TR. Statistics from A (Agreement) to Z (z score): A guide to interpreting common measures of association, agreement, diagnostic accuracy, effect size, heterogeneity, and reliability in medical research. Anesth Analg. (2021) 133:1633–41. doi: 10.1213/ANE.0000000000005773
28. Kang J, Choi YJ, Kim IK, Lee HS, Kim H, Baik SH, et al. LASSO-based machine learning algorithm for prediction of lymph node metastasis in T1 colorectal cancer. Cancer Res Treat. (2021) 53:773–83. doi: 10.4143/crt.2020.974
29. Qin J, Cao P, Ding X, Zeng Z, Deng L, and Luo L. Machine learning identifies ferroptosis-related gene ANXA2 as potential diagnostic biomarkers for NAFLD. Front Endocrinol (Lausanne). (2023) 14:1303426. doi: 10.3389/fendo.2023.1303426
30. Ning Y, Ong MEH, Chakraborty B, Goldstein BA, Ting DSW, Vaughan R, et al. Shapley variable importance cloud for interpretable machine learning. Patterns (N Y). (2022) 3:100452. doi: 10.1016/j.patter.2022.100452
31. Zhang X, He Z, Si Q, Hu X, Yang L, Gu X, et al. The association of sarcopenia and visceral obesity with lean nonalcoholic fatty liver disease in Chinese patients with type 2 diabetes mellitus. J Diabetes Res. (2022) 2022:2229139. doi: 10.1155/2022/2229139
32. Niriella MA, Kasturiratne A, Pathmeswaran A, De Silva ST, Perera KR, Subasinghe S, et al. Lean non-alcoholic fatty liver disease (lean NAFLD): characteristics, metabolic outcomes and risk factors from a 7-year prospective, community cohort study from Sri Lanka. Hepatol Int. (2019) 13:314–22. doi: 10.1007/s12072-018-9916-4
33. Alam S, Eslam M, Skm Hasan N, Anam K, Chowdhury MAB, Khan MAS, et al. Risk factors of nonalcoholic fatty liver disease in lean body mass population: A systematic review and meta-analysis. JGH Open. (2021) 5:1236–49. doi: 10.1002/jgh3.12658
34. Danpanichkul P, Suparan K, Prasitsumrit V, Ahmed A, Wijarnpreecha K, and Kim D. Long-term outcomes and risk modifiers of metabolic dysfunction-associated steatotic liver disease between lean and non-lean populations. Clin Mol Hepatol. (2025) 31:74–89. doi: 10.3350/cmh.2024.0631
35. Navarroza AMC and Wong SN. Comparison of clinical and metabolic profiles of lean versus non-lean nonalcoholic fatty liver disease. Indian J Gastroenterol. (2021) 40:380–8. doi: 10.1007/s12664-021-01184-6
36. Yao J, Dai Y, Zhang J, Zhang X, and Zheng R. Association between serum ferritin level and nonalcoholic fatty liver disease in a non-obese Chinese population: a cross-sectional study. Clin Lab. (2019) 65. doi: 10.7754/Clin.Lab.2019.181250
37. Akyuz U, Yesil A, and Yilmaz Y. Characterization of lean patients with nonalcoholic fatty liver disease: potential role of high hemoglobin levels. Scand J Gastroenterol. (2015) 50:341–6. doi: 10.3109/00365521.2014.983160
38. Bhat SS, Selvam V, Ansari GA, and Ansari MD eds. Analysis of Diabetes mellitus using Machine Learning Techniques. In: 2022 5th International Conference on Multimedia, Signal Processing and Communication Technologies (IMPACT).
39. Arrese M, Barrera F, Triantafilo N, and Arab JP. Concurrent nonalcoholic fatty liver disease and type 2 diabetes: diagnostic and therapeutic considerations. Expert Rev Gastroenterol Hepatol. (2019) 13:849–66. doi: 10.1080/17474124.2019.1649981
40. Tilg H, Moschen AR, and Roden M. NAFLD and diabetes mellitus. Nat Rev Gastroenterol Hepatol. (2017) 14:32–42. doi: 10.1038/nrgastro.2016.147
41. Park J, Kwon HJ, Sohn W, Cho JY, Park SJ, Chang Y, et al. Risk of liver fibrosis in patients with prediabetes and diabetes mellitus. PloS One. (2022) 17:e0269070. doi: 10.1371/journal.pone.0269070
42. Tanase DM, Gosav EM, Costea CF, Ciocoiu M, Lacatusu CM, Maranduca MA, et al. The intricate relationship between type 2 diabetes mellitus (T2DM), insulin resistance (IR), and nonalcoholic fatty liver disease (NAFLD). J Diabetes Res. (2020) 2020:3920196. doi: 10.1155/2020/3920196
43. Manilla V, Santopaolo F, Gasbarrini A, and Ponziani FR. Type 2 diabetes mellitus and liver disease: across the gut-liver axis from fibrosis to cancer. Nutrients. (2023) 15. doi: 10.3390/nu15112521
44. Giannopoulos CK, Tzima IG, Tentolouris NK, and Vasileiadis IA. Common pathogenetic pathways of non-alcoholic fatty liver disease and type 2 diabetes mellitus. Curr Diabetes Rev. (2023) 19:e160223213720. doi: 10.2174/1573399819666230216112032
45. Brummer C, Singer K, Renner K, Bruss C, Hellerbrand C, Dorn C, et al. The spleen-liver axis supports obesity-induced systemic and fatty liver inflammation via MDSC and NKT cell enrichment. Mol Cell Endocrinol. (2025) 601:112518. doi: 10.1016/j.mce.2025.112518
46. Tarantino G, Citro V, and Balsano C. Liver-spleen axis in nonalcoholic fatty liver disease. Expert Rev Gastroenterol Hepatol. (2021) 15:759–69. doi: 10.1080/17474124.2021.1914587
Keywords: lean non-alcoholic fatty liver disease, type 2 diabetes mellitus, interpretable machine learning, prediction model, predict risk
Citation: Bao S, Jin Q, Wang T, Mao Y and Huang G (2025) Predicting the risk of lean non-alcoholic fatty liver disease based on interpretable machine models in a Chinese T2DM population. Front. Endocrinol. 16:1626203. doi: 10.3389/fendo.2025.1626203
Received: 10 May 2025; Accepted: 23 June 2025;
Published: 11 July 2025.
Edited by:
Xiantong Zou, Peking University People’s Hospital, ChinaReviewed by:
Giovanni Tarantino, University of Naples Federico II, ItalyMohd Dilshad Ansari, SRM University (Delhi-NCR), India
Tien Van Nguyen, Thai Binh University of Medicine and Pharmacy, Vietnam
Copyright © 2025 Bao, Jin, Wang, Mao and Huang. This is an open-access article distributed under the terms of the Creative Commons Attribution License (CC BY). The use, distribution or reproduction in other forums is permitted, provided the original author(s) and the copyright owner(s) are credited and that the original publication in this journal is cited, in accordance with accepted academic practice. No use, distribution or reproduction is permitted which does not comply with these terms.
*Correspondence: Tieqiao Wang, OTQ0MDkyMTNAcXEuY29t; Yushan Mao, bWFveXVzaGFuQG5idS5lZHUuY24=; Guoqing Huang, Z3VvcWluZ2h1YW5nQDE2My5jb20=