 Xiao-jie Zhou1,2†
 Min-zhe Xu
 Ya-qin Gong
 Jian Jin
 Ke Lu
Ke Lu Chong Li
- 1Department of Orthopedics, Affiliated Kunshan Hospital of Jiangsu University, Suzhou, Jiangsu, China
- 2Kunshan Biomedical Big Data Innovation Application Laboratory, Suzhou, Jiangsu, China
- 3Information Department, Affiliated Kunshan Hospital of Jiangsu University, Suzhou, Jiangsu, China
- 4Kunshan Municipal Health and Family Planning Information Center, Suzhou, Jiangsu, China
Background: The triglyceride-glucose index (TyG) has been linked to metabolic disorders, yet its association with serum uric acid (SUA) in elderly osteoporosis patients remains unclear. This study aimed to determine whether TyG independently correlates with SUA levels in osteoporotic fracture (OPF) patients aged >50 years.
Methods: This was a retrospective cross-sectional analysis of data from 2,152 OPF patients from the Affiliated Kunshan Hospital of Jiangsu University database hospitalized between January 2017 and July 2022. Baseline TyG was the exposure variable, whereas SUA levels were the study outcome. When analyzing this relationship, adjustments were made for age, gender, BMI, and various baseline clinical and laboratory parameters, followed by the fitting of separate univariate and multivariate linear regression models. Non-linear association analyses were also conducted with the generalized additive model (GAM). This relationship was further characterized through smooth curve fitting, univariate analysis, and threshold effect analyses.
Results: After adjusting for confounders, an S-shaped relationship between TyG and SUA levels was identified and fitted to a two-piecewise linear regression model with inflection points at 6.34 and 8.09 (P-value for LRT < 0.01). Significant positive correlation was observed within the range 6.34–8.09 (β = 27.73, 95% CI: 18.72–36.75, P < 0.01), whereas no significant association was found below or above this range.
Conclusions: This study demonstrates a non-linear S-shaped relationship between TyG and SUA levels in OPF patients, with a significant correlation observed only within a specific TyG range. These findings provide novel insights into the metabolic implications of TyG in elderly individuals with osteoporosis.
1 Introduction
Osteoporotic fractures (OPFs) are a common skeletal condition affecting middle-aged and older adults (1). They are characterized as low-energy or fragility fractures and represent the severe stage of osteoporosis (OP), associated with high rates of morbidity, disability, mortality, and significant medical costs (2). Globally, one OPF occurs every three seconds, and approximately 50% of women and 20% of men will experience their first OPF after the age of 50, and half of the individuals who sustain one fracture are likely to suffer another (3). In China alone, there were an estimated 2.33 million OPF cases in 2010, a figure projected to increase to 5.99 million by 2050 (4). Therefore, OPFs are not just a threat to public health, but also a pressing social issue, highlighting the urgency required to prevent these fractures and to monitor patients.
Insulin resistance (IR) has been implicated in pathological bone turnover and disruptions in bone homeostasis (5). While the hyperinsulinemic euglycemic glucose clamp (HEGC) approach remains a “gold standard” for IR assessment, it is expensive, complex, and entails multiple rounds of blood collection that limit its clinical feasibility (6). To address these challenges, the triglyceride-glucose (TyG) index, calculated as ln [triglyceride (TG) (mg/dL) × fasting blood glucose (FBG) (mg/dL)/2] (5), has emerged as a promising alternative biomarker for IR (7). Recent research has linked the TyG index to various conditions, including coronary artery disease, hypertension, ischemic stroke, heart failure, liver fibrosis, and kidney stones (6, 8–11). Additionally, mounting evidence highlights a strong association between IR and levels of serum uric acid (SUA) (12–14).
SUA is the final product produced through the metabolism of purines or the catabolic processing of purine nucleotides (15). It is known to exhibit potent extracellular antioxidant properties, scavenging oxygen free radicals generated by oxidative stress and preventing oxidative damage (16). Humans, however, lack the uricase enzyme, which converts uric acid into highly soluble compounds. As a result, urate remains in circulation, leading to elevated basal SUA levels (17). High SUA levels are strongly associated with diabetes, hypertension, obesity, renal function decline, and cardiovascular diseases (18–20). Hyperuricemia contributes to IR by promoting mitochondrial oxidative stress, inducing inflammation, and disrupting insulin signaling pathways (21). An observational study of 5,012 healthy adolescents followed over 15 years supports the use of SUA levels as a simple indicator for predicting the future onset of type 2 diabetes and IR (22). Furthermore, elevated SUA levels can induce inflammation and oxidative stress, increasing the activity of bone-resorbing cells, inhibiting osteoblast function, and ultimately causing bone loss and osteoporosis (23).
Previous research has predominantly focused on the relationship between SUA and the TyG index in younger populations, including children and college students (14, 24). However, there is limited evidence examining this relationship in older adults, particularly those with OPFs. Therefore, this study focused at length on the independent association between TyG and SUA among patients 50+ years of age with OPFs.
2 Materials and methods
2.1 Study design and population
This study is a retrospective cross-sectional analysis based on data collected between January 2017 and July 2022 at the Affiliated Kunshan Hospital of Jiangsu University, Suzhou, China. Graphical abstract is shown in Figure 1. A total of 2,152 hospitalized patients with newly diagnosed OPF aged over 50 were included. The diagnosis of OPF was based on the presence of fragility fractures without other metabolic bone disorders and, in some cases, a normal bone mineral density (BMD) T-score (25). In 2013, the International Osteoporosis Foundation (IOF) proposed a more concise definition of OPF: a fracture resulting from low-energy trauma during routine activities (for example, a fall from standing height) (26). OPFs are the greatest clinical risk associated with OP, and their diagnosis is based on the presence of this condition (27). OP, in turn, can be diagnosed because patients exhibit fragility fractures without other metabolic bone disorders, or if they exhibit a normal bone mineral density (T-score). OP can also be diagnosed in those patients with a T-score ≤ -2.5 even if fractures are absent (28). Patients were excluded from the present study if (1) they self-reported using urate-lowering medications (n=59), (2) exhibited comorbid infections or renal insufficiency (n=38), (3) were missing TyG index data (n=768), or (4) were missing SUA data (n=523). A schematic diagram of the patient selection process is presented in Figure 2. The study adheres to the principles of the Helsinki Declaration and was approved by the Ethics Committee of Kunshan Hospital at Jiangsu University (Approval No. 2021-06-016-K01). All patients provided written informed consent, and their identities were anonymized to ensure objectivity.
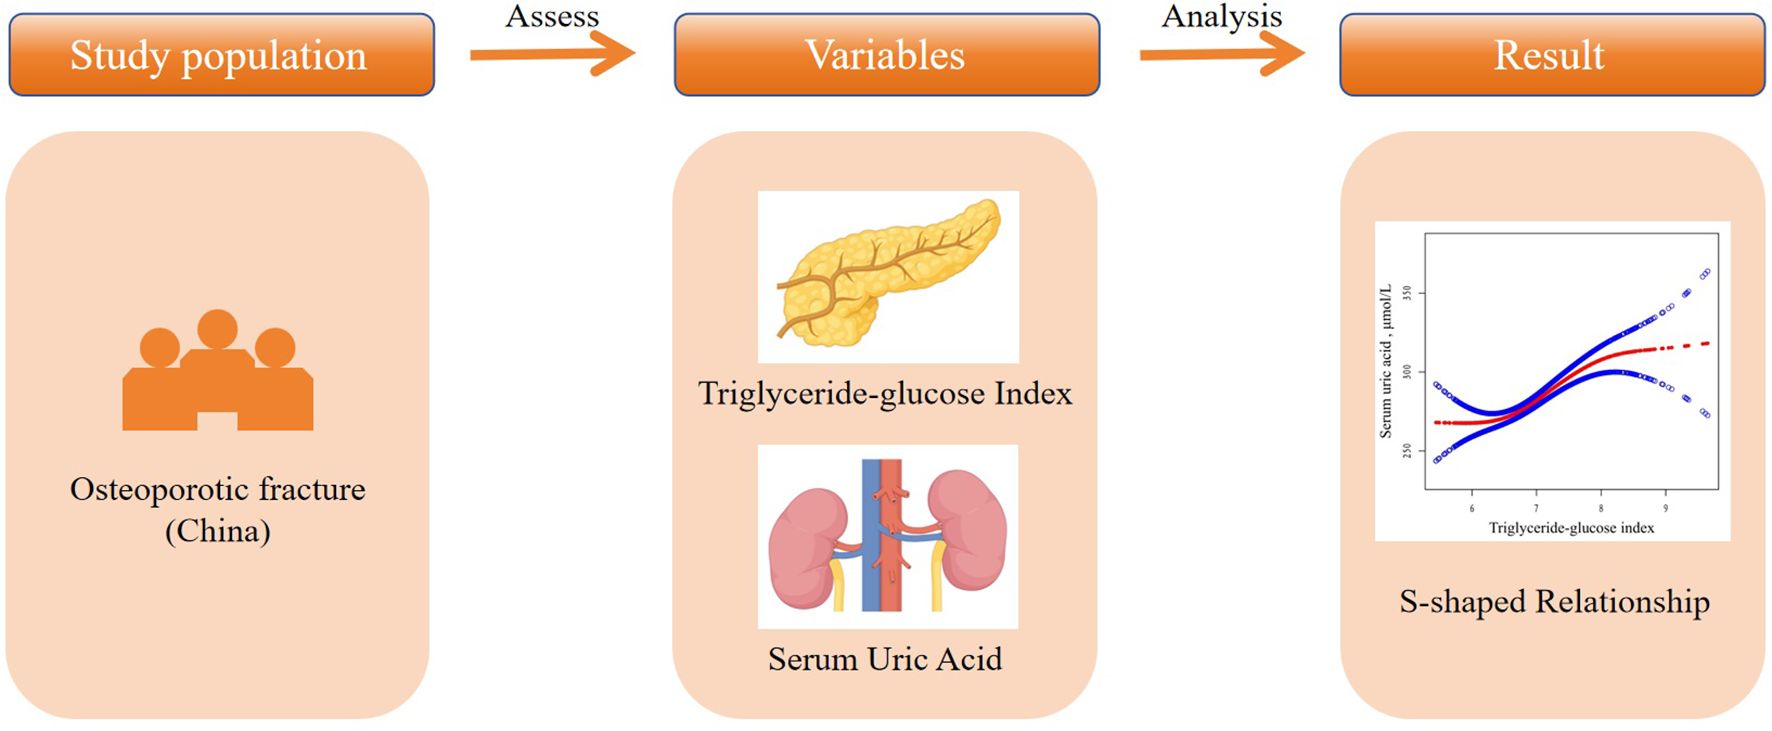
Figure 1. Graphical Abstract.
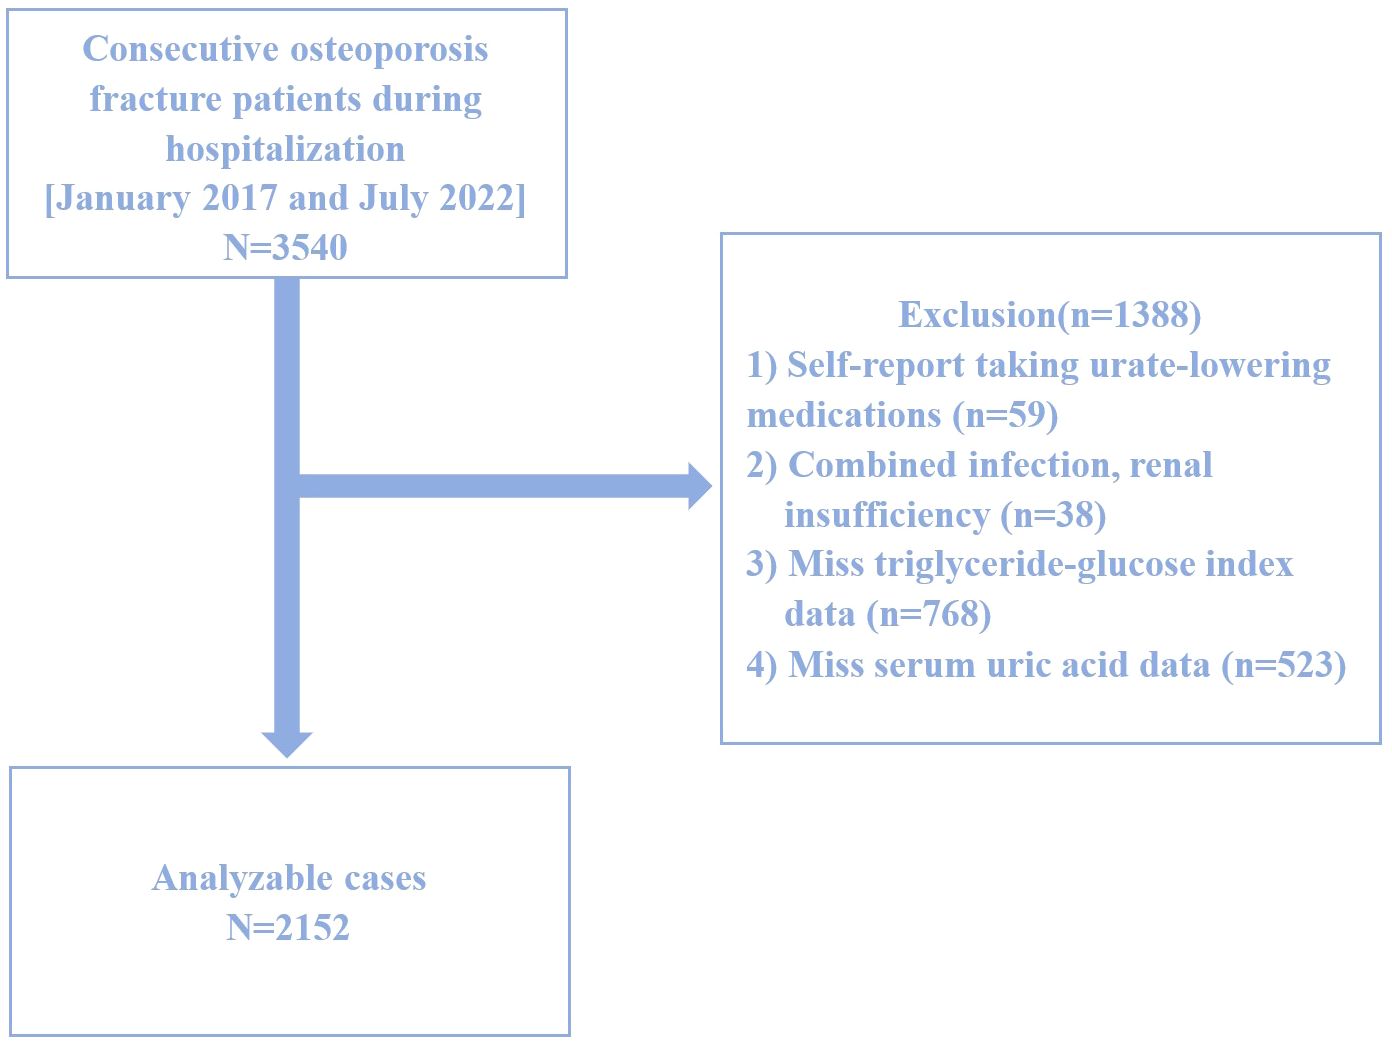
Figure 2. Study flow chart.
2.2 Dependent variables
Fasting blood samples were collected within 24 hours of admission by trained personnel using standardized procedures and the same equipment. The TyG index, the dependent variable, was calculated as Ln[fasting triglycerides (mg/dl) × fasting glucose (mg/dl)/2] (29). Fasting blood glucose levels were measured using the hexokinase method, while serum triglycerides were quantified through enzymatic assays.
2.3 Exposure variables
SUA levels, the exposure variable, were determined using an enzymatic colorimetric method performed between January 2017 and July 2022. Measurements were obtained using the Beckman AU5800 biochemical analyzer, operated by the same experienced personnel under standardized protocols. Quality control procedures were conducted daily before data collection.
2.4 Covariates
Potential covariates included age, gender, BMI (body mass index), Charlson comorbidity index (CCI), creatinine (Cr), hemoglobin, calcium, lymphocyte count, monocyte count, and parathyroid hormone (PTH) levels. All blood samples were collected after fasting.
2.5 Statistical analyses
Continuous and categorical variables are presented as means ± standard deviations (SDs), medians (Q1, Q3), or frequencies (%), as appropriate. Fisher’s exact test or Pearson’s chi-squared test was used for categorical variables, while t-tests and Mann–Whitney U tests were employed for continuous variables. Linear regression models were used to evaluate the association between TyG and SUA in hospitalized OPF patients.
Generalized estimating equations (GEE) were applied to examine the independent relationship between TyG and SUA, with adjustments for covariates. Three models were developed, including minimally and fully adjusted models. Initially, variance inflation factor (VIF) analyses were employed to detect covariance collinearity, and whether or not covariates were adjusted for was determined based on: (1) changes in matched odds ratios (ORs) ≥ 10% when adding the covariates to the unadjusted model or removing it from the fully adjusted model, and (2) covariates that met criterion 1 or exhibited a P < 0.1 in univariate analyses (30). The three established models using this approach included Model 1 (unadjusted), Model 2 (adjusted for age, gender, BMI, CCI, Cr), and Model 3 (further adjusted for hemoglobin, calcium, lymphocytes, monocytes, PTH).
Generalized additive models (GAMs) were employed to detect non-linear relationships, and two-piecewise linear regression models identified threshold effects. The inflection point was automatically calculated using a recursive maximum likelihood method (31). Subgroup analyses were performed to evaluate variations across patient subgroups, with the likelihood ratio test (LRT) assessing interactions and modifications.
All statistical analyses were conducted using EmpowerStats (www.empowerstats.com, X&Y Solutions, Inc., MA, USA) and R 3.6.3 (www.r-project.org). P < 0.05 was considered significant.
3 Results
3.1 Patients characteristics
The baseline data for 2,152 patients with OPFs hospitalized between January 2017 and July 2022 stratified into SUA quartiles are compiled in Table 1. This overall patient population (31.89% male, 68.11% female) exhibited a mean age of 69.20 ± 11.24 years, a mean SUA level of 284.84 ± 92.24 μmol/L, and a mean TyG of 6.92 ± 0.60. When patients were assessed following classification into TyG tertiles (< 6.62, 6.62–7.12, and > 7.12), their SUA, hemoglobin, calcium, lymphocyte, UN, HDL, LDL, and apolipoprotein B levels differed significantly. Notably, patients in higher TyG tertiles were more likely to present with elevated SUA levels (Low: 263.65 ± 80.35 μmol/L; Middle: 277.39 ± 86.51 μmol/L; High: 303.73 ± 100.59 μmol/L, P < 0.01).
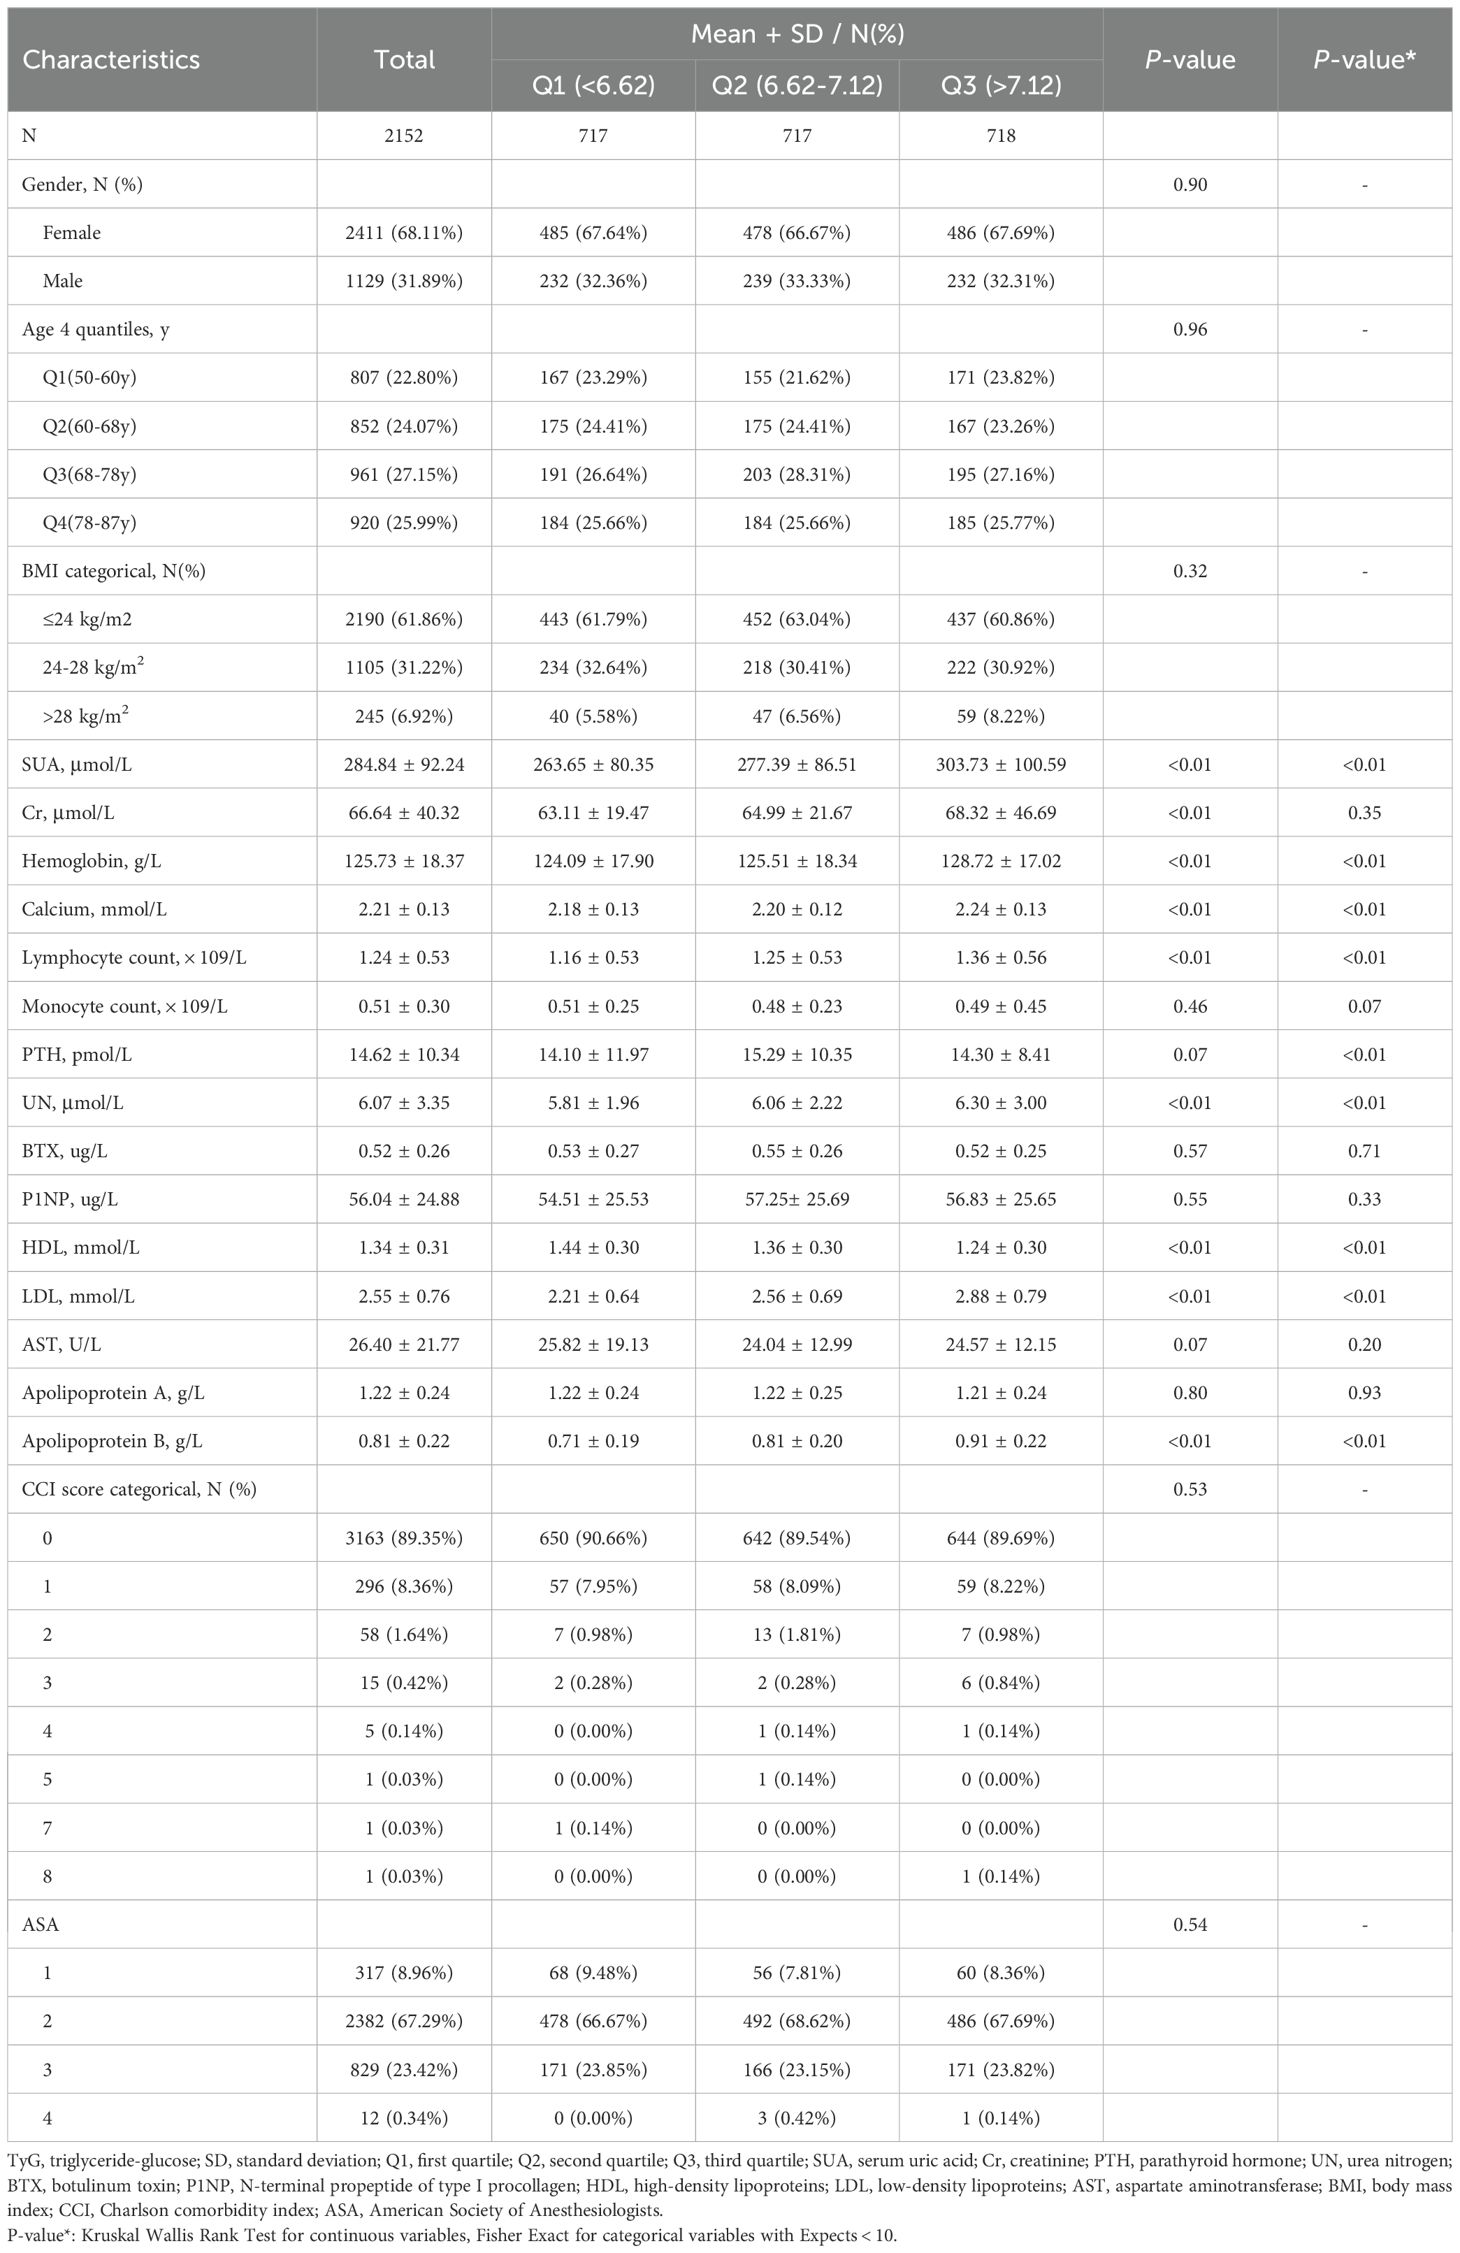
Table 1. Patient characteristics based on TyG quartiles.
3.2 Univariate analyses
Univariate analytical efforts revealed that SUA levels were associated with Cr, hemoglobin, calcium, monocyte, PTH, UN, BTX, P1NP, HDL, AST, apolipoprotein A, and apolipoprotein B levels (Table 2), but not with any other analyzed variables.
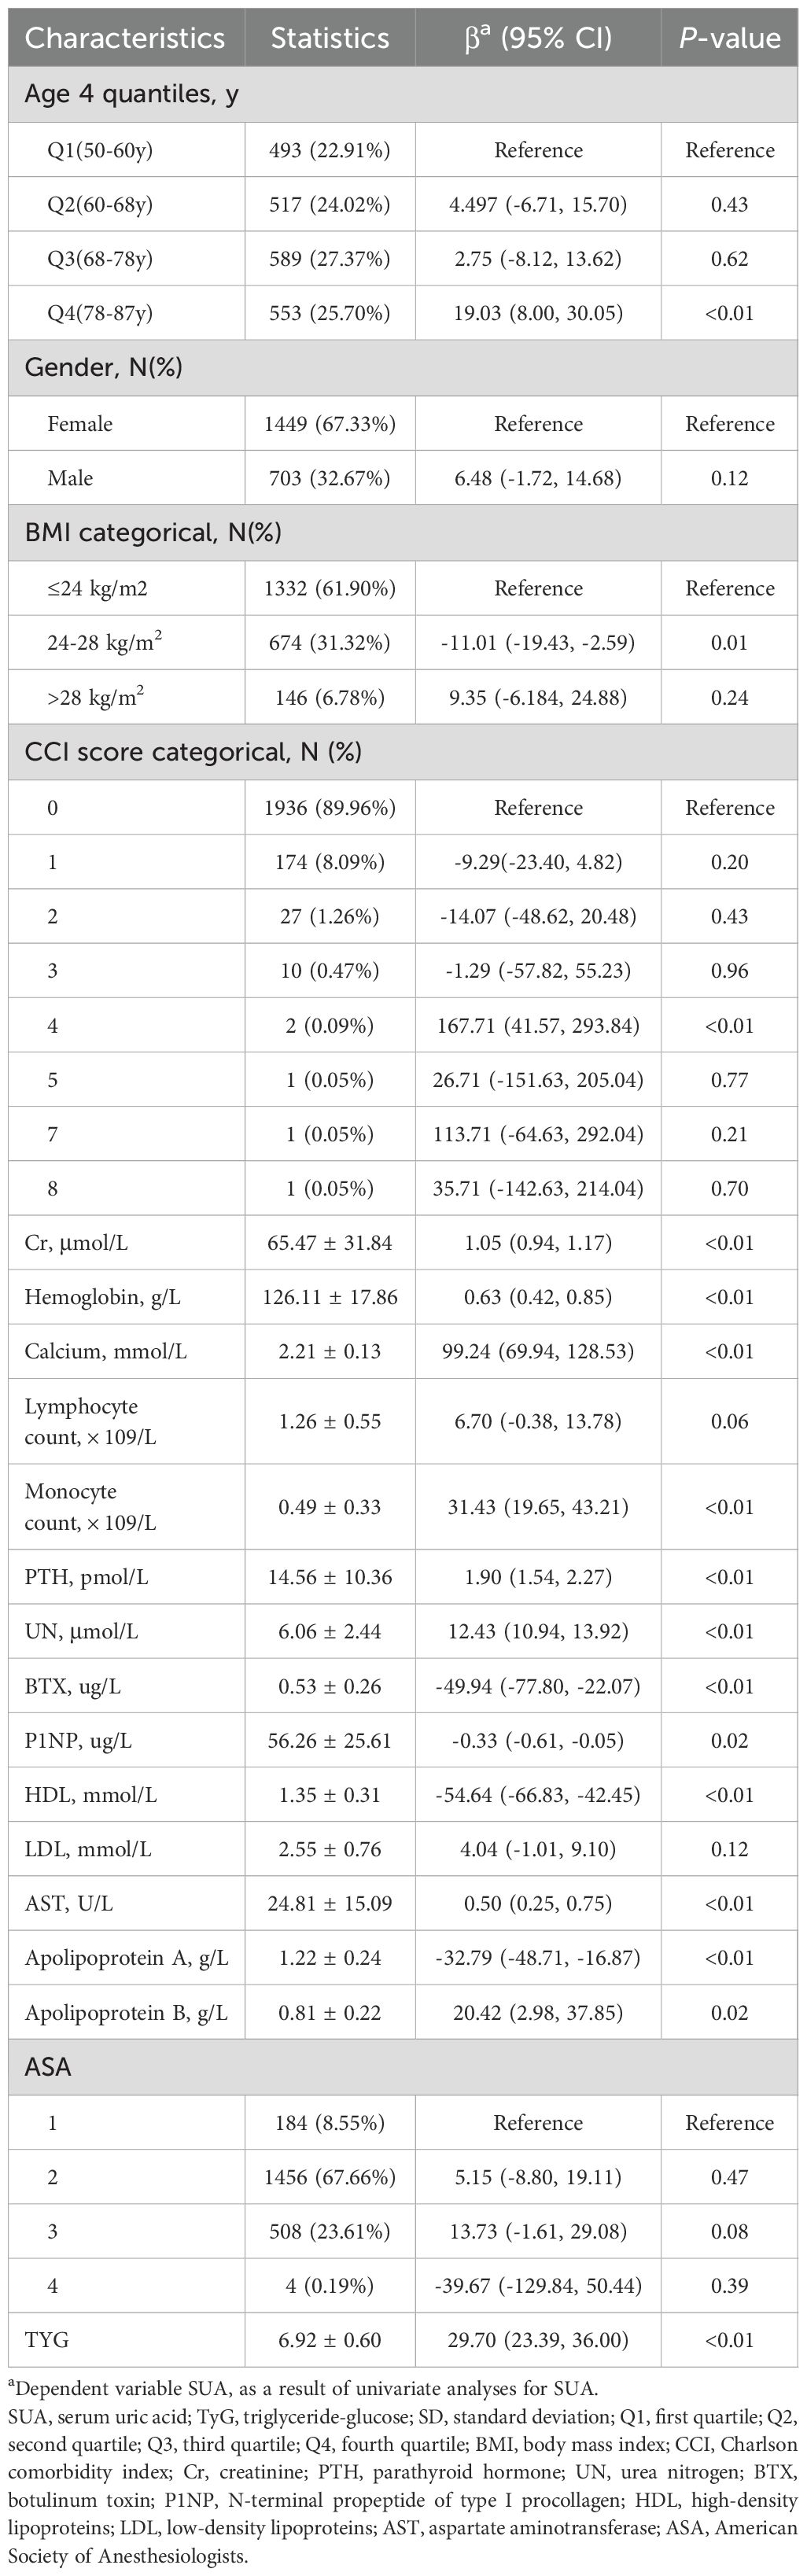
Table 2. Univariate analyses of factors associated with SUA levels.
3.3 Examining the relationship between TyG and SUA levels
The interplay between TyG and SUA levels among OPF patients was next explored through the development of three models (Table 3). In the unadjusted Model 1, a strong association was observed (β = 29.70, 95% CI: 23.39 to 36.00, P < 0.01). This association remained significant in Model 2, which was adjusted for age, gender, BMI, CCI, and Cr (β = 25.64, 95% CI: 19.75 to 31.53, P < 0.01). Similarly, in the fully adjusted Model 3, which included additional covariates such as hemoglobin, calcium, lymphocytes, monocytes, and PTH, a positive relationship persisted (β = 20.68, 95% CI: 14.75 to 26.60, P < 0.01).
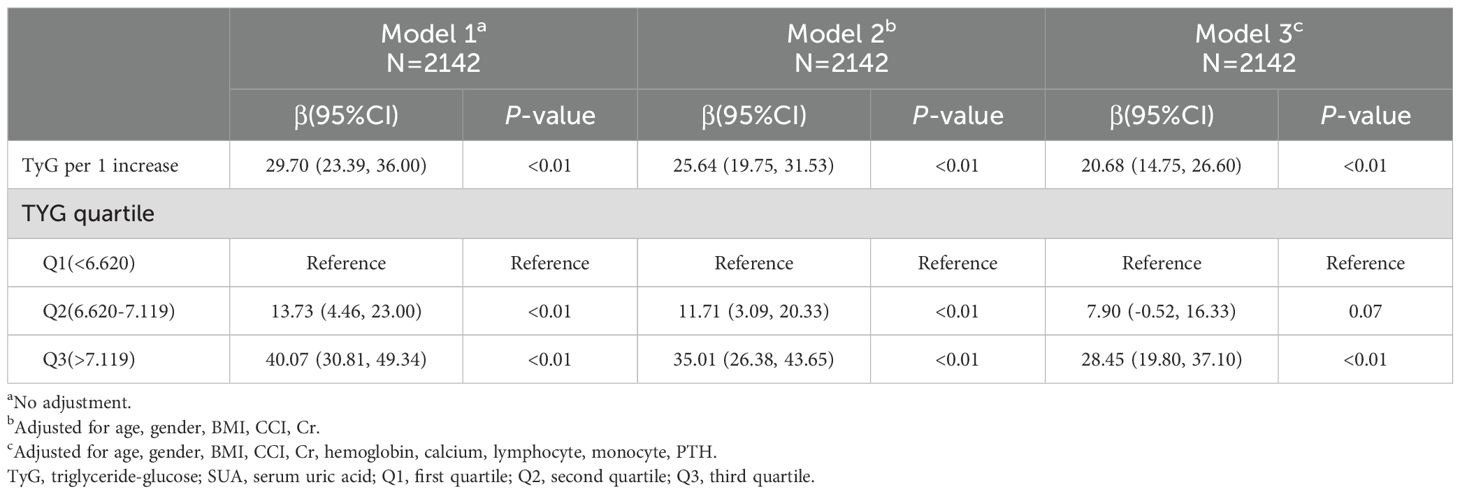
Table 3. Association between TyG and SUA levels in different models.
When patients were grouped into tertiles based on TyG levels, SUA levels were found to be significantly higher in the second and third tertiles compared to the first. Specifically, the average SUA levels in tertiles Q2 and Q3 were 7.90 and 28.45 units higher, respectively, in Model 3. This upward trend in SUA levels across TyG tertiles was consistent across all three models.
To ensure the robustness of Model 3, subgroup analyses were conducted by stratifying patients based on factors such as age, gender, BMI, CCI, Cr, hemoglobin, calcium, lymphocyte count, monocyte count, and PTH. The analyses, adjusted for the remaining covariates not used for stratification, revealed a consistent relationship between TyG and SUA levels across all subgroups without any significant interaction effects (all P > 0.05, Supplementary Table S1). Notably, the positive association between TyG and SUA was consistent across both male and female subgroups.
3.4 Spline smoothing and threshold analyses
A generalized additive model (GAM) was used to explore the potential nonlinear relationship between TyG and SUA levels. As shown in Figure 3, a clear nonlinear relationship was observed after adjusting for covariates (age, gender, BMI, CCI, Cr, hemoglobin, calcium, lymphocyte count, monocyte count, and PTH). To identify possible inflection points, a two-piecewise linear regression model was applied. This analysis revealed two inflection points for TyG at 6.34 and 8.09, respectively (P < 0.01 for the log-likelihood ratio). A significant positive association between TyG and SUA levels was observed within the range of 6.34 to 8.09 (β = 27.73, 95% CI: 18.72 to 36.75, P < 0.01). However, outside this range, the association was not significant, with β values of -11.30 (95% CI: -39.30 to 16.69, P = 0.43) for TyG < 6.34 and -34.10 (95% CI: -78.95 to 10.75, P = 0.14) for TyG > 8.09 (Table 4).
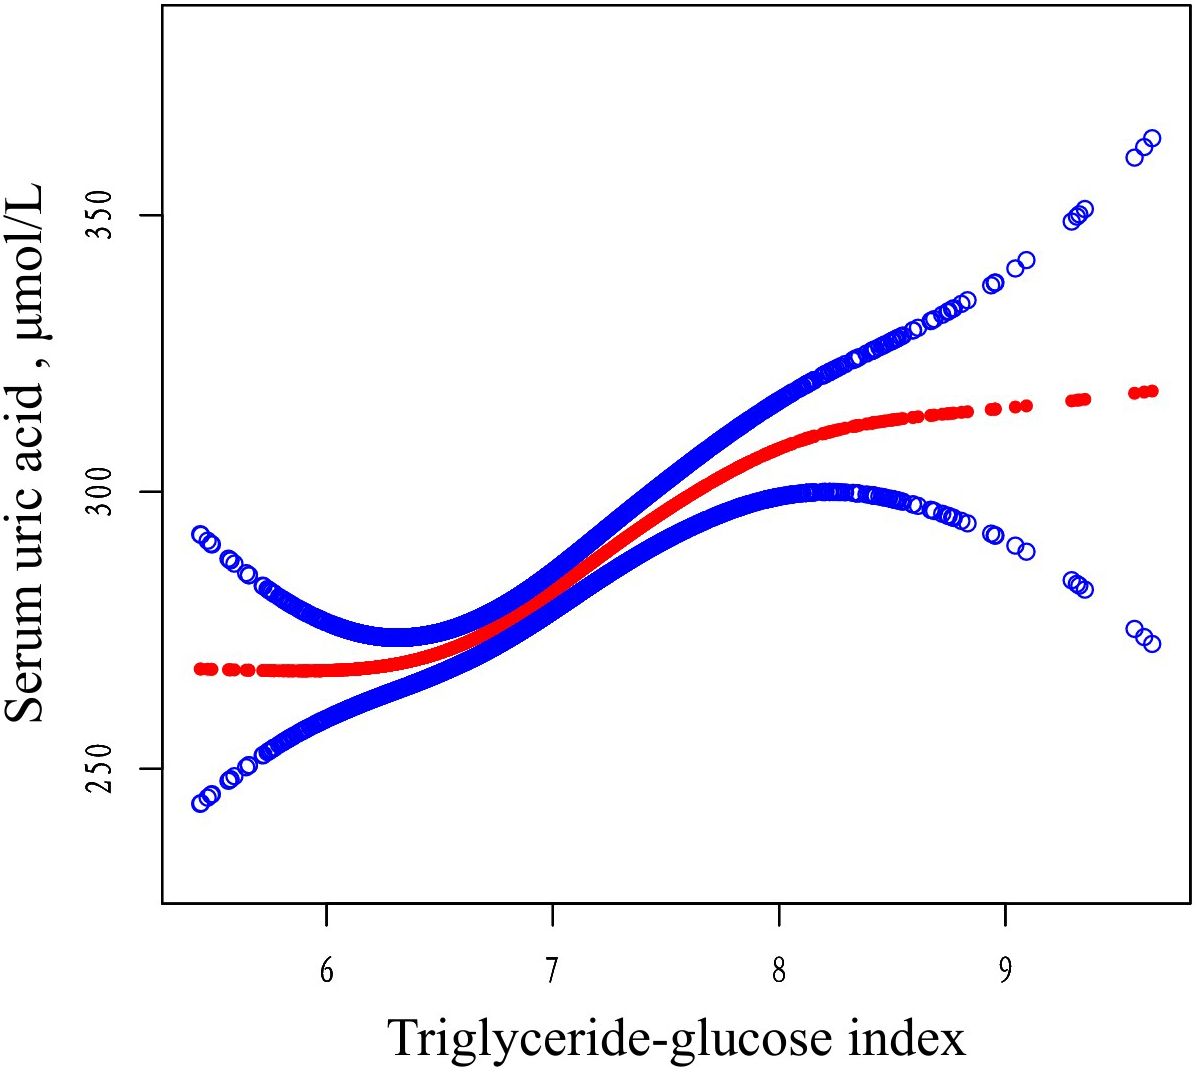
Figure 3. The relationship between TyG and SUA. Adjusted smoothed curves corresponding to the relationship between TyG and SUA. A generalized additive model revealed a thresholded non-linear relationship between TyG and SUA in OP patients. The upper and lower curves represent the range of the 95% confidence interval, and the middle curve represents the correlation between FAR and SIRI. Models were adjusted for age, gender, BMI, CCI, Cr, hemoglobin, calcium, lymphocyte, monocyte, PTH. The red curve in Model 3 exhibited two inflection points (K) at 6.34 and 8.09. TyG, triglyceride-glucose; SUA, serum uric acid; BMI, body mass index; CCI, Charlson comorbidity index; Cr, uric acid; PTH, parathyroid hormone.
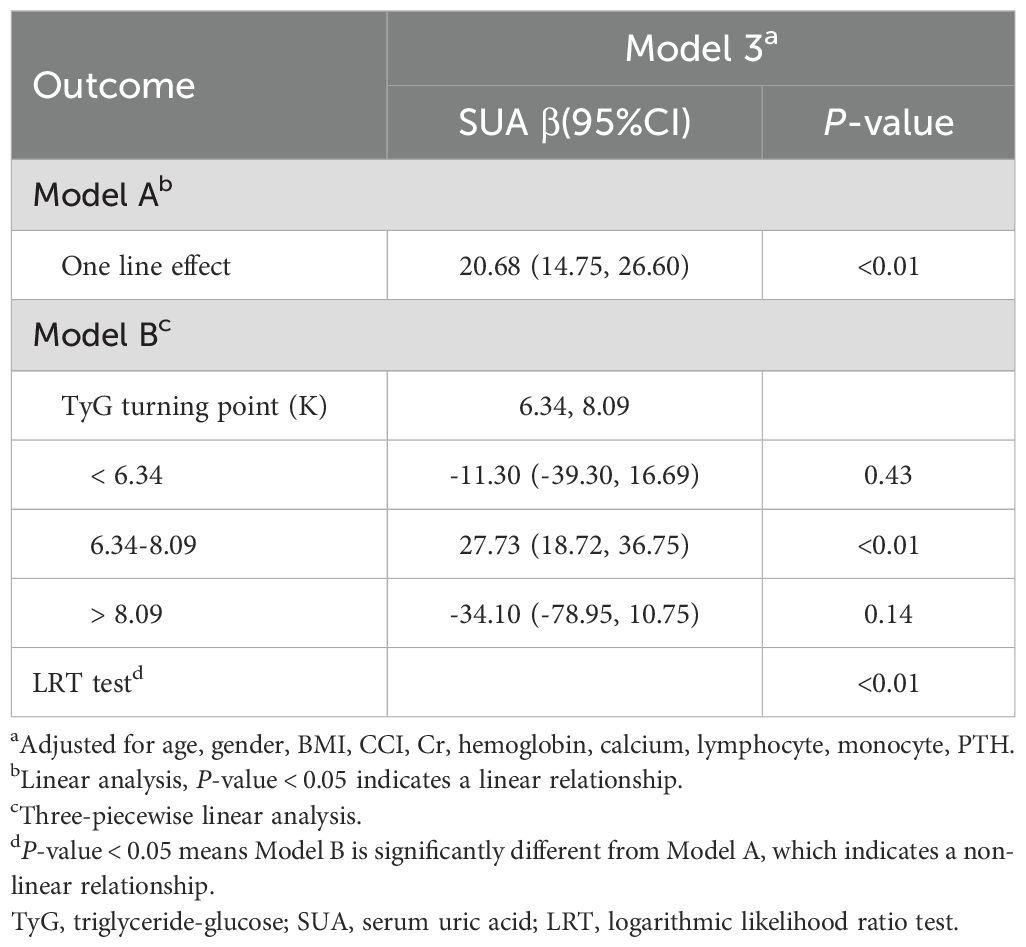
Table 4. Threshold effect analysis of the relationship between TyG and SUA levels using piece-wiselinear regression.
4 Discussion
This study identified an S-shaped association between TyG and SUA levels in a cross-sectional analysis of 2,152 hospitalized patients with OPF. Using a two-piecewise linear regression model, two inflection points were determined at 6.34 and 8.09. Within this range, a significant positive correlation was observed between TyG and SUA levels, with SUA levels remaining within normal physiological limits. These findings suggest that the TyG index may serve as a novel biomarker for evaluating the metabolic equilibrium of SUA levels.
Previous epidemiological studies have also examined the relationship between TyG and SUA levels, and the present results are consistent with these findings. For example, a study involving 1,700 children and adolescents with short stature in China recruited from the Affiliated Hospital of Jining Medical University in China between March 2013 and April 2021 reported a nonlinear association between TyG and SUA levels. A positive correlation was observed when SUA levels exceeded 6.55 mg/dL, while no significant association was found below this threshold (24). Similarly, another study involving 23,411 young adults (17–20 years old) in China recruited from Qingdao University from September 2017 to October 2019 found that lipid accumulation product (LAP), TyG, and their derivatives were strongly associated with SUA levels, suggesting their utility as sensitive indicators for predicting hyperuricemia (HUA) (14). While these past studies focused on younger populations, the present research extends these findings to an older population, particularly those over 50 years old with OPF.
Zhang et al. reported a positive association between TyG and hyperuricemia in a general health checkup/community population, focusing on linear association and predictive performance, but did not examine osteoporotic patients or test for nonlinear inflection points (32). Song et al. investigated the relationships between TyG and multiple metabolic indicators and conducted subgroup analyses; however, their analysis relied primarily on conventional multivariable linear/Logistic regression and did not systematically apply spline or piecewise regression to locate nonlinear breakpoints (33). Wang et al. emphasized the utility of TyG in metabolic syndrome and cardiovascular risk assessment but did not evaluate whether bone metabolic status modifies the TyG–SUA relationship (34). Hu et al. analyzed large cohorts and reported a robust positive association between TyG and metabolic abnormalities, discussing mechanisms such as insulin resistance, yet they did not provide empirical analyses of inflection points or bidirectional effects within specific subgroups (35).In contrast, the present study makes the following distinct contributions: it focuses on a clinical cohort of patients with osteoporosis; it employs smoothing splines and breakpoint detection to precisely characterize and quantify an S-shaped (nonlinear) TyG–SUA relationship; and it adjusts models for osteoporosis-related covariates while performing subgroup and sensitivity analyses. These methodological and population-specific differences support the interpretation that, within an osteoporotic population, bone metabolism, and interactions with uric acid handling may underlie the observed nonlinear association.Zhang et al.
Our analysis provides the first evidence of an S-shaped correlation between TyG and SUA in older adults with OPF. Although the association between the TyG index and SUA is well-supported by previous research, the underlying mechanisms remain unclear. The TyG index, calculated based upon fasting plasma glucose and triglyceride levels, is a reliable marker for metabolic syndrome and insulin resistance (IR) (36, 37). The link between TyG and SUA may be mediated by IR, as studies have shown that IR promotes the production of SUA through increased glycolysis intermediates which are transferred to 5-phosphoribose and phosphoric acid ribose pyrophosphate under IR conditions, triggering SUA production (38). High IR-related insulin levels also promote Na+-H+ exchange in the renal tubules, enhance the excretion of H+, and favor the reabsorption of UA (39), while renin-angiotensin system activity in response to hyperinsulinemia leads to a drop in blood flow in the kidneys, greater urate reabsorption, and xanthine oxidase production that contribute to higher levels of SUA output (40), McCormick et al. also demonstrated that it positively and causally affects SUA concentrations (41). Epidemiological efforts have also offered support for the link between IR and SUA, with the compensatory hyperinsulinemia following IR reducing the excretion of uric acid via renal tubular sodium reabsorption and thereby elevating levels of SUA (42–44). Conversely, higher levels of UA can promote IR through reduced nitric oxide bioavailability and greater oxidative stress in the mitochondria (45). These findings underscore the bidirectional relationship between SUA and IR and highlight the importance of monitoring IR status in elderly patients to manage SUA levels and prevent metabolic disorders, including osteoporosis.
The clinical implications of this study are significant, offering evidence-based recommendations for managing bone metabolic disorders in elderly patients. The TyG index provides a simple and cost-effective method for assessing SUA levels and identifying individuals at risk, particularly among populations with OPFs. The TyG, as a simple, cost−effective, and readily obtainable measure, can be used to assess SUA levels and to identify high−risk individuals—an application that is particularly relevant in populations at elevated risk of fracture. Kahaer et al. demonstrated a significant link between the TyG and HUA such that it could be leveraged to screen for HUA risk among the Chinese Xinjiang population (46). Moreover, da Silva et al. corroborated the linear association between the TyG and HUA among the general Chinese populace, underscoring the predictive value of this index (47). These past reports emphasize the value of analyzing the TyG when seeking to gauge HUA risk and prevent this condition. On this basis, the present study expands the evidence base and offers clinically meaningful insights in several respects. First, we focus on elderly patients with OP who are at elevated fracture risk—a vulnerable subgroup in whom metabolic dysregulation may exert disproportionately adverse effects on bone health, functional recovery, and survival outcomes. Second, by identifying an S−shaped association and quantifying threshold intervals, we propose that TyG values between 6.34 and 8.09 are associated with relatively normal SUA levels, whereas TyG values below or above this interval may indicate an increased risk of metabolic imbalance. These empirically derived cutoffs may assist clinicians in identifying patients who warrant closer biochemical surveillance or earlier metabolic intervention.For elderly patients already burdened by OP and fracture risk, maintaining SUA within the range identified in this study may contribute to improved overall health outcomes and could potentially reduce mortality risk associated with the concurrence of metabolic and skeletal disorders. From a clinical practice perspective, this implies intensified monitoring of TyG and SUA, optimization of glucose and lipid metabolic control, careful evaluation and adjustment of medications that affect SUA homeostasis, and targeted lifestyle or pharmacologic interventions tailored to this vulnerable population. Finally, these proposed thresholds and the elucidation of a nonlinear TyG–SUA relationship require prospective validation and may ultimately be incorporated into clinical risk−stratification tools to determine whether TyG−based interventions can improve bone−related outcomes and survival in older adults.
There are several key strengths to this study. For one, rigorous screening of the study population was performed, and three models adjusted for many covariates (age, gender, BMI, CCI, Cr, hemoglobin, calcium, lymphocytes, monocytes, and PTH) were used to probe the association between TyG and SUA levels. Generalized linear model and GAM approaches were also employed to respectively assess the linearity and non-linearity of this relationship. GAM approaches are well-suited to non-parametric smoothing to help fit regression splines to datasets, providing a more effective means of examining the interplay between average TyG and SUA levels.
There are also some limitations to the study. For one, although we observed an association between TyG and SUA, the retrospective cross−sectional design of the study precludes any inference of causality. In addition, certain covariates that were not measured or were insufficiently controlled in this study — for example, detailed dietary intake, alcohol consumption, smoking status, physical activity levels, inflammatory markers, and specific medications such as diuretics, statins, and bisphosphonates — may have influenced the analytical results, and residual confounding cannot be excluded. Future studies should collect more comprehensive information on lifestyle factors and medication use, and incorporate additional biochemical markers and repeated measurements to improve confounder control and to ensure the robustness and generalizability of the findings. Third, this study was conducted at a single center in China with a relatively small sample size; therefore, the extent to which our findings can be generalized to other ethnic groups and geographic populations remains uncertain. In addition, this study did not use an independent external validation cohort, so the observed associations require verification in other populations or regions to confirm their robustness and generalizability. Finally, these limitations together emphasize the importance of conducting additional multi−center, large−scale cohort studies and randomized controlled trials that recruit more diverse patient populations and examine additional biochemical indicators to ensure the reliability and external validity of the results.
5 Conclusions
In summary, this analysis of 2,152 hospitalized OPF patients revealed a marked S-shaped association between TyG and SUA levels, with this relationship being particularly significant in the TyG values ranging from 6.34 to 8.09. The TyG may thus be a valuable index for the assessment of SUA-related metabolic disturbances among elderly individuals.
Data availability statement
The original contributions presented in the study are included in the article/Supplementary Material. Further inquiries can be directed to the corresponding authors.
Ethics statement
The studies involving humans were approved by Affiliated Kunshan Hospital of Jiangsu University. The studies were conducted in accordance with the local legislation and institutional requirements. The participants provided their written informed consent to participate in this study.
Author contributions
XZ: Conceptualization, Data curation, Formal analysis, Investigation, Methodology, Project administration, Resources, Software, Supervision, Validation, Visualization, Writing – original draft, Writing – review & editing. MX: Methodology, Software, Writing – original draft. YG: Data curation, Formal analysis, Validation, Writing – original draft. JJ: Investigation, Resources, Supervision, Validation, Writing – original draft. KL: Investigation, Methodology, Project administration, Resources, Software, Supervision, Visualization, Writing – original draft, Writing – review & editing. CL: Conceptualization, Data curation, Funding acquisition, Investigation, Methodology, Project administration, Resources, Supervision, Validation, Visualization, Writing – original draft, Writing – review & editing.
Funding
The author(s) declare financial support was received for the research and/or publication of this article. The study was supported by Suzhou City Major Disease Multicenter Clinical Research Project (CN) (DZXYJ202312), Special Funding for Jiangsu Province Science and Technology Plan (Key Research and Development Program for Social Development) (CN) (BE2023738), Medical Education Collaborative Innovation Fund of Jiangsu University (JDY2022013), Key Laboratory Project in Suzhou City (SZS2024018) and Gusu Health Talent Plan Scientific Research Project (CN) (GSWS2022105).
Conflict of interest
The authors declare that the research was conducted in the absence of any commercial or financial relationships that could be construed as a potential conflict of interest.
Generative AI statement
The author(s) declare that no Generative AI was used in the creation of this manuscript.
Any alternative text (alt text) provided alongside figures in this article has been generated by Frontiers with the support of artificial intelligence and reasonable efforts have been made to ensure accuracy, including review by the authors wherever possible. If you identify any issues, please contact us.
Publisher’s note
All claims expressed in this article are solely those of the authors and do not necessarily represent those of their affiliated organizations, or those of the publisher, the editors and the reviewers. Any product that may be evaluated in this article, or claim that may be made by its manufacturer, is not guaranteed or endorsed by the publisher.
Supplementary material
The Supplementary Material for this article can be found online at: https://www.frontiersin.org/articles/10.3389/fendo.2025.1639818/full#supplementary-material
References
1. Liu W, Chen W, Hu M, Wang G, Hu Y, He Q, et al. Bioinformatics analysis combined with molecular dynamics simulation validation to elucidate the potential molecular mechanisms of Jianshen Decoction for treatment of osteoporotic fracture. MEDICINE. (2023) 102:e33610. doi: 10.1097/MD.0000000000033610
2. Cummings SR and Melton LJ. Epidemiology and outcomes of osteoporotic fractures. LANCET. (2002) 359:1761. doi: 10.1016/S0140-6736(02)08657-9
3. Fraser LA, Ioannidis G, Adachi JD, Pickard L, Kaiser SM, Prior J, et al. Fragility fractures and the osteoporosis care gap in women: the Canadian Multicentre Osteoporosis Study. OSTEOPOROSIS Int. (2011) 22:789. doi: 10.1007/s00198-010-1359-2
4. Johnston CB and Dagar M. Osteoporosis in older adults. Med Clin N Am. (2020) 104:873. doi: 10.1016/j.mcna.2020.06.004
5. Sun W, Xing Y, Zhou F, Ma Y, Wan X, Ma H, et al. Association analysis of triglyceride glucose-body mass index and bone turnover markers in patients with type 2 diabetes mellitus. Diabetes Metab SYND OB. (2023) 16:1435. doi: 10.2147/DMSO.S406849
6. Yang Y, Huang X, Wang Y, Leng L, Xu J, Feng L, et al. The impact of triglyceride-glucose index on ischemic stroke: a systematic review and meta-analysis. Cardiovasc Diabetol. (2023) 22:2. doi: 10.1186/s12933-022-01732-0
7. Li M, Zhan A, Huang X, Hu L, Zhou W, Wang T, et al. Positive association between triglyceride glucose index and arterial stiffness in hypertensive patients: the China H-type Hypertension Registry Study. Cardiovasc Diabetol. (2020) 19:139. doi: 10.1186/s12933-020-01124-2
8. Wang X, Xu W, Song Q, Zhao Z, Meng X, Xia C, et al. Association between the triglyceride-glucose index and severity of coronary artery disease. Cardiovasc Diabetol. (2022) 21:168. doi: 10.1186/s12933-022-01606-5
9. Xu J, Xu W, Chen G, Hu Q, and Jiang J. Association of TyG index with prehypertension or hypertension: a retrospective study in Japanese normoglycemia subjects. Front Endocrinol. (2023) 14:1288693. doi: 10.3389/fendo.2023.1288693
10. Tutunchi H, Naeini F, Mobasseri M, and Ostadrahimi A. Triglyceride glucose (TyG) index and the progression of liver fibrosis: A cross-sectional study. Clin Nutr ESPEN. (2021) 44:483. doi: 10.1016/j.clnesp.2021.04.025
11. Qin Z, Zhao J, Geng J, Chang K, Liao R, Su B, et al. Higher triglyceride-glucose index is associated with increased likelihood of kidney stones. Front Endocrinol. (2021) 12:774567. doi: 10.3389/fendo.2021.774567
12. Yu W, Xie D, Yamamoto T, Koyama H, and Cheng J. Mechanistic insights of soluble uric acid-induced insulin resistance: Insulin signaling and beyond. Rev Endocr Metab Dis. (2023) 24:327. doi: 10.1007/s11154-023-09787-4
13. Karava V, Dotis J, Kondou A, Christoforidis A, Liakopoulos V, Tsioni K, et al. Association between relative fat mass, uric acid, and insulin resistance in children with chronic kidney disease. Pediatr Nephrol. (2021) 36:425. doi: 10.1007/s00467-020-04716-y
14. Zhou S, Yu Y, Zhang Z, Ma L, Wang C, Yang M, et al. Association of obesity, triglyceride-glucose and its derivatives index with risk of hyperuricemia among college students in Qingdao, China. Front Endocrinol. (2022) 13:1001844. doi: 10.3389/fendo.2022.1001844
15. Mandal AK and Mount DB. The molecular physiology of uric acid homeostasis. Annu Rev Physiol. (2015) 77:323. doi: 10.1146/annurev-physiol-021113-170343
16. Mijailovic NR, Vesic K, and Borovcanin MM. The influence of serum uric acid on the brain and cognitive dysfunction. Front Psychiatry. (2022) 13:828476. doi: 10.3389/fpsyt.2022.828476
17. Oda M, Satta Y, Takenaka O, and Takahata N. Loss of urate oxidase activity in hominoids and its evolutionary implications. Mol Biol Evol. (2002) 19:640. doi: 10.1093/oxfordjournals.molbev.a004123
18. Borghi C, Rosei EA, Bardin T, Dawson J, Dominiczak A, Kielstein JT, et al. Serum uric acid and the risk of cardiovascular and renal disease. J Hypertens. (2015) 33:1729, 1741. doi: 10.1097/HJH.0000000000000701
19. Bjornstad P, Laffel L, Lynch J, El Ghormli L, Weinstock RS, Tollefsen SE, et al. Elevated serum uric acid is associated with greater risk for hypertension and diabetic kidney diseases in obese adolescents with type 2 diabetes: an observational analysis from the treatment options for type 2 diabetes in adolescents and youth (TODAY) study. Diabetes Care. (2019) 42:1120. doi: 10.2337/dc18-2147
20. Cao X, Wu L, and Chen Z. The association between elevated serum uric acid level and an increased risk of renal function decline in a health checkup cohort in China. Int UROL Nephrol. (2018) 50:517. doi: 10.1007/s11255-017-1732-6
21. Liu C, Liu W, Zhang G, Wang Y, Jiang J, Yang Z, et al. Conjunctional relationship between serum uric acid and serum nickel with non-alcoholic fatty liver disease in men: A cross-sectional study. Int J Env Res PUB HE. (2022) 19:11. doi: 10.3390/ijerph19116424
22. Krishnan E, Pandya BJ, Chung L, Hariri A, and Dabbous O. Hyperuricemia in young adults and risk of insulin resistance, prediabetes, and diabetes: a 15-year follow-up study. Am J Epidemiol. (2012) 176:108. doi: 10.1093/aje/kws002
23. Si Z, Zhou S, Shen Z, and Luan F. High-Throughput metabolomics discovers metabolic biomarkers and pathways to evaluating the efficacy and exploring potential mechanisms of osthole against osteoporosis based on UPLC/Q-TOF-MS coupled with multivariate data analysis. Front Pharmacol. (2020) 11:741. doi: 10.3389/fphar.2020.00741
24. Zhao Q, Zhang M, Chu Y, and Ban B. Association between serum uric acid and triglyceride-glucose index in children and adolescents with short stature. Sci REP-UK. (2023) 13:13594. doi: 10.1038/s41598-023-40972-2
25. Amin S, Achenbach SJ, Atkinson EJ, Khosla S, and Melton LR. Trends in fracture incidence: a population-based study over 20 years. J Bone MINER Res. (2014) 29:581. doi: 10.1002/jbmr.2072
26. Kanis JA, McCloskey EV, Johansson H, Cooper C, Rizzoli R, Reginster JY, et al. European guidance for the diagnosis and management of osteoporosis in postmenopausal women. OSTEOPOROSIS Int. (2013) 24:23. doi: 10.1007/s00198-012-2074-y
27. Liu C, Zhang W, Gao M, Yang K, Tan L, Zhao W, et al. A degradable and osteogenic mg-based MAO-MT-PLGA drug/ion delivery system for treating an osteoporotic fracture. PHARMACEUTICS 14:7. (2022). doi: 10.3390/pharmaceutics14071481
28. Camacho PM, Petak SM, Binkley N, Diab DL, Eldeiry LS, Farooki A, et al. American association of clinical endocrinologists/American college of endocrinology clinical practice guidelines for the diagnosis and treatment of postmenopausal osteoporosis-2020 update. Endocr Pract. (2020) 26:1. doi: 10.4158/GL-2020-0524SUPPL
29. Liu CF and Chien LW. Triglyceride glucose index and poor sleep patterns in non-diabetic adults: Evidence from NHANES 2005-2016. Front Nutr. (2023) 10:1051667. doi: 10.3389/fnut.2023.1051667
30. Kernan WN, Viscoli CM, Brass LM, Broderick JP, Brott T, Feldmann E, et al. Phenylpropanolamine and the risk of hemorrhagic stroke. New Engl J Med. (2000) 343:1826. doi: 10.1056/NEJM200012213432501
31. Liu S, Wang X, Lu Y, Li T, Gong Z, Sheng T, et al. The effects of intraoperative cryoprecipitate transfusion on acute renal failure following orthotropic liver transplantation. Hepatol Int. (2013) 7:901. doi: 10.1007/s12072-013-9457-9
32. Zhang R, Lin R, Zhang H, Lan J, Li S, Ye S, et al. Association between TyG-BMI and gout in US adults: evidence from NHANES 2007-2018. Sci REP-UK. (2025) 15:15534. doi: 10.1038/s41598-025-99379-w
33. Chang Y, Park JY, and Song TJ. Association between the triglyceride/high-density lipoprotein (TG/HDL) ratio and incidence of gout: A nationwide cohort study. Front Endocrinol. (2024) 15:1453458. doi: 10.3389/fendo.2024.1453458
34. Dai Y, Zhang Y, Wang B, Cao L, and Wang Z. The association between triglyceride glucose index and gout: a cross-sectional analysis based on NHANES 2007-2018. BMC Endocr Disord. (2024) 24:218. doi: 10.1186/s12902-024-01747-6
35. Li T, Zhang H, Wu Q, Guo S, and Hu W. Association between triglyceride glycemic index and gout in US adults. J Health POPUL Nutr. (2024) 43:115. doi: 10.1186/s41043-024-00613-4
36. Li R, Li Q, Cui M, Yin Z, Li L, Zhong T, et al. Clinical surrogate markers for predicting metabolic syndrome in middle-aged and elderly Chinese. J Diabetes Invest. (2018) 9:411. doi: 10.1111/jdi.12708
37. Mohd NN, Lee S, Bacha F, Tfayli H, and Arslanian S. Triglyceride glucose index as a surrogate measure of insulin sensitivity in obese adolescents with normoglycemia, prediabetes, and type 2 diabetes mellitus: comparison with the hyperinsulinemic-euglycemic clamp. Pediatr Diabetes. (2016) 17:458. doi: 10.1111/pedi.12303
38. Leyva F, Wingrove CS, Godsland IF, and Stevenson JC. The glycolytic pathway to coronary heart disease: a hypothesis. METABOLISM. (1998) 47:657. doi: 10.1016/S0026-0495(98)90026-9
39. Yu C, Wang T, Zhou W, Zhu L, Huang X, Bao H, et al. Positive association between the triglyceride-glucose index and hyperuricemia in Chinese adults with hypertension: an insight from the China H-type hypertension registry study. Int J Endocrinol. (2022) 2022:4272715. doi: 10.1155/2022/4272715
40. Katsiki N, Dimitriadis GD, and Mikhailidis DP. Serum uric acid and diabetes: from pathophysiology to cardiovascular disease. Curr Pharm DESIGN. (2021) 27:1941. doi: 10.2174/1381612827666210104124320
41. McCormick N, O'Connor MJ, Yokose C, Merriman TR, Mount DB, Leong A, et al. Assessing the causal relationships between insulin resistance and hyperuricemia and gout using bidirectional Mendelian randomization. Arthritis RHEUMATOL. (2021) 73:2096. doi: 10.1002/art.41779
42. Zong J, Sun Y, Zhang Y, Yuan J, Wang X, Zhang R, et al. Correlation between serum uric acid level and central body fat distribution in patients with type 2 diabetes. Diabetes Metab SYND OB. (2020) 13:2521. doi: 10.2147/DMSO.S260891
43. Facchini F, Chen YD, Hollenbeck CB, and Reaven GM. Relationship between resistance to insulin-mediated glucose uptake, urinary uric acid clearance, and plasma uric acid concentration. JAMA-J Am Med Assoc. (1991) 266:3008. doi: 10.1001/jama.1991.03470210076036
44. Adachi SI, Yoshizawa F, and Yagasaki K. Hyperuricemia in type 2 diabetic model KK-A(y)/Ta mice: a potent animal model with positive correlation between insulin resistance and plasma high uric acid levels. BMC Res Notes. (2017) 10:577. doi: 10.1186/s13104-017-2897-x
45. Lanaspa MA, Sanchez-Lozada LG, Choi YJ, Cicerchi C, Kanbay M, Roncal-Jimenez CA, et al. Uric acid induces hepatic steatosis by generation of mitochondrial oxidative stress: potential role in fructose-dependent and -independent fatty liver. J Biol Chem. (2012) 287:40732. doi: 10.1074/jbc.M112.399899
46. Kahaer M, Zhang B, Chen W, Liang M, He Y, Chen M, et al. Triglyceride glucose index is more closely related to hyperuricemia than obesity indices in the medical checkup population in Xinjiang, China. Front Endocrinol. (2022) 13:861760. doi: 10.3389/fendo.2022.861760
Keywords: osteoporosis, osteoporotic fracture, serum uric acid, triglyceride-glucose index, older people
Citation: Zhou X-j, Xu M-z, Gong Y-q, Jin J, Lu K and Li C (2025) Exploring the S-shaped relationship between triglyceride-glucose index and serum uric acid levels in individuals with osteoporotic fracture. Front. Endocrinol. 16:1639818. doi: 10.3389/fendo.2025.1639818
Received: 02 June 2025; Accepted: 06 October 2025;
Published: 24 October 2025.
Edited by:
Kamyar Asadipooya, University of Kentucky, United StatesReviewed by:
Karem Salem, Fayoum University, EgyptJoaquim Barreto, State University of Campinas, Brazil
Copyright © 2025 Zhou, Xu, Gong, Jin, Lu and Li. This is an open-access article distributed under the terms of the Creative Commons Attribution License (CC BY). The use, distribution or reproduction in other forums is permitted, provided the original author(s) and the copyright owner(s) are credited and that the original publication in this journal is cited, in accordance with accepted academic practice. No use, distribution or reproduction is permitted which does not comply with these terms.
*Correspondence: Ke Lu, c2d1ODQzNEBzaW5hLmNvbQ==; Chong Li, bGljaG9uZzE3MDVAMTYzLmNvbQ==
†ORCID: Xiao-jie Zhou, orcid.org/0009-0007-1069-6186
Min-zhe Xu, orcid.org/0000-0002-7094-2189
Ya-qin Gong, orcid.org/0000-0001-8695-4048
Jian Jin, orcid.org/0009-0009-4300-884X
Ke Lu, orcid.org/0000-0002-0029-7874
Chong Li, orcid.org/0000-0002-1526-221X