 Zilang Luo
 Damao Pi1†
 Wenli Jiang
 Jiadan Yang
- 1Department of Pharmacy, The First Affiliated Hospital of Chongqing Medical University, Chongqing, China
- 2College of Pharmacy, Chongqing Medical University, Chongqing, China
Objective: Diabetic cardiomyopathy (DCM) is a myocardial dysfunction disorder driven by diabetes-associated metabolic disorders, significantly elevating the risk of heart failure in patients with type 2 diabetes mellitus (T2DM). We aimed to develop and validate a nomogram for individualized DCM risk prediction in T2DM populations.
Methods: This retrospective study enrolled 525 consecutive T2DM patients admitted to our hospital (June 2022-June 2024). Participants were randomly allocated to training (70%) or validation (30%) cohorts. Baseline clinical characteristics, laboratory profiles, and echocardiographic parameters were collected. Predictors were identified via univariate then multivariate logistic regression, followed by nomogram construction. Model validation included: (1) internal validation via 1000 bootstrap resamples; (2) discrimination assessed by the area under the receiver operating characteristic curve (AUC-ROC); (3) calibration evaluated using calibration plots and the Hosmer-Lemeshow goodness-of-fit test; (4) clinical utility determined by decision curve analysis (DCA) and clinical impact curves (CIC).
Results: Six independent predictors—age, duration of type 2 diabetes mellitus (T2DM Duration), systolic blood pressure (SBP), urinary albumin-to-creatinine ratio (UACR), left atrial diameter (LAD), and left ventricular posterior wall thickness at end-diastole (LVPWd)—were incorporated. The model showed excellent discrimination: AUC 0.947 (95% CI: 0.916-0.967) in training and 0.922 (95% CI: 0.870-0.956) in validation cohorts. Calibration indicated strong agreement (Hosmer-Lemeshow χ² = 9.2119, P = 0.3247). DCA and CIC confirmed clinical utility.
Conclusions: This nomogram integrates routine clinical/echocardiographic parameters to predict DCM risk in T2DM patients, facilitating individualized risk stratification and guiding early cardioprotective interventions in high-risk populations.
Clinical Trial Registration: https://www.chictr.org.cn/index.html, identifier ChiCTR2400093755.
Introduction
Type 2 diabetes mellitus (T2DM) represents a global health crisis, with its prevalence and incidence exhibiting persistent upward trends. According to projections by the International Diabetes Federation (IDF), the global population with T2DM is anticipated to reach 700 million by 2045 (1). Beyond conventional micro- and macrovascular complications, T2DM directly contributes to myocardial pathology through diabetic cardiomyopathy (DCM)—a distinct entity characterized by diabetes-associated metabolic derangements that induce structural and functional cardiac alterations independent of coronary artery disease, valvular abnormalities, congenital heart defects, or other established etiologies of heart failure (HF) (2, 3). Epidemiological studies have demonstrated that cardiovascular mortality quadruples in diabetic populations compared to non-diabetic individuals (4), with DCM prevalence ranging from 10% to 21% among individuals with diabetes and associated mortality rates reaching 31% (5).
The pathogenesis of DCM is principally driven by metabolic dysregulation of carbohydrate and lipid homeostasis, triggering a cascade of pathophysiological events including oxidative stress generation, chronic inflammatory responses, endothelial dysfunction, and mitochondrial impairment (6, 7). These interconnected mechanisms collectively promote key pathological processes: cardiomyocyte hypertrophy, interstitial fibrosis, programmed cell death, coronary endothelial injury, and microvascular dysfunction (8, 9). Clinically, DCM manifests initially as elevated left ventricular filling pressures and diastolic dysfunction (10), progressing through stages of worsening diastolic impairment and eventual systolic failure, culminating in overt HF (11). Notably, asymptomatic left ventricular diastolic dysfunction frequently precedes symptomatic HF in T2DM patients, representing the earliest detectable functional manifestation of DCM (12). This insidious progression underscores the critical need for early detection and intervention to alleviate the escalating global burden of HF (13, 14).
Current diagnostic challenges persist due to the lack of disease-specific biomarkers, while advanced imaging modalities such as cardiac magnetic resonance imaging (CMR) remain cost-prohibitive for routine clinical implementation (15). Although prior studies have attempted to develop predictive models for DCM in T2DM patients, Existing tools exhibit certain limitations. First, certain models were derived from limited cohorts (e.g., one nomogram study with n = 84 cases), potentially compromising statistical power and increasing risks of overfitting or reduced generalizability (16). Second, some prediction frameworks rely exclusively on basic clinical characteristics (e.g., age, body mass index) and laboratory parameters (e.g., lipids, electrolytes), omitting cardiac structural/functional metrics essential for capturing DCM pathophysiology (17). To address these gaps, we developed and validated a clinical nomogram integrating routinely accessible clinical and echocardiographic parameters for DCM risk prediction in T2DM patients. This tool aims to enable early risk stratification, facilitating timely preventive strategies and targeted interventions to mitigate DCM-associated morbidity in high-risk populations.
Methods
Study design and participants
This study utilized electronic medical records from the Endocrinology Department of the First Affiliated Hospital of Chongqing Medical University (Chongqing, China). We consecutively screened patients admitted between June 2022 and June 2024, ultimately enrolling 525 eligible individuals with T2DM. Eligible participants were randomly allocated (7:3 ratio) to training (n = 367) and validation (n = 158) cohorts using computer-generated random numbers.
Inclusion and exclusion criteria
The inclusion criteria included (1): Age ≥18 years (2); Diagnosis of T2DM is established based on the American Diabetes Association (ADA) criteria (18): Hemoglobin A1c (HbA1c) ≥6.5% or fasting plasma glucose ≥7.0 mmol/L or 2-Hour plasma glucose during oral glucose tolerance test (OGTT) ≥11.1 mmol/L or random plasma glucose ≥11.1 mmol/L; (3) Complete echocardiographic evaluation.
The exclusion criteria included: (1) Established cardiovascular pathology: (a) HF, established diagnosis or typical heart failure symptoms and signs (NYHA class II-IV symptoms) who were on long-term anti-HF medications; (b) hypertensive heart disease, documented history or uncontrolled severe hypertension; (c) coronary artery disease, known history of coronary artery disease, myocardial infarction, or coronary angiography demonstrating ≥50% luminal stenosis; (d) significant valvular disease, moderate-to-severe valvular stenosis/regurgitation confirmed by echocardiography; (e) congenital heart defects, clinically significant congenital heart disease verified by medical history or echocardiography. (2) Comorbid conditions: active malignancies, systemic infections (CRP >10 mg/L), hepatic insufficiency (Child-Pugh B/C), renal dysfunction (eGFR <30 mL/min/1.73m²); (3) Diabetes subtypes: Type 1 diabetes, gestational diabetes, secondary diabetes; (4) Incomplete core clinical parameters.
Diagnosis of DCM
In accordance with the 2024 ESC Position Paper on DCM (endorsed by the Heart Failure Association and Working Group on Myocardial and Pericardial Diseases), DCM is defined as systolic and/or diastolic myocardial dysfunction occurring in patients with diabetes mellitus (19). Given this study’s focus on early-stage DCM risk prediction, we targeted the initial disease continuum: Diastolic dysfunction represents the earliest detectable phenotype of diabetic myocardial injury. Systolic dysfunction (LVEF <50%) typically indicates advanced disease incompatible with early warning objectives (2).
Therefore, through strict application of pre-specified inclusion/exclusion criteria, study participants were confirmed as DCM cases upon meeting the criteria for left ventricular diastolic dysfunction. Diastolic dysfunction was defined per the 2016 ASE/EACVI Recommendations for the Evaluation of Left Ventricular Diastolic Function, requiring ≥3 of the following echocardiographic criteria (20): (1) Septal e’ velocity <7 cm/s or Lateral e’ velocity <10 cm/s; (2) Peak tricuspid regurgitation velocity >2.8 m/s; (3) Early diastolic mitral inflow velocity to tissue Doppler mitral annular early diastolic velocity ratio (E/e’) >14; (4) Left atrial volume index (LAVI) >34 mL/m².
Baseline data collection
Clinical characteristics and laboratory parameters were systematically collected through standardized protocols. Demographic and clinical variables included: age, sex, body mass index (BMI), duration of type 2 diabetes mellitus (T2DM Duration) (calculated from initial diagnosis to current hospitalization), heart rate, systolic blood pressure (SBP), diastolic blood pressure (DBP), smoking status, and alcohol consumption history. We obtained fasting venous blood samples were obtained within 24 hours of admission using standardized phlebotomy procedures. Complete blood counts - including white blood cells (WBC), neutrophils (NEU), lymphocytes (LYM), and platelets (PLT) - were analyzed using an automated hematology analyzer, with derived platelet-to-lymphocyte ratio (PLR) and neutrophil-to-lymphocyte ratio (NLR). Glycated hemoglobin (HbA1c) was measured by high-performance liquid chromatography, while biochemical profiles (triglycerides [TG], total cholesterol [TC], high-density lipoprotein cholesterol [HDL-C], low-density lipoprotein cholesterol [LDL-C], and serum creatinine [Scr]) were assessed using a clinical chemistry analyzer. First-morning midstream urine specimens were collected for urinary albumin-to-creatinine ratio (UACR) measurement via immunoturbidimetry. Estimated glomerular filtration rate (eGFR) was calculated applying the Chronic Kidney Disease Epidemiology Collaboration (CKD-EPI) equation (21). All data underwent dual-entry verification by independent investigators to ensure completeness and validity.
Standardized transthoracic echocardiography was performed by certified sonographers using a GE Vivid E95 ultrasound system (GE Healthcare) equipped with M5S transducers (1.5-4.6 MHz). Measured parameters included: left atrial diameter (LAD), left ventricular end-diastolic diameter (LVEDD), interventricular septal thickness at end-diastole (IVSd), left ventricular posterior wall thickness at end-diastole (LVPWd), relative wall thickness (RWT; 2×LVPWd/LVEDD), left ventricular ejection fraction (LVEF; Simpson’s biplane method). Left ventricular mass index (LVMI) was calculated using the Devereux formula (22). Measurement of diastolic function and tissue Doppler parameters: early diastolic mitral annular velocities (e’) were acquired using pulsed-wave tissue Doppler imaging (TDI) at the basal septal and lateral segments in the apical four-chamber view. Mitral inflow E-wave velocity was subsequently measured by placing the pulsed-wave Doppler sample volume at the mitral valve leaflet tips in the standard apical four-chamber view. The E/e’ ratiowas calculated as the ratio of mitral E-wave velocity to the average of septal and lateral e’ velocities. The LAVI was quantified in apical four- and two-chamber views using the biplane area-length method and indexed to body surface area. Additionally, peak TRV was obtained via continuous-wave (CW) Doppler in either the apical four-chamber view or dedicated right ventricular inflow view.
Statistical analysis
All statistical analyses were conducted using R software (version 4.4.1; R Foundation) and IBM SPSS Statistics (version 25.0; IBM Corp). Continuous variables were assessed for normality through Shapiro-Wilk tests supplemented by histogram visualization. Normally distributed variables were expressed as mean ± standard deviation (SD) and compared using Student’s t-test, while non-normally distributed variables were reported as median (interquartile range [IQR]) with Mann-Whitney U test comparisons. Categorical variables were presented as frequencies (percentages) and analyzed by χ² test or Fisher’s exact test as appropriate. we performed univariate logistic regression analysis on the training cohort and the independent risk factors were further analyzed by multivariate logistic regression (Stepwise backward regression method). This model was visualized as a nomogram using the rms package in R with proportional scaling. Internal validation employed 1000 bootstrap resamples to estimate optimism-corrected performance metrics and mitigate overfitting risks. Model discrimination was evaluated via receiver operating characteristic (ROC) curve analysis reporting area under the curve (AUC) with 95% confidence intervals. Calibration was assessed using Hosmer-Lemeshow goodness-of-fit tests and calibration plots comparing predicted versus observed probabilities. Clinical utility was assessed through decision curve analysis (DCA) and clinical impact curves (CIC), with DCA quantifying the net benefit across threshold probabilities and CIC estimating true-positive versus false-positive classification rates. The P value of <0.05 indicated statistical significance.
Results
Baseline characteristics
The study flowchart is presented in Figure 1. The study cohort comprised 525 patients with T2DM, among whom 174 (33.1%) met diagnostic criteria for DCM. Table 1 presents comparative analyses of clinical and echocardiographic parameters between the training (n = 367) and validation (n = 158) cohorts. The training cohort demonstrated a median age of 54.0 years (IQR 45.0-61.0) with male predominance (64.3%), while the validation cohort had comparable baseline characteristics: median age 54.0 years (IQR 45.0-63.0) and male proportion 67.1%. Intergroup comparisons revealed statistically significant differences only in smoking status (P = 0.047), with no clinically relevant disparities observed in T2DM duration, BMI, SBP, or other key variables. This baseline homogeneity supports the validity of the internal model validation procedures.
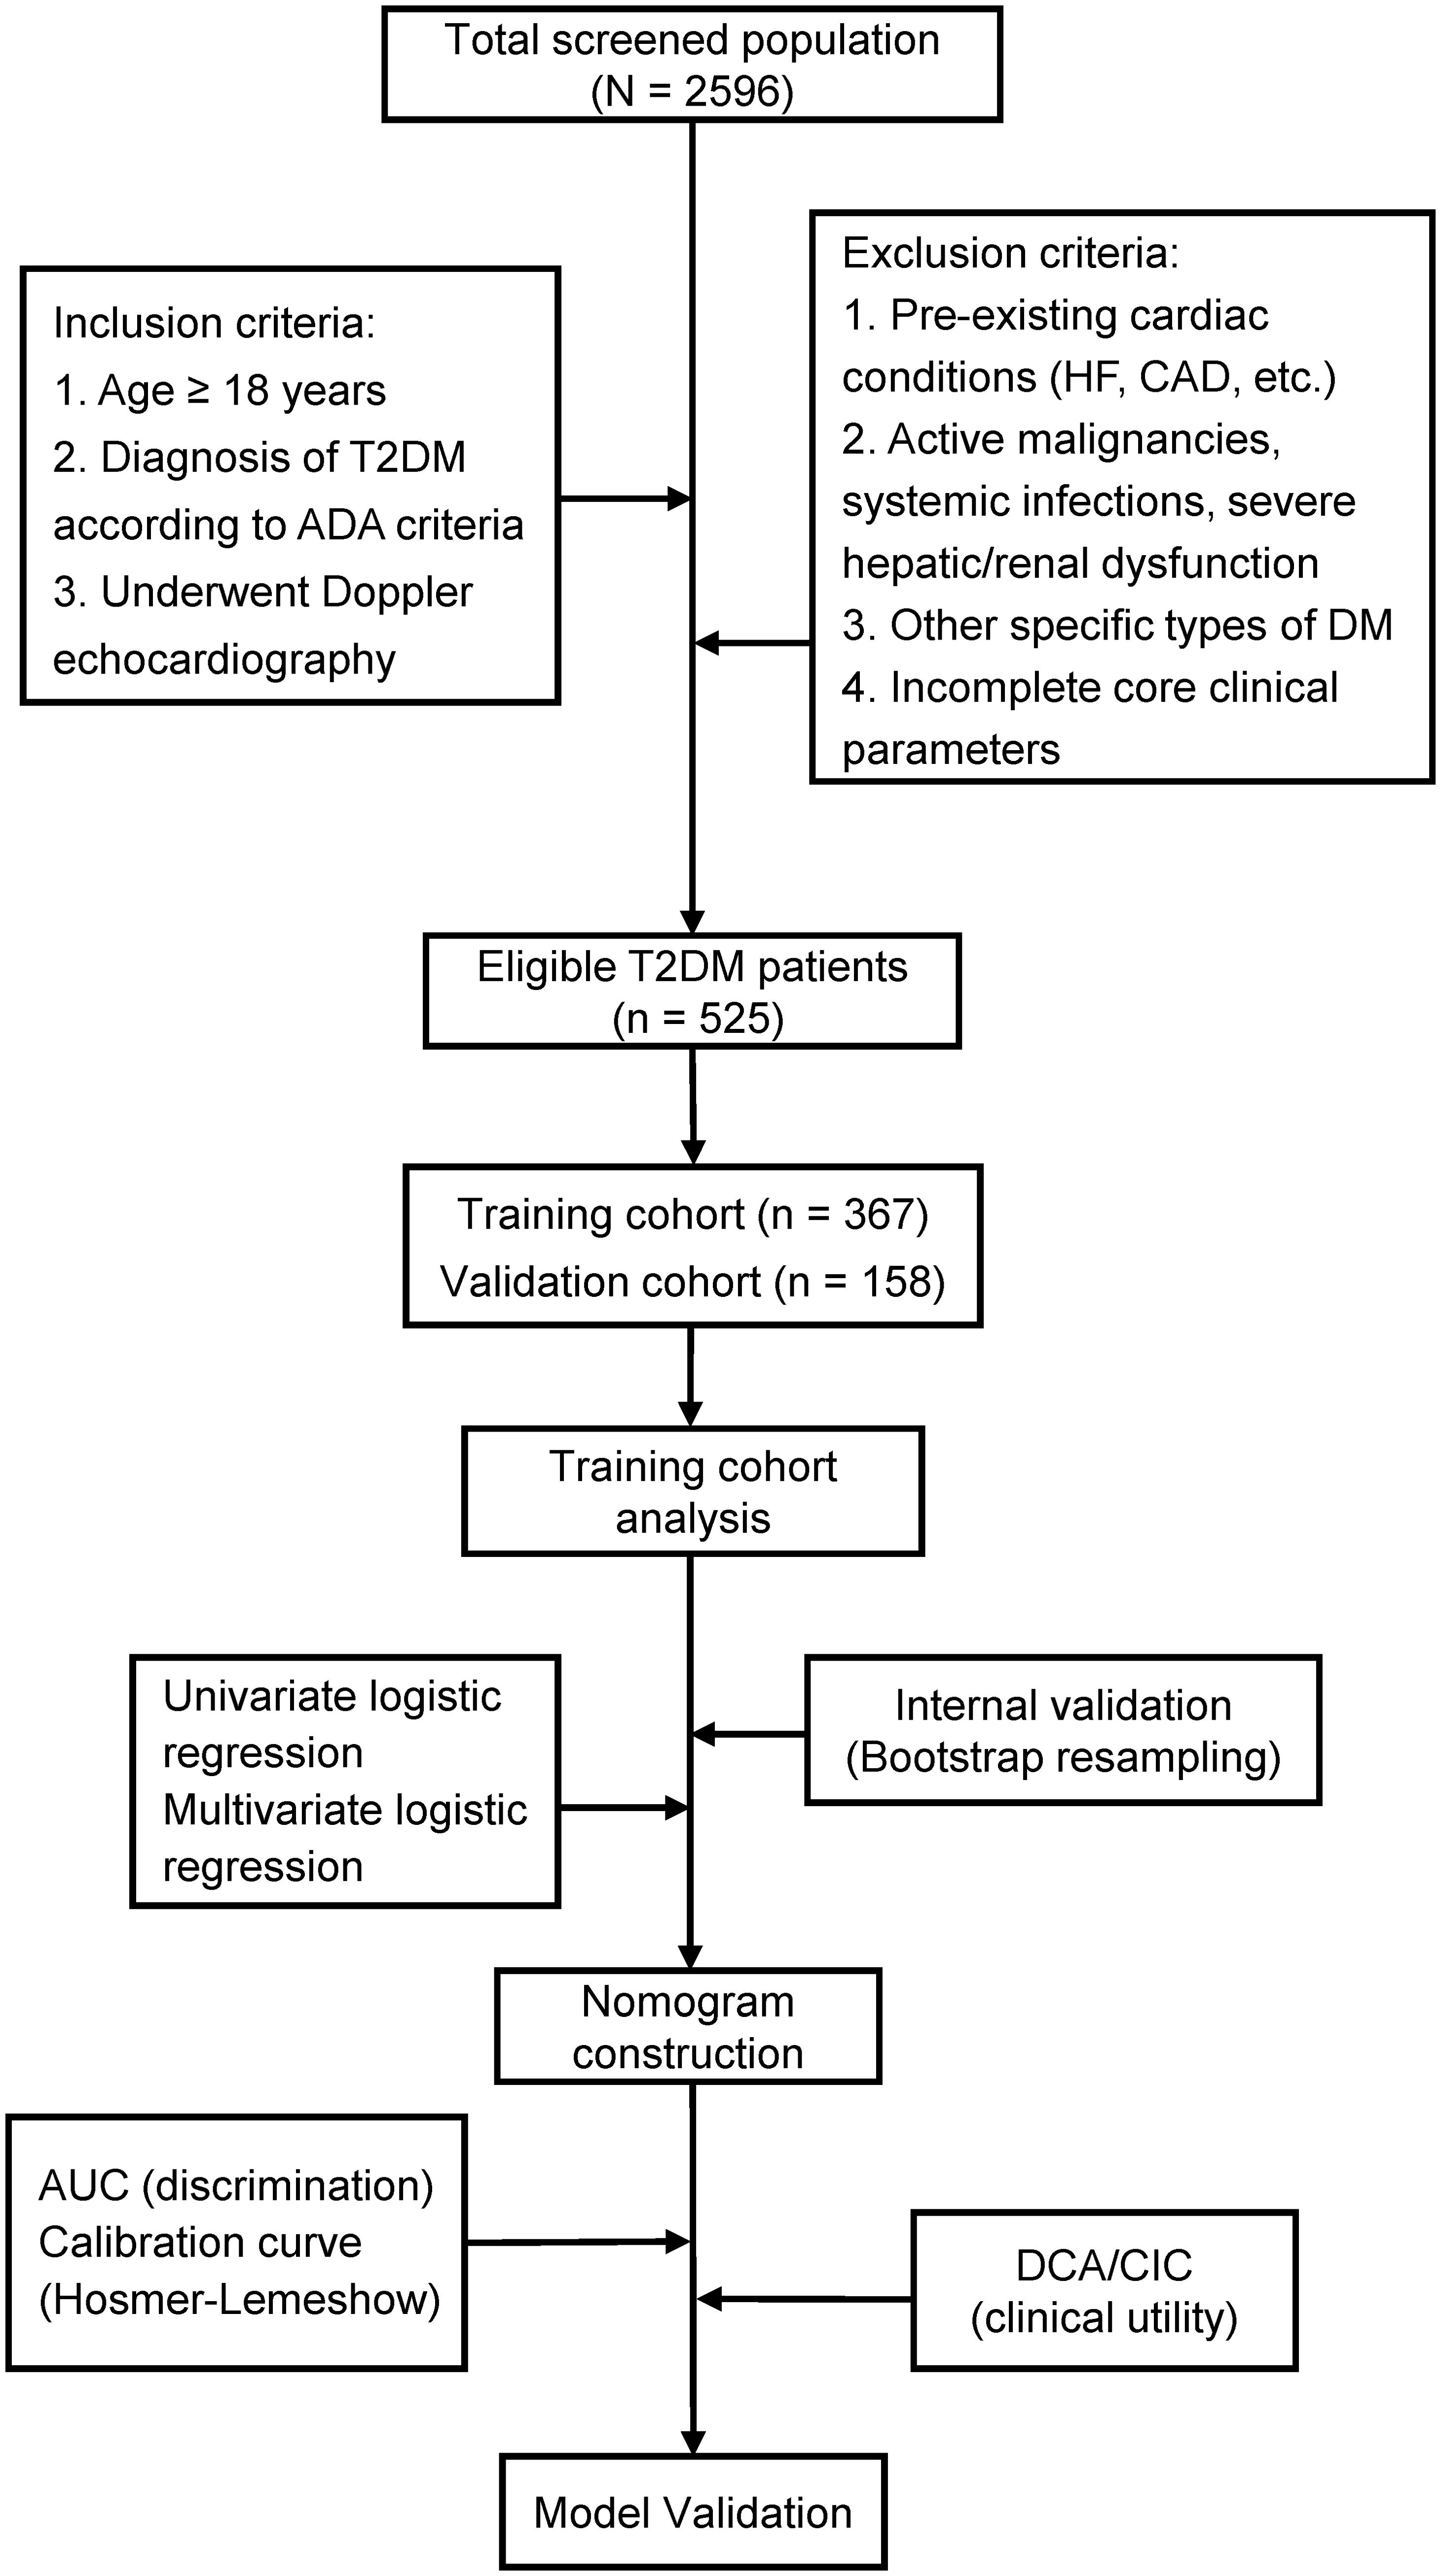
Figure 1. Flow diagram of study design.
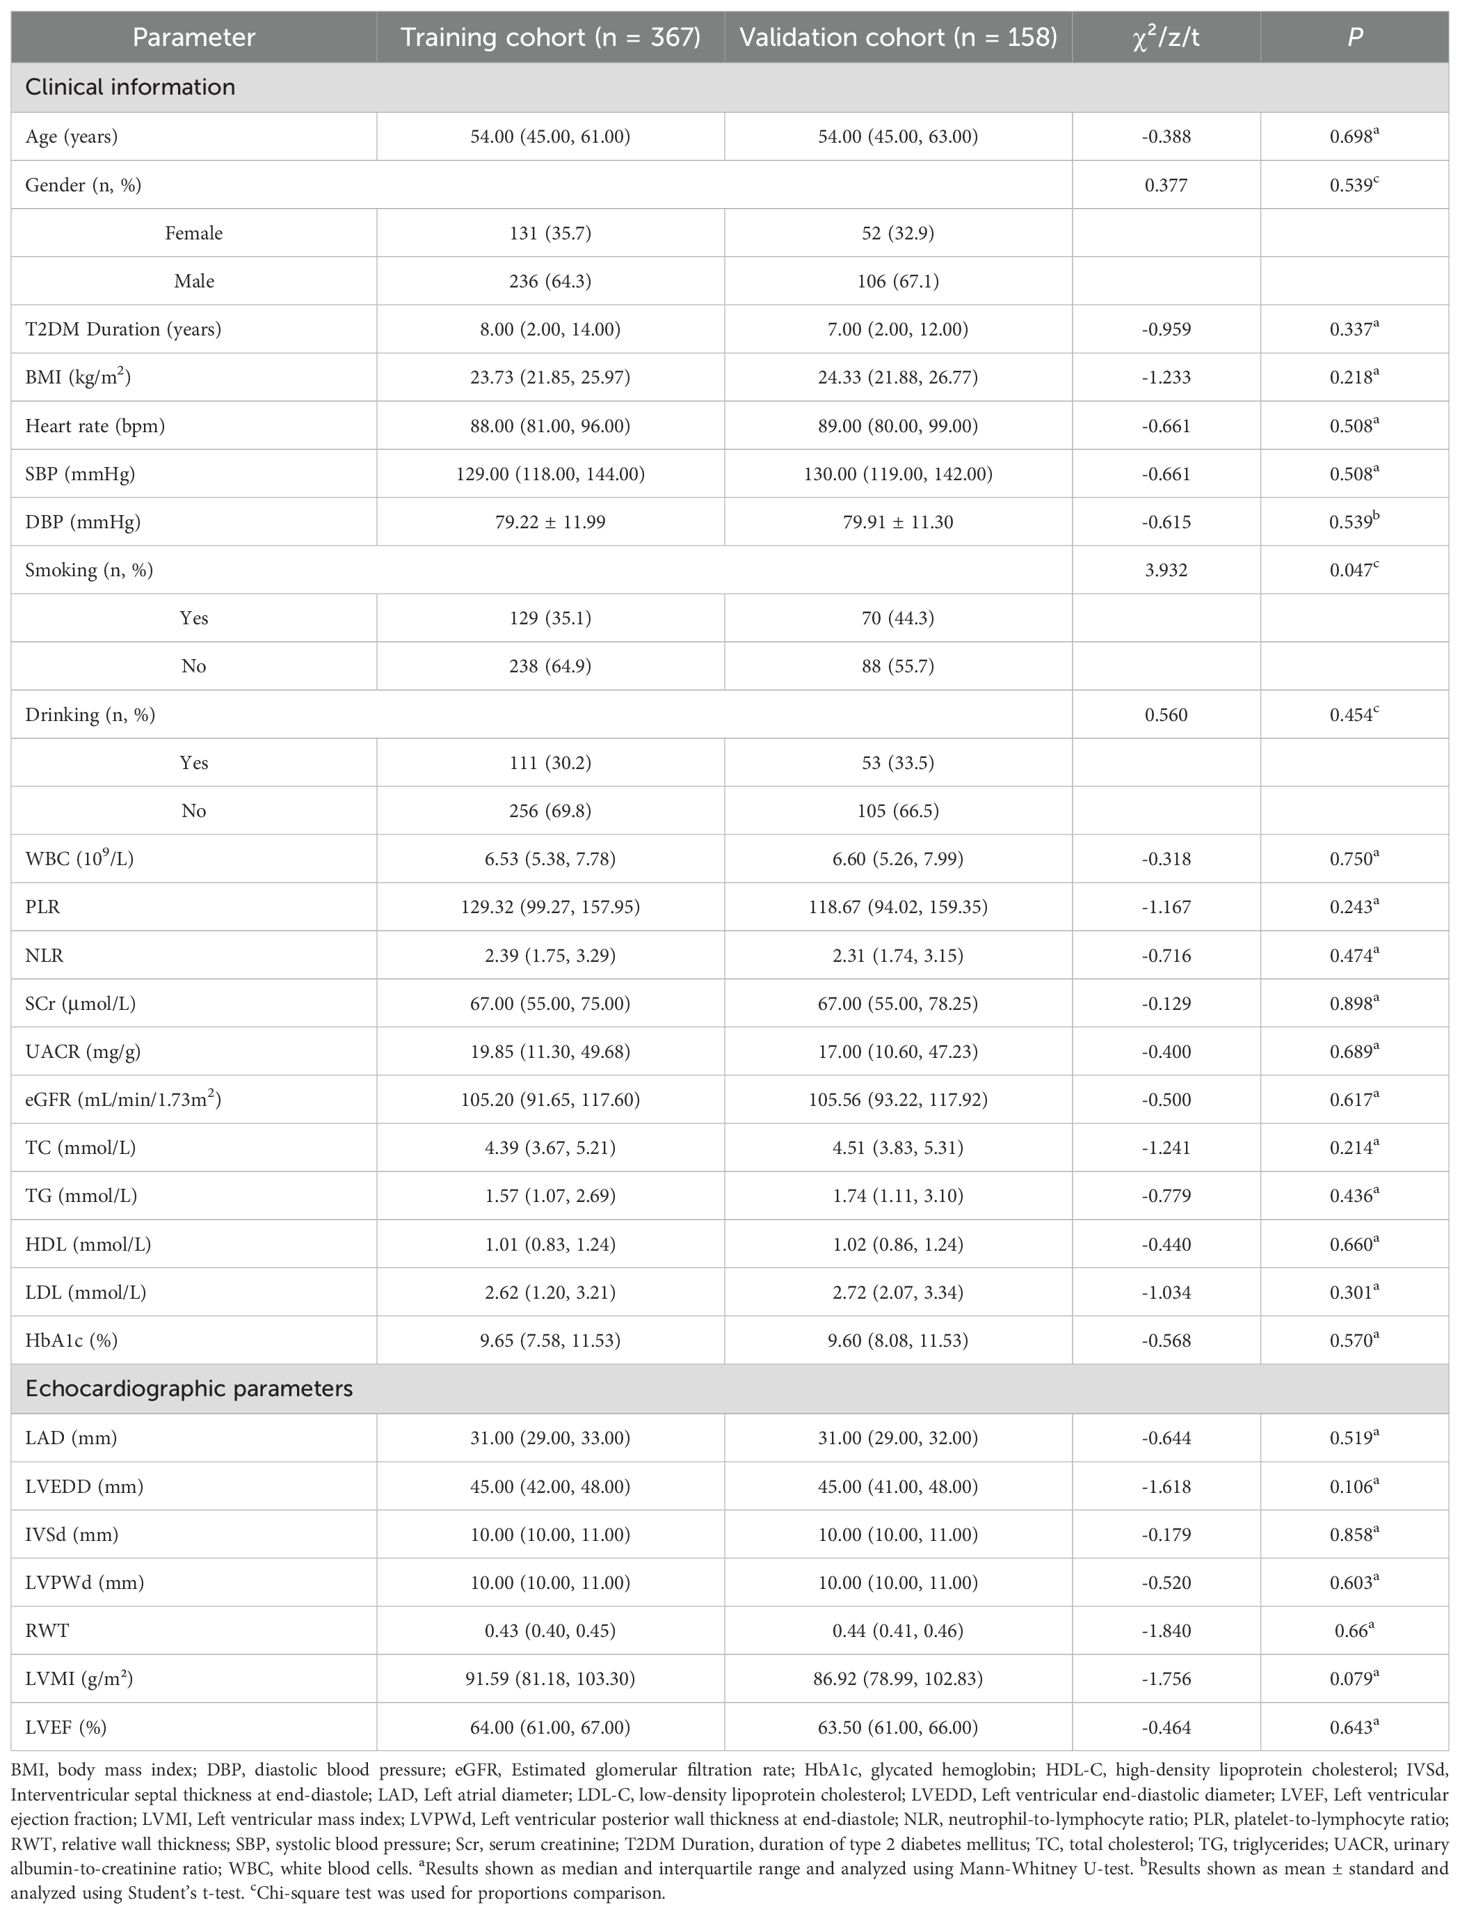
Table 1. The baseline characteristics of patients in the training and validation cohort.
Univariate and multivariable logistic regression analysis
Univariate logistic regression analysis identified 17 variables significantly associated with DCM (P <0.05) in the training cohort. To mitigate overfitting and multicollinearity risks, we adhered to the events per variable (EPV) ≥10 principle (23), permitting inclusion of ≤12 variables given 125 DCM events. Variables were prioritized based on statistical significance (P <0.01), with 12 candidate variables retained for subsequent multivariate analysis. After performing multivariate logistic regression analysis (using backward stepwise regression), a variance inflation factor (VIF) less than 5 indicates acceptable multicollinearity, six independent predictors emerged (P <0.05): Age (OR = 1.046, 95% CI:1.008-1.088, P = 0.0198), T2DM Duration (OR = 1.254, 95% CI: 1.167-1.359, P <0.001), SBP (OR = 1.033, 95% CI:1.011-1.055, P = 0.0028), UACR (OR = 1.014, 95% CI:1.008-1.020, P <0.001), LAD (OR = 1.33, 95% CI:1.178-1.519, P <0.001), LVPWd (OR = 2.33, 95% CI:1.542-3.636, P <0.001). Detailed results are presented in Tables 2 and 3.
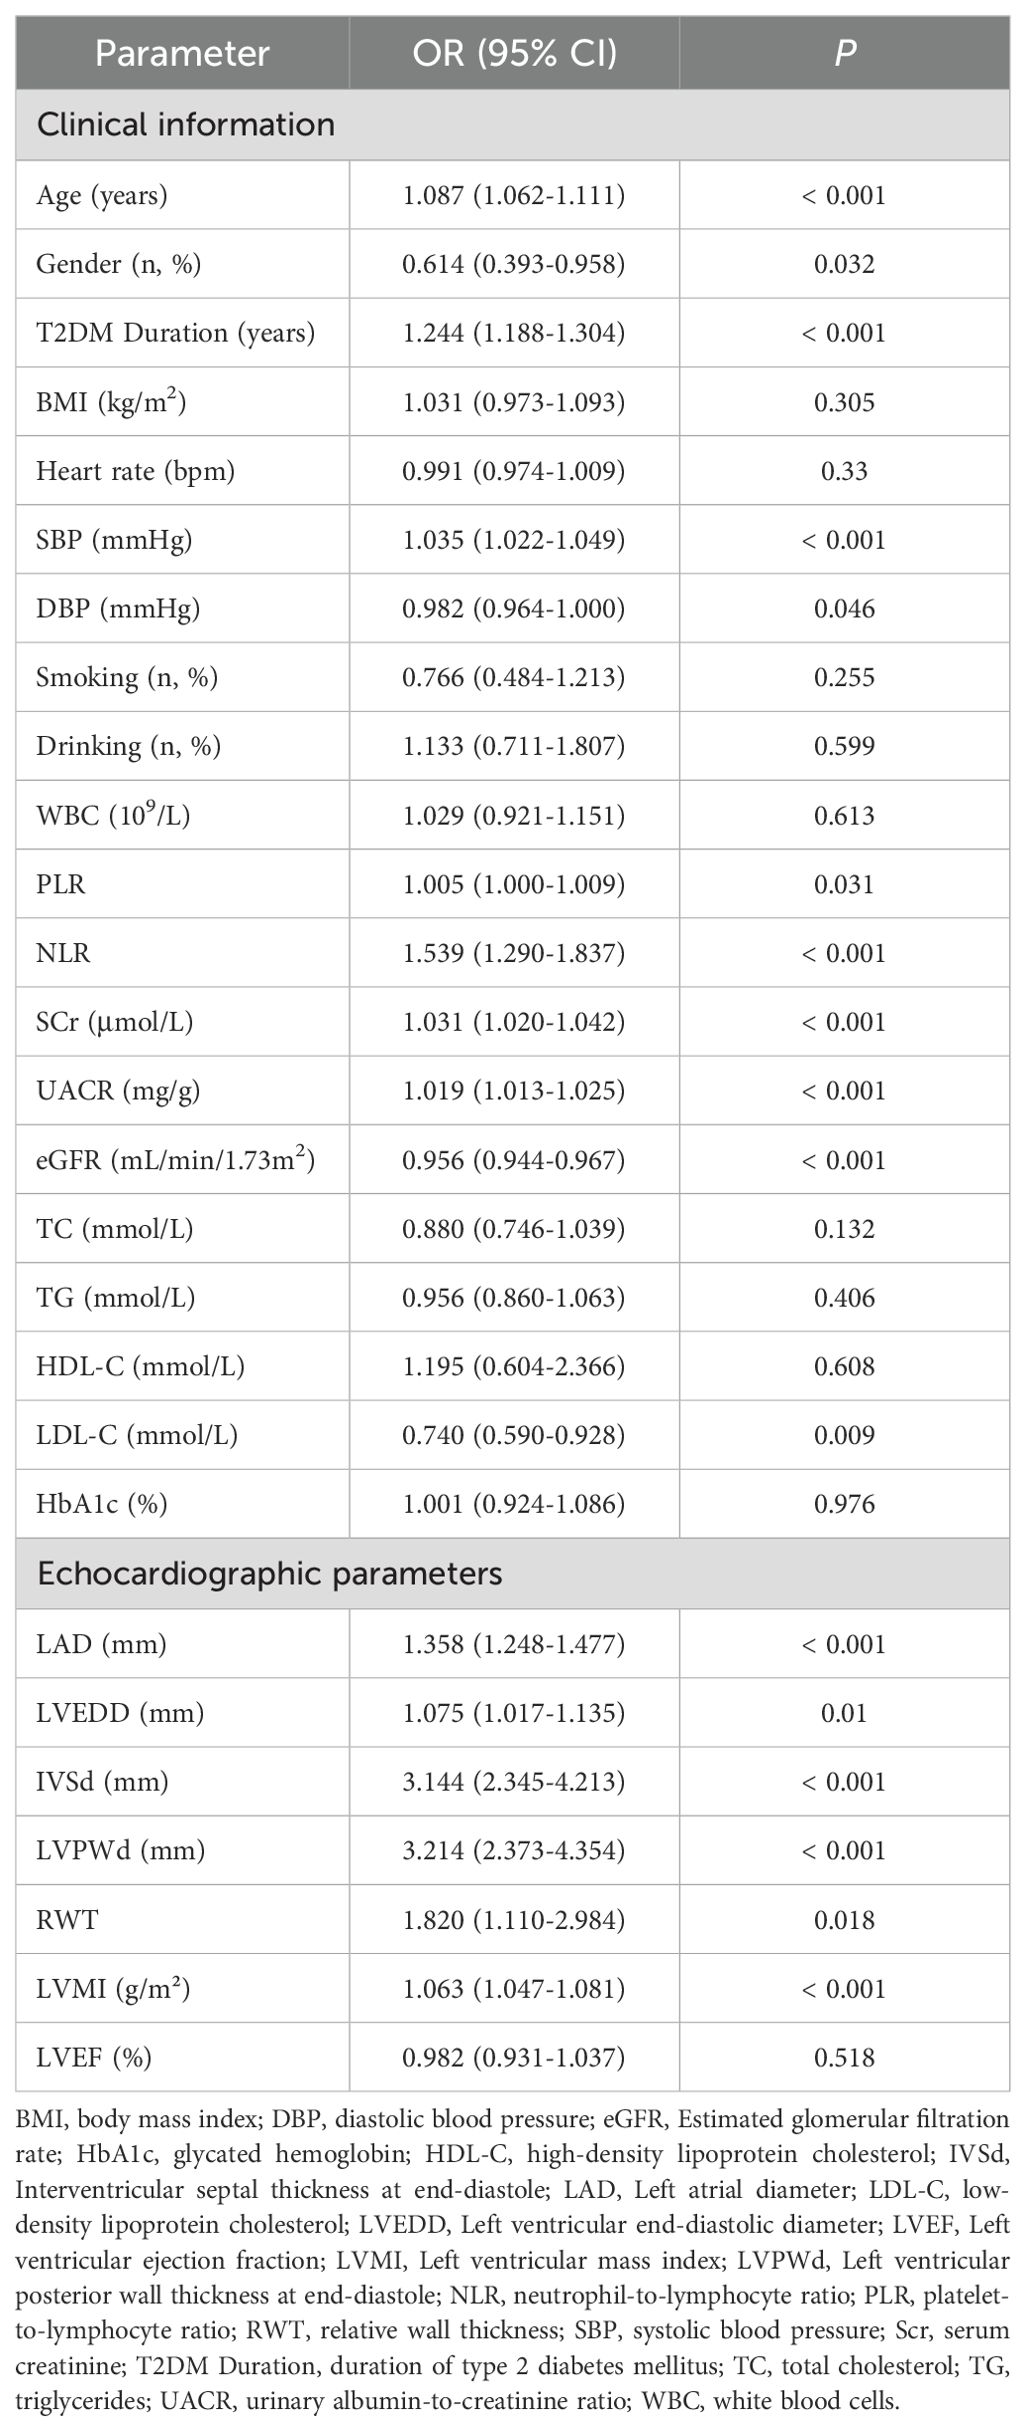
Table 2. Univariate logistic regression analysis of patients in the training cohort.
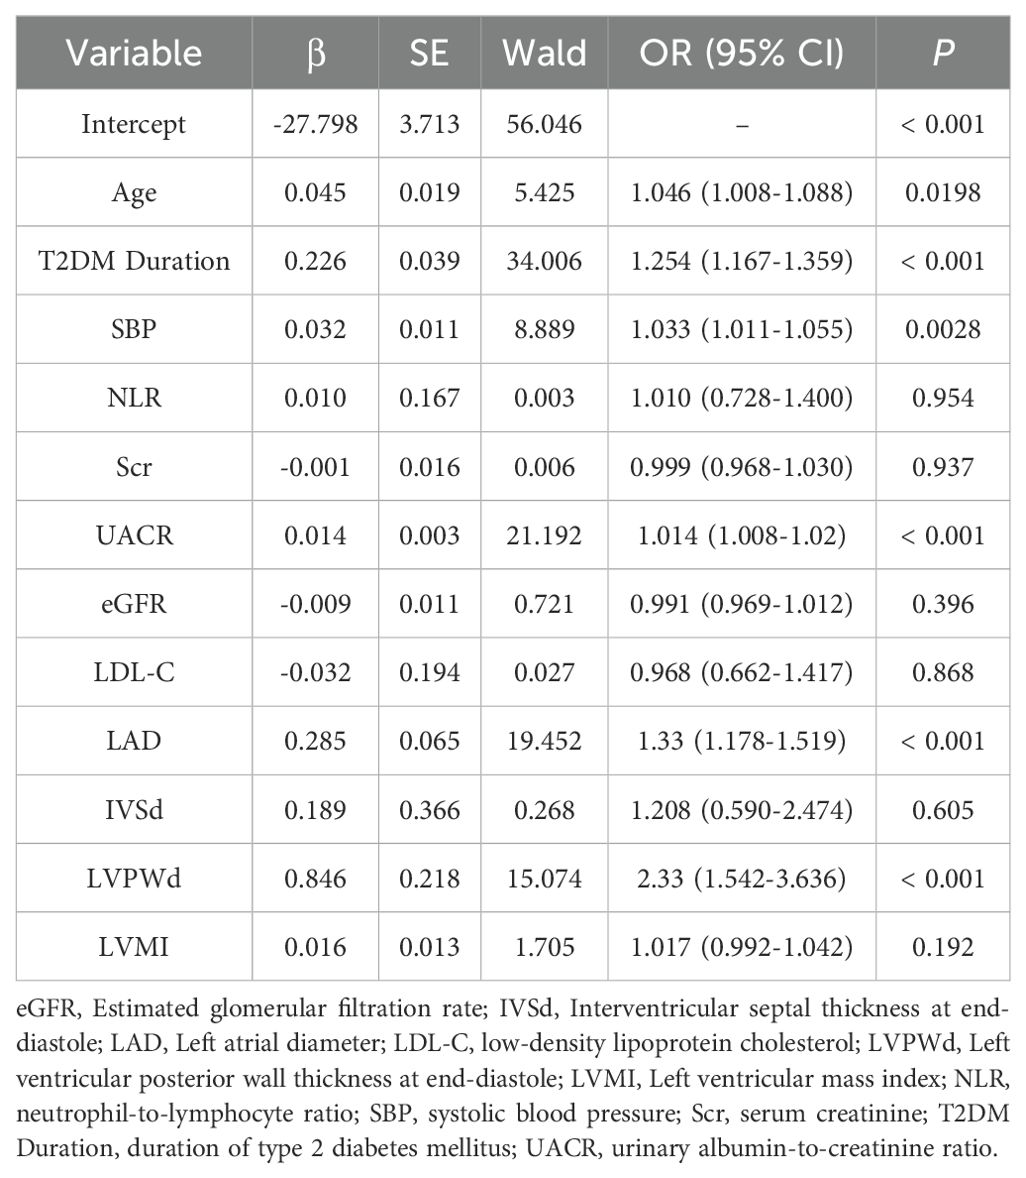
Table 3. Multivariate logistic regression analysis of patients in the training cohort.
Development of the nomogram prediction model
The nomogram (Figure 2) was constructed to visualize the final multivariable logistic regression model. Point values assigned to each predictor were automatically calculated based on their corresponding regression coefficients (β-coefficients) using the rms package in R software. This mathematical transformation process ensures that the point scale accurately preserves both the relative weights of variables within the model and the risk differences between categorical levels of individual predictors.
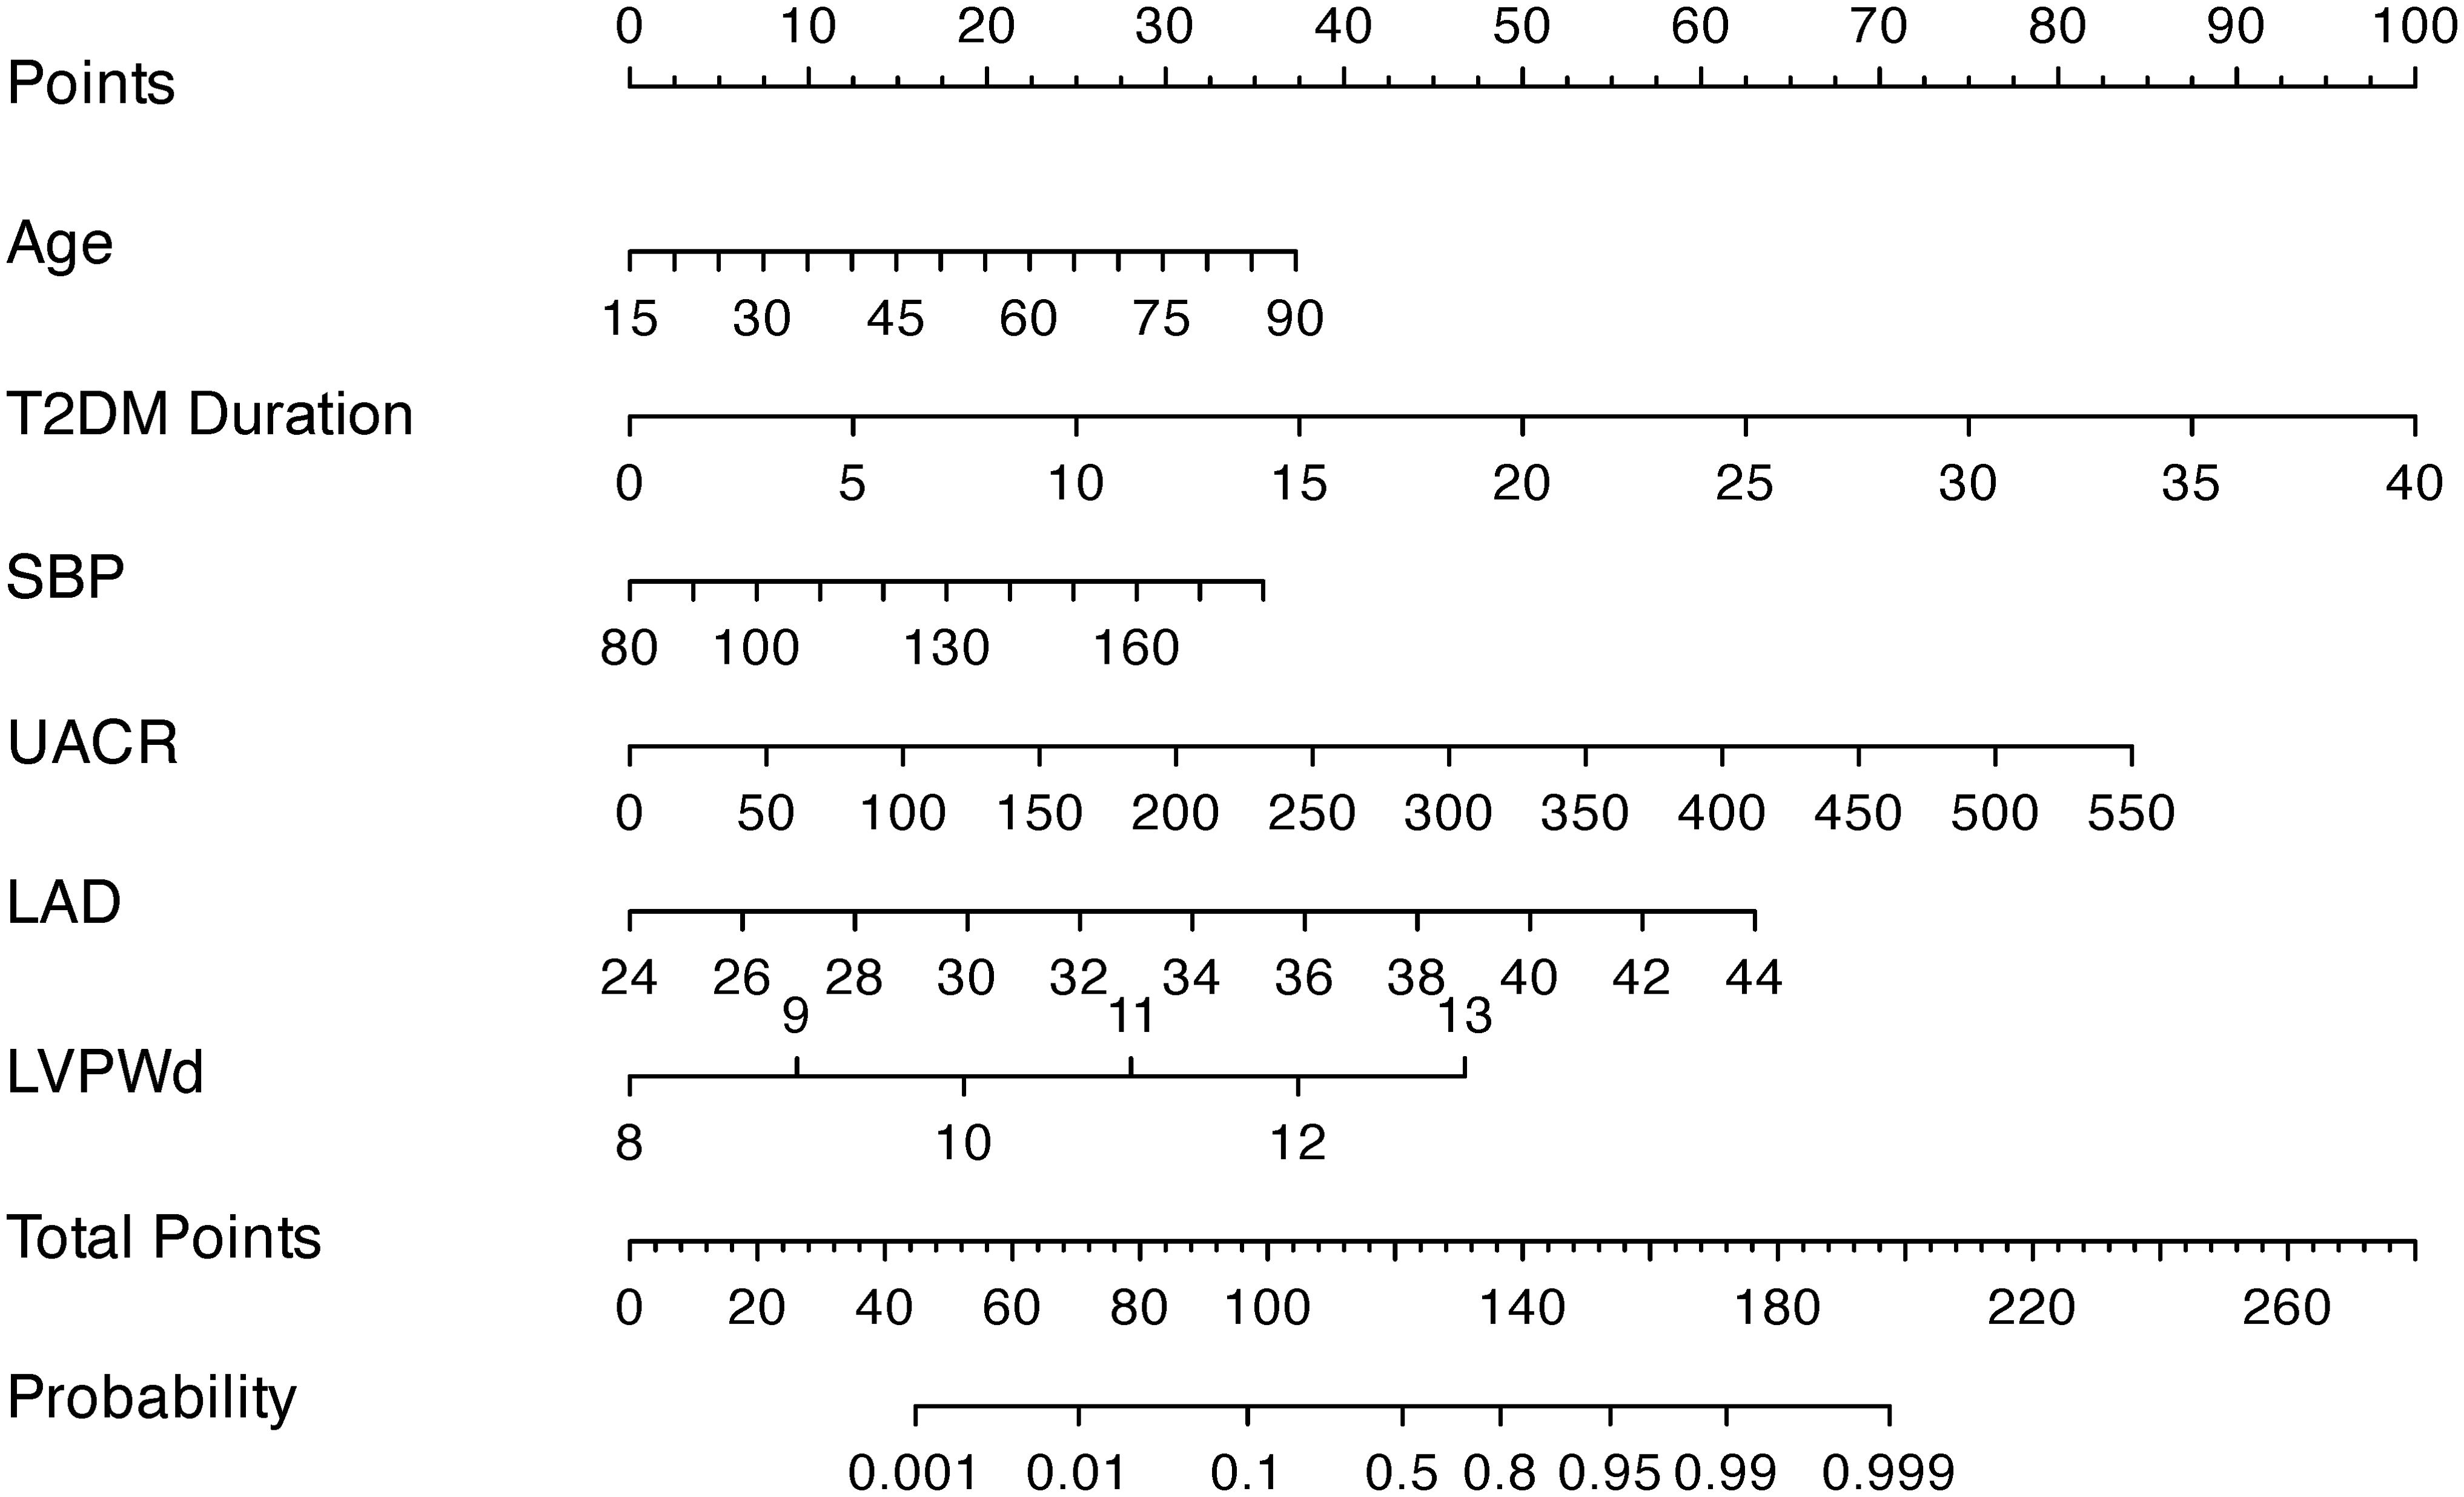
Figure 2. A nomogram integrating clinical indicators (age, T2DM Duration, SBP, UACR) and echocardiographic parameters (LAD, LVPWd) to predict DCM risk in T2DM patients.
To apply the model, clinicians first assign individualized scores by mapping a patient’s clinical parameters to the corresponding variable axes. These scores are then summed to calculate a total risk score, which is subsequently projected onto the probability axis to estimate the personalized likelihood of DCM. For instance, a 75-year-old patient with T2DM, a 20-year disease duration, SBP of 129 mmHg, UACR of 13.6 mg/g, LAD of 30 mm, and LVPWd of 9 mm would accumulate a total score of 127.5 points, corresponding to a 65% predicted probability of DCM (Figure 3). This integrative tool enables rapid risk stratification and supports clinical decision-making for early intervention in high-risk populations.
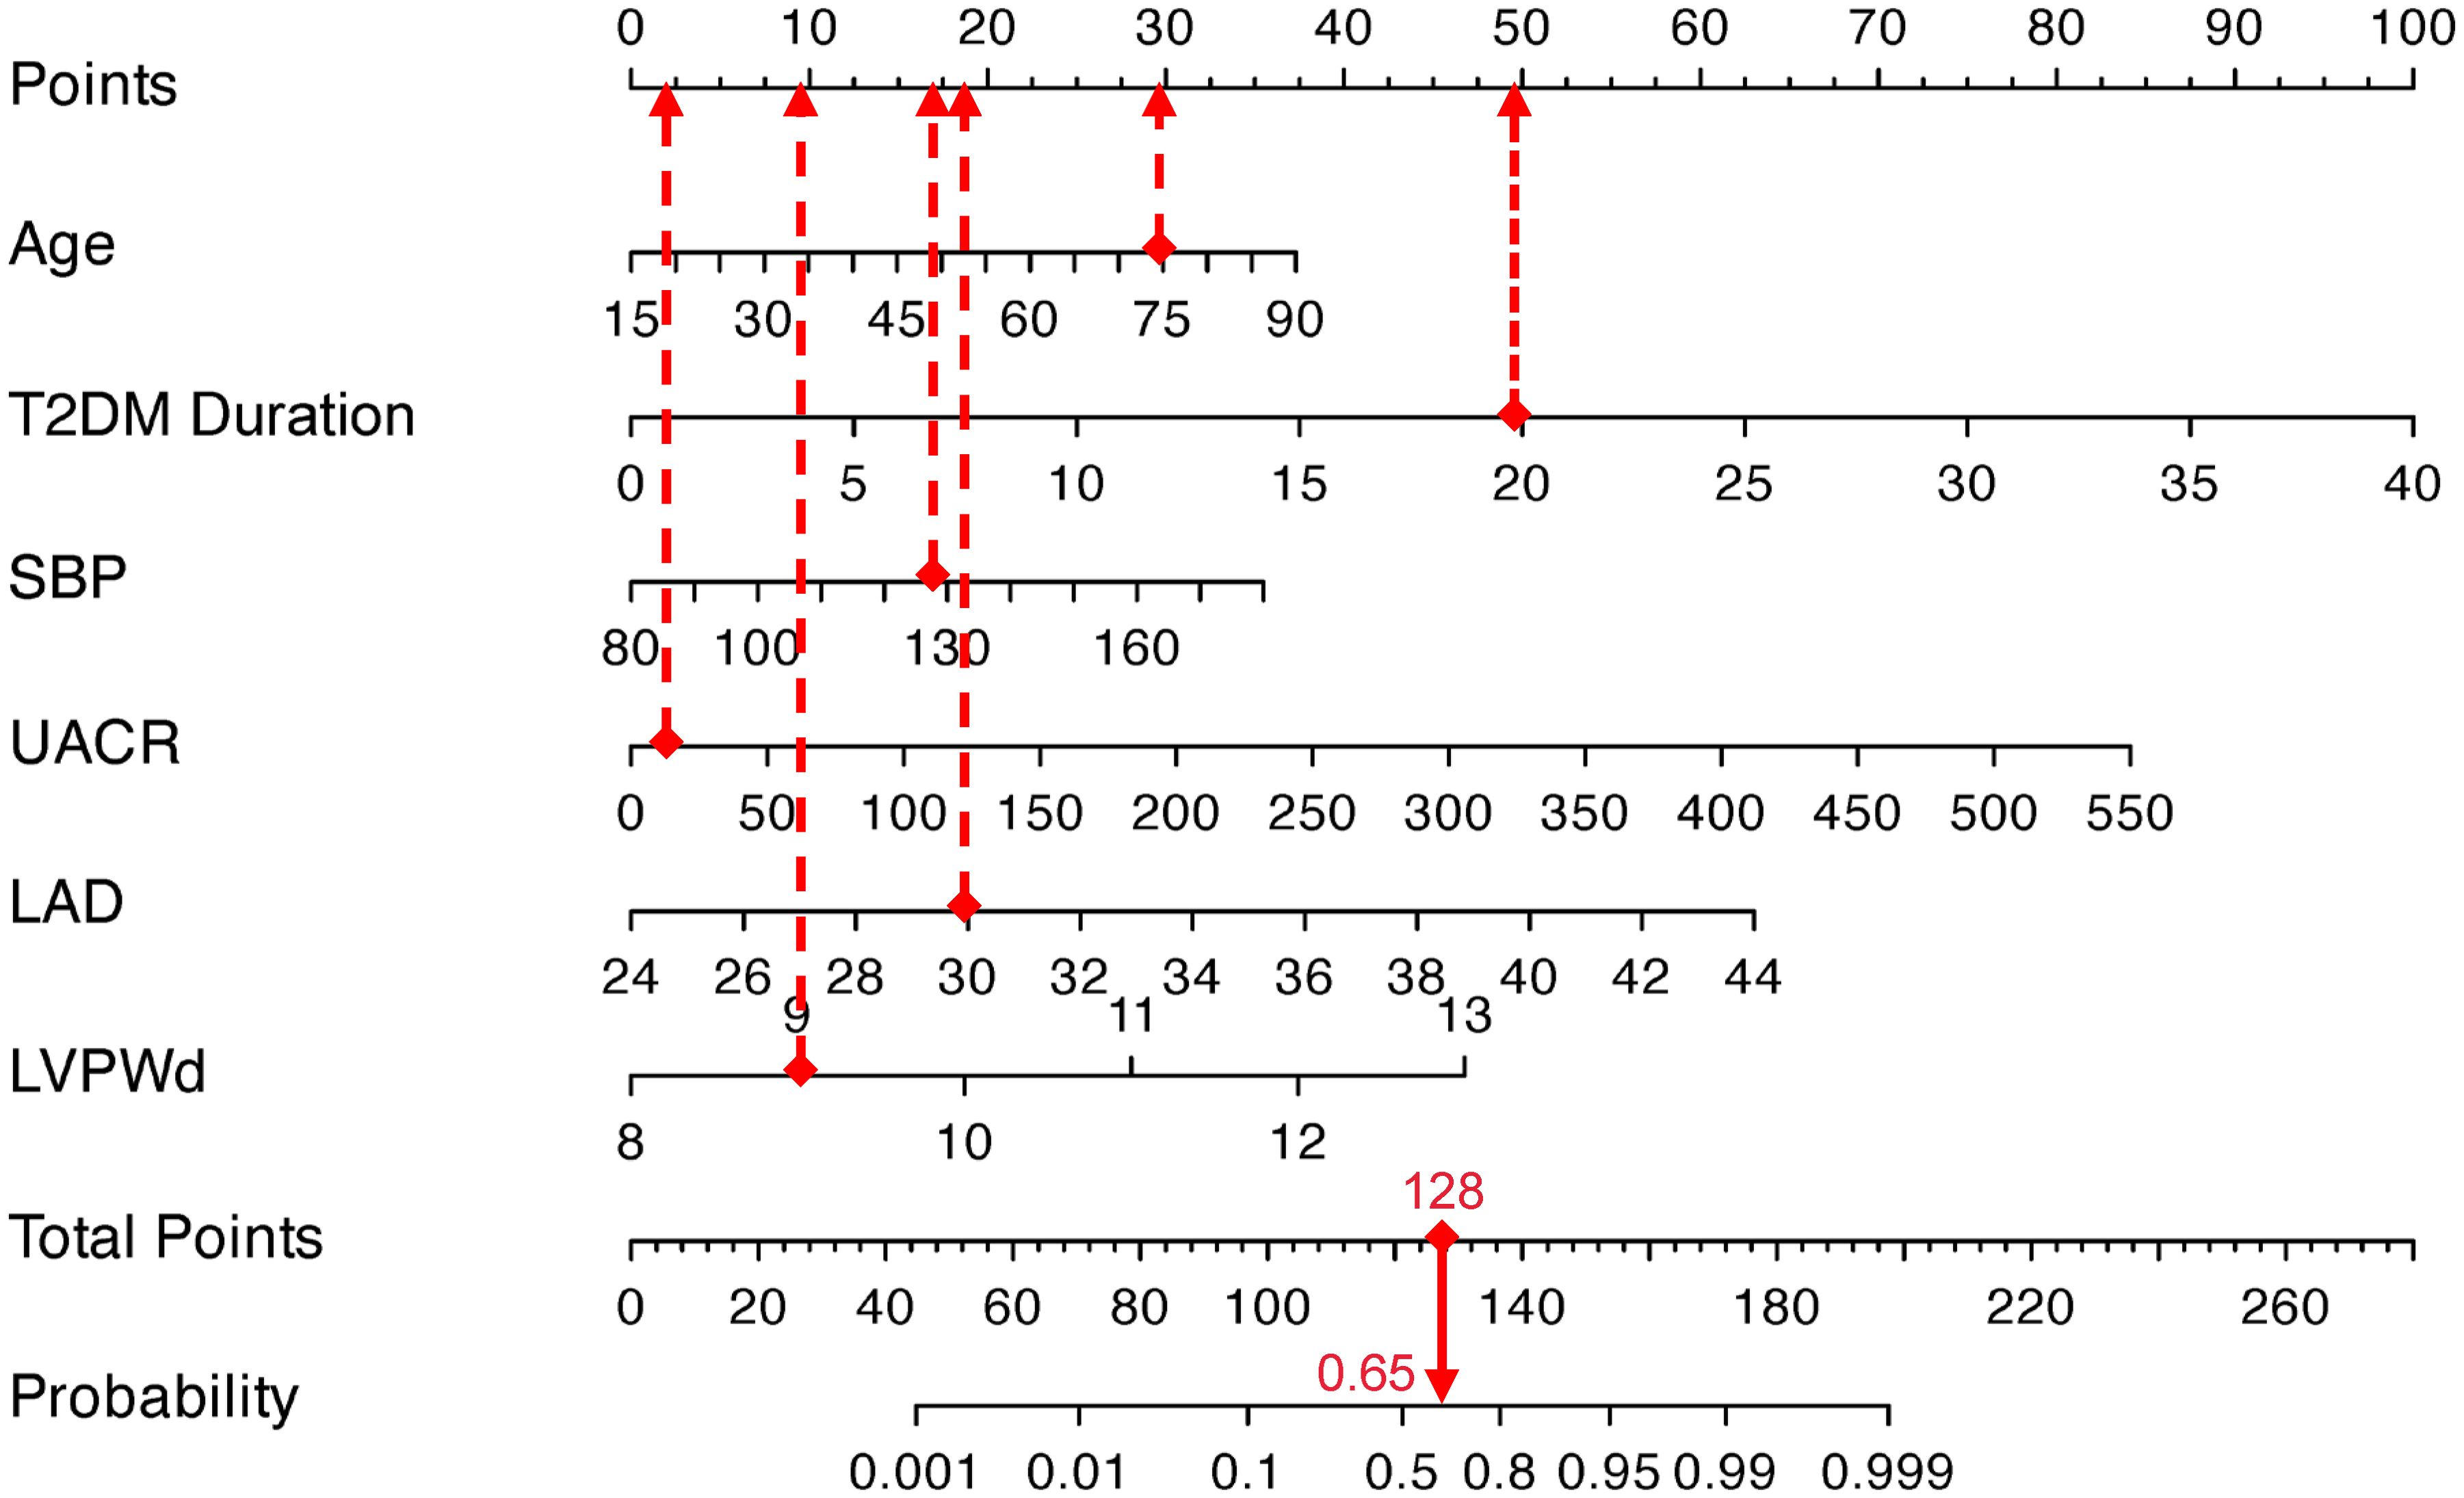
Figure 3. Visualization application of the nomogram prediction for the risk of DCM in patients with T2DM.
Model performance
Internal validation through 1000 bootstrap resamples demonstrated robust model discrimination, with a C-index of 0.9376 (95% CI: 0.9024-0.9728), indicating minimal overfitting risk. ROC analysis revealed excellent predictive accuracy in both training (AUC = 0.947, 95% CI: 0.916-0.967) and validation cohorts (AUC = 0.922, 95% CI: 0.870-0.956), surpassing the clinical utility threshold (AUC >0.75) (Figure 4). Calibration plots exhibited strong concordance between predicted probabilities and observed outcomes across risk strata (Figure 5). The Hosmer-Lemeshow test confirmed adequate model calibration (χ² = 9.2119, P = 0.3247), with non-significant deviation from ideal prediction (P >0.05).
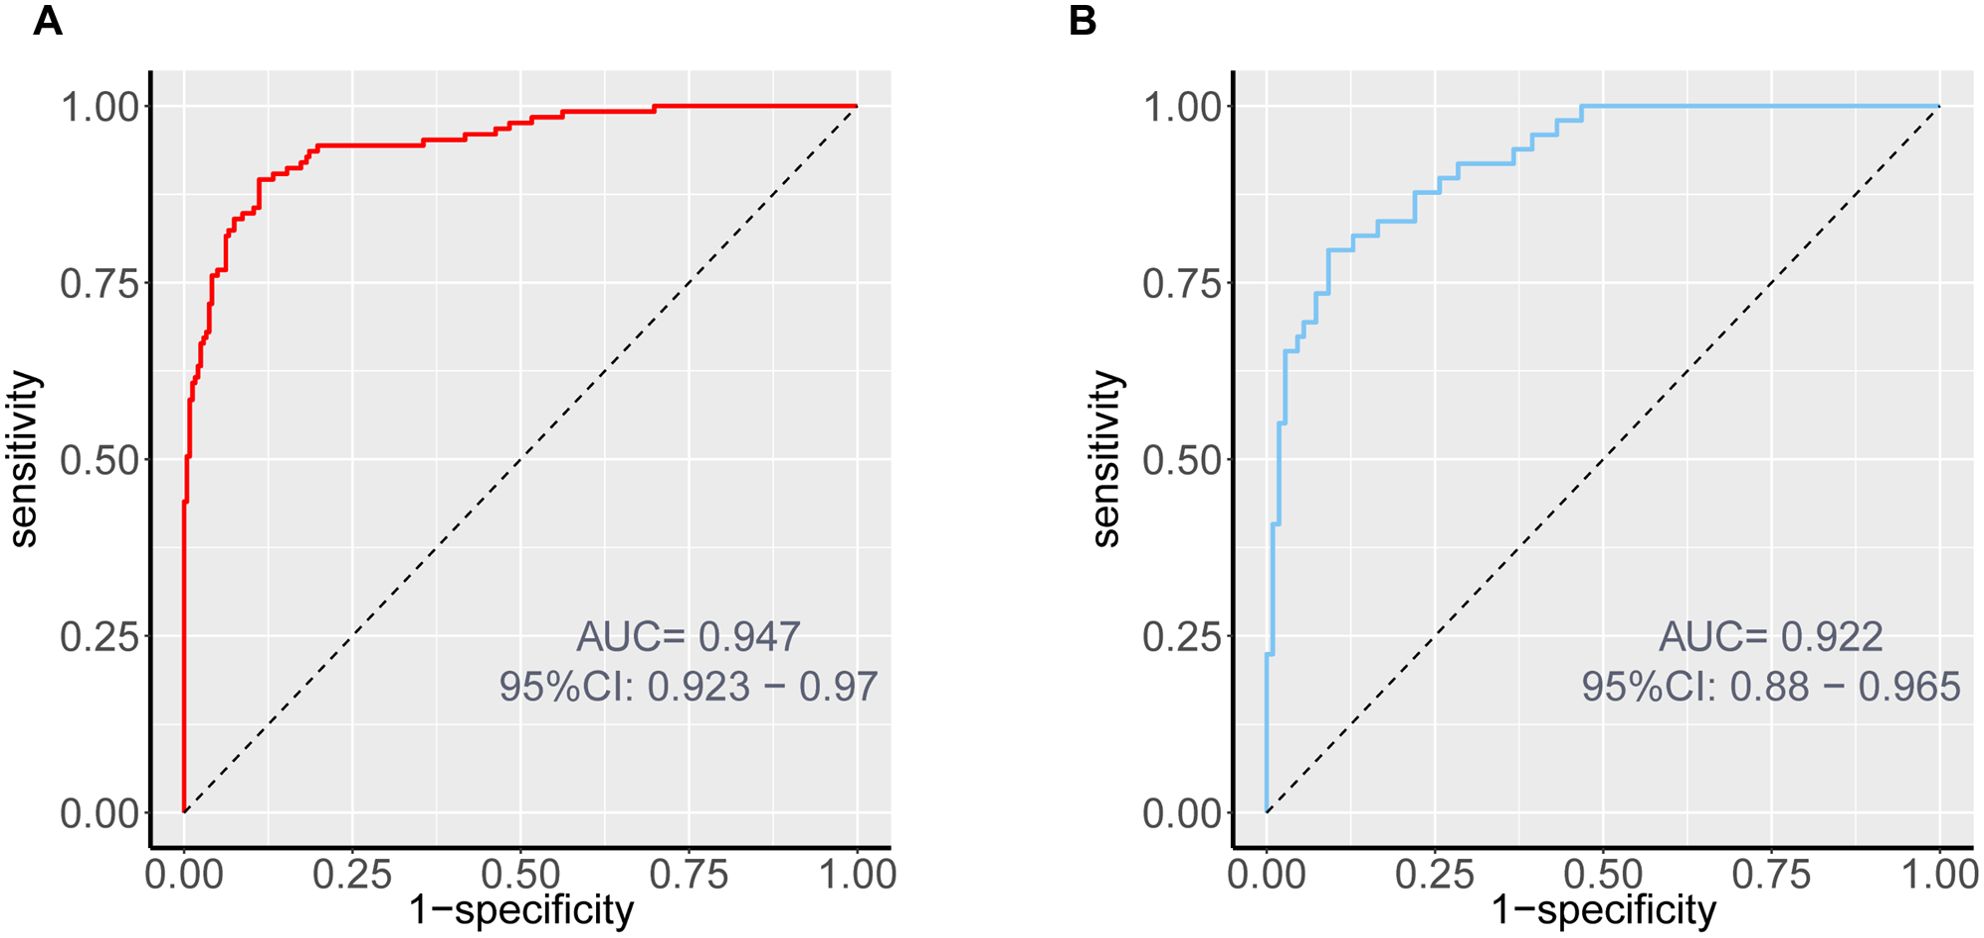
Figure 4. ROC curves of the nomogram prediction for the risk of DCM in patients with T2DM in the training cohort (A) and validation cohort (B).
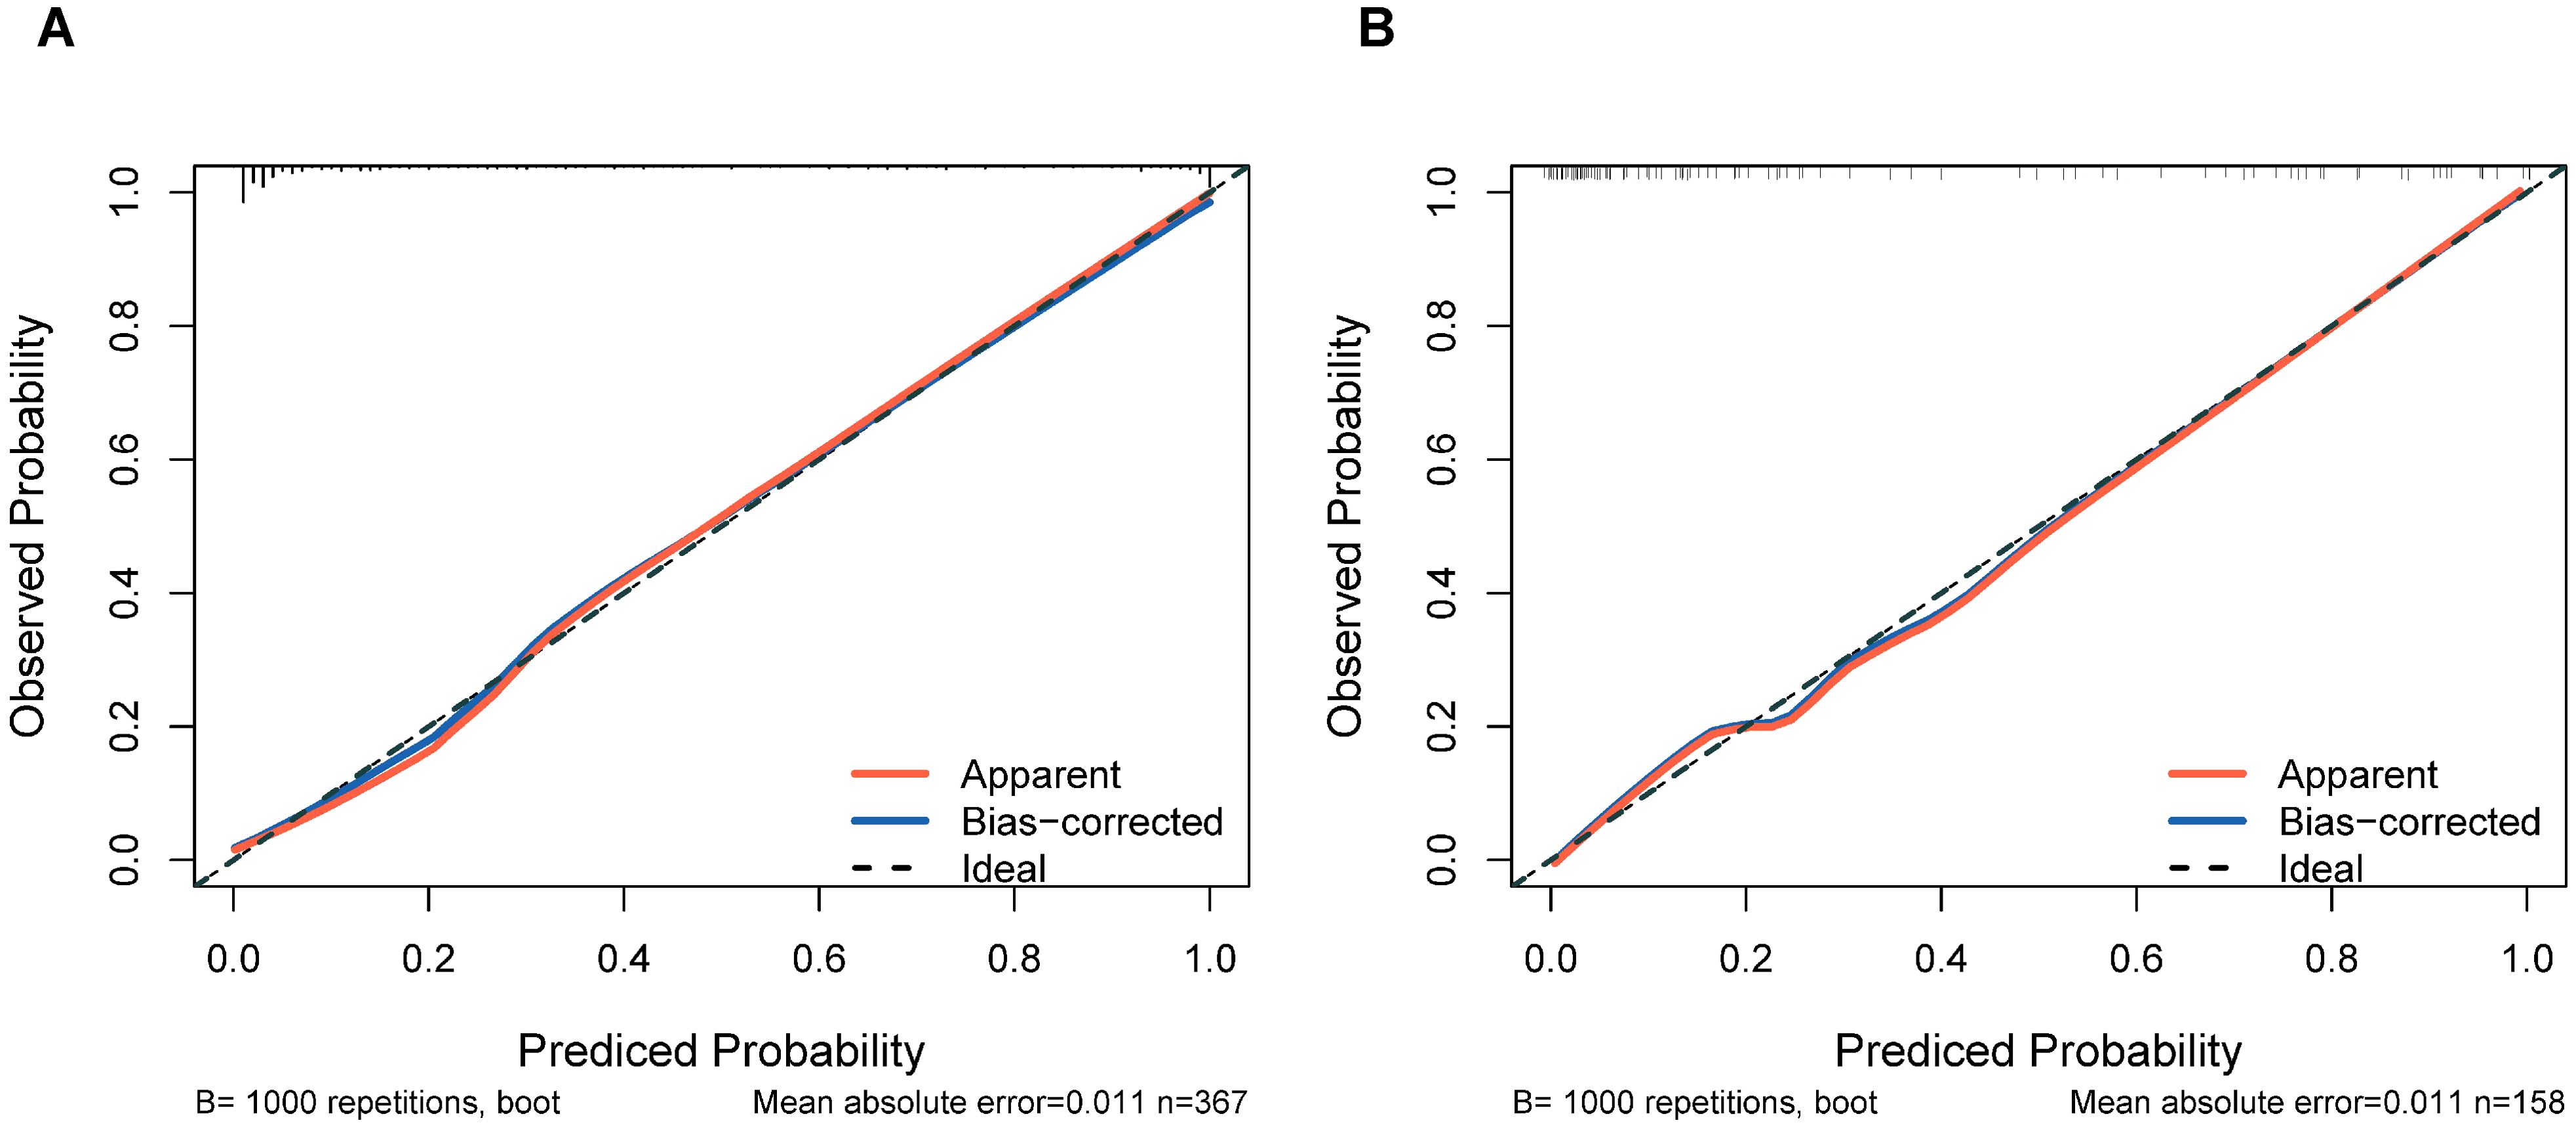
Figure 5. Calibration plots of the nomogram prediction for the risk of DCM in patients with T2DM in the training cohort (A) and validation cohort (B).
Model clinical utility
The DCA of the nomogram demonstrated superior net clinical benefits compared to default strategies (“Treat All” or “Treat None”) across low-to-medium risk thresholds (0.0-0.8), with both training and validation cohort curves exhibiting parallel trajectories and minimal divergence (Figure 6A). This consistency indicates robust generalizability without significant overfitting. CIC analysis further revealed high concordance between model-predicted high-risk cases and actual event occurrences at thresholds >0.6, highlighting its precision for resource-intensive interventions (Figure 6B). Integrating cost-benefit ratios, we recommend adopting flexible threshold selection (0.4-0.8) to optimize risk stratification and healthcare resource allocation based on clinical priorities and resource availability.
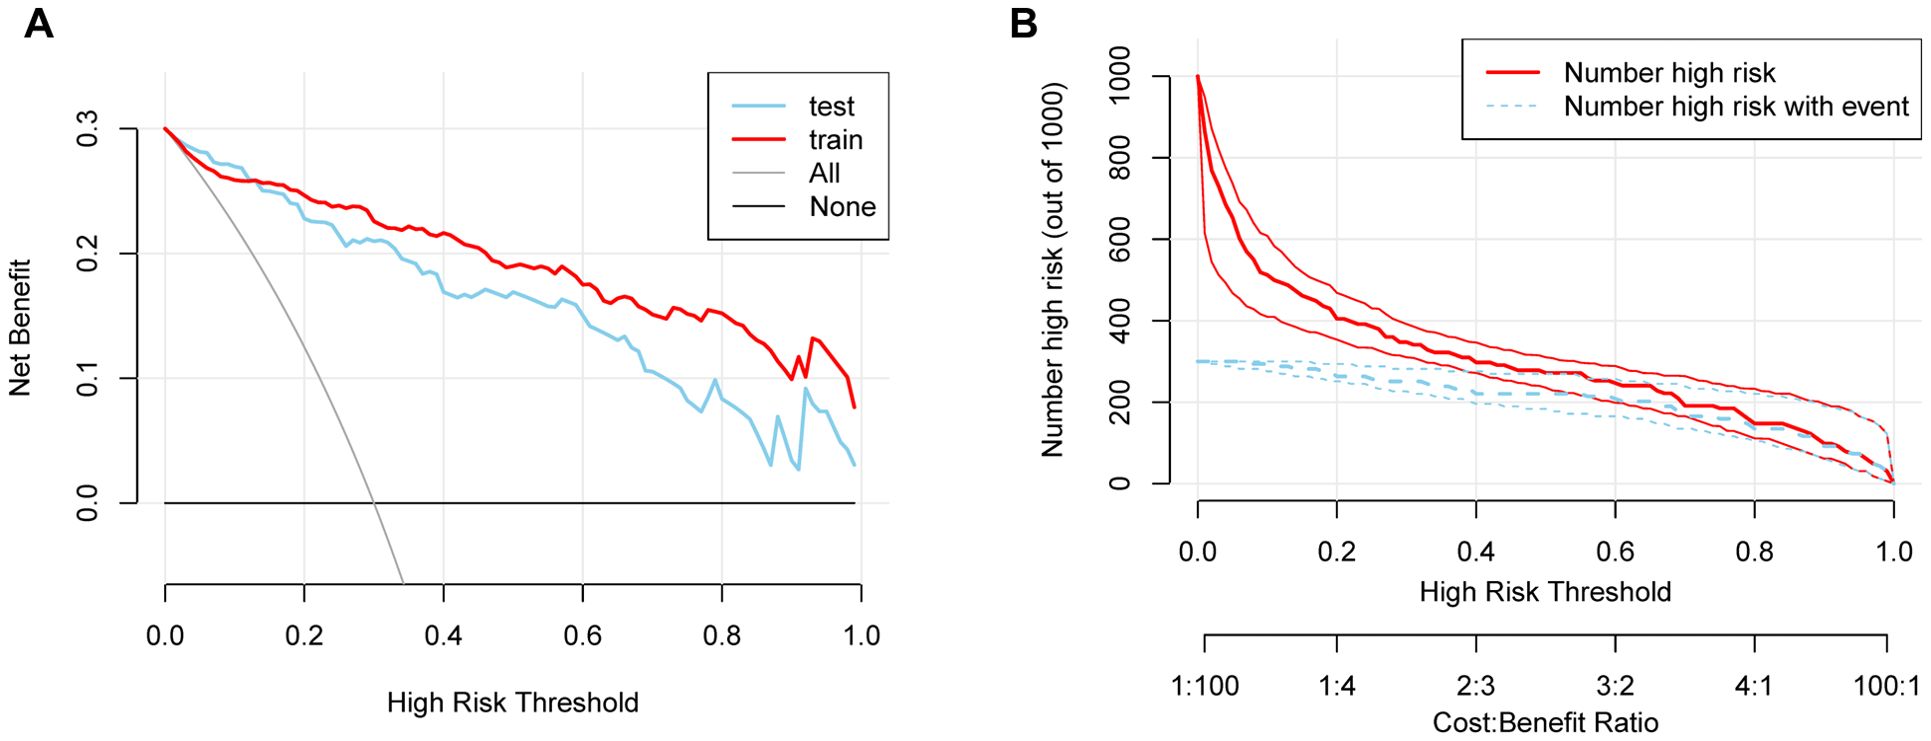
Figure 6. (A) DCA demonstrating the clinical utility of the nomogram across various risk thresholds. (B) CIC showing the relationship between predicted high-risk cases and actual event occurrences.
Discussion
Summary and interpretation of key findings
HF secondary to DCM represents a major contributor to premature mortality in patients with T2DM. While prior studies have established associations between echocardiographic parameters, biomarkers, and HF risk in diabetes (14, 24, 25), limited research has focused on predicting DCM progression in T2DM populations. To address this gap, we conducted a retrospective analysis of hospital-based data, identifying conventional clinical indicators (age, T2DM Duration, SBP, UACR) and cardiac structural remodeling markers (LAD, LVPWd) as independent predictors of DCM. Leveraging these factors, we developed and validated a clinically practical nomogram model. These results advance early DCM risk stratification and provide a framework for targeted clinical interventions.
The progression of DCM in patients with T2DM is synergistically driven by aging and prolonged hyperglycemic exposure. Extensive evidence identifies age as a critical determinant of cardiac dysfunction in T2DM populations (26–28), primarily through age-related cardiovascular remodeling characterized by myocardial stiffening, atherosclerotic changes, and metabolic dysregulation. These alterations establish a pathological substrate that amplifies diabetes-induced cardiac injury, particularly in elderly individuals with compromised metabolic homeostasis (26). Furthermore, diabetes duration emerges as an independent predictor of cardiovascular morbidity (29–31), reflecting cumulative hyperglycemic damage mediated by chronic oxidative stress, endothelial dysfunction, and cardiomyocyte apoptosis (29). The interplay between aging and diabetic metabolic disturbances creates a vicious cycle: Age-dependent myocardial fibrosis and diastolic impairment are exacerbated by persistent hyperglycemia, which accelerates glycation end-product accumulation and reactive oxygen species generation (14). This synergy explains why elderly patients with extended T2DM duration exhibit more severe myocardial injury and earlier onset of diastolic dysfunction (32). Our findings highlight the clinical imperative to incorporate both aging and glycemic exposure duration into DCM risk stratification frameworks, enabling targeted monitoring of high-risk subgroups.
Elevated blood pressure is a well-established risk factor for T2DM (33, 34), with diabetic populations exhibiting higher average blood pressure levels. A cross-sectional study in high-altitude Chinese populations identified hypertension and hyperglycemia as critical contributors to increased LVDD risk (35). Further supporting this, a 2018 clinical comparative study demonstrated a direct association between SBP and diastolic dysfunction severity (36). While diabetes alone rarely causes isolated myocardial impairment, its synergistic interactions with hypertension, obesity, and chronic kidney disease often amplify cardiac damage (19). In our study, elevated SBP emerged as a key driver of DCM progression. Mechanistically, prolonged hypertension induces myocardial hypertrophy and fibrosis, exacerbating cardiac workload and thereby aggravating LVDD in T2DM patients.
The UACR serves as a sensitive indicator of diabetic nephropathy, with renal impairment demonstrating strong cardiometabolic associations (37). Prevalent LVDD has been documented across stages of moderately increased (microalbuminuria) and severely increased albuminuria (macroalbuminuria), whereas left ventricular systolic dysfunction predominantly manifests in subgroups with advanced macroalbuminuria (38). Seminal investigations, including The Strong Heart Study, established associations between albuminuria, left ventricular mass index, and diastolic impairment. Notably, albuminuria independently correlates with multisystem damage irrespective of diabetes status, elevating risks of atherosclerotic cardiovascular events (myocardial infarction, ischemic stroke, cardiac mortality) and congestive heart failure (39). This aligns with our findings, reinforcing UACR’s dual role as both an early diabetic nephropathy marker and an independent predictor of cardiovascular outcomes, underscoring the cardiorenal continuum in diabetes pathophysiology.
In this study, LAD and LVPWd were identified as predictive indices, highlighting the critical role of cardiac structural remodeling in early DCM diagnosis. Left atrial enlargement and increased LVPWd in diabetic populations reflect adaptive cardiac responses to chronic hemodynamic stress, particularly in hypertensive conditions, ultimately progressing to myocardial dysfunction and heart failure (10, 40). A pooled analysis of three U.S. cohort studies (n = 10,208 participants without baseline cardiovascular disease or heart failure) demonstrated significantly higher prevalence of echocardiographic structural abnormalities—including left atrial dilation and left ventricular hypertrophy—among patients with T2DM. These abnormalities independently predicted 5-year incident heart failure risk (41, 42). Machine learning-based models for early DCM risk stratification similarly prioritize left ventricular mass and chamber size as key predictors (43). Our findings reinforce the necessity of proactive echocardiographic screening in T2DM patients with suboptimal glycemic control to detect structural cardiac alterations, enabling timely intervention to mitigate adverse outcomes.
This study revealed a noteworthy phenomenon: HbA1c—traditionally recognized as a key metabolic control indicator for diabetic complications—failed to demonstrate independent predictive value in our model. We postulate three underlying mechanisms:
(1) Metabolic memory effect (44): Persistent myocardial alterations (e.g., fibrosis and advanced glycation end-product deposition) induced by chronic hyperglycemia endure beyond glycemic correction. Consequently, baseline HbA1c inadequately reflects cumulative damage, explaining the superior predictive capacity of T2DM Duration. (2) Hierarchical masking in modeling: As disease progresses to structural remodeling stages (e.g., left ventricular hypertrophy/left atrial enlargement), imaging biomarkers may supersede upstream metabolic indicators. Concurrently, the synergistic modulation of glycemic exposure by age and diabetes duration further diminishes HbA1c’s contribution. (3) Temporal limitations of measurement: HbA1c captures only short-term (2-3-month) glycemic averages, failing to account for long-term cumulative myocardial injury from glycemic variability—a critical factor in chronic progressive disorders like DCM (45).
Clinical significance and practical applications
Given the elevated risk of HF in patients with T2DM, early detection and intervention of DCM are critical for HF prevention. Predictive models enable clinicians to stratify high-risk individuals during the asymptomatic phase, facilitating timely implementation of tailored interventions—such as lifestyle modifications, metabolic parameter optimization, and evidence-based pharmacotherapy—to reduce cardiovascular morbidity (46). Current preventive strategies for T2DM-associated cardiovascular disease include: 1. Lifestyle intensification: Structured dietary control, weight management, and physical activity regimens (47). The European Society of Preventive Cardiology guidelines advocate for individualized exercise regimens tailored to patient-specific characteristics to optimize cardiovascular adaptation and metabolic homeostasis (48); 2. Metabolic control: Tight regulation of glycemic, blood pressure, and lipid profiles; 3. Cardioprotective pharmacotherapy: Prioritization of glucose-lowering agents with proven cardiovascular benefits, notably sodium-glucose cotransporter 2 inhibitors (SGLT2i). Critically, the therapeutic value of SGLT2i extends beyond glycemic control and cardiovascular protection. Their efficacy aligns profoundly with the concept of the cardiorenal metabolic syndrome (CRMS), which recognizes the intricate interplay and share pathophysiological mechanisms linking T2DM, cardiovascular diseases, and chronic kidney disease (49). A multinational cohort study (N = 309,056) demonstrated that SGLT2i initiation significantly reduced HF hospitalization risk and all-cause mortality compared to alternative therapies (50). Importantly, landmark trials have consistently shown that SGLT2i also provide significant renoprotection, reducing the risk of worsening kidney function, end-stage kidney disease, and death from renal causes (51). This dual cardiorenal benefit uniquely positions SGLT2i as foundational therapy for patients with T2DM and DCM, who frequently exhibit features of CRMS.
The early initiation of SGLT2i in high-risk populations, particularly those identified with early-stage DCM within the spectrum of CRMS, remains a critical priority. Despite robust evidence supporting their cardioprotective efficacy, widespread clinical adoption of SGLT2i is hindered by cost-related barriers and limited accessibility in resource-constrained settings (52). To reconcile this disparity, risk stratification strategies leveraging predictive models offer a pragmatic solution: targeted prioritization of SGLT2i therapy for individuals identified with early-stage DCM and/or concomitant renal risk markers through validated risk algorithms. Furthermore, integrating predictive models into personalized medicine frameworks holds transformative potential. By synthesizing patient-specific clinical indicators (including those reflecting cardiorenal metabolic risk, such as albuminuria, eGFR trajectory, along with cardiac structural/functional parameters), these tools enable clinicians to formulate precision-guided management plans tailored to individual risk trajectories. This approach not only enhances therapeutic efficacy by addressing the multifaceted nature of CRMS but also optimizes healthcare resource utilization, ultimately improving patient-reported outcomes and quality of life.
Study limitations and future directions
Despite the insights provided, this study has several limitations. First, the single-center retrospective design resulted in a relatively limited sample size, potentially restricting the generalizability of the findings. Second, retrospective data collection introduces challenges in fully accounting for unmeasured confounders. To address these limitations, future research should validate the model’s validity and reliability through large-scale, multicenter prospective studies. Additionally, investigations into novel biomarkers and advanced imaging parameters are warranted to enhance predictive precision and clinical utility.
Conclusion
We developed a validated nomogram integrating clinical indicators (age, T2DM Duration, SBP, UACR) and echocardiographic parameters (LAD, LVPWd) to predict DCM risk in T2DM patients. This tool enables early risk stratification, supporting timely interventions to reduce heart failure progression. Further multicenter validation and integration of novel biomarkers are warranted to enhance clinical utility and address global diabetes-related cardiovascular burdens.
Data availability statement
The raw data supporting the conclusions of this article will be made available by the authors, without undue reservation.
Ethics statement
The studies involving humans were approved by The First Affiliated Hospital of Chongqing Medical University. The studies were conducted in accordance with the local legislation and institutional requirements. Written informed consent for participation was not required from the participants or the participants’ legal guardians/next of kin in accordance with the national legislation and institutional requirements. Written informed consent was obtained from the individual(s) for the publication of any potentially identifiable images or data included in this article.
Author contributions
ZL: Writing – review & editing, Methodology, Writing – original draft, Data curation, Validation. DP: Writing – review & editing, Methodology. TX: Data curation, Writing – original draft. WJ: Writing – review & editing, Software, Data curation. FQ: Writing – review & editing, Funding acquisition, Resources. JY: Funding acquisition, Resources, Writing – review & editing.
Funding
The author(s) declare financial support was received for the research and/or publication of this article. This work was supported by the Medical Scientific Research Project of Chongqing, China (No.2024GDRC012), the Natural Science Foundation of Chongqing, China (No.CSTB2023NSCQ-MSX0392), Chongqing Municipal Health Commission Project, China (No.2025cgjstg001).
Acknowledgments
We would like to express our gratitude to all participants for their involvement, as their contributions were essential to the successful completion of our research.
Conflict of interest
The authors declare that the research was conducted in the absence of any commercial or financial relationships that could be construed as a potential conflict of interest.
Generative AI statement
The author(s) declare that no Generative AI was used in the creation of this manuscript.
Publisher’s note
All claims expressed in this article are solely those of the authors and do not necessarily represent those of their affiliated organizations, or those of the publisher, the editors and the reviewers. Any product that may be evaluated in this article, or claim that may be made by its manufacturer, is not guaranteed or endorsed by the publisher.
References
1. Shah AD, Langenberg C, Rapsomaniki E, Denaxas S, Pujades-Rodriguez M, Gale CP, et al. Type 2 diabetes and incidence of cardiovascular diseases: A cohort study in 1·9 million people. Lancet Diabetes Endocrinol. (2015) 3:105–13. doi: 10.1016/s2213-8587(14)70219-0
2. Jia G, Hill MA, and Sowers JR. Diabetic cardiomyopathy: an update of mechanisms contributing to this clinical entity. Circ Res. (2018) 122:624–38. doi: 10.1161/circresaha.117.311586
3. Nakamura K, Miyoshi T, Yoshida M, Akagi S, Saito Y, Ejiri K, et al. Pathophysiology and treatment of diabetic cardiomyopathy and heart failure in patients with diabetes mellitus. Int J Mol Sci. (2022) 23(7):3587. doi: 10.3390/ijms23073587
4. Kannel WB and McGee DL. Diabetes and cardiovascular disease. Framingham Study JAMA. (1979) 241:2035–8. doi: 10.1001/jama.241.19.2035
5. Dandamudi S, Slusser J, Mahoney DW, Redfield MM, Rodeheffer RJ, and Chen HH. The prevalence of diabetic cardiomyopathy: A population-based study in olmsted county, minnesota. J Card Fail. (2014) 20:304–9. doi: 10.1016/j.cardfail.2014.02.007
6. Ritchie RH and Abel ED. Basic mechanisms of diabetic heart disease. Circ Res. (2020) 126:1501–25. doi: 10.1161/circresaha.120.315913
7. Wang M, Li Y, Li S, and Lv J. Endothelial dysfunction and diabetic cardiomyopathy. Front Endocrinol (Lausanne). (2022) 13:851941. doi: 10.3389/fendo.2022.851941
8. Jia G, DeMarco VG, and Sowers JR. Insulin resistance and hyperinsulinaemia in diabetic cardiomyopathy. Nat Rev Endocrinol. (2016) 12:144–53. doi: 10.1038/nrendo.2015.216
9. Tan Y, Zhang Z, Zheng C, Wintergerst KA, Keller BB, and Cai L. Mechanisms of diabetic cardiomyopathy and potential therapeutic strategies: preclinical and clinical evidence. Nat Rev Cardiol. (2020) 17:585–607. doi: 10.1038/s41569-020-0339-2
10. Boudina S and Abel ED. Diabetic cardiomyopathy revisited. Circulation. (2007) 115:3213–23. doi: 10.1161/circulationaha.106.679597
11. Dillmann WH. Diabetic cardiomyopathy. Circ Res. (2019) 124:1160–2. doi: 10.1161/circresaha.118.314665
12. From AM, Scott CG, and Chen HH. The development of heart failure in patients with diabetes mellitus and pre-clinical diastolic dysfunction a population-based study. J Am Coll Cardiol. (2010) 55:300–5. doi: 10.1016/j.jacc.2009.12.003
13. Kane GC, Karon BL, Mahoney DW, Redfield MM, Roger VL, Burnett JC Jr., et al. Progression of left ventricular diastolic dysfunction and risk of heart failure. Jama. (2011) 306:856–63. doi: 10.1001/jama.2011.1201
14. Seferović PM and Paulus WJ. Clinical diabetic cardiomyopathy: A two-faced disease with restrictive and dilated phenotypes. Eur Heart J. (2015) 36:1718–27. doi: 10.1093/eurheartj/ehv134
15. Adel FW and Chen HH. The role of multimodality imaging in diabetic cardiomyopathy: A brief review. Front Endocrinol (Lausanne). (2024) 15:1405031. doi: 10.3389/fendo.2024.1405031
16. Chen Y, Yu M, Lan Y, Feng F, and Jiang C. Development of a nomogram for predicting the risk of left ventricular diastolic function in subjects with type-2 diabetes mellitus. Int J Cardiovasc Imaging. (2022) 38:15–23. doi: 10.1007/s10554-021-02338-5
17. Hao M, Huang X, Liu X, Fang X, Li H, Lv L, et al. Novel model predicts diastolic cardiac dysfunction in type 2 diabetes. Ann Med. (2023) 55:766–77. doi: 10.1080/07853890.2023.2180154
18. ElSayed NA, Aleppo G, Aroda VR, Bannuru RR, Brown FM, Bruemmer D, et al. 2. Classification and diagnosis of diabetes: standards of care in diabetes-2023. Diabetes Care. (2023) 46(Suppl 1):S19–s40. doi: 10.2337/dc23-S002
19. Seferović PM, Paulus WJ, Rosano G, Polovina M, Petrie MC, Jhund PS, et al. Diabetic myocardial disorder. A clinical consensus statement of the heart failure association of the esc and the esc working group on myocardial & Pericardial diseases. Eur J Heart Fail. (2024) 26:1893–903. doi: 10.1002/ejhf.3347
20. Nagueh SF, Smiseth OA, Appleton CP, Byrd BF 3rd, Dokainish H, Edvardsen T, et al. Recommendations for the evaluation of left ventricular diastolic function by echocardiography: an update from the american society of echocardiography and the european association of cardiovascular imaging. J Am Soc Echocardiogr. (2016) 29:277–314. doi: 10.1016/j.echo.2016.01.011
21. Stevens LA, Claybon MA, Schmid CH, Chen J, Horio M, Imai E, et al. Evaluation of the chronic kidney disease epidemiology collaboration equation for estimating the glomerular filtration rate in multiple ethnicities. Kidney Int. (2011) 79:555–62. doi: 10.1038/ki.2010.462
22. Devereux RB, Alonso DR, Lutas EM, Gottlieb GJ, Campo E, Sachs I, et al. Echocardiographic assessment of left ventricular hypertrophy: comparison to necropsy findings. Am J Cardiol. (1986) 57:450–8. doi: 10.1016/0002-9149(86)90771-x
23. Peduzzi P, Concato J, Kemper E, Holford TR, and Feinstein AR. A simulation study of the number of events per variable in logistic regression analysis. J Clin Epidemiol. (1996) 49:1373–9. doi: 10.1016/s0895-4356(96)00236-3
24. Marwick TH, Ritchie R, Shaw JE, and Kaye D. Implications of underlying mechanisms for the recognition and management of diabetic cardiomyopathy. J Am Coll Cardiol. (2018) 71:339–51. doi: 10.1016/j.jacc.2017.11.019
25. Pandey A, Vaduganathan M, Patel KV, Ayers C, Ballantyne CM, Kosiborod MN, et al. Biomarker-Based Risk Prediction of Incident Heart failure in Pre-Diabetes And diabetes. JACC Heart Fail. (2021) 9:215–23. doi: 10.1016/j.jchf.2020.10.013
26. Lakatta EG and Levy D. Arterial and cardiac aging: major shareholders in cardiovascular disease enterprises: part ii: the aging heart in health: links to heart disease. Circulation. (2003) 107:346–54. doi: 10.1161/01.cir.0000048893.62841.f7
27. Segar MW, Vaduganathan M, Patel KV, McGuire DK, Butler J, Fonarow GC, et al. Machine learning to predict the risk of incident heart failure hospitalization among patients with diabetes: the watch-dm risk score. Diabetes Care. (2019) 42:2298–306. doi: 10.2337/dc19-0587
28. Yang X, Ma RC, So WY, Kong AP, Ko GT, Ho CS, et al. Development and validation of a risk score for hospitalization for heart failure in patients with type 2 diabetes mellitus. Cardiovasc Diabetol. (2008) 7:9. doi: 10.1186/1475-2840-7-9
29. de Jong M, Woodward M, and Peters SAE. Duration of diabetes and the risk of major cardiovascular events in women and men: A prospective cohort study of uk biobank participants. Diabetes Res Clin Pract. (2022) 188:109899. doi: 10.1016/j.diabres.2022.109899
30. Fox CS, Sullivan L, D'Agostino RB Sr., and Wilson PW. The significant effect of diabetes duration on coronary heart disease mortality: the framingham heart study. Diabetes Care. (2004) 27:704–8. doi: 10.2337/diacare.27.3.704
31. Zoungas S, Woodward M, Li Q, Cooper ME, Hamet P, Harrap S, et al. Impact of age, age at diagnosis and duration of diabetes on the risk of macrovascular and microvascular complications and death in type 2 diabetes. Diabetologia. (2014) 57:2465–74. doi: 10.1007/s00125-014-3369-7
32. Jia G, Whaley-Connell A, and Sowers JR. Diabetic cardiomyopathy: A hyperglycaemia- and insulin-resistance-induced heart disease. Diabetologia. (2018) 61:21–8. doi: 10.1007/s00125-017-4390-4
33. Petrie JR, Guzik TJ, and Touyz RM. Diabetes, hypertension, and cardiovascular disease: clinical insights and vascular mechanisms. Can J Cardiol. (2018) 34(5):575–84. doi: 10.1016/j.cjca.2017.12.005
34. Pechère-Bertschi A, Greminger P, Hess L, Philippe J, and Ferrari P. Swiss hypertension and risk factor program (Sharp): cardiovascular risk factors management in patients with type 2 diabetes in Switzerland. Blood Press. (2005) 14:337–44. doi: 10.1080/08037050500340018
35. Zheng C, Chen Z, Zhang L, Wang X, Dong Y, Wang J, et al. Metabolic risk factors and left ventricular diastolic function in middle-aged chinese living in the tibetan plateau. J Am Heart Assoc. (2019) 8:e010454. doi: 10.1161/jaha.118.010454
36. Jørgensen PG, Jensen MT, Biering-Sørensen T, Mogelvang R, Fritz-Hansen T, Vilsbøll T, et al. Burden of uncontrolled metabolic risk factors and left ventricular structure and function in patients with type 2 diabetes mellitus. J Am Heart Assoc. (2018) 7:e008856. doi: 10.1161/jaha.118.008856
37. Gross JL, de Azevedo MJ, Silveiro SP, Canani LH, Caramori ML, and Zelmanovitz T. Diabetic nephropathy: diagnosis, prevention, and treatment. Diabetes Care. (2005) 28:164–76. doi: 10.2337/diacare.28.1.164
38. Jørgensen PG, Biering-Sørensen T, Mogelvang R, Fritz-Hansen T, Vilsbøll T, Rossing P, et al. Presence of micro- and macroalbuminuria and the association with cardiac mechanics in patients with type 2 diabetes. Eur Heart J Cardiovasc Imaging. (2018) 19:1034–41. doi: 10.1093/ehjci/jex231
39. Kramer H, Jacobs DR Jr., Bild D, Post W, Saad MF, Detrano R, et al. Urine albumin excretion and subclinical cardiovascular disease. The multi-ethnic study of atherosclerosis. Hypertension. (2005) 46:38–43. doi: 10.1161/01.Hyp.0000171189.48911.18
40. Marwick TH, Gillebert TC, Aurigemma G, Chirinos J, Derumeaux G, Galderisi M, et al. Recommendations on the use of echocardiography in adult hypertension: A report from the european association of cardiovascular imaging (Eacvi) and the american society of echocardiography (Ase)†. Eur Heart J Cardiovasc Imaging. (2015) 16:577–605. doi: 10.1093/ehjci/jev076
41. Segar MW, Khan MS, Patel KV, Butler J, Tang WHW, Vaduganathan M, et al. Prevalence and prognostic implications of diabetes with cardiomyopathy in community-dwelling adults. J Am Coll Cardiol. (2021) 78:1587–98. doi: 10.1016/j.jacc.2021.08.020
42. Wang Y, Yang H, Huynh Q, Nolan M, Negishi K, and Marwick TH. Diagnosis of nonischemic stage B heart failure in type 2 diabetes mellitus: optimal parameters for prediction of heart failure. JACC Cardiovasc Imaging. (2018) 11:1390–400. doi: 10.1016/j.jcmg.2018.03.015
43. Segar MW, Usman MS, Patel KV, Khan MS, Butler J, Manjunath L, et al. Development and validation of a machine learning-based approach to identify high-risk diabetic cardiomyopathy phenotype. Eur J Heart Fail. (2024) 26:2183–92. doi: 10.1002/ejhf.3443
44. Ding M, Shi R, Du Y, Chang P, Gao T, De D, et al. O-glcnacylation-mediated endothelial metabolic memory contributes to cardiac damage via small extracellular vesicles. Cell Metab. (2025) 37:1344–63.e6. doi: 10.1016/j.cmet.2025.03.006
45. Fang Q, Shi J, Zhang J, Peng Y, Liu C, Wei X, et al. Visit-to-visit hba1c variability is associated with aortic stiffness progression in participants with type 2 diabetes. Cardiovasc Diabetol. (2023) 22:167. doi: 10.1186/s12933-023-01884-7
46. Galis P, Bartosova L, Farkasova V, Bartekova M, Ferenczyova K, and Rajtik T. Update on clinical and experimental management of diabetic cardiomyopathy: addressing current and future therapy. Front Endocrinol (Lausanne). (2024) 15:1451100. doi: 10.3389/fendo.2024.1451100
47. Chen L, Pei JH, Kuang J, Chen HM, Chen Z, Li ZW, et al. Effect of lifestyle intervention in patients with type 2 diabetes: A meta-analysis. Metabolism. (2015) 64:338–47. doi: 10.1016/j.metabol.2014.10.018
48. Kemps H, Kränkel N, Dörr M, Moholdt T, Wilhelm M, Paneni F, et al. Exercise training for patients with type 2 diabetes and cardiovascular disease: what to pursue and how to do it. A position paper of the european association of preventive cardiology (Eapc). Eur J Prev Cardiol. (2019) 26:709–27. doi: 10.1177/2047487318820420
49. Giugliano D, Longo M, Scappaticcio L, Caruso P, and Esposito K. Sodium-glucose transporter-2 inhibitors for prevention and treatment of cardiorenal complications of type 2 diabetes. Cardiovasc Diabetol. (2021) 20:17. doi: 10.1186/s12933-021-01213-w
50. Kosiborod M, Cavender MA, Fu AZ, Wilding JP, Khunti K, Holl RW, et al. Lower risk of heart failure and death in patients initiated on sodium-glucose cotransporter-2 inhibitors versus other glucose-lowering drugs: the cvd-real study (Comparative effectiveness of cardiovascular outcomes in new users of sodium-glucose cotransporter-2 inhibitors). Circulation. (2017) 136:249–59. doi: 10.1161/circulationaha.117.029190
51. Dharia A, Khan A, Sridhar VS, and Cherney DZI. Sglt2 inhibitors: the sweet success for kidneys. Annu Rev Med. (2023) 74:369–84. doi: 10.1146/annurev-med-042921-102135
52. Zelniker TA, Wiviott SD, Raz I, Im K, Goodrich EL, Bonaca MP, et al. Sglt2 inhibitors for primary and secondary prevention of cardiovascular and renal outcomes in type 2 diabetes: A systematic review and meta-analysis of cardiovascular outcome trials. Lancet. (2019) 393:31–9. doi: 10.1016/s0140-6736(18)32590-x
Keywords: diabetic cardiomyopathy, type 2 diabetes mellitus, nomogram, risk prediction model, echocardiographic
Citation: Luo Z, Pi D, Xi T, Jiang W, Qiu F and Yang J (2025) Predicting diabetic cardiomyopathy in type 2 diabetes: development and validation of a nomogram based on clinical and echocardiographic parameters. Front. Endocrinol. 16:1641114. doi: 10.3389/fendo.2025.1641114
Received: 04 June 2025; Accepted: 22 July 2025;
Published: 08 August 2025.
Edited by:
Ramoji Kosuru, Versiti Blood Research Institute, United StatesReviewed by:
Qinan Wu, Dazu Hospital of Chongqing Medical University, Chinaİnci Tuğçe Çöllüoğlu, Karabuk Universitesi, Türkiye
Copyright © 2025 Luo, Pi, Xi, Jiang, Qiu and Yang. This is an open-access article distributed under the terms of the Creative Commons Attribution License (CC BY). The use, distribution or reproduction in other forums is permitted, provided the original author(s) and the copyright owner(s) are credited and that the original publication in this journal is cited, in accordance with accepted academic practice. No use, distribution or reproduction is permitted which does not comply with these terms.
*Correspondence: Feng Qiu, OTIzMTg5NDAwQHFxLmNvbQ==; Jiadan Yang, MjAyNjMyQGhvc3BpdGFsLmNxbXUuZWR1LmNu
†These authors have contributed equally to this work