Abstract
Purpose:
To examine how baseline insulin resistance (IR) modulates exercise-induced changes in systemic immune-inflammation index (SII) and metabolic parameters in type 2 diabetes mellitus (T2DM).
Methods:
Fifty-five T2DM patients stratified by fasting C-peptide tertiles into low- (Group 1), moderate- (Group 2), and high-IR groups (Group 3) completed a 4-week moderate-intensity combined aerobic-resistance exercise program. Changes in SII (neutrophils × platelets/lymphocytes), anthropometrics, and glucolipid markers were assessed, with ANCOVA and hierarchical regression modeling intergroup differences and predictors (Clinical Trial Registration ID: ChiCTR2200066710).
Results:
Significant reductions in weight, BMI, and body fat% occurred in Group 1/Group 2 (all p<0.05) but not Group 3. SII decreased in Group 1 (p<0.05) yet increased in Group 3 due to neutrophil elevation (p<0.05). Fasting glucose and HbA1c improved across all groups (p<0.05), with Group 3’s glycemic benefits independent of weight loss or anti-inflammatory effects. Baseline C-peptide independently predicted increases in ΔSII across all adjusted models (β=19.85–21.94, p<0.01), whereas covariates including age, diabetes duration, and BMI showed no significant effects.
Conclusion:
Severe baseline IR attenuates exercise-mediated SII improvement and body composition optimization, whereas glycemic benefits remain IR-independent, necessitating IR-stratified exercise prescriptions.
Clinical trial registration:
Chinese Clinical Trial Registry, identifier ChiCTR2200066710.
1 Introduction
Chronic inflammation is recognized as a core pathological basis for the development of multiple chronic diseases, arising from complex interactions among social, environmental, and behavioral factors (1). Systemic chronic inflammation (SCI), through sustained activation of immune response pathways, constitutes a shared risk factor for major noncommunicable diseases including cardiovascular disease, malignancy, type 2 diabetes mellitus (T2DM) (2). Substantial evidence confirms that immune cells—such as macrophages, neutrophils, monocytes, and platelets—participate in systemic inflammatory responses and contribute to T2DM progression and its complications (3). Upon activation, these cells produce proinflammatory cytokines (e.g., IL-8, IL-6, IL-1β), which have been documented to correlate with adverse clinical outcomes in diabetes, including cardiovascular events and nephropathy (4–6).
The molecular mechanisms through which systemic inflammation promotes the development and progression of T2DM are increasingly being elucidated. At the cellular level, key inflammatory signaling pathways, particularly the nuclear factor kappa-B (NF-κB) and c-Jun N-terminal kinase (JNK) pathways, have been identified as central connectors linking inflammation to insulin resistance (7–12). In metabolic tissues such as adipose tissue, liver, and skeletal muscle, nutrient excess and metabolic stress trigger the activation of immune cells (e.g., a shift to M1 macrophages) and the production of pro-inflammatory cytokines like tumor necrosis factor-alpha (TNF-α) and interleukin-1beta (IL-1β) (13–16). These cytokines, in turn, can directly impair insulin signaling by inducing serine phosphorylation of insulin receptor substrate (IRS) proteins, which suppresses their normal tyrosine phosphorylation and impedes the downstream translocation of glucose transporter 4 (GLUT4), ultimately leading to cellular glucose uptake deficiency (17, 18). Concurrently, within pancreatic islets, these systemic inflammatory mediators can induce β-cell apoptosis and dysfunction, further compromising insulin secretion and establishing a vicious cycle that propels the progression from insulin resistance to overt diabetes (19, 20). Therefore, targeting these underlying inflammatory processes presents a promising therapeutic strategy for T2DM management.
With advances in inflammation biology, peripheral blood inflammatory biomarkers have gained increasing clinical relevance. Among these, the Systemic Immune-Inflammation Index (SII)—a novel composite metric integrating neutrophil, lymphocyte, and platelet counts—provides a comprehensive assessment of immune-inflammatory homeostasis. Its unique capability to evaluate the global regulatory effects of systemic interventions (e.g., exercise) on inflammatory networks has garnered significant attention in disease risk prediction and monitoring (21–24).
Insulin resistance (IR) represents a fundamental pathological mechanism in T2DM (25, 26). Although the precise molecular pathways underlying IR remain incompletely defined, compelling evidence establishes a bidirectional interplay between systemic inflammation and IR, wherein immune dysregulation plays a pivotal pathogenic role (27, 28). While the hyperinsulinemic-euglycemic clamp remains the gold standard for IR quantification, its technical complexity and high cost limit clinical applicability (29). Consequently, fasting C-peptide - an equimolar byproduct of proinsulin cleavage - serves as our preferred biomarker due to its extended half-life (20–30 min vs. insulin’s 3–5 min), absence of hepatic first-pass metabolism, and superior reliability in evaluating endogenous insulin secretion (30, 31). Leveraging the heterogeneity of IR in T2DM, we innovatively implemented a C-peptide-based stratification strategy to investigate differential responses to exercise interventions.
Exercise therapy is recommended as first-line management for T2DM in international guidelines. However, existing research predominantly focuses on glucolipid metabolic improvements, leaving significant gaps in understanding its systemic anti-inflammatory mechanisms. Notably, although both aerobic and resistance training demonstrate independent anti-inflammatory benefits (32–34), the combined effects of these modalities on SII remain systematically unexamined in IR-stratified T2DM populations. This study therefore implements a 4-week combined aerobic-resistance training intervention. Through longitudinal tracking of SII dynamics, we aim to quantify regulatory effects of combined exercise on systemic immune-inflammation (measured by SII), determine their modulation by baseline metabolic determinants (C-peptide levels, IR severity, HbA1c/FPG), and generate evidence for optimizing T2DM exercise prescriptions.
2 Materials and methods
2.1 Study participants
A total of 68 adults with T2DM were consecutively recruited from the Department of Endocrinology, Yangpu District Central Hospital (Shanghai, China) between March and October 2024. All participants provided written informed consent after comprehensive explanation of study objectives, procedures, and potential risks. The study protocol was conducted in accordance with the Declaration of Helsinki and approved by the Medical Ethics Committee of Yangpu District Central Hospital (Approval No.: LL-2023-KXJS-004). This trial was prospectively registered at the Chinese Clinical Trial Registry (Registration ID: ChiCTR2200066710) to ensure methodological transparency.
2.1.1 Inclusion criteria
(1) Diagnosis: Defined by the 2020 Chinese Guidelines for Prevention and Treatment of T2DM with≥1 criterion: Classic symptoms (polyuria, polydipsia, weight loss) and random plasma glucose≥11.1 mmol/L; Fasting plasma glucose (FPG) ≥7.0 mmol/L; 2-h postprandial glucose≥11.1 mmol/L during oral glucose tolerance test (OGTT); Glycated hemoglobin (HbA1c) ≥6.5%; (2) Demographics: Age 30–69 years; (3) Glycemic control: FPG ≤ 16.0 mmol/L during preceding 3 months without recurrent hypoglycemia (<2 episodes/month); (4) Sedentary lifestyle: No regular exercise (<2 sessions/week, <30 min/session) in prior 3 months; (5) Disease duration: T2DM duration ≤ 5 years.
2.1.2 Exclusion criteria
(1) Type 1 diabetes, gestational diabetes, or other specific diabetes types; (2) Psychiatric disorders, communication barriers, or motor dysfunction (e.g., hemiplegia, amputation); (3) Acute infections during baseline or intervention periods; (4) Severe diabetic complications (retinopathy, nephropathy, neuropathy, or macrovascular disease).
2.1.3 Sample size estimation
Using G*Power 3.1 with a priori analysis for dependent t-tests (two-tailed α=0.05, effect size dz=0.5, power=95%), the minimum required sample size was 54 participants (df=53, noncentrality parameter δ=3.674). Accounting for 20% anticipated attrition, 68 participants were enrolled.
2.2 Study design
This study employed a pre-post controlled design (Figure 1). Baseline assessments included demographic data (age, gender), diabetes duration, and medication history. All participants completed a 4-week moderate-intensity combined aerobic and resistance exercise intervention. Venous blood samples were collected pre- and post-intervention for biochemical analyses (FPG, HbA1c, blood lipids, C-peptide, fasting insulin (FINS), neutrophils, lymphocytes, platelets) and calculation of IR indices (HOMA-IR, TyG index) along with β-cell function assessment (HOMA-β). Anthropometric measurements (body weight, BMI, body fat percentage, lean body mass) were concurrently obtained.
Figure 1
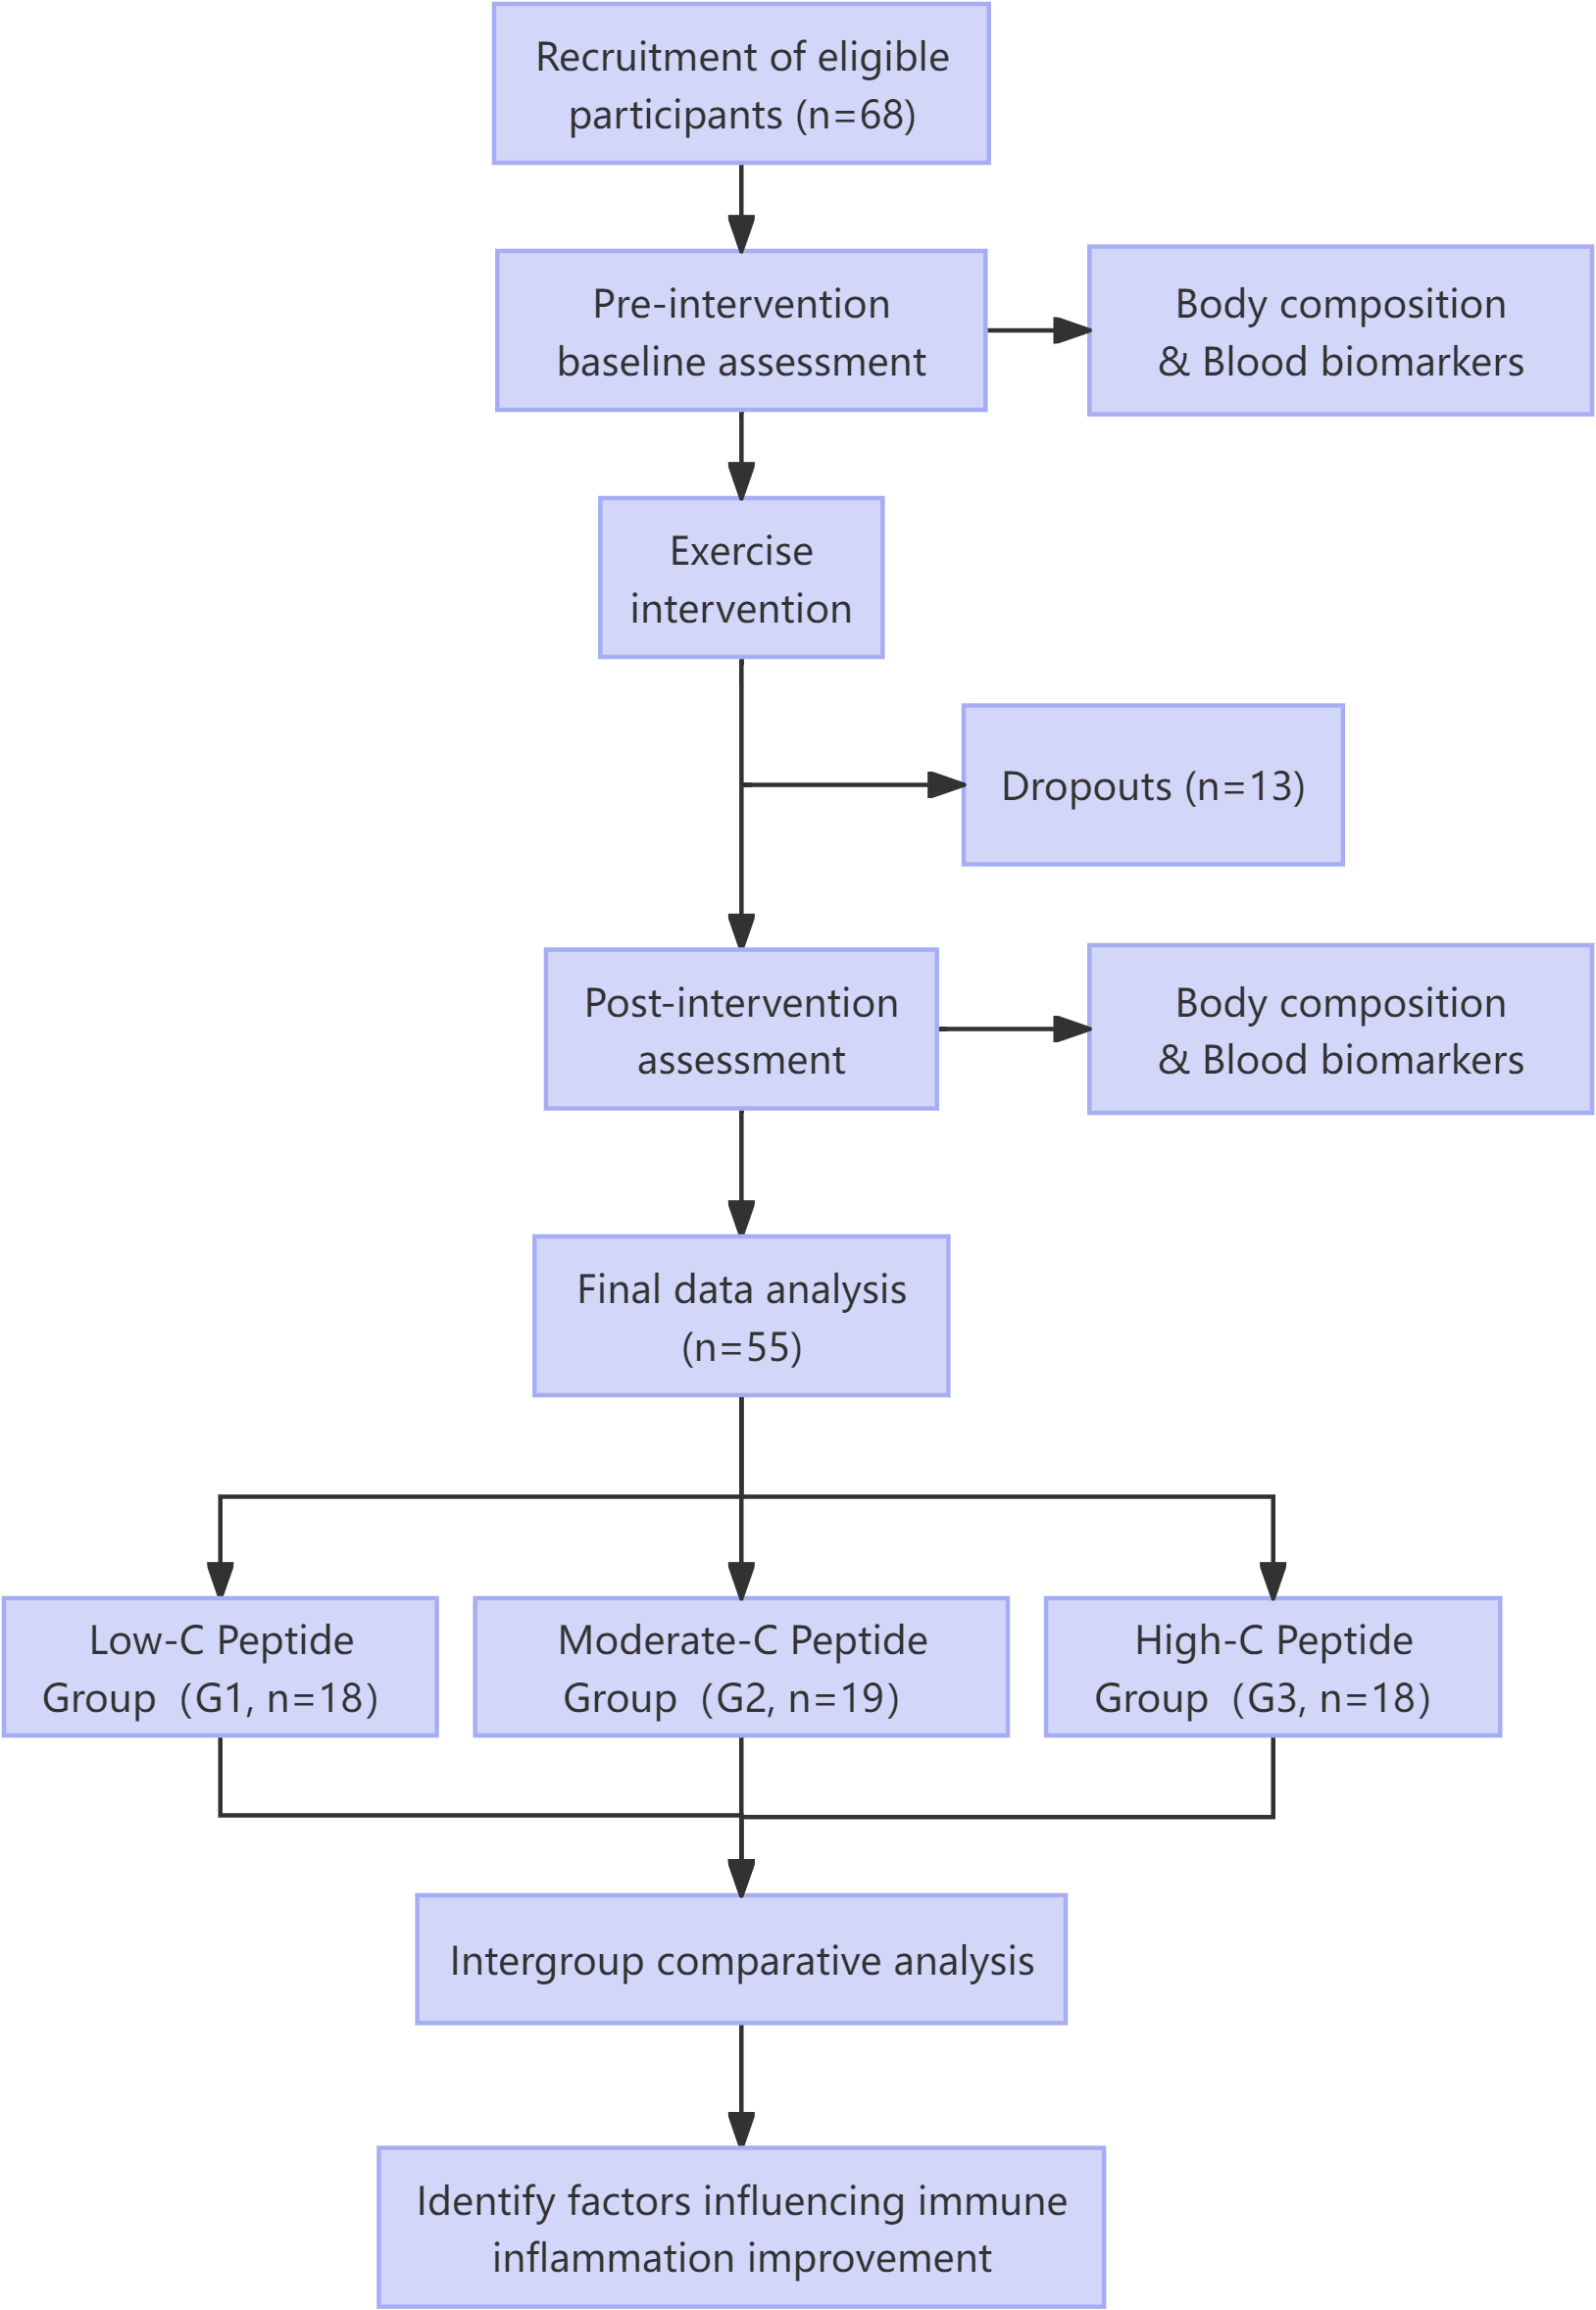
Study flowchart.
2.3 Intervention protocol
The exercise intervention was designed as a combined training regimen in strict accordance with the 2022 American College of Sports Medicine (ACSM) guidelines for T2DM management. This integrated program included aerobic, resistance, balance, and flexibility components to elicit comprehensive physiological benefits. Under the supervision of certified exercise rehabilitation specialists, participants underwent a 4-week program consisting of three 60–75-minute sessions per week (schedule: Monday, Wednesday, Friday, 19:00–20:30). The intensity of aerobic exercise was maintained at 50–60% of heart rate reserve, monitored in real-time using Polar H10 chest-strap monitors.
Each session was structured as follows:
-
Warm-up (10 minutes): Dynamic stretching and light aerobic activities to prepare the neuromuscular system.
-
Aerobic Exercise (30 minutes): Treadmill walking or cycling at 50–60% heart rate reserve.
-
Resistance Training (20–25 minutes): Two sets of 10–15 repetitions targeting major muscle groups, using resistance bands and body weight.
-
Balance and Flexibility Cooldown (10 minutes): Static stretching for major muscle groups, combined with balance exercises (e.g., single-leg stands).
Throughout the study, participants maintained their habitual dietary intake. Adherence to the protocol was strictly monitored, and only those who completed at least 80% of the sessions (≥10 out of 12 sessions) were included in the final analysis. Identical assessments were conducted before and after the intervention.
2.4 Metabolic parameter calculations
2.4.1 Systemic immune-inflammation index
2.4.2 Insulin resistance indices
2.4.3 β-Cell function indices
2.5 Statistical analysis
Data were analyzed using SPSS 27.0 and GraphPad Prism 9.0. Continuous variables underwent normality assessment via Shapiro-Wilk tests, with normally distributed parameters reported as mean ± standard deviation and non-normally distributed variables as median (interquartile range). Within-group pre-post comparisons were performed using paired t-tests for normally distributed data and Wilcoxon signed-rank tests for non-normal distributions. Participants stratified by baseline C-peptide tertiles (Group 1/2/3) were compared using ANCOVA with baseline values as covariates to evaluate intergroup differences in intervention effects, applying Bonferroni correction for multiple comparisons (α = 0.05, two-tailed). Correlation analyses between baseline C-peptide and ΔSII employed Pearson’s or Spearman’s methods based on data distribution. Hierarchical multiple linear regression models were constructed to determine baseline C-peptide’s independent predictive value for ΔSII: Model 1 (unadjusted), Model 2 (adjusted for gender/age), Model 3 (additional adjustment for diabetes duration), and Model 4 (full adjustment including BMI).
3 Results
Among the initial cohort of 68 enrolled participants, 10 discontinued the 4-week intervention (<10 attendance sessions) and 3 were excluded due to upper respiratory infections (n=2) or dermatitis (n=1) that could confound hematological measurements. Ultimately, 55 participants completed the intervention with full data collection. Participants were stratified into three groups by baseline fasting C-peptide levels: lowest (Group 1, n=18), intermediate (Group 2, n=19), and highest (Group 3, n=18).
3.1 Baseline characteristics
C-peptide levels in Groups 1 and 2 were within normal range (0.8-4.2 ng/mL; Group 1: 1.25 [1.12, 1.34]; Group 2: 2.09 [1.81, 2.83]), while Group 3 levels predominantly exceeded this range (3.92 [3.50, 5.40]). Group 3 demonstrated significantly higher FINS (22.41 [17.32, 32.82]) and HOMA-IR (8.09 [5.15, 10.93]) versus Groups 1-2 (p<0.05). The triglyceride-glucose index (TyG) and HOMA-β were also significantly elevated in Group 3 compared to other groups. Additionally, Group 3 exhibited significantly greater body weight, BMI, body fat percentage, lean body mass, and triglycerides (TG) than Group 1 (p<0.05). No significant intergroup differences (p>0.05) were observed in gender, age, T2D duration, glucose, HbA1c, total cholesterol (TC), high-density lipoprotein cholesterol (HDL-C), low-density lipoprotein cholesterol (LDL-C), or SII, confirming baseline comparability (Table 1).
Table 1
| Variables | Total | Group 1 | Group 2 | Group 3 | Statistic | p |
|---|---|---|---|---|---|---|
| N | 55 | 18 | 19 | 18 | ||
| male/female (n) | 35/20 | 9/9 | 14/5 | 12/6 | χ²=2.35 | 0.309 |
| Age (years) | 46.53 ± 11.93 | 48.33 ± 12.49 | 49.58 ± 11.85 | 41.50 ± 10.35 | F=2.57 | 0.087 |
| T2D duration (years) | 2.67 ± 1.17 | 2.56 ± 1.47 | 2.95 ± 0.81 | 2.50 ± 1.15 | F=0.81 | 0.451 |
| Weight (kg) | 77.39 ± 16.19 | 66.94 ± 13.65a | 79.22 ± 14.47b | 85.91 ± 15.10b | F=8.02 | <.001 |
| BMI | 27.50 ± 4.91 | 24.55 ± 5.10a | 28.04 ± 4.43ab | 29.89 ± 3.79b | F=6.64 | 0.003 |
| BFP (%) | 29.99 ± 7.76 | 26.77 ± 8.28a | 30.10 ± 7.19ab | 33.10 ± 6.82b | F=3.25 | 0.047 |
| LBM (kg) | 50.72 ± 10.77 | 45.35 ± 7.19a | 51.59 ± 10.57ab | 55.17 ± 12.10b | F=4.31 | 0.019 |
| HbA1c (%) | 6.90 (6.25, 7.50) | 6.65 (6.12, 7.38) | 7.00 (6.45, 7.45) | 7.10 (6.50, 7.88) | χ²=1.76 | 0.415 |
| FPG (mmol/L) | 6.52 (5.63, 8.04) | 6.42 (5.84, 7.10) | 6.45 (5.44, 8.21) | 6.84 (6.13, 8.78) | χ²=0.70 | 0.703 |
| C Peptide (ng/mL) | 2.09 (1.38, 3.44) | 1.25 (1.12, 1.34)a | 2.09 (1.81, 2.83)a | 3.92 (3.50, 5.40)b | χ²=48.01 | <.001 |
| FINS (μIU/ml) | 9.56 (5.17, 16.91) | 5.00 (3.97, 6.05)a | 8.97 (6.38, 11.46)a | 22.41 (17.32, 32.82)b | χ²=31.77 | <.001 |
| HOMA-IR | 2.51 (1.45, 5.48) | 1.45 (1.14, 1.95)a | 2.51 (1.60, 3.36)a | 8.09 (5.15, 10.93)b | χ²=29.23 | <.001 |
| HOMA-β | 57.47 (31.78, 125.82) | 32.70 (20.52, 43.70) a | 45.27 (31.78, 104.40) a | 128.99 (74.84, 192.36) b | χ²=22.93 | <.001 |
| TyG Index | 9.05 ± 0.58 | 8.80 ± 0.46 a | 8.93 ± 0.44 a | 9.43 ± 0.65 b | F=7.24 | 0.002 |
| TC (mmol/L) | 5.26 ± 1.19 | 5.19 ± 1.25 | 5.26 ± 1.20 | 5.32 ± 1.19 | F=0.05 | 0.947 |
| TG (mmol/L) | 1.62 (1.10, 1.99) | 1.15 (0.92, 1.62)a | 1.52 (1.11, 1.78)a | 2.01 (1.66, 2.79)b | χ²=14.38 | <.001 |
| HDL-C (mmol/L) | 1.33 ± 0.32 | 1.39 ± 0.29 | 1.41 ± 0.38 | 1.19 ± 0.22 | F=2.82 | 0.069 |
| LDL-C (mmol/L) | 3.29 ± 0.79 | 3.15 ± 0.93 | 3.14 ± 0.71 | 3.59 ± 0.66 | F=1.94 | 0.154 |
| NC (10^9/L) | 3.86 ± 1.07 | 3.96 ± 1.29 | 4.07 ± 0.97 | 3.54 ± 0.88 | F=1.30 | 0.282 |
| PC (10^9/L) | 251.71 ± 74.23 | 263.33 ± 51.13 | 234.11 ± 101.20 | 258.67 ± 59.18 | F=0.83 | 0.442 |
| LC (10^9/L) | 2.13 (1.79, 2.44) | 1.96 (1.68, 2.38) | 2.01 (1.79, 2.41) | 2.29 (2.09, 2.50) | χ²=2.34 | 0.310 |
| SII Index | 440.56 ± 177.44 | 495.20 ± 167.70 | 414.84 ± 145.74 | 413.08 ± 211.42 | F=1.28 | 0.286 |
Baseline characteristics of participants.
Data are presented as mean ± standard deviation (SD) for normally distributed continuous variables, and as median (interquartile range) for non-normally distributed continuous variables. Categorical variables are presented as counts.
Statistical tests for group comparisons: One-Way ANOVA (reporting F value) was used for normally distributed continuous variables; the Kruskal-Wallis H test (reporting χ² value) was used for non-normally distributed continuous variables; the chi-squared test (reporting χ² value) was used for categorical variables.
The lowercase letters (e.g., “a”, “b”, “ab”) in the table indicate the results of pairwise comparisons between groups. Groups sharing at least one identical letter are not statistically different (e.g., Group 1 (“a”) and Group 2 (“ab”) share the letter “a”, indicating no significant difference). Conversely, groups without any shared letters (e.g., Group 1 (“a”) and Group 3 (“b”) are significantly different.
BMI, Body Mass Index; BFP, Body Fat Percentage; LBM, Lean Body Mass; HbA1c, Glycated Hemoglobin; FPG, Fasting Plasma Glucose; FINS, Fasting Insulin; HOMA-IR, Homeostatic Model Assessment of Insulin Resistance; TC, Total Cholesterol; TG, Triglycerides; HDL-C, High-Density Lipoprotein Cholesterol; LDL-C, Low-Density Lipoprotein Cholesterol; NC, Neutrophil Count; PC, Platelet Count; LC, Lymphocyte Count; SII, Systemic Immune-Inflammation Index.
3.2 Pre-post intervention outcomes
Following a four-week exercise intervention, the baseline measures were reassessed. Comparisons between pre- and post-intervention are detailed in Table 2.
Table 2
| Variables | Assessment | Group1(n=18) | p | Group2(n=19) | p | Group3(n=18) | p |
|---|---|---|---|---|---|---|---|
| Weight (kg) | pre | 66.94 ± 13.65 | < 0.01** | 79.22 ± 14.47 | < 0.01** | 85.91 ± 15.10 | ns |
| post | 65.18 ± 12.33 | 77.55 ± 13.83 | 85.14 ± 15.66 | ||||
| BMI | pre | 24.55 ± 5.10 | < 0.05* | 28.04 ± 4.43 | < 0.01** | 29.89 ± 3.79 | ns |
| post | 23.91 ± 4.57 | 27.43 ± 4.20 | 29.61 ± 3.70 | ||||
| BFP (%) | pre | 26.77 ± 8.28 | < 0.01** | 30.10 ± 7.19 | < 0.01** | 33.10 ± 6.82 | ns |
| post | 25.43 ± 8.28 | 28.84 ± 7.30 | 32.23 ± 6.53 | ||||
| LBM (kg) | pre | 45.35 ± 7.19 | ns | 51.59 ± 10.57 | ns | 55.17 ± 12.10 | ns |
| post | 45.27 ± 7.85 | 51.65 ± 10.52 | 55.07 ± 12.76 | ||||
| HbA1c (%) | pre | 6.65(6.10, 7.40) | < 0.05* | 7.00(6.40, 7.50) | < 0.01** | 7.10(6.45, 8.08) | < 0.001*** |
| post | 6.25(5.90, 6.78) | 6.40(5.90, 6.70) | 5.85(5.40, 6.78) | ||||
| FPG (mmol/L) | pre | 6.42(5.76, 7.29) | < 0.05* | 6.45(5.39, 8.33) | ns | 6.85(6.11, 9.16) | = 0.01* |
| post | 6.01(5.28, 7.00) | 6.25(5.65, 6.68) | 5.96(5.55, 6.88) | ||||
| C peptide (ng/mL) | pre | 1.25(1.08, 1.36) | ns | 2.09(1.76, 2.94) | < 0.01** | 3.92(3.47, 5.61) | < 0.01** |
| post | 1.50(1.08, 2.00) | 1.88(1.58, 2.21) | 3.59(2.58, 4.61) | ||||
| FINS (μIU/ml) | pre | 5.00(3.65, 6.10) | ns | 8.97(5.71, 11.56) | < 0.05* | 22.42(16.23, 34.88) | < 0.05* |
| post | 5.56(3.52, 7.79) | 7.73(5.12, 9.41) | 17.37(12.71, 24.16) | ||||
| HOMA-IR | pre | 1.45(1.08, 2.02) | ns | 2.51(1.40, 3.61) | < 0.05* | 8.09(4.91, 12.15) | < 0.01** |
| post | 1.66(0.87, 2.27) | 1.98(1.42, 3.04) | 5.30(3.49, 7.60) | ||||
| HOMA-β | pre | 32.70(19.29, 47.84) | ns | 45.27(31.55, 122.96) | ns | 128.99(71.84, 209.42) | ns |
| post | 40.78(29.91, 51.44) | 48.34(36.01,68.94) | 146.08(85.70, 191.63) | ||||
| TyG Index | pre | 8.80 ± 0.46 | ns | 8.93 ± 0.44 | < 0.05* | 9.43 ± 0.65 | < 0.01** |
| post | 8.72 ± 0.45 | 8.72 ± 0.50 | 9.17 ± 0.62 | ||||
| TC (mmol/L) | pre | 5.19 ± 1.25 | ns | 5.26 ± 1.20 | ns | 5.32 ± 1.19 | ns |
| post | 4.95 ± 1.33 | 5.06 ± 1.23 | 5.13 ± 0.57 | ||||
| TG (mmol/L) | pre | 1.15(0.87, 1.69) | ns | 1.52(1.07, 1.80) | < 0.05* | 2.01(1.64, 2.98) | ns |
| post | 1.34(1.07, 1.59) | 1.17(0.92, 1.82) | 1.62(1.42, 2.90) | ||||
| HDL-C (mmol/L) | pre | 1.39 ± 0.29 | ns | 1.41 ± 0.38 | < 0.01** | 1.19 ± 0.22 | ns |
| post | 1.41 ± 0.35 | 1.51 ± 0.35 | 1.19 ± 0.21 | ||||
| LDL-C (mmol/L) | pre | 3.15 ± 0.93 | ns | 3.15 ± 0.71 | ns | 3.59 ± 0.66 | < 0.01** |
| post | 3.04 ± 1.01 | 3.10 ± 0.77 | 3.14 ± 0.52 | ||||
| NC (10^9/L) | pre | 3.96 ± 1.29 | < 0.05* | 4.07 ± 0.97 | ns | 3.54 ± 0.88 | < 0.05* |
| post | 3.42 ± 0.97 | 3.76 ± 0.79 | 3.84 ± 0.91 | ||||
| PC (10^9/L) | pre | 263.33 ± 51.13 | ns | 234.11 ± 101.20 | ns | 258.67 ± 59.18 | ns |
| post | 256.72 ± 56.93 | 236.60 ± 87.72 | 266.00 ± 57.11 | ||||
| LC (10^9/L) | pre | 1.97(1.66, 2.41) | ns | 2.01(1.79, 2.45) | ns | 2.29(2.06, 2.62) | ns |
| post | 1.96(1.64, 2.39) | 2.11(1.75, 2.86) | 2.14(1.86, 2.81) | ||||
| SII Index | pre | 495.20 ± 167.70 | < 0.05* | 414.84 ± 145.74 | ns | 413.08 ± 211.42 | ns |
| post | 429.63 ± 129.34 | 390.25 ± 124.53 | 464.13 ± 182.19 |
Changes in outcome measures before and after exercise intervention by group.
Data are presented as mean ± standard deviation (SD) for normally distributed variables, and as median (interquartile range) for non-normally distributed variables.
Within-group comparisons (pre vs. post) were performed using the Paired t-test for normally distributed data and the Wilcoxon signed-rank test for non-normally distributed data.
Significance markers: *p < 0.05, **p < 0.01, ***p < 0.001; “ns” denotes non-significance (p > 0.05).
3.2.1 Anthropometric measures
Significant improvements in body weight, BMI, and body fat percentage were observed in both Group 1 and Group 2 compared to baseline (p < 0.05). However, Group 3 showed no significant changes in these parameters (p > 0.05). Notably, no significant improvements in lean body mass were observed in any group (p > 0.05).
3.2.2 Glycemic control measures
HbA1c showed significant improvement from baseline in all three groups (p < 0.05). FPG significantly improved only in Group 1 and Group 3 (p < 0.05), with no significant change observed in Group 2 (p > 0.05).
3.2.3 Insulin resistance indices
Fasting C-peptide demonstrated a non-significant tendency toward increase in Group 1 (p > 0.05), remaining within normal range. Conversely, significant decreases were observed in Group 2 and Group 3 (p < 0.05). FINS and HOMA-IR paralleled this pattern of change. No significant changes in HOMA-β were observed in any group.
3.2.4 Lipid profile measures
TC showed a non-significant decreasing tendency across all groups (p > 0.05). TG decreased significantly only in Group 2 (p < 0.05), with no significant changes in Group 1 or Group 3. HDL-C levels significantly improved in Group 2 (p < 0.05) but remained unchanged in Group 1 and Group 3 (p > 0.05). LDL-C levels decreased significantly only in Group 3 (p < 0.05), while Groups 1 and 2 showed non-significant reducing trends (p > 0.05).
3.2.5 Inflammatory markers
Changes in SII and its components (neutrophils, platelets, lymphocytes) were analyzed post-intervention. SII decreased significantly only in Group 1 (p < 0.05), with no significant improvements in Group 2 or Group 3 (p > 0.05). Neutrophil count significantly decreased in Group 1 (p < 0.05), showed no change in Group 2 (p > 0.05), but significantly increased in Group 3 (p < 0.05). Neither platelet count nor lymphocyte count showed significant improvements in any group (p > 0.05).
3.3 Differential changes across groups
Intergroup analysis revealed significant differential changes in neutrophil count and SII following the 4-week intervention (p < 0.05). Groups with milder baseline IR (Groups 1 and 2) demonstrated improvements in immune-inflammatory markers. Conversely, Group 3 - characterized by significant baseline IR - showed no improvement in SII, moreover exhibiting deterioration through significantly elevated neutrophil counts (p < 0.05) (Figure 2). No statistically significant intergroup differences were observed in anthropometric parameters or glucolipid metabolic measures (p > 0.05) (Figures 3–5).
Figure 2
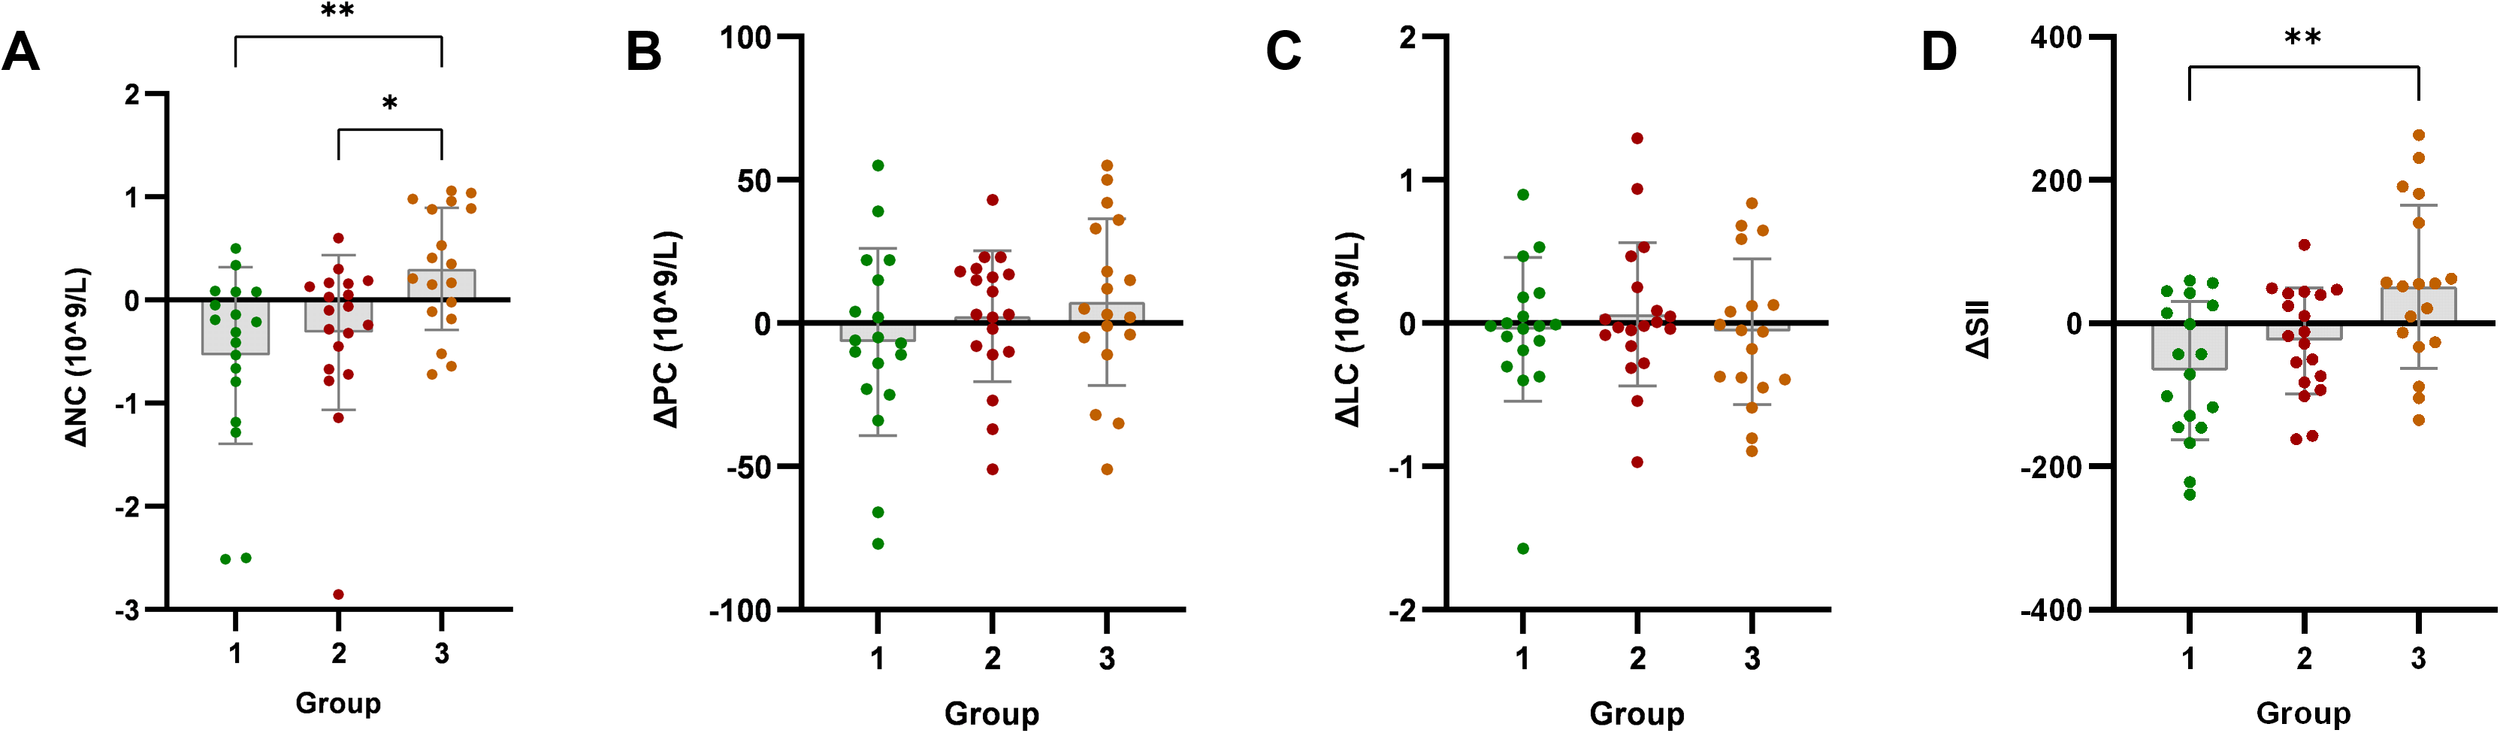
Analysis of immune-inflammatory indicators after exercise intervention. Bar plots with overlaid individual data points display the mean change from baseline (Δ, calculated as post-intervention value minus baseline value) for (A) neutrophil count (NC), (B) platelet count (PC), (C) lymphocyte count (LC), and (D) systemic immune-inflammation index (SII) across the three groups stratified by baseline C-peptide: Group 1 (n=18), Group 2 (n=19), and Group 3 (n=18). Individual dots represent each participant’s response. Asterisks denote significant within-group changes (paired t-test or Wilcoxon test): *p < 0.05, **p < 0.01, ***p < 0.001; the absence of asterisks indicates non-significance.
Figure 3
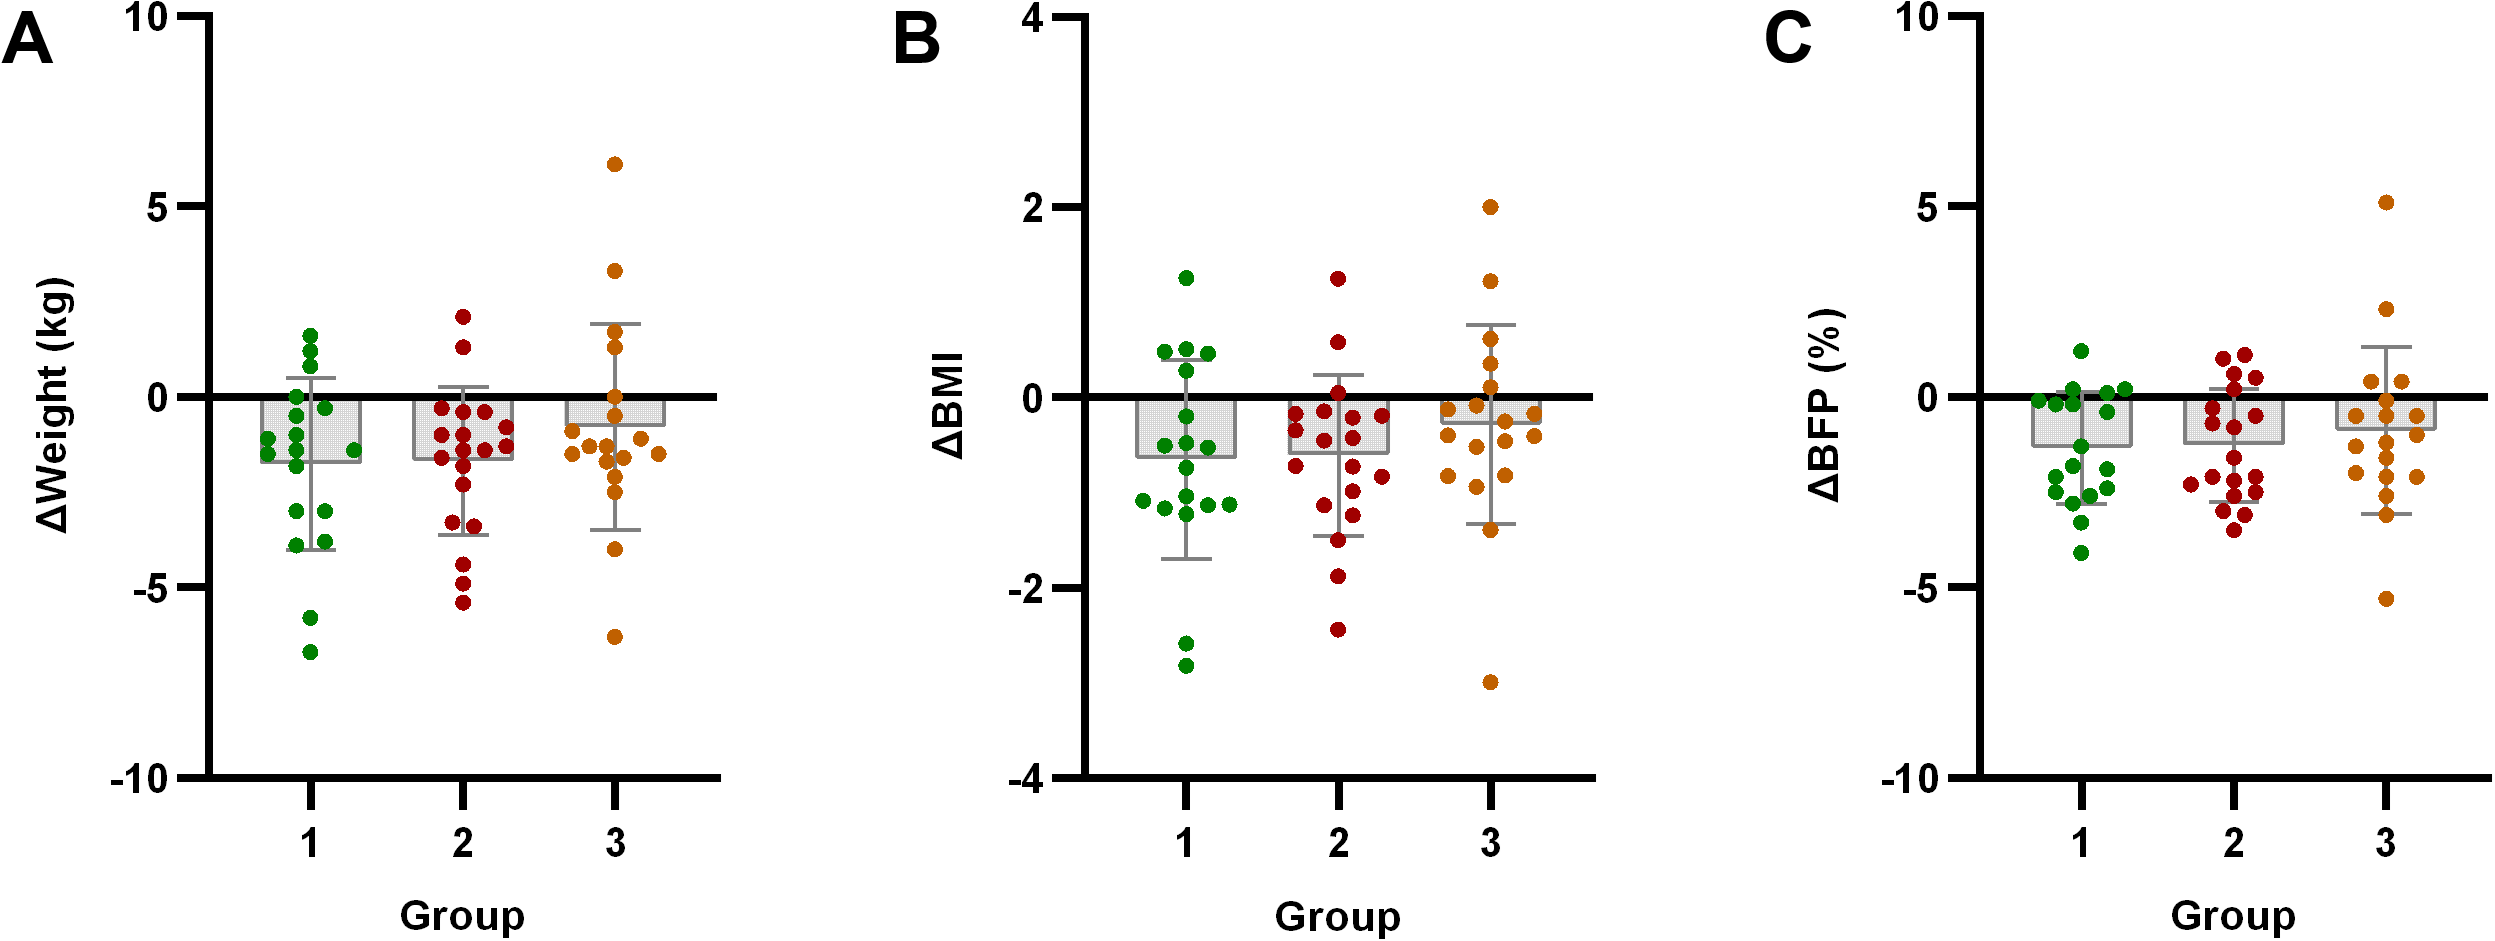
Analysis of body composition indicators after exercise intervention. Bar plots with overlaid individual data points display the mean change from baseline (Δ, calculated as post-intervention value minus baseline value) for (A) Weight, (B) body mass index (BMI), and (C) body fat percentage (BFP) across the three groups stratified by baseline C-peptide: Group 1 (n=18), Group 2 (n=19), and Group 3 (n=18). Individual dots represent each participant’s response. Asterisks denote significant within-group changes (paired t-test or Wilcoxon test): *p < 0.05, **p < 0.01, ***p < 0.001; the absence of asterisks indicates non-significance.
Figure 4
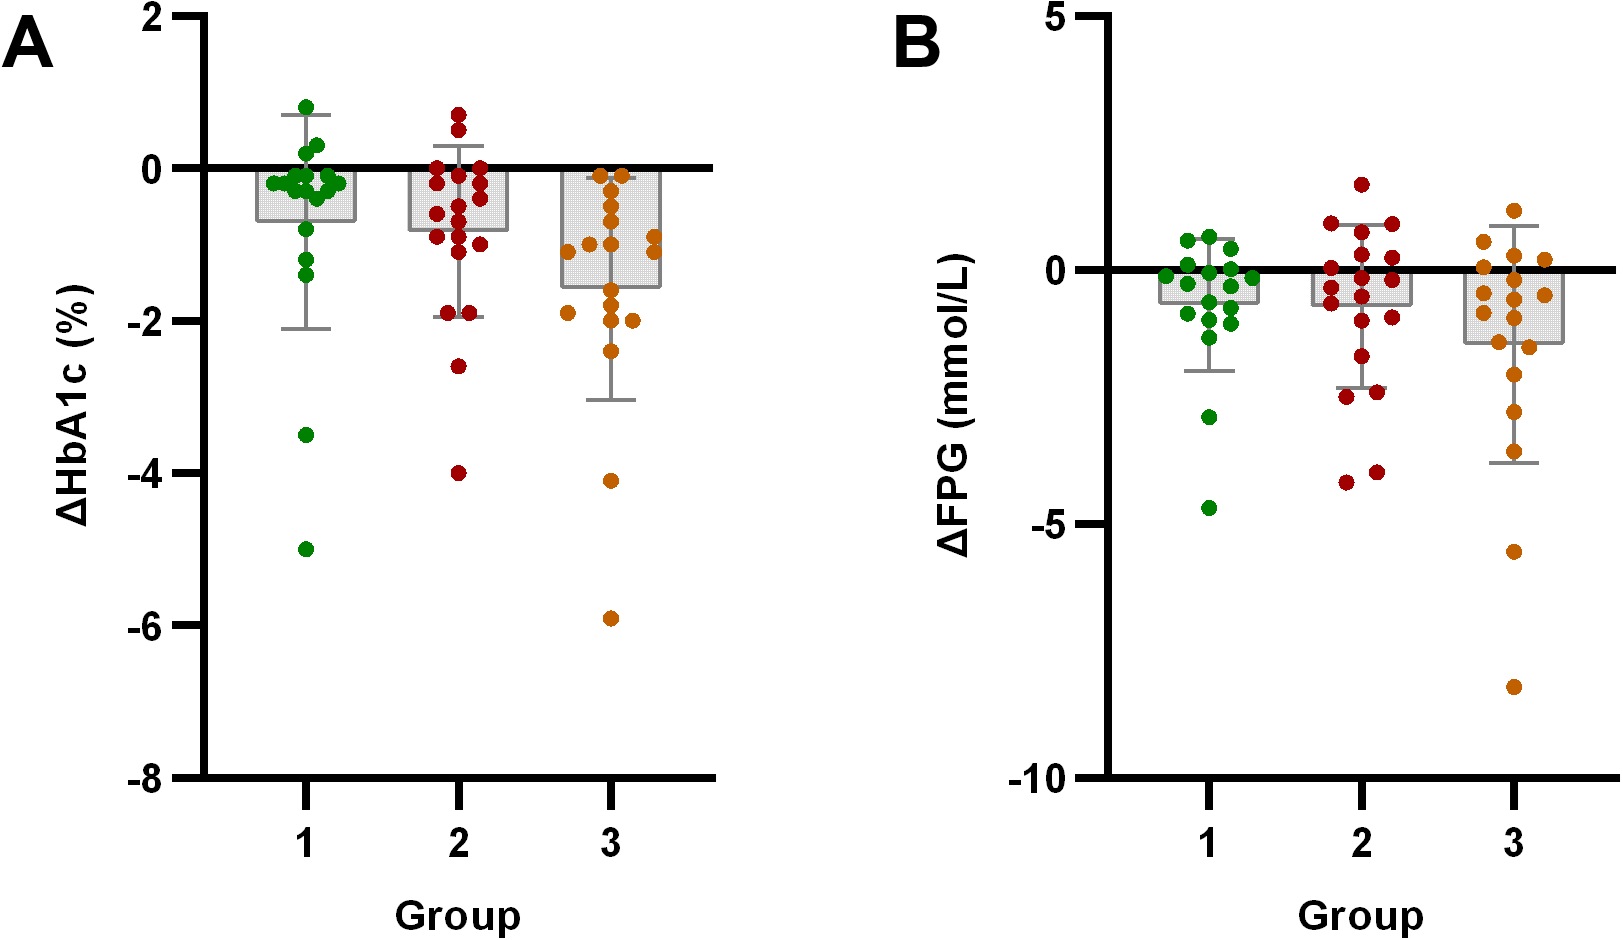
Analysis of glucose metabolism indicators after exercise intervention. Bar plots with overlaid individual data points display the mean change from baseline (Δ, calculated as post-intervention value minus baseline value) for (A) HbA1c and (B) Fasting Plasma Glucose (FPG) across the three groups stratified by baseline C-peptide: Group 1 (n=18), Group 2 (n=19), and Group 3 (n=18). Individual dots represent each participant’s response. Asterisks denote significant within-group changes (paired t-test or Wilcoxon test): *p < 0.05, **p < 0.01, ***p < 0.001; the absence of asterisks indicates non-significance.
Figure 5
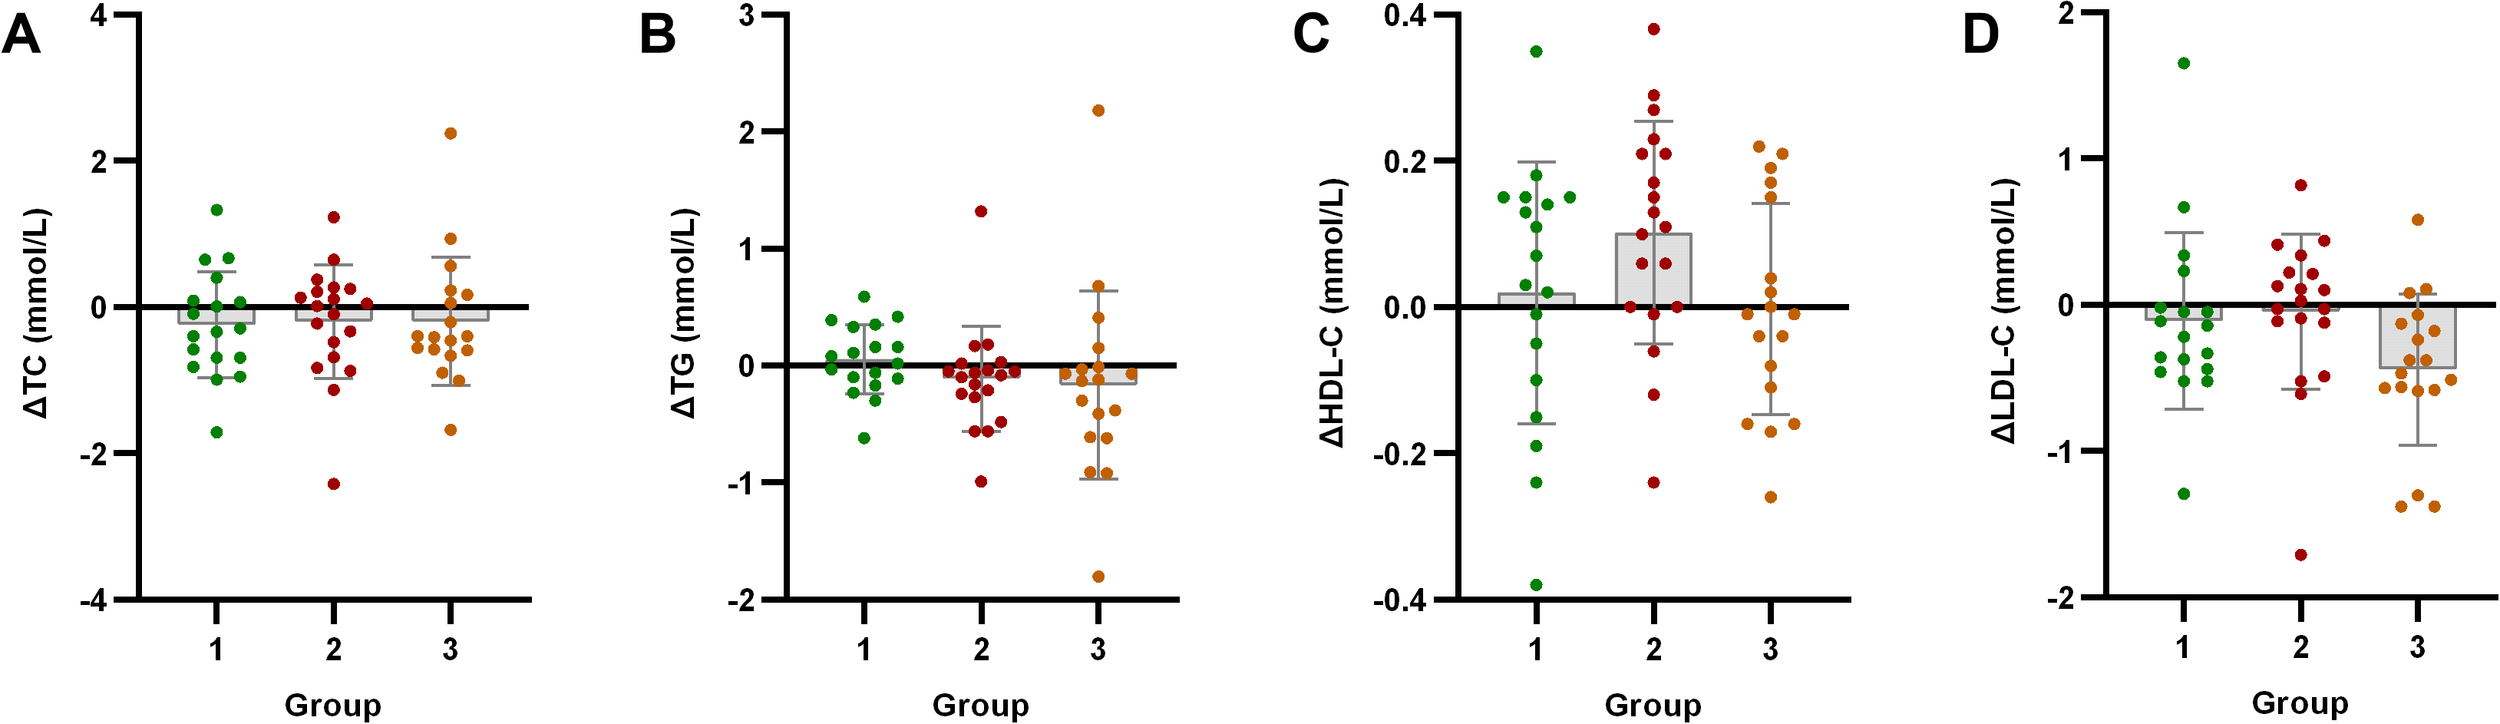
Analysis of lipid metabolism indicators after exercise intervention. Bar plots with overlaid individual data points display the mean change from baseline (Δ, calculated as post-intervention value minus baseline value) for (A) total cholesterol (TC), (B) triglycerides (TG), (C) high-density lipoprotein cholesterol (HDL-C), and (D) low-density lipoprotein cholesterol (LDL-C) across the three groups stratified by baseline C-peptide: Group 1 (n=18), Group 2 (n=19), and Group 3 (n=18). Individual dots represent each participant’s response. Asterisks denote significant within-group changes (paired t-test or Wilcoxon test): *p < 0.05, **p < 0.01, ***p < 0.001; the absence of asterisks indicates non-significance.
3.4 Association between baseline C-peptide and SII improvement
Baseline C-peptide levels showed significant positive correlation with post-intervention systemic immune-inflammation index improvement (ΔSII) (r = 0.428, p = 0.001) (Figure 6).
Figure 6
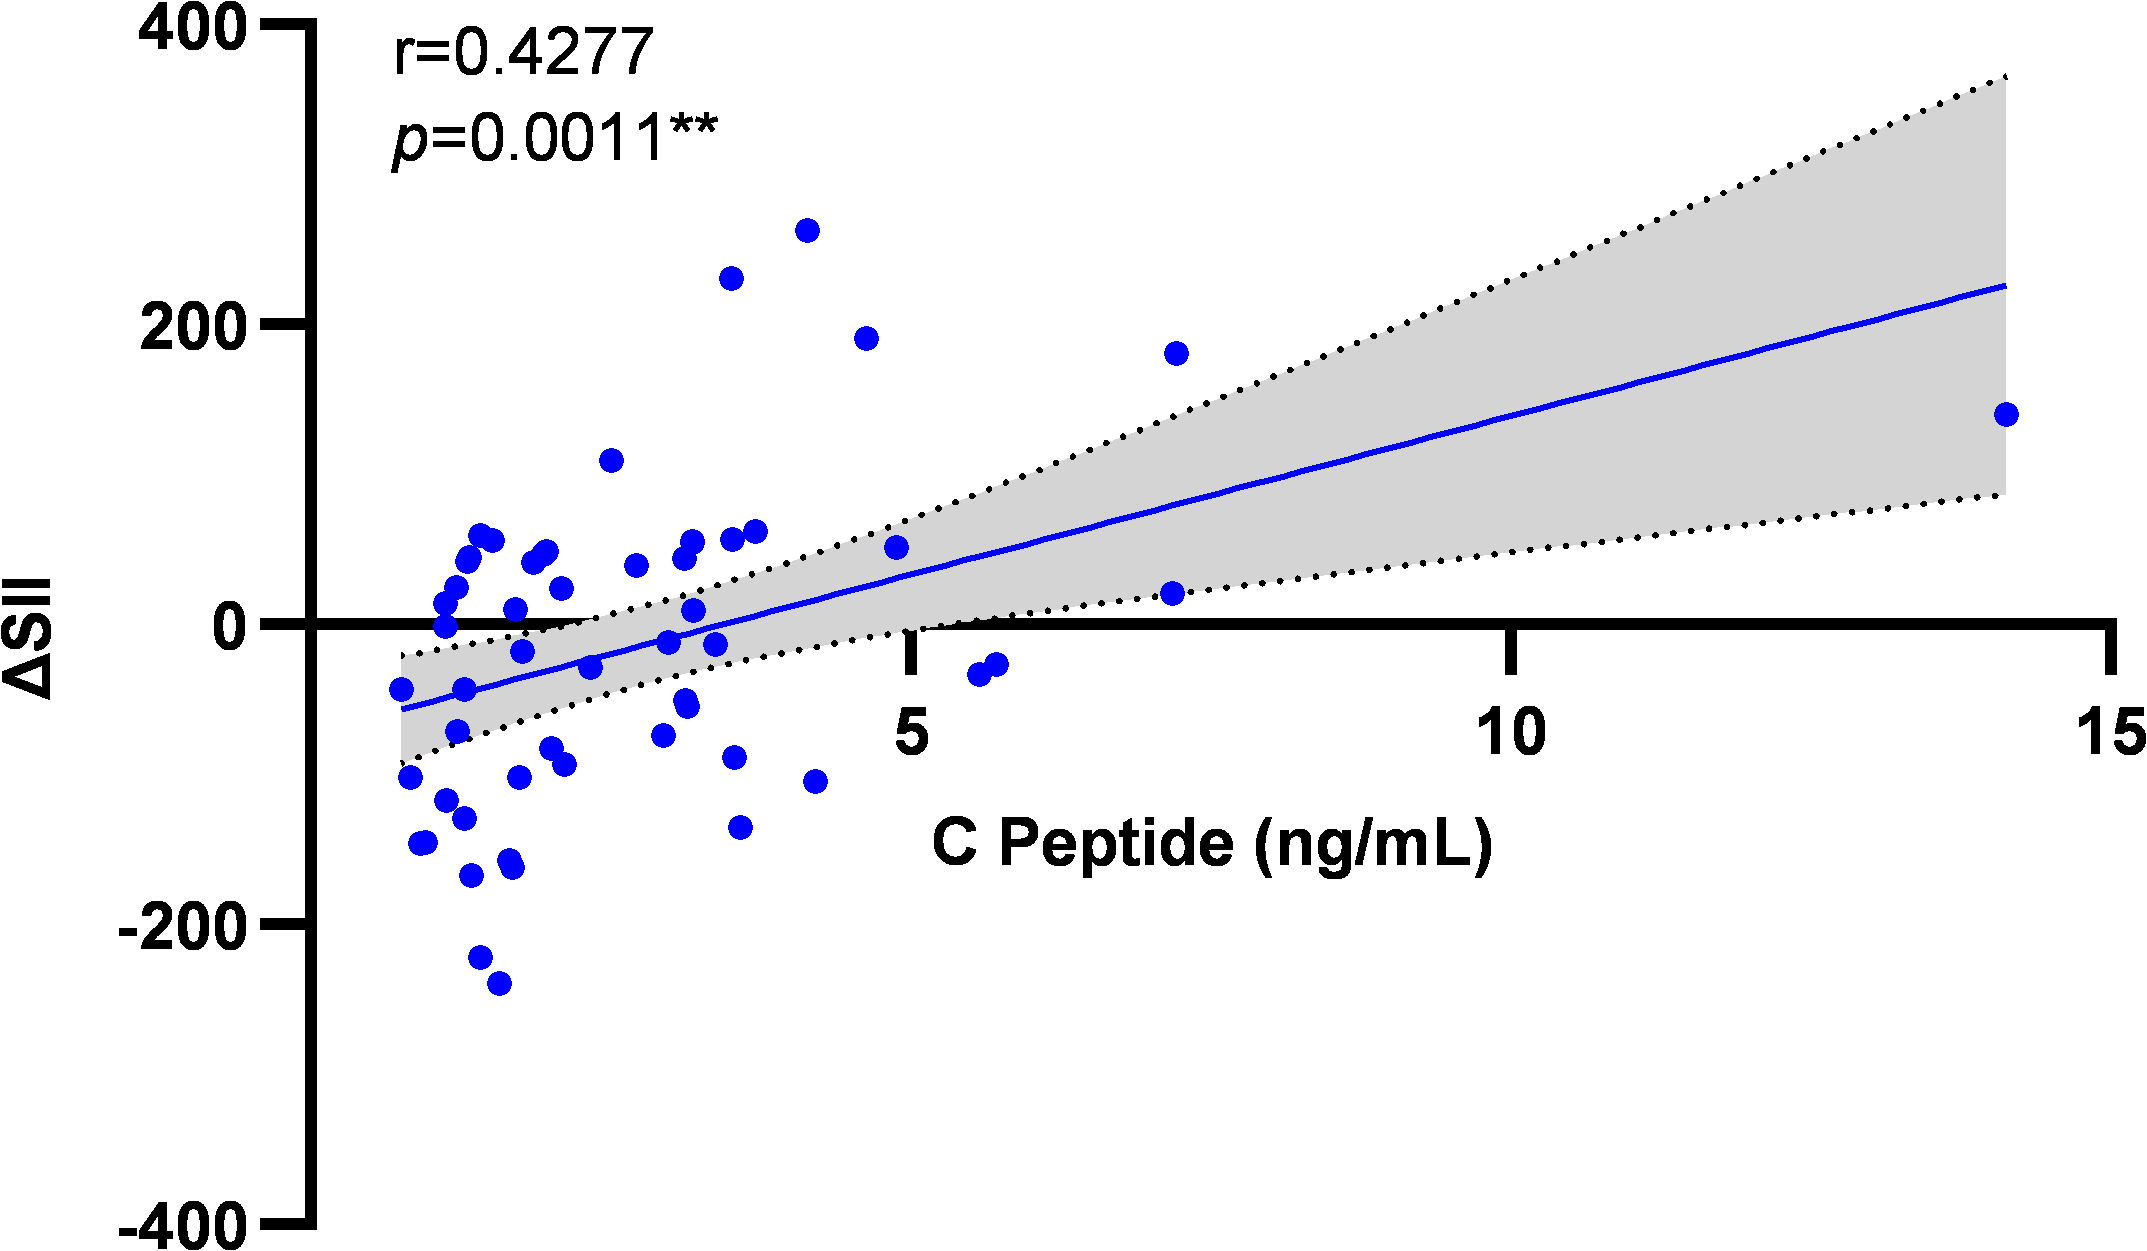
Correlation analysis between baseline C-peptide and ΔSII improvement. Scatter plot illustrating the relationship between baseline C-peptide levels and the change in SII (ΔSII, calculated as post-intervention value minus baseline value) following the exercise intervention across all participants (N = 55). The solid line represents the line of best fit from the Spearman correlation analysis. Correlation coefficient (r = 0.428) and significance (p = 0.001) are indicated.
3.5 Baseline C-peptide as independent predictor of ΔSII
Multiple linear regression confirmed baseline C-peptide as an independent predictor of ΔSII across sequential adjustment models: unadjusted (B = 21.14, SE = 6.02, p < 0.001), gender/age-adjusted (B = 21.94, SE = 6.42, p < 0.01), with additional diabetes duration adjustment (B = 21.17, SE = 6.68, p < 0.01), and full adjustment including BMI (B = 19.85, SE = 6.92, p < 0.01). All covariates demonstrated nonsignificant contributions (gender: p > 0.05; age: p > 0.05; T2D duration: p > 0.05; BMI: p > 0.05) (Table 3).
Table 3
| Variable | Model 1 | Model 2 | Model 3 | Model 4 |
|---|---|---|---|---|
| C-peptide | 21.14*** | 21.94** | 21.17** | 19.85** |
| (6.02) | (6.42) | (6.68) | (6.92) | |
| Gender | — | 8.43 | 9.59 | 12.47 |
| (27.91) | (28.23) | (28.59) | ||
| Age | — | 0.36 | 0.16 | 0.57 |
| (1.16) | (1.24) | (1.35) | ||
| T2D duration | — | — | 5.87 | 5.17 |
| (12.49) | (12.58) | |||
| BMI | — | — | — | 2.50 |
| (3.23) | ||||
| Constant | -72.20** | -102.61 | -108.50 | -194.89 |
| (21.22) | (76.26) | (77.87) | (136.28) |
Multivariable linear regression analysis of baseline C-peptide and ΔSII improvement.
The dependent variable in all models is ΔSII (calculated as post-intervention SII minus baseline SII).
Unstandardized regression coefficients (B) are reported with their standard errors (SE) in parentheses.
The analysis included all participants who completed the study (N = 55).
Model 1: Unadjusted; Model 2: Adjusted for gender, age; Model 3: Adjusted for gender, age, T2D duration; Model 4: Adjusted for gender, age, T2D duration, BMI
Significance levels: *p < 0.05, **p < 0.01, ***p < 0.001.
4 Discussion
This study stratified early-stage T2DM patients (disease duration ≤5 years, fasting C-peptide >0.8 ng/mL) by baseline C-peptide levels, justified by its correlation with IR and unique advantages: 1) Resilience to β-cell functional heterogeneity; 2) Superior stability over HOMA-IR assays; 3) Methodological extensibility to insulin-treated populations. Baseline validation confirmed group efficacy—the high C-peptide cohort (Group 3) concurrently exhibited peak HOMA-IR, TyG index, and FINS. Baseline characteristics showed that Group 3 patients’ severe IR was associated with worse metabolic dysregulation. This group not only had significantly higher IR markers (FINS, HOMA-IR, TyG index) and β-cell function marker HOMA-β than low/moderate groups (Group 1/Group 2), but also exhibited greater anthropometric measures (weight, BMI, body fat percentage, lean body mass). Notably, while no significant differences existed in baseline fasting glucose, HbA1c, TC, HDL-C, LDL-C, or SII among groups, Group 3 had significantly elevated baseline TG. This aligns with expectations since worsened IR and obesity often accompany hypertriglyceridemia (35).
This study implemented a 4-week combined aerobic-resistance training intervention. The selection of this intervention duration was based on a comprehensive consideration of prior evidence and study feasibility. Existing literature indicates that a structured 4-week exercise program is sufficient to induce significant early improvements in insulin sensitivity and inflammatory markers in individuals with T2DM (36–38). Furthermore, preclinical studies have confirmed that a 4-week training period can induce significant metabolic adaptations, including improved glucose tolerance, in relevant animal models (39). From a practical perspective, and as an intensively supervised pilot study, this shorter duration was crucial for ensuring high participant adherence, thereby controlling dropout rates and generating high-quality evidence for the early effects of exercise intervention. Current evidence supports that combined aerobic-resistance exercise synergistically optimizes metabolic benefits in T2DM (40), further justifying our protocol design. Post-intervention, we excluded patients developing upper respiratory infections or dermatitis during the study to ensure SII changes primarily reflected exercise effects. Key findings emerged from group analyses:
Anthropometric improvements correlated with baseline IR severity: Despite Group 3 (high-IR) having the highest baseline weight, BMI, and body fat%, its post-intervention improvements were significantly lower than Group 1/Group 2 (low/moderate-IR). Group 1/Group 2 showed significant anthropometric improvements, while Group 3 had no statistically significant changes. This suggests severe pre-intervention IR may hinder exercise’s positive effects on obesity-related body composition. Importantly, exercise preserved lean body mass (Δlean mass: p>0.05 in all groups), contrasting sharply with lean mass loss from pharmacological/dietary interventions, which holds clinical significance for delaying sarcopenia in T2DM.
Limited inflammatory improvement in high baseline-IR group: Consistent with attenuated anthropometric improvements, Group 3’s SII showed no significant improvement post-intervention, instead trending upward. This indicates baseline high-IR may compromise exercise-induced systemic anti-inflammatory effects. These results suggest that T2DM patients with severe IR experience a hyperinflammatory phase during early exercise intervention, during which anthropometric improvements are also limited. Further analysis revealed SII reduction primarily stemmed from decreased neutrophil counts (p<0.05), not platelet reduction or lymphocyte increase, confirming exercise improves immune-inflammation mainly through neutrophil modulation. Several studies report neutrophils’ predictive value for T2DM remission. For instance, Bonaventura et al. (2019) found NLR ≤1.97 predicted 5-year T2DM remission post-bariatric surgery (41). Zubiaga et al. (2020) showed preoperative NLR correlated with 5-year postoperative anthropometric/glycemic outcomes and complete T2DM remission (42). Lower baseline neutrophils predicted higher T2DM remission likelihood after Mediterranean diet interventions (43).
The observed improvement in SII, particularly the reduction in neutrophil count, can be interpreted within the established biological framework of exercise-induced anti-inflammatory effects. The SII reflects a balance between pro-inflammatory (neutrophils, platelets) and immuno-regulatory (lymphocytes) forces. Its decrease signifies a systemic shift toward a less inflammatory state. This shift is likely mediated through multiple mechanisms: 1) Exercise reduces visceral adipose tissue mass, a primary site of pro-inflammatory cytokine production (e.g., TNF-α, IL-1β) due to infiltrated M1 macrophage (44). 2) Contracting skeletal muscle acts as an endocrine organ, releasing myokines such as IL-6, which in the context of exercise stimulates the production of anti-inflammatory cytokines like IL-10 and inhibits TNF-α release (45, 46). 3) Regular exercise can dampen the activation of innate immune signaling pathways, including Toll-like receptors (TLRs), thereby reducing downstream NF-κB-driven inflammation (47, 48). It is important to note that while our study demonstrates modulation of systemic cellular inflammation via SII, this composite marker does not resolve specific downstream pathways. Future research should directly measure the cytokine milieu (e.g., IL-1β, IL-6, TNF-α, IL-10) and signaling molecules to fully elucidate the precise mechanisms at play.
Glycemic improvements independent of weight loss/anti-inflammatory effects: Strikingly, despite limited anthropometric and inflammatory improvements, Group 3 showed significant glycemic control improvements (fasting glucose, HbA1c). This clearly demonstrates exercise’s glycemic benefits can occur independently of significant weight/fat loss or systemic inflammation improvement. This finding is clinically crucial, as it underscores that patients with severe IR can achieve meaningful glycemic control through exercise, even before substantial weight loss or systemic anti-inflammatory effects are evident.
We propose that the mechanism by which high IR hinders weight loss relates to inflammation: Baseline high-IR patients showed insignificant weight/fat reduction and elevated SII (not improvement) during early exercise (4 weeks), while IR itself improved significantly. This suggests high-IR status or its metabolic environment (e.g., adipose tissue dysfunction, signaling abnormalities) may inhibit exercise-induced fat loss. A prediabetes study found only 31% of high-risk phenotype patients (with severe IR and NAFLD) achieved normal glucose after lifestyle intervention, versus 67% in low-risk group (49). This indicates severe-IR patients require longer interventions for equivalent efficacy—a potential explanation for differential exercise-induced fat loss in patients with varying IR severity. Although exercise improved insulin sensitivity in these patients, it might be insufficient to overcome short-term fat loss barriers, possibly linked to transiently elevated inflammation and delayed fat mobilization. However, a Chilean study reported no difference in non-response rates for HOMA-IR improvements after 10-week HIIT across IR strata (50), potentially due to HIIT’s unique anaerobic effects.
We further observed independence of glycemic improvements: Group 3’s significant glycemic improvements occurred despite limited anthropometric/inflammatory changes, confirming exercise’s glycemic benefits can manifest independently. Supporting evidence comes from other IR populations: Obese children showed improved insulin sensitivity after 8-week exercise without significant lean mass/abdominal fat changes via DEXA. Similarly, 1-week intense aerobic exercise improved glycemic parameters without weight change by enhancing peripheral glucose uptake and suppressing hepatic glucose production (51).
This study also reveals complex inflammation-hyperglycemia interactions: Chronic inflammation critically drives T2DM (52, 53), while hyperglycemia exacerbates inflammation via “glucotoxicity” (54). Although prior studies reported concurrent improvements in glucose (FINS, FBG) and inflammation (TNF-α, IL-6, hs-CRP) after 4-week aerobic exercise (55), we observed “glycemic improvement without synchronized inflammation improvement” in Group 3. This suggests exercise may prioritize glucoregulatory pathways over anti-inflammatory modulation in high-IR patients, requiring longer duration or higher intensity for anti-inflammatory effects. A plausible hypothesis: During early intervention (≤4 weeks), exercise activates immune pathways (e.g., acute-phase response) in high-IR individuals, partially counteracting anti-inflammatory effects. Heterogeneous findings across exercise modalities (aerobic (33, 56, 57)/resistance (32, 33, 58–61)/combined (32, 33, 61) may stem from differences in baseline IR severity, intervention parameters (duration/frequency/intensity), assessment timing, and inflammatory biomarkers.
In summary, baseline IR severity critically modulates exercise-induced metabolic and anti-inflammatory responses in T2DM. High-IR significantly attenuates body composition optimization and systemic inflammation mitigation, necessitating IR-stratified exercise prescriptions. Limitations of this study should be acknowledged. First, although key parameters of exercise performance, such as aerobic capacity (e.g., VO2max) and muscular strength, were monitored throughout the intervention, they were not included in the present analysis, as the primary focus of this manuscript was to elucidate the direct relationships between the exercise intervention, changes in body composition, and systemic inflammatory/metabolic biomarkers. We believe that exploring the mediating role of fitness gains constitutes a substantial research question that warrants a separate, dedicated investigation. Nevertheless, the absence of this correlation analysis limits our ability to fully delineate whether the observed benefits were directly mediated through improvements in fitness. Additionally, limitations include: Limited sample size potentially affecting subgroup power; 4-week duration possibly insufficient to observe long-term inflammatory trajectories; SII as a composite marker without downstream pathway resolution. Future studies should: Enlarge high-IR subgroups; Extend interventions to 12–24 weeks; Investigate mechanisms (adipose tissue inflammation, immune cell subsets, signaling pathways); Develop personalized high-intensity/long-duration/nutrition-combined strategies to concurrently achieve glycemic control, weight/fat reduction, and anti-inflammatory goals.
Statements
Data availability statement
The original contributions presented in the study are included in the article/supplementary material. Further inquiries can be directed to the corresponding authors.
Ethics statement
The studies involving humans were approved by Medical Ethics Committee of Yangpu District Central Hospital, Shanghai. The studies were conducted in accordance with the local legislation and institutional requirements. The participants provided their written informed consent to participate in this study. Written informed consent was obtained from the individual(s) for the publication of any potentially identifiable images or data included in this article.
Author contributions
WC: Data curation, Funding acquisition, Methodology, Writing – original draft, Writing – review & editing. KG: Investigation, Methodology, Writing – review & editing. XZ: Methodology, Writing – review & editing. KZ: Conceptualization, Supervision, Writing – review & editing.
Funding
The author(s) declare financial support was received for the research, and/or publication of this article. This research was funded by Shanghai Sport Science and Technology Project (24Q005).
Conflict of interest
The authors declare that the research was conducted in the absence of any commercial or financial relationships that could be construed as a potential conflict of interest.
Generative AI statement
The author(s) declare that no Generative AI was used in the creation of this manuscript.
Any alternative text (alt text) provided alongside figures in this article has been generated by Frontiers with the support of artificial intelligence and reasonable efforts have been made to ensure accuracy, including review by the authors wherever possible. If you identify any issues, please contact us.
Publisher’s note
All claims expressed in this article are solely those of the authors and do not necessarily represent those of their affiliated organizations, or those of the publisher, the editors and the reviewers. Any product that may be evaluated in this article, or claim that may be made by its manufacturer, is not guaranteed or endorsed by the publisher.
References
1
Furman D Campisi J Verdin E Carrera-Bastos P Targ S Franceschi C et al . Chronic inflammation in the etiology of disease across the life span. Nat Med. (2019) 25:1822–32. doi: 10.1038/s41591-019-0675-0
2
Roth GA Abate D Abate KH Abay SM Abbafati C Abbasi N et al . Global, regional, and national age-sex-specific mortality for 282 causes of death in 195 countries and territories, 1980–2017: a systematic analysis for the global burden of disease study 2017. Lancet. (2018) 392:1736–88. doi: 10.1016/S0140-6736(18)32203-7
3
Festa A D’Agostino R Howard G Mykkänen L Tracy RP Haffner SM . Chronic subclinical inflammation as part of the insulin resistance syndrome: the insulin resistance atherosclerosis study (IRAS). Circulation. (2000) 102:42–7. doi: 10.1161/01.cir.102.1.42
4
Pickup JC Mattock MB Chusney GD Burt D . NIDDM as a disease of the innate immune system: association of acute-phase reactants and interleukin-6 with metabolic syndrome X. Diabetologia. (1997) 40:1286–92. doi: 10.1007/s001250050822
5
Henein MY Vancheri S Longo G Vancheri F . The role of inflammation in cardiovascular disease. Int J Mol Sci. (2022) 23:12906. doi: 10.3390/ijms232112906
6
Lowe G Woodward M Hillis G Rumley A Li Q Harrap S et al . Circulating inflammatory markers and the risk of vascular complications and mortality in people with type 2 diabetes and cardiovascular disease or risk factors: the ADVANCE study. Diabetes. (2014) 63:1115–23. doi: 10.2337/db12-1625
7
Delalat S Sultana I Osman H Sieme M Zhazykbayeva S Herwig M et al . Dysregulated inflammation, oxidative stress, and protein quality control in diabetic HFpEF: unraveling mechanisms and therapeutic targets. Cardiovasc Diabetol. (2025) 24:211. doi: 10.1186/s12933-025-02734-4
8
Jacobo-Tovar E Medel-Sánchez A Durán-Castillo C Guardado-Mendoza R . Insulin resistance in cancer risk and prognosis. Semin Cancer Biol. (2025) 114:73–87. doi: 10.1016/j.semcancer.2025.06.006
9
Mu Y-W Yao W-H Li H Zhang C-L Zhang Y-J Zhang X-N et al . Short-chain chlorinated paraffins at environmentally relevant doses disrupt glucose homeostasis and insulin signaling by macrophage-mediated inflammation. J Hazard Mater. (2025) 495:139144. doi: 10.1016/j.jhazmat.2025.139144
10
Ezhilarasan D . Deciphering the molecular pathways of saroglitazar: a dual PPAR α/γ agonist for managing metabolic NAFLD. Metab Clin Exp. (2024) 155:155912. doi: 10.1016/j.metabol.2024.155912
11
Gao J Guo K Du M Mao X . Bovine α-lactalbumin-derived peptides attenuate TNF-α-induced insulin resistance and inflammation in 3T3-L1 adipocytes through inhibiting JNK and NF-κB signaling. Food Funct. (2022) 13:2323–35. doi: 10.1039/d1fo01217g
12
Li H Wang C Zhao J Guo C . JNK downregulation improves olanzapine-induced insulin resistance by suppressing IRS1Ser307 phosphorylation and reducing inflammation. BioMed Pharmacother = BioMed Pharmacother. (2021) 142:112071. doi: 10.1016/j.biopha.2021.112071
13
Lumeng CN Bodzin JL Saltiel AR . Obesity induces a phenotypic switch in adipose tissue macrophage polarization. J Clin Invest. (2007) 117:175–84. doi: 10.1172/JCI29881
14
McLaughlin T Ackerman SE Shen L Engleman E . Role of innate and adaptive immunity in obesity-associated metabolic disease. J Clin Invest. (2017) 127:5–13. doi: 10.1172/JCI88876
15
Cao S Pan Y Tang J Terker AS Arroyo Ornelas JP Jin G et al . EGFR-mediated activation of adipose tissue macrophages promotes obesity and insulin resistance. Nat Commun. (2022) 13:4684. doi: 10.1038/s41467-022-32348-3
16
Yao J-M Ying H-Z Zhang H-H Qiu F-S Wu J-Q Yu C-H . Exosomal RBP4 potentiated hepatic lipid accumulation and inflammation in high-fat-diet-fed mice by promoting M1 polarization of kupffer cells. Free Radical Biol Med. (2023) 195:58–73. doi: 10.1016/j.freeradbiomed.2022.12.085
17
Kim MJ Rangasamy S Shim Y Song JM . Cell lysis-free quantum dot multicolor cellular imaging-based mechanism study for TNF-α-induced insulin resistance. J Nanobiotechnol. (2015) 13:4. doi: 10.1186/s12951-015-0064-x
18
Solinas G Vilcu C Neels JG Bandyopadhyay GK Luo J-L Naugler W et al . JNK1 in hematopoietically derived cells contributes to diet-induced inflammation and insulin resistance without affecting obesity. Cell Metab. (2007) 6:386–97. doi: 10.1016/j.cmet.2007.09.011
19
Blanc M Habbouche L Xiao P Lebeaupin C Janona M Vaillant N et al . Bax inhibitor-1 preserves pancreatic β-cell proteostasis by limiting proinsulin misfolding and programmed cell death. Cell Death Dis. (2024) 15:334. doi: 10.1038/s41419-024-06701-x
20
Yin Y Hao H Cheng Y Zang L Liu J Gao J et al . Human umbilical cord-derived mesenchymal stem cells direct macrophage polarization to alleviate pancreatic islets dysfunction in type 2 diabetic mice. Cell Death Dis. (2018) 9:760. doi: 10.1038/s41419-018-0801-9
21
Hu B Yang X-R Xu Y Sun Y-F Sun C Guo W et al . Systemic immune-inflammation index predicts prognosis of patients after curative resection for hepatocellular carcinoma. Clin Cancer Res: Off J Am Assoc Cancer Res. (2014) 20:6212–22. doi: 10.1158/1078-0432.CCR-14-0442
22
Nøst TH Alcala K Urbarova I Byrne KS Guida F Sandanger TM et al . Systemic inflammation markers and cancer incidence in the UK biobank. Eur J Epidemiol. (2021) 36:841–8. doi: 10.1007/s10654-021-00752-6
23
Wang Z Qin Z Yuan R Guo J Xu S Lv Y et al . Systemic immune-inflammation index as a prognostic marker for advanced chronic heart failure with renal dysfunction. ESC Heart Fail. (2023) 10:478–91. doi: 10.1002/ehf2.14217
24
Xu M Chen R Liu L Liu X Hou J Liao J et al . Systemic immune-inflammation index and incident cardiovascular diseases among middle-aged and elderly chinese adults: the dongfeng-tongji cohort study. Atherosclerosis. (2021) 323:20–9. doi: 10.1016/j.atherosclerosis.2021.02.012
25
DeFronzo RA . The triumvirate: β-cell, muscle, liver: a collusion responsible for NIDDM. Diabetes. (1988) 37:667–87. doi: 10.2337/diab.37.6.667
26
Cozza A Chinigò C Filicetti E Greco GI Lappano R Marinaro C et al . Effects of antidiabetic medications on the relationship between type 2 diabetes mellitus and cognitive impairment. Ageing Res Rev. (2025), 112:102834. doi: 10.1016/j.arr.2025.102834
27
Lou M Luo P Tang R Peng Y Yu S Huang W et al . Relationship between neutrophil-lymphocyte ratio and insulin resistance in newly diagnosed type 2 diabetes mellitus patients. BMC Endocr Disord. (2015) 15:9. doi: 10.1186/s12902-015-0002-9
28
Shoelson SE Lee J Goldfine AB . Inflammation and insulin resistance. J Clin Invest. (2006) 116:1793–801. doi: 10.1172/JCI29069
29
DeFronzo RA Tobin JD Andres R . Glucose clamp technique: a method for quantifying insulin secretion and resistance. Am J Physiol. (1979) 237:E214–223. doi: 10.1152/ajpendo.1979.237.3.E214
30
Eaton RP Allen RC SChade DS Erickson KM Standefer J . Prehepatic insulin production in man: kinetic analysis using peripheral connecting peptide behavior. J Clin Endocrinol Metab. (1980) 51:520–8. doi: 10.1210/jcem-51-3-520
31
Zhou L Luo Y Wang Y Cheng Y Zhang R Zhang S et al . The clinical implications of fasting serum insulin levels in patients with insulin-treated type 2 diabetes: a cross-sectional survey. Front Clin Diabetes Healthc. (2023) 4:1172208. doi: 10.3389/fcdhc.2023.1172208
32
Swift DL Johannsen NM Earnest CP Blair SN Church TS . Effect of exercise training modality on C-reactive protein in type 2 diabetes. Med Sci Sports Exercise. (2012) 44:1028–34. doi: 10.1249/MSS.0b013e31824526cc
33
Jorge MLMP de Oliveira VN Resende NM Paraiso LF Calixto A Diniz ALD et al . The effects of aerobic, resistance, and combined exercise on metabolic control, inflammatory markers, adipocytokines, and muscle insulin signaling in patients with type 2 diabetes mellitus. Metab Clin Exp. (2011) 60:1244–52. doi: 10.1016/j.metabol.2011.01.006
34
Melo LC Dativo-Medeiros J Menezes-Silva CE Barbosa FT de Sousa-Rodrigues CF Rabelo LA . Physical exercise on inflammatory markers in type 2 diabetes patients: a systematic review of randomized controlled trials. Oxid Med Cell Longevity. (2017) 2017:8523728. doi: 10.1155/2017/8523728
35
Lewis GF Hegele RA . Effective, disease-modifying, clinical approaches to patients with mild-to-moderate hypertriglyceridaemia. Lancet Diabetes Endocrinol. (2022) 10:142–8. doi: 10.1016/S2213-8587(21)00284-9
36
Halle M Berg A Garwers U Baumstark MW Knisel W Grathwohl D et al . Influence of 4 weeks’ intervention by exercise and diet on low-density lipoprotein subfractions in obese men with type 2 diabetes. Metab Clin Exp. (1999) 48:641–4. doi: 10.1016/s0026-0495(99)90064-1
37
Oberbach A Tönjes A Klöting N Fasshauer M Kratzsch J Busse MW et al . Effect of a 4 week physical training program on plasma concentrations of inflammatory markers in patients with abnormal glucose tolerance. Eur J Endocrinol. (2006) 154:577–85. doi: 10.1530/eje.1.02127
38
Ristow M Zarse K Oberbach A Klöting N Birringer M Kiehntopf M et al . Antioxidants prevent health-promoting effects of physical exercise in humans. Proc Natl Acad Sci. (2009) 106:8665–70. doi: 10.1073/pnas.0903485106
39
Shakoor H Kizhakkayil J Khalid M Mahgoub A Platat C . Effect of moderate-intense training and detraining on glucose metabolism, lipid profile, and liver enzymes in Male wistar rats: a preclinical randomized study. Nutrients. (2023) 15:3820. doi: 10.3390/nu15173820
40
Kanaley JA Colberg SR Corcoran MH Malin SK Rodriguez NR Crespo CJ et al . Exercise/physical activity in individuals with type 2 diabetes: a consensus statement from the american college of sports medicine. Med Sci Sports Exercise. (2022) 54:353. doi: 10.1249/MSS.0000000000002800
41
Bonaventura A Liberale L Carbone F Vecchié A Bonomi A Scopinaro N et al . Baseline neutrophil-to-lymphocyte ratio is associated with long-term T2D remission after metabolic surgery. Acta Diabetol. (2019) 56:741–8. doi: 10.1007/s00592-019-01345-2
42
Zubiaga L Ruiz-Tovar J . Correlation of preoperative neutrophil-to-lymphocyte ratio and platelet-to-lymphocyte ratio with metabolic parameters in patients undergoing sleeve gastrectomy. Surg Obes Relat Dis: Off J Am Soc Bariatr Surg. (2020) 16:999–1004. doi: 10.1016/j.soard.2020.04.042
43
Boughanem H Gutierrez-Mariscal FM Arenas-de Larriva AP Torres-Peña JD Romero-Cabrera JL Rangel-Zuñiga OA et al . Effect of long-term mediterranean versus low-fat diet on neutrophil count, and type 2 diabetes mellitus remission in patients with coronary heart disease: results from the CORDIOPREV study. Nutr Diabetes. (2025) 15:11. doi: 10.1038/s41387-025-00360-3
44
Kolb H . Obese visceral fat tissue inflammation: from protective to detrimental? BMC Med. (2022) 20:494. doi: 10.1186/s12916-022-02672-y
45
Cao Y Zhou J Quan H Li W Li T Wang L . Resistance training alleviates muscle atrophy and muscle dysfunction by reducing inflammation and regulating compromised autophagy in aged skeletal muscle. Front Immunol. (2025) 16:1597222. doi: 10.3389/fimmu.2025.1597222
46
Acosta-Manzano P Flor-Alemany M Martínez-González LJ Alvarez-Cubero MJ Baena-García L Nestares T et al . The effects of a supervised exercise training program during pregnancy on placental cytokines, and the potential role of fetal sex and maternal weight status. J Sport Health Sci. (2025) 101082. doi: 10.1016/j.jshs.2025.101082
47
Lira FS Rosa JC Pimentel GD Tarini VAF Arida RM Faloppa F et al . Inflammation and adipose tissue: effects of progressive load training in rats. Lipids Health Dis. (2010) 9:109. doi: 10.1186/1476-511X-9-109
48
Nazanin M Razi M Tolouei-Azar J . Effect of running exercise training on inflammatory mediators and cytokines expression in testicular tissue; effect of exercise intensity. Life Sci. (2024) 339:122397. doi: 10.1016/j.lfs.2023.122397
49
Stefan N Staiger H Wagner R Machann J Schick F Häring HU et al . A high-risk phenotype associates with reduced improvement in glycaemia during a lifestyle intervention in prediabetes. Diabetologia. (2015) 58:2877–84. doi: 10.1007/s00125-015-3760-z
50
Álvarez C Ramírez-Campillo R Ramírez-Vélez R Izquierdo M . Prevalence of non-responders for glucose control markers after 10 weeks of high-intensity interval training in adult women with higher and lower insulin resistance. Front Physiol. (2017) 8:479. doi: 10.3389/fphys.2017.00479
51
Kirwan JP Solomon TPJ Wojta DM Staten MA Holloszy JO . Effects of 7 days of exercise training on insulin sensitivity and responsiveness in type 2 diabetes mellitus. Am J Physiol Endocrinol Metab. (2009) 297:E151–156. doi: 10.1152/ajpendo.00210.2009
52
Eguchi K Nagai R . Islet inflammation in type 2 diabetes and physiology. J Clin Invest. (2017) 127:14–23. doi: 10.1172/JCI88877
53
Kohlgruber A Lynch L . Adipose tissue inflammation in the pathogenesis of type 2 diabetes. Curr Diabetes Rep. (2015) 15:92. doi: 10.1007/s11892-015-0670-x
54
Brown MR Laouteouet D Delobel M Villard O Broca C Bertrand G et al . The nuclear receptor REV-ERBα is implicated in the alteration of β-cell autophagy and survival under diabetogenic conditions. Cell Death Dis. (2022) 13:353. doi: 10.1038/s41419-022-04767-z
55
Liu M Feng L Wang X . Effect of four-week aerobic exercise intervention on insulin resistance and inflammatory factors in obese adolescents. J Shanghai Univ Sport. (2015) 39:87–9. doi: 10.3969/j.issn.1000-5498.2015.03.017
56
Kadoglou NPE Iliadis F Angelopoulou N Perrea D Ampatzidis G Liapis CD et al . The anti-inflammatory effects of exercise training in patients with type 2 diabetes mellitus. Eur J Cardiovasc Prev Rehabil. (2007) 14:837–43. doi: 10.1097/HJR.0b013e3282efaf50
57
Moghadasi M Mohebbi H Rahmani-Nia F Hassan-Nia S Noroozi H . Effects of short-term lifestyle activity modification on adiponectin mRNA expression and plasma concentrations. Eur J Sport Sci. (2013) 13:378–85. doi: 10.1080/17461391.2011.635701
58
Brooks N Layne JE Gordon PL Roubenoff R Nelson ME Castaneda-Sceppa C . Strength training improves muscle quality and insulin sensitivity in hispanic older adults with type 2 diabetes. Int J Med Sci. (2006) 4:19–27. doi: 10.7150/ijms.4.19
59
Mavros Y Kay S Simpson KA Baker MK Wang Y Zhao RR et al . Reductions in C-reactive protein in older adults with type 2 diabetes are related to improvements in body composition following a randomized controlled trial of resistance training. J Cachexia Sarcopenia Muscle. (2014) 5:111–20. doi: 10.1007/s13539-014-0134-1
60
Kadoglou NPE Fotiadis G Athanasiadou Z Vitta I Lampropoulos S Vrabas IS . The effects of resistance training on ApoB/ApoA-I ratio, lp(a) and inflammatory markers in patients with type 2 diabetes. Endocrine. (2012) 42:561–9. doi: 10.1007/s12020-012-9650-y
61
Kadoglou NPE Fotiadis G Kapelouzou A Kostakis A Liapis CD Vrabas IS . The differential anti-inflammatory effects of exercise modalities and their association with early carotid atherosclerosis progression in patients with type 2 diabetes. Diabetes Med: J Br Diabetes Assoc. (2013) 30:e41–50. doi: 10.1111/dme.12055
Summary
Keywords
systemic immune-inflammation index, type 2 diabetes mellitus, insulin resistance, exercise intervention, heterogeneous response
Citation
Cheng W, Guo K, Zhang X and Zhang K (2025) Postexercise immune-inflammatory improvement in type 2 diabetes is associated with baseline insulin resistance. Front. Endocrinol. 16:1679142. doi: 10.3389/fendo.2025.1679142
Received
19 August 2025
Accepted
29 October 2025
Published
18 November 2025
Volume
16 - 2025
Edited by
Victor Enrique Sarmiento-Ortega, Meritorious Autonomous University of Puebla, Mexico
Reviewed by
Tatiana Romero-García, Universidad Autonoma de Baja California, Mexico
Zhimin Lu, Qilu Medical University, China
Updates
Copyright
© 2025 Cheng, Guo, Zhang and Zhang.
This is an open-access article distributed under the terms of the Creative Commons Attribution License (CC BY). The use, distribution or reproduction in other forums is permitted, provided the original author(s) and the copyright owner(s) are credited and that the original publication in this journal is cited, in accordance with accepted academic practice. No use, distribution or reproduction is permitted which does not comply with these terms.
*Correspondence: Wei Cheng, chengwei780411@sohu.com; Keqin Zhang, keqzhang2007@126.com
†These authors have contributed equally to this work
Disclaimer
All claims expressed in this article are solely those of the authors and do not necessarily represent those of their affiliated organizations, or those of the publisher, the editors and the reviewers. Any product that may be evaluated in this article or claim that may be made by its manufacturer is not guaranteed or endorsed by the publisher.