Abstract
Objective:
Ischemic stroke (IS) with hyperuricemia (HUA) correlates with poor outcomes, yet the shared pathophysiological traits remain unclear. This study examined metabolic parameters in HUA-IS comorbidity and developed an optimal interpretable Clinlabomics model for risk assessment.
Methods:
A total of 2,164 IS patients and 2,459 healthy controls (HCs) were retrospectively enrolled. Participants were divided into four groups: HUA-IS (comorbidity, n=1,082), non-HUA IS (n=1,082), HUA HCs (n=1,314), non-HUA HCs (n=1,145); the latter three were defined as the non-comorbidity group. After 1:1 propensity score matching (PSM), 1,031 cases were matched in each group. Ten metabolic parameters were analyzed: serum uric acid at admission (SUA_admission), SUA on the third day of hospitalization (SUA_3d), triglyceride-glucose index (TyG), triglyceride (TG), high-density lipoprotein cholesterol (HDL−C), atherogenic index of plasma (AIP), atherogenic coefficient (AC), lipoprotein combine index (LCI), Castelli’s risk index I (CRI-I), and Castelli’s risk index II (CRI-II). Univariate/multivariate logistic regression, quartile-based logistic regression, and restricted cubic spline (RCS) analysis were used to explore parameters - comorbidity associations. Post-PSM data were split 7:3 into training/testing sets, least absolute shrinkage and selection operator (LASSO) regression selected features, and 11 machine learning algorithms developed Clinlabomics models. Additionally, the optimal model was validated in the testing set and an independent validation set.
Results:
After PSM, multivariate logistic regression identified AIP as the strongest risk factor (OR = 2.74, 95%CI: 1.80-4.19). The Q4 of TyG, TG, AIP, and LCI elevated comorbidity risk (P < 0.05). Besides, RCS showed nonlinear association of LCI with comorbidity (P < 0.05). The Recursive Partitioning and Regression Trees (rpart)-based Clinlabomics model exhibited favorable performance with F1-score, accuracy (ACC), and area under the curve (AUC) of 0.960, 0.960, and 0.986. At optimal hyperparameter (cp=0.0017), the model achieved AUCs of 0.987 (95%CI: 0.982-0.993), 0.955 (95%CI: 0.939-0.972), and 0.957 (95%CI: 0.915-0.999) in the training, testing, and validation datasets, respectively, correctly identifying 87.7% non-comorbidity and 98.0% comorbidity patients in validation. SHapley Additive exPlanations (SHAP) analysis identified UA_admission, UA_3d, TyG, TG, AIP and LCI as key metabolic indicators.
Conclusion:
TyG, TG, AIP, and LCI were critical metabolic parameters for HUA-IS comorbidity, which warrant heightened attention in future comorbidity research.
Graphical Abstract

Introduction
Stroke, a major acute cerebrovascular disease, ranks among the leading causes of death and long-term disability worldwide, imposing a substantial burden on global health. Based on estimates from the Global Burden of Disease Study 2021, it is projected that by 2025, disability-adjusted life years (DALYs) due to stroke will increase by 12.9%, and stroke-related mortality will rise by 28.5% (1), underscoring a pressing public health challenge. Ischemic stroke (IS) is the most common subtype, accounting for 62.4% of all stroke cases (2). Globally, approximately 7.6 million new IS cases are diagnosed each year, with an age-standardized incidence rate of 98.62 per 100,000 person-years (3), highlighting an urgent need for improved prevention and clinical management.
Elevated serum uric acid (SUA) is significantly associated with the onset and progression of IS. Beyond physiological levels, SUA promotes inflammasome activation, increases proinflammatory cytokine release, and exacerbates oxidative stress and vascular inflammation, leading to endothelial dysfunction. These mechanisms collectively accelerate atherosclerosis and thrombus formation, thereby increasing stroke risk (4–6). Clinical studies have shown that SUA levels ≥ 340 μmol/L are associated with a 92.6% increase in recurrence risk among IS patients after adjusting for confounders (7). A meta-analysis further supports that hyperuricemia (HUA) is linked to a higher risk of IS recurrence (pooled OR = 1.80, 95% CI: 1.47–2.20) (8). Moreover, HUA has been identified as an independent predictor of adverse outcomes in patients with acute ischemic stroke (AIS) (9–13).
Beyond SUA, other metabolic abnormalities also contribute to the risk of IS. Impaired fasting glucose (IFG), which is defined as a fasting blood glucose (FBG) level of 6.1–6.9 mmol/L, is associated with an increased risk of IS (HR = 1.16, 95% CI: 1.07–1.25) (14). The triglyceride-glucose (TyG) index, a well-validated marker of insulin resistance, is also consistently linked to higher IS incidence in meta-analyses (15, 16). Interestingly, our previous study identified a dyslipidemia-rich phenotype among AIS patients via unsupervised clustering (17), reflecting lipid abnormalities in IS patients. Notably, HUA frequently coexists with disorders of glucose and lipid metabolism. There is a bidirectional relationship between HUA and hyperinsulinemia or diabetes mellitus (DM): impaired renal function secondary to dysglycemia reduces SUA excretion, while elevated SUA may aggravate glucose metabolic dysfunction (18). Consistently, Gu et al. reported that a higher TyG index, significantly increase the risk of incident HUA (19). HUA also commonly co-occurs with dyslipidemia, and its interaction synergistically promotes IS progression. Mechanistically, high SUA induces insulin resistance and disrupts lipid homeostasis (5, 20), both of which are central to the development of IS-related comorbidities such as diabetes and atherosclerosis.
Given that SUA, TyG, and lipid parameters are closely interlinked in the context of HUA and IS, a systematic evaluation of their combined role is essential for understanding underlying mechanisms and refining risk assessment. However, current evidence lacks a comprehensive assessment of these metabolic parameters, including SUA, TyG, and multiple lipid indices (e.g., TC, TG, LDL-C, HDL-C, non-HDL-C, atherogenic index of plasma [AIP], atherogenic coefficient [AC], lipoprotein combine index [LCI], Castelli’s risk index I [CRI-I], Castelli’s risk index II [CRI-II]) (21), as shared biomarkers in patients with comorbid HUA and IS. In recent years, as machine learning (ML) algorithms advance rapidly in healthcare, Professor Luo proposed the novel concept of Clinlabomics in 2022. This concept integrates multidimensional clinical and laboratory data with advanced ML algorithms to develop models for disease identification and risk assessment (22). Notably, Clinlabomics model can decipher the black-box nature of ML-derived models, enhance model transparency, and distinguish comorbid patients based on existing indicators. However, to date, there remains a lack of Clinlabomics models specifically dedicated to distinguishing HUA-IS comorbid patients.
To address this gap, we profiled these metabolic parameters in a comorbid cohort before and after 1:1 propensity score matching (PSM). We employed restricted cubic spline (RCS) analysis to explore potential non-linear associations, used 11 ML algorithms to develop Clinlabomics models, and applied the SHapley Additive exPlanations (SHAP) method to decipher the black-box nature of the optimal model and quantify the contributions of each indicator to the model’s estimates. This transparent and data-driven framework aims to facilitate the rapid identification of the HUA-IS comorbidity population.
Materials and methods
Study population
We retrospectively enrolled patients diagnosed with IS who were admitted to the Department of Neurology at Suining Central Hospital between January 2023 and July 2025. During hospitalization, all participants were required to have undergone at least two separate fasting SUA measurements on non-consecutive days, with the first conducted on the day of admission and the second on day 3 after admission. The inclusion criteria for IS patients were as follows: age ≥ 18 years and a first-time IS diagnosis confirmed by neuroimaging, such as cranial computed tomography (CT) or magnetic resonance imaging (MRI). Exclusion criteria included: tumor; chronic kidney disease (CKD) caused by diverse etiologies, severe dysfunction of major organs (heart, liver, kidney, or lungs); severe systemic infection or sepsis; autoimmune diseases; receipt of in-hospital anticoagulation, thrombolysis, or reperfusion therapy; a previous history of stroke or psychiatric disorders, or those who underwent only one SUA measurement after admission. Furthermore, we also concurrently included 2,459 relatively healthy subjects, defined as those who presented with IS-like symptoms but were confirmed non-IS via imaging examinations and had no tumors, CKD, severe organ function impairment, or infection. Based on prior studies (23, 24), HUA was defined as a SUA level ≥ 7.0 mg/dL (420 μmol/L) among males and ≥ 6.0 mg/dL (360 μmol/L) among females. This study was approved by the Ethics Committee of the Suining Central Hospital (No. KYLLKS20250126). Informed consent of all participants were involved. The flow diagram illustrating all analytical procedures in this study is presented in Figure 1.
Figure 1

Flowchart of this study.
Data collection
We extracted general clinical characteristics of the participants from electronic medical records, including age, gender, marital status, ethnicity, height, weight, systolic blood pressure (SBP), diastolic blood pressure (DBP), and medical histories of DM, coronary heart disease (CHD), atrial fibrillation (AF), hypertension (HTN), hyperlipidemia (HLP); medication histories of antiplatelet therapy (APT), antihypertensive therapy, antidiabetic therapy, statin therapy, and urate-lowering therapy; as well as smoking and alcohol use. Hyperlipidemia (HLP) was defined as TG ≥ 150 mg/dl (1.70 mmol/L), TC ≥ 240 mg/dl (6.22 mmol/L), LDL-C ≥ 160 mg/dl (4.14 mmol/L), HDL-C < 40 mg/dl (1.04 mmol/L), or a medical diagnosis (25). All laboratory parameters, including routine blood tests, a coagulation profile, renal function tests, electrolytes, and a lipid panel, all of which were all measured on admission, were retrieved from the Laboratory Information System (LIS). Since the proportion of missing D-dimer values exceeded 60%, we did not incorporate it into the coagulation profile. Meanwhile, we also collected SUA of all participants on the 3rd day after admission. For patients with IS, we additionally collected the time from symptom onset to admission; Trial of Org 10172 in Acute Stroke Treatment (TOAST) classification; and modified Rankin Scale (mRS), National Institutes of Health Stroke Scale (NIHSS), and Glasgow Coma Scale (GCS) scores at admission. FBG was measured by the hexokinase method; UA was detected by the uricase-peroxidase method; TC was measured by the cholesterol oxidase method; TG was quantified by the glycerol-3-phosphate oxidase-peroxidase (GPO-POD) method; HDL-C and LDL-C were detected by direct methods, with all assays performed on a Beckman Coulter AU5800 analyzer. Besides, other relevant derived indices are provided below: neutrophil-to-lymphocyte ratio (NLR) = neutrophil (NEU)/lymphocyte (LYM), lymphocyte-to-monocyte ratio (LMR) = LYM/monocyte (MON), systemic inflammation index (SII) = platelet (PLT) * NEU/LYM (26), system inflammation response index (SIRI)=NEU*MON/LYM (27), platelet-to-neutrophil ratio (PNR) = PLT/NEU (28), platelet-to-lymphocyte ratio (PLR) = PLT/LYM (28), monocyte to high-density lipoprotein cholesterol ratio (MHR) = MON/high-density lipoprotein cholesterol (HDL-C) (29), neutrophil to high-density lipoprotein ratio (NHR) = NEU/HDL-C (30), platelet to high-density lipoprotein cholesterol ratio (PHR) = PLT/HDL-C (31), hemoglobin-to-red blood cell distribution width ratio (HRR) = hemoglobin (HGB)/red blood cell distribution width (RDW) (32), Hemoglobin, Albumin, Lymphocyte, Platelet Score (HALP) = hemoglobin (HGB) * albumin (ALB) * LYM/PLT (33), triglyceride-glucose index (TyG) = ln(fasting blood glucose [FBG] (mg/dL) * triglyceride [TG] (mg/dL)/2) (34), atherogenic index of plasma (AIP) = lg(TG/HDL-C) (35), atherogenic coefficient (AC) = non-high-density lipoprotein cholesterol (non-HDL-C)/HDL-C (36), lipoprotein combine index (LCI) = total cholesterol (TC) * TG * low-density lipoprotein cholesterol (LDL-C)/HDL-C (37, 38), Castelli’s risk index I (CRI-I) = TC/HDL-C (36), and Castelli’s risk index II (CRI-II) = LDL-C/HDL-C (36).
Statistical analyses
For data with missing values below 5%, we performed multiple imputation using the “mice” package, with the number of iterations (parameter m) set to 5, which effectively handled the missing values. Normality of continuous variables was assessed using the Kolmogorov-Smirnov test. Variables conforming to a normal distribution were expressed as mean ± standard deviation (SD) and compared using the Student’s t-test; otherwise, they were summarized as median (Q1, Q3) and compared using the Mann-Whitney U test. Categorical variables were described as frequencies and percentages and compared by the chi-square test. To mitigate potential confounding effects, we performed 1:1 propensity score matching (PSM) (39), matching the comorbidity and non-comorbidity groups to 1,031 subjects. The covariates included age, gender, marriage, nationality, SBP, DBP, BMI, the bad habits of drinking and smoking; the histories of HTN, DM, AF and CHD, HLP; medication histories of APT, antihypertensive therapy, antidiabetic therapy, statin therapy, and urate-lowering therapy; and inflammatory markers (WBC count and SII). The propensity score was calculated for each participant using a caliper width of 0.02. Balance between groups after matching was evaluated with standardized mean difference (SMD) and quartile comparisons (40), using the Love plot for balance assessment. Post-matching results indicated well-balanced baseline characteristics between the two groups. Univariate and multivariate logistic regression were employed to assess the association between differential metabolic parameters and the risk of HUA-IS comorbidity before and after PSM. We categorized significant variables identified from the multivariate logistic regression analysis to quartile-based logistic regression. Three models were employed: Model 1 (crude model) included no covariates; Model 2 (partially adjusted model) was adjusted for demographic factors (age, gender, marital status, nationality, SBP, DBP, drinking status, smoking status, histories of HTN, DM, AF, CHD, HLP, and body mass index [BMI]); Model 3 (fully adjusted model) further incorporated medication histories of APT, antihypertensive therapy, antidiabetic therapy, statin therapy, urate-lowering therapy, and inflammatory status (WBC and SII). Subsequently, we performed restricted cubic spline (RCS) analysis on variables that remained significant in the quartile-based logistic regression to evaluate the dose-response relationship, with 4 knots placed at the 5th, 35th, 65th, and 95th percentiles. The matched dataset was split into training and internal validation sets in a 7:3 ratio. For variables with significant differences in the training set, we applied the LASSO method for regularization and coefficient shrinkage, thereby shrinking the coefficients of irrelevant features to zero and selecting features for subsequent model construction (41). In the training set, based on the selected features, 11 ML algorithms, including Generalized Linear Model (glm), Recursive Partitioning and Regression Trees (rpart), Naive Bayes (nb), Bayesian Generalized Linear Model (bayesglm), Random Forest (rf), eXtreme Gradient Boosting Tree (xgbTree), Support Vector Machine with Radial Basis Function Kernel (svmRadial), Support Vector Machine with Linear Kernel (svmLinear), Gradient Boosting Machine (gbm), Multivariate Adaptive Regression Splines (earth), and Elastic Net Regularized Regression (glmnet), were utilized to construct Clinlabomics models for HUA-IS comorbidity. Hyperparameter tuning was performed via grid search in the training set. Model performance was evaluated using the accuracy (ACC), F1-score, and area under the curve (AUC), with the optimal Clinlabomics model identified. Receiver operating characteristic (ROC) curves, calibration curve, and decision curve analysis (DCA) were used to evaluate the discriminative ability, the agreement between predicted probabilities and actual probabilities, and the clinical utility of the optimal model, respectively. Based on the optimal model, we also calculated its Brier score to further quantify the model’s calibration performance. Subsequently, we enrolled 108 participants from August to September 2025 as the independent validation cohort to evaluate the accuracy of the optimal Clinlabomics model. In addition, to interpret the contribution of individual features to the model, the SHAP algorithm was applied to compute SHAP values from the best-performing Clinlabomics model (42). SHAP values quantify the marginal contribution of each feature to the estimated outcome. This approach supports both local and global interpretability of the model. The entire process for Clinlabomics model development was performed using the “Icare” package (https://github.com/OmicsLY/Icare). All statistical analyses were performed using RStudio (Version 4.3.0). A two-sided P-value < 0.05 was considered statistically significant.
Results
Baseline characteristics of participants
A total of 2,164 IS patients and 2,459 healthy controls (HCs) were included in this study. Based on two SUA levels, subjects were stratified into four groups: non-HUA HCs (n=1,145), HUA HCs (1,314), non-HUA IS (n=1,082), and HUA-IS comorbidity (n=1,082) group, with differences in characteristics across groups presented in Table 1. A detailed flowchart is provided in Figure 1. Supplementary Table S1 presents missing data proportions and data distributions before and after imputation, with no significant differences detected in the latter. Meanwhile, we compared the differences of indicators between non-HUA IS patients and non-HUA HCs (Supplementary Table S2), as well as between HUA HCs and non-HUA HCs (Supplementary Table S3). Through these comparisons, we identified differentially expressed indicators closely associated with IS and HUA, respectively. To further investigate the potential pathogenic mechanism of the comorbidity group, we merged all groups except the HUA-IS comorbidity group into a non-comorbidity group and compared the differences in indicators (Supplementary Table S4). Subsequently, we took the intersection of the differentially expressed indicators from these three groups (Supplementary Table S5), identifying 33 indicators closely associated with IS, HUA, and comorbidity (Supplementary Figure 1). Among these, ten metabolic indicators, including UA_admission, UA_3d, TyG, TG, HDL-C, AIP, AC, LCI, CRI-I, and CRI-II, were found to be closely correlated with the comorbidity, indicating no significant biological confounding. After PSM, both the comorbidity and non-comorbidity groups included 1,031 cases each, with 2,561 participants (55.4%). The standardized mean difference (SMD) values of these covariates were all less than 0.1, as visualized via a Love plot (Supplementary Table S6, Supplementary Figure 2). Significant differences (all P < 0.05) were observed between the two groups in nationality, DBP, MON, NLR, LMR, SII, SIRI, PLR, MHR, HRR, HALP, RBC, HGB, HCT, RDW-CV, TG, AIP, LCI, TyG, UREA, CREA, UA_admission, UA_3d, and TT (Table 2). Additionally, the dataset was randomly split into a training set and a testing set at a 7:3 ratio, with intergroup differences in the training set presented in Table 3. Furthermore, the detailed characteristics of all clinical and laboratory results in the independent validation cohort were presented in Table 4.
Table 1
| Variables | Total (n = 4,623) | Non-HUA HCs (n = 1,145) | HUA HCs (n = 1,314) | Non-HUA IS (n = 1,082) | Comorbidity (n = 1,082) | P |
|---|---|---|---|---|---|---|
| Age (years) | 67 (56, 75) | 64 (56, 72) | 61 (49, 72) | 71 (60, 78) | 71 (60, 78) | < 0.001 |
| Gender (Male, n, %) | 2655 (57) | 494 (43) | 810 (62) | 675 (62) | 676 (62) | < 0.001 |
| Marriage (Other status, n, %) | 456 (10) | 86 (8) | 146 (11) | 116 (11) | 108 (10) | 0.016 |
| Nationality (Ethnic minority, n, %) | 171 (4) | 92 (8) | 76 (6) | 1 (0) | 2 (0) | < 0.001 |
| APT, n (Yes, %) | 430 (9) | 10 (1) | 13 (1) | 182 (17) | 225 (21) | < 0.001 |
| Antihypertensive therapy, n (Yes, %) | 1770 (38) | 165 (14) | 240 (18) | 642 (59) | 723 (67) | < 0.001 |
| Antidiabetic therapy, n (Yes, %) | 592 (13) | 34 (3) | 63 (5) | 241 (22) | 254 (23) | < 0.001 |
| Statins therapy, n (Yes, %) | 435 (9) | 8 (1) | 13 (1) | 182 (17) | 232 (21) | < 0.001 |
| Urate-lowering therapy, n (Yes, %) | 64 (1) | 0 (0) | 25 (2) | 0 (0) | 39 (4) | < 0.001 |
| Time of onset (h) | 48 (13.2, 168) | - | - | 48 (12, 144) | 48 (15, 168) | – |
| TOAST, n (%) | – | |||||
| LAA | 683 (15) | - | - | 358 (33) | 325 (30) | |
| SAO | 1182 (26) | - | - | 580 (54) | 602 (56) | |
| CE | 163 (4) | - | - | 74 (7) | 89 (8) | |
| SOE | 92 (2) | - | - | 45 (4) | 47 (4) | |
| SUE | 44 (1) | - | - | 25 (2) | 19 (2) | |
| GCS_admission | 15 (15,15) | - | - | 1 (0,1) | 1 (0,1) | – |
| mRS_admission | 1 (0,1) | - | - | 15 (15, 15) | 15 (15, 15) | – |
| NIHSS_admission | 2 (1,4) | - | - | 2 (1, 4) | 1 (0, 3) | – |
| SBP (mmHg) | 137 (122, 151) | 132 (119, 143) | 130 (119, 145) | 141 (128, 157) | 139 (125, 157) | < 0.001 |
| DBP (mmHg) | 83 (73, 90) | 80 (73, 87) | 82 (72, 90) | 83 (75, 94) | 83 (74, 94) | < 0.001 |
| Drinking (Yes, n, %) | 743 (16) | 98 (9) | 178 (14) | 224 (21) | 243 (22) | < 0.001 |
| Smoking (Yes, n, %) | 443 (10) | 75 (7) | 116 (9) | 128 (12) | 124 (11) | < 0.001 |
| HTN (Yes, n, %) | 2703 (58) | 495 (43) | 682 (52) | 731 (68) | 795 (73) | < 0.001 |
| DM (Yes, n, %) | 870 (19) | 141 (12) | 168 (13) | 273 (25) | 288 (27) | < 0.001 |
| AF (Yes, n, %) | 117 (3) | 4 (0) | 16 (1) | 40 (4) | 57 (5) | < 0.001 |
| CHD (Yes, n, %) | 277 (6) | 36 (3) | 86 (7) | 69 (6) | 86 (8) | < 0.001 |
| HLP (Yes, n, %) | 2534 (55) | 510 (45) | 774 (59) | 572 (53) | 678 (63) | < 0.001 |
| BMI (Kg/m^2) | 25.14 (23.01, 27.1) | 23.88 (22.22, 26.03) | 24.77 (22.72, 27.28) | 25.86 (23.97, 27.30) | 25.81 (24.03, 27.47) | < 0.001 |
| WBC (10^9/L) | 6.7 (5.5, 8.2) | 6.2 (5.1, 7.6) | 6.5 (5.5, 7.9) | 7.0 (5.7, 8.6) | 7.1 (5.8, 9.0) | < 0.001 |
| NEU (10^9/L) | 4.41 (3.34, 5.94) | 3.98 (2.92, 5.46) | 4.08 (3.21, 5.60) | 4.80 (3.65, 6.49) | 4.82 (3.71, 6.46) | < 0.001 |
| LYM (10^9/L) | 1.46 (1.08, 1.86) | 1.47 (1.08, 1.87) | 1.55 (1.17, 1.97) | 1.37 (1.03, 1.72) | 1.41 (1.03, 1.86) | < 0.001 |
| MON (10^9/L) | 0.51 (0.38, 0.83) | 0.42 (0.34, 0.54) | 0.45 (0.36, 0.56) | 0.81 (0.47, 1.41) | 0.9 (0.47, 1.54) | < 0.001 |
| NLR | 2.96 (2.01, 4.69) | 2.55 (1.74, 4.50) | 2.63 (1.75, 3.98) | 3.48 (2.37, 5.46) | 3.27 (2.33, 5.19) | < 0.001 |
| LMR | 2.65 (1.00, 4.02) | 3.42 (2.36, 4.61) | 3.50 (2.50, 4.57) | 1.00 (1.00, 2.89) | 1.00 (1.00, 2.77) | < 0.001 |
| SII | 550 (356, 907) | 488 (305, 829) | 480 (312, 794) | 665 (426, 1059) | 612 (395, 969) | < 0.001 |
| SIRI | 1.86 (0.91, 3.92) | 1.12 (0.67, 2.19) | 1.20 (0.74, 2.02) | 3.58 (1.72, 5.45) | 3.59 (1.70, 5.44) | < 0.001 |
| PNR | 41.79 (29.56, 58.09) | 47.12 (32.17, 65.43) | 44.88 (32.04, 61.78) | 39.22 (27.62, 52.63) | 38.69 (27.2, 50.80) | < 0.001 |
| PLR | 129.19 (95.94, 171.48) | 125.47 (93.02, 169.47) | 119.38 (93.12, 153.10) | 140.40 (105.51, 189.4) | 130.76 (95.38, 178.25) | < 0.001 |
| MHR | 0.43 (0.29, 0.71) | 0.34 (0.24, 0.46) | 0.36 (0.27, 0.49) | 0.64 (0.39, 1.12) | 0.71 (0.39, 1.26) | < 0.001 |
| NHR | 3.53 (2.56, 4.98) | 3.08 (2.17, 4.34) | 3.34 (2.51, 4.62) | 3.91 (2.78, 5.57) | 3.96 (2.93, 5.53) | < 0.001 |
| PHR | 146.43 (110.70, 193.17) | 138.33 (103.60, 188.19) | 147.87 (115.82, 189.74) | 148.6 (111.89, 196.69) | 148.44 (112.31, 198.86) | < 0.001 |
| HRR | 9.92 (8.59, 11.03) | 9.70 (8.48, 10.92) | 10.32 (8.96, 11.37) | 9.65 (8.48, 10.68) | 9.78 (8.42, 10.91) | < 0.001 |
| HALP | 41.55 (28.60, 57.09) | 41.09 (28.60, 56.95) | 46.48 (33.45, 61.67) | 36.85 (24.65, 51.21) | 41.56 (27.87, 56.69) | < 0.001 |
| RBC (10^12/L) | 4.33 (3.90, 4.77) | 4.25 (3.80, 4.65) | 4.43 (4.00, 4.90) | 4.26 (3.89, 4.68) | 4.36 (3.93, 4.79) | < 0.001 |
| HGB (g/L) | 132 (118, 144) | 128 (115, 141) | 137 (120, 148) | 130 (117, 141) | 132 (118, 145) | < 0.001 |
| HCT (%) | 39.7 (35.9, 43.5) | 39.0 (35.3, 42.7) | 41.0 (36.3, 44.8) | 39.2 (35.6, 42.6) | 39.85 (36.2, 43.8) | < 0.001 |
| MCV (fL) | 92.4 (89.2, 95.5) | 93.1 (89.9, 96.0) | 92.2 (88.9, 95.4) | 92.2 (88.7, 95.3) | 92.1 (89.1, 95.2) | < 0.001 |
| MCHC (g/L) | 331 (324, 337) | 330 (323, 336) | 331 (324, 337) | 331 (324, 338) | 331 (324, 338) | 0.002 |
| MCH (pg) | 30.6 (29.4, 31.8) | 30.7 (29.6, 31.9) | 30.4 (29.3, 31.7) | 30.6 (29.4, 31.7) | 30.5 (29.3, 31.7) | 0.024 |
| RDW-CV (%) | 13.3 (12.8, 14.1) | 13.2 (12.6, 13.9) | 13.2 (12.6, 13.9) | 13.4 (12.9, 14.2) | 13.6 (13.0, 14.3) | < 0.001 |
| PLT (10^9/L) | 186 (146, 227) | 183 (145, 226) | 183 (147, 218) | 189 (149, 229) | 187 (143, 232) | 0.038 |
| CRP (mg/L) | 3.70 (1.03, 6.46) | 3.70 (1.11, 6.04) | 3.70 (1.05, 6.01) | 3.31 (0.92, 14.24) | 3.43 (1.01, 14.24) | < 0.001 |
| TC (mmol/L) | 4.46 (3.71, 5.24) | 4.44 (3.80, 5.14) | 4.52 (3.79, 5.21) | 4.38 (3.59, 5.32) | 4.46 (3.64, 5.34) | 0.154 |
| TG (mmol/L) | 1.45 (1.00, 2.13) | 1.24 (0.94, 1.77) | 1.56 (1.08, 2.36) | 1.36 (0.96, 1.98) | 1.64 (1.11, 2.38) | < 0.001 |
| LDL-C (mmol/L) | 2.68 (2.15, 3.27) | 2.63 (2.21, 3.13) | 2.72 (2.19, 3.31) | 2.69 (2.03, 3.33) | 2.73 (2.09, 3.35) | 0.278 |
| HDL-C (mmol/L) | 1.25 (1.05, 1.48) | 1.29 (1.08, 1.54) | 1.22 (1.05, 1.46) | 1.25 (1.05, 1.47) | 1.22 (1.04, 1.45) | < 0.001 |
| Non-HDL-C (mmol/L) | 3.16 (2.50, 3.89) | 3.10 (2.53, 3.72) | 3.26 (2.55, 3.91) | 3.14 (2.39, 3.98) | 3.20 (2.45, 4.01) | 0.003 |
| AIP | 0.06 (-0.11, 0.27) | 0 (-0.17, 0.17) | 0.10 (-0.06, 0.30) | 0.05 (-0.14, 0.23) | 0.12 (-0.06, 0.34) | < 0.001 |
| AC | 2.57 (1.95, 3.23) | 2.37 (1.85, 2.98) | 2.66 (2.03, 3.28) | 2.52 (1.90, 3.25) | 2.61 (1.99, 3.33) | < 0.001 |
| LCI | 13.96 (7.41, 25.87) | 11.27 (6.90, 19.20) | 16.38 (8.50, 29.25) | 12.98 (6.62, 24.05) | 16.16 (8.00, 31.89) | < 0.001 |
| CRI-I | 3.57 (2.95, 4.23) | 3.37 (2.85, 3.98) | 3.66 (3.03, 4.28) | 3.52 (2.90, 4.25) | 3.61 (2.99, 4.33) | < 0.001 |
| CRI-II | 2.16 (1.68, 2.69) | 2.03 (1.62, 2.55) | 2.28 (1.71, 2.71) | 2.14 (1.67, 2.75) | 2.22 (1.70, 2.77) | < 0.001 |
| FBG (mmol/L) | 5.84 (5.01, 7.52) | 5.48 (4.89, 6.54) | 5.43 (4.82, 6.52) | 6.51 (5.32, 8.56) | 6.40 (5.31, 8.43) | < 0.001 |
| TyG | 8.86 (8.43, 9.36) | 8.66 (8.26, 9.07) | 8.86 (8.47, 9.36) | 8.91 (8.45, 9.41) | 9.08 (8.61, 9.62) | < 0.001 |
| UREA (mmol/L) | 6.19 (4.96, 7.84) | 5.97 (4.87, 7.15) | 6.26 (5.00, 8.20) | 5.81 (4.66, 7.34) | 6.86 (5.44, 9.03) | < 0.001 |
| CREA (μmol/L) | 71.5 (59.8, 88.5) | 62.0 (52.1, 71.5) | 75.0 (63.6, 92.9) | 69.0 (58.0, 83.7) | 85.9 (69.7, 110.6) | < 0.001 |
| UA_admission (μmol/L) | 382 (288, 457) | 278 (232, 321) | 453 (421, 495) | 293 (238, 342) | 458 (425, 514) | < 0.001 |
| UA_3d (μmol/L) | 366 (264, 466) | 248 (195, 306) | 454 (398, 515) | 270 (212, 333) | 464 (413, 513) | < 0.001 |
| K (mmol/L) | 3.86 (3.62, 4.12) | 3.87 (3.66, 4.09) | 3.89 (3.65, 4.17) | 3.81 (3.56, 4.05) | 3.87 (3.58, 4.17) | < 0.001 |
| Na (mmol/L) | 140.6 (138.9, 142.1) | 140.9 (139.2, 142.2) | 140.8 (139.1, 142.0) | 140.2 (138.2, 141.9) | 140.4 (138.6, 142.1) | < 0.001 |
| Cl (mmol/L) | 105.0 (103.0, 107.0) | 105.6 (104.0, 107.4) | 105.1 (103.3, 107.3) | 104.5 (102.3, 106.5) | 104.4 (102.0, 106.6) | < 0.001 |
| PTA (%) | 112 (99, 126) | 111 (100, 124) | 112 (100, 126) | 112 (98, 126) | 113 (98, 127) | 0.775 |
| TT (s) | 16.8 (15.6, 17.8) | 16.3 (15.1, 17.4) | 16.7 (15.4, 17.7) | 17.1 (15.9, 18.2) | 17.1 (16.0, 18.2) | < 0.001 |
| INR | 0.98 (0.93, 1.03) | 0.98 (0.94, 1.03) | 0.98 (0.93, 1.03) | 0.97 (0.92, 1.03) | 0.97 (0.92, 1.03) | < 0.001 |
| APTT (s) | 28.2 (26.4, 30.3) | 27.9 (26.3, 30.1) | 28.2 (26.3, 30.4) | 28.3 (26.7, 30.4) | 28.3 (26.6, 30.3) | 0.006 |
| PT (s) | 11.0 (10.5, 11.6) | 11.0 (10.6, 11.5) | 11.0 (10.5, 11.4) | 11.1 (10.5, 11.9) | 11.1 (10.6, 11.8) | < 0.001 |
| FIB (g/L) | 2.92 (2.46, 3.59) | 2.84 (2.41, 3.43) | 2.75 (2.32, 3.34) | 3.12 (2.58, 3.82) | 3.12 (2.55, 3.83) | < 0.001 |
Main characteristics of included participants before PSM.
HUA, hyperuricemia; IS, ischemic stroke; PSM, propensity score matching; APT, antiplatelet therapy; SBP, systolic blood pressure; DBP, diastolic blood pressure; TOAST, Trial of Org 10172 in Acute Stroke Treatment; LAA, large-artery atherosclerosis; SAO, small artery occlusion; CE, Cardio embolism; SOE, stroke of other determined etiologies; SUE, stroke of undetermined etiologies; GCS, Glasgow Coma Scale; mRS, Modified Rankin Scale; NIHSS, National Institutes of Health Stroke Scale; HTN, hypertension; AF, atrial fibrillation; CHD, coronary heart disease; HLP, hyperlipidemia; DM, diabetes mellitus; BMI, body mass index; NLR, neutrophil-to-lymphocyte ratio; LMR, lymphocyte-to-monocyte ratio; SII, systemic inflammatory index; PLR, platelet-to-lymphocyte ratio; HALP, hemoglobin, albumin, lymphocyte, platelet score; RBC, red blood cell; HGB, hemoglobin; HCT, hematocrit; MCHC, mean corpuscular hemoglobin concentration; RDW-CV, red blood cell distribution width-coefficient of variation; TC, total cholesterol; TG, triglyceride; LDL-C, low-density lipoprotein cholesterol; HDL-C, high-density lipoprotein cholesterol; non-HDL-C, non-high-density lipoprotein cholesterol; AIP, atherogenic index of plasma; AC, atherogenic coefficient; LCI, lipoprotein combine index; CRI-I, Castelli’s index-I; CRI-II, Castelli’s index-II; FBG, fasting blood glucose; TyG, triglyceride-glucose index; K, potassium; Na, sodium; UA, uric acid; PTA, prothrombin activity; TT, thrombin time; INR, international normalized ratio; APTT, activated partial thromboplastin time; PT, prothrombin time; FIB, fibrinogen. Bold font indicates statistically significant differences.
Table 2
| Variables | Non-comorbidity (N = 1,031) | Comorbidity (N = 1,031) | P |
|---|---|---|---|
| Age (years) | 71 (60, 78) | 70 (59, 78) | 0.500 |
| Gender (Male, n, %) | 618 (60) | 632 (61) | 0.558 |
| Marriage (Other status, n, %) | 99 (10) | 103 (10) | 0.824 |
| Nationality (Ethnic minority, n, %) | 18 (2) | 2 (0) | < 0.001 |
| APT, n (Yes, %) | 165 (16) | 188 (18) | 0.198 |
| Antihypertensive therapy, n (Yes, %) | 688 (67) | 674 (65) | 0.545 |
| Antidiabetic therapy, n (Yes, %) | 231 (22) | 236 (23) | 0.833 |
| Statins therapy, n (Yes, %) | 178 (17) | 195 (19) | 0.360 |
| Urate-lowering therapy, n (Yes, %) | 20 (2) | 23 (2) | 0.758 |
| Time of onset (h) | 48 (13, 168) | 48 (15, 168) | - |
| TOAST, n (%) | - | ||
| LAA | 217 (21) | 306 (30) | |
| SAO | 324 (31) | 582 (56) | |
| CE | 43 (4) | 81 (8) | |
| SOE | 22 (2) | 44 (4) | |
| SUE | 16 (2) | 18 (2) | |
| GCS_admission | 15 (15, 15) | 15 (15, 15) | - |
| mRS_admission | 1 (0, 2) | 1 (0, 1) | - |
| NIHSS_admission | 2 (0, 4) | 1 (0, 3) | - |
| SBP (mmHg) | 138 (125, 155) | 139 (125, 157) | 0.473 |
| DBP (mmHg) | 83 (74, 91) | 83 (74, 94) | 0.015 |
| Drinking (Yes, n, %) | 218 (21) | 225 (22) | 0.748 |
| Smoking (Yes, n, %) | 104 (10) | 114 (11) | 0.519 |
| HTN (Yes, n, %) | 754 (73) | 750 (73) | 0.882 |
| DM (Yes, n, %) | 268 (26) | 271 (26) | 0.920 |
| AF (Yes, n, %) | 36 (3) | 50 (5) | 0.152 |
| CHD (Yes, n, %) | 77 (7) | 81 (8) | 0.804 |
| HLP (Yes, n, %) | 606 (59) | 640 (62) | 0.137 |
| BMI (Kg/m^2) | 25.73 (23.84, 27.41) | 25.78 (23.94, 27.41) | 0.847 |
| WBC (10^9/L) | 7.2 (5.9, 8.6) | 7.0 (5.7, 8.9) | 0.505 |
| NEU (10^9/L) | 4.93 (3.78, 6.57) | 4.79 (3.68, 6.42) | 0.271 |
| LYM (10^9/L) | 1.37 (1.02, 1.77) | 1.41 (1.04, 1.86) | 0.063 |
| MON (10^9/L) | 0.57 (0.41, 0.98) | 0.91 (0.48, 1.56) | < 0.001 |
| NLR | 3.55 (2.37, 5.70) | 3.23 (2.32, 5.11) | 0.026 |
| LMR | 2.22 (1.00, 3.46) | 1.00 (1.00, 2.78) | < 0.001 |
| SII | 661 (419, 1065) | 606 (393, 951) | 0.017 |
| SIRI | 2.57 (1.22, 4.70) | 3.59 (1.67, 5.40) | < 0.001 |
| PNR | 38.11 (26.55, 52.23) | 38.87 (27.31, 51.08) | 0.850 |
| PLR | 137.67 (101.25, 184.63) | 130.12 (95.39, 176.1) | 0.020 |
| MHR | 0.49 (0.33, 0.82) | 0.72 (0.39, 1.26) | < 0.001 |
| NHR | 4.05 (2.95, 5.62) | 3.92 (2.9, 5.44) | 0.424 |
| PHR | 150.28 (111.18, 197.71) | 147.90 (111.49, 197.13) | 0.662 |
| HRR | 9.59 (8.48, 10.68) | 9.85 (8.48, 10.92) | 0.020 |
| HALP | 37.31 (25.94, 53.17) | 41.98 (28.2, 56.79) | < 0.001 |
| RBC (10^12/L) | 4.24 (3.89, 4.68) | 4.37 (3.94, 4.80) | < 0.001 |
| HGB (g/L) | 129 (117, 141) | 133 (119, 145) | < 0.001 |
| HCT (%) | 39.0 (35.4, 42.6) | 39.9 (36.2, 43.9) | < 0.001 |
| MCV (fL) | 92.1 (88.8, 95.1) | 92.1 (89.1, 95.3) | 0.668 |
| MCHC (g/L) | 331 (324, 337) | 331 (324, 338) | 0.873 |
| MCH (pg) | 30.5 (29.3, 31.7) | 30.5 (29.4, 31.7) | 0.958 |
| RDW-CV (%) | 13.4 (12.9, 14.2) | 13.5 (13.0, 14.3) | 0.031 |
| PLT (10^9/L) | 188 (147, 229) | 186 (143, 229) | 0.673 |
| CRP (mg/L) | 4.06 (1.19, 9.98) | 3.22 (1.00, 14.24) | 0.379 |
| TC (mmol/L) | 4.39 (3.61, 5.20) | 4.48 (3.66, 5.34) | 0.138 |
| TG (mmol/L) | 1.43 (0.99, 2.08) | 1.64 (1.12, 2.38) | < 0.001 |
| LDL-C (mmol/L) | 2.63 (2.05, 3.25) | 2.73 (2.10, 3.36) | 0.090 |
| HDL-C (mmol/L) | 1.23 (1.02, 1.44) | 1.22 (1.04, 1.46) | 0.916 |
| Non-HDL-C (mmol/L) | 3.09 (2.44, 3.88) | 3.21 (2.46, 4.01) | 0.107 |
| AIP | 0.07 (-0.11, 0.26) | 0.12 (-0.06, 0.34) | < 0.001 |
| AC | 2.56 (1.96, 3.25) | 2.60 (1.99, 3.33) | 0.178 |
| LCI | 13.55 (7.46, 24.64) | 16.16 (8.03, 31.48) | < 0.001 |
| CRI-I | 3.56 (2.96, 4.25) | 3.60 (2.99, 4.33) | 0.178 |
| CRI-II | 2.14 (1.70, 2.74) | 2.21 (1.70, 2.75) | 0.158 |
| FBG (mmol/L) | 6.26 (5.22, 8.29) | 6.41 (5.31, 8.39) | 0.308 |
| TyG | 8.94 (8.51, 9.42) | 9.08 (8.63, 9.61) | < 0.001 |
| UREA (mmol/L) | 6.05 (4.90, 7.49) | 6.82 (5.41, 8.96) | < 0.001 |
| CREA (μmol/L) | 69.6 (58.9, 85.8) | 84.1 (69.3, 107.6) | < 0.001 |
| UA_admission (μmol/L) | 312 (250, 379) | 456 (424, 512) | < 0.001 |
| UA_3d (μmol/L) | 290 (220, 366) | 463 (412, 514) | < 0.001 |
| K (mmol/L) | 3.84 (3.60, 4.08) | 3.86 (3.58, 4.16) | 0.154 |
| Na (mmol/L) | 140.3 (138.5, 142.1) | 140.4 (138.7, 142.1) | 0.487 |
| Cl (mmol/L) | 104.7 (102.4, 106.9) | 104.4 (102.1, 106.6) | 0.067 |
| PTA (%) | 112 (98, 126) | 113 (99, 127) | 0.369 |
| TT (s) | 16.9 (15.8, 17.9) | 17.2 (16.1, 18.2) | < 0.001 |
| INR | 0.97 (0.93, 1.04) | 0.97 (0.92, 1.03) | 0.113 |
| APTT (s) | 28.0 (26.3, 30.0) | 28.2 (26.5, 30.2) | 0.090 |
| PT (s) | 11.1 (10.6, 11.8) | 11.1 (10.6, 11.7) | 0.651 |
| FIB (g/L) | 3.02 (2.54, 3.80) | 3.12 (2.54, 3.81) | 0.352 |
Basic characteristics of included participants stratified by comorbidity following PSM.
APT, antiplatelet therapy; SBP, systolic blood pressure; DBP, diastolic blood pressure; TOAST, Trial of Org 10172 in Acute Stroke Treatment; LAA, large-artery atherosclerosis; SAO, small artery occlusion; CE, Cardioembolism; SOE, stroke of other determined etiologies; SUE, stroke of undetermined etiologies; GCS, Glasgow Coma Scale; mRS, Modified Rankin Scale; NIHSS, National Institutes of Health Stroke Scale; HTN, hypertension; AF, atrial fibrillation; CHD, coronary heart disease; HLP, hyperlipidemia; DM, diabetes mellitus; BMI, body mass index; NLR, neutrophil-to-lymphocyte ratio; LMR, lymphocyte-to-monocyte ratio; SII, systemic inflammatory index; PLR, platelet-to-lymphocyte ratio; HALP, hemoglobin, albumin, lymphocyte, platelet score; RBC, red blood cell; HGB, hemoglobin; HCT, hematocrit; MCHC, mean corpuscular hemoglobin concentration; RDW-CV, red blood cell distribution width-coefficient of variation; TC, total cholesterol; TG, triglyceride; LDL-C, low-density lipoprotein cholesterol; HDL-C, high-density lipoprotein cholesterol; non-HDL-C, non-high-density lipoprotein cholesterol; AIP, atherogenic index of plasma; AC, atherogenic coefficient; LCI, lipoprotein combine index; CRI-I, Castelli’s index-I; CRI-II, Castelli’s index-II; FBG, fasting blood glucose; TyG, triglyceride-glucose index; K, potassium; Na, sodium; UA, uric acid; PTA, prothrombin activity; TT, thrombin time; INR, international normalized ratio; APTT, activated partial thromboplastin time; PT, prothrombin time; FIB, fibrinogen.
Table 3
| Variables | Non-comorbidity (N = 722) | Comorbidity (N = 722) | P |
|---|---|---|---|
| Age (years) | 71 (61, 78) | 70 (59, 78) | 0.207 |
| Gender (Male, n, %) | 440 (61) | 437 (61) | 0.914 |
| Marriage (Other status, n, %) | 76 (11) | 77 (11) | 1 |
| Nationality (Ethnic minority, n, %) | 16 (2.2) | 0 (0) | < 0.001 |
| APT, n (Yes, %) | 111 (15) | 140 (19) | 0.044 |
| Antihypertensive therapy, n (Yes, %) | 477 (66) | 462 (64) | 0.440 |
| Antidiabetic therapy, n (Yes, %) | 157 (22) | 161 (22) | 0.849 |
| Statins therapy, n (Yes, %) | 121 (17) | 142 (20) | 0.173 |
| Urate-lowering therapy, n (Yes, %) | 14 (2) | 13 (2) | 1 |
| Time of onset (h) | 48 (12, 168) | 48 (15, 168) | |
| TOAST, n (%) | - | ||
| LAA | 149 (21) | 216 (30) | |
| SAO | 222 (31) | 407 (56) | |
| CE | 32 (4) | 56 (8) | |
| SOE | 17 (2) | 30 (4) | |
| SUE | 14 (2) | 13 (2) | |
| GCS_admission | 15 (15, 15) | 15 (15, 15) | - |
| mRS_admission | 1 (0, 1.25) | 1 (0, 1) | - |
| NIHSS_admission | 2 (0, 4) | 1 (0, 3) | - |
| SBP (mmHg) | 139 (125, 155) | 138 (124, 156) | 0.501 |
| DBP (mmHg) | 83 (74, 91) | 83 (74, 93) | 0.355 |
| Drinking (Yes, n, %) | 151 (21) | 165 (23) | 0.408 |
| Smoking (Yes, n, %) | 73 (10) | 79 (11) | 0.668 |
| HTN (Yes, n, %) | 525 (73) | 515 (71) | 0.598 |
| DM (Yes, n, %) | 178 (25) | 190 (26) | 0.507 |
| AF (Yes, n, %) | 27 (4) | 36 (5) | 0.303 |
| CHD (Yes, n, %) | 49 (7) | 58 (8) | 0.422 |
| HLP (Yes, n, %) | 429 (59) | 439 (61) | 0.629 |
| BMI (Kg/m^2) | 25.63 (23.81, 27.39) | 25.8 (24.06, 27.53) | 0.280 |
| WBC (10^9/L) | 7.1 (5.8, 8.7) | 7.0 (5.7, 8.9) | 0.797 |
| NEU (10^9/L) | 4.90 (3.69, 6.71) | 4.75 (3.71, 6.40) | 0.394 |
| LYM (10^9/L) | 1.35 (0.98, 1.73) | 1.44 (1.04, 1.87) | 0.005 |
| MON (10^9/L) | 0.57 (0.40, 1.00) | 0.90 (0.47, 1.54) | < 0.001 |
| NLR | 3.56 (2.42, 5.84) | 3.20 (2.28, 5.04) | 0.009 |
| LMR | 2.18 (1.00, 3.35) | 1.00 (1.00, 2.81) | < 0.001 |
| SII | 684 (410, 1,095) | 599 (387, 932) | 0.014 |
| SIRI | 2.72 (1.24, 4.68) | 3.58 (1.65, 5.30) | < 0.001 |
| PNR | 37.61 (25.94, 52.48) | 38.89 (27.62, 51.04) | 0.804 |
| PLR | 138.66 (101.66, 186.68) | 128.98 (94.32, 173.3) | 0.007 |
| MHR | 0.49 (0.32, 0.82) | 0.72 (0.39, 1.21) | < 0.001 |
| NHR | 4.04 (2.91, 5.64) | 3.94 (2.88, 5.35) | 0.469 |
| PHR | 147.64 (110.11, 197.69) | 148.42 (109.72, 197.5) | 0.910 |
| HRR | 9.58 (8.52, 10.68) | 9.77 (8.43, 11.00) | 0.080 |
| HALP | 36.83 (25.55, 51.97) | 42.3 (28.65, 57.35) | < 0.001 |
| RBC (10^12/L) | 4.24 (3.88, 4.69) | 4.36 (3.91, 4.80) | 0.005 |
| HGB (g/L) | 129 (117, 142) | 132 (118, 145) | 0.005 |
| HCT (%) | 39.1 (35.4, 42.6) | 39.9 (36.2, 43.9) | 0.003 |
| MCV (fL) | 92.2 (88.7, 95.4) | 92.1 (88.8, 95.6) | 0.744 |
| MCHC (g/L) | 331 (324, 338) | 330 (324, 338) | 0.715 |
| MCH (pg) | 30.60 (29.30, 31.70) | 30.50 (29.30, 31.80) | 0.849 |
| RDW-CV (%) | 13.5 (12.9, 14.2) | 13.6 (12.9, 14.2) | 0.213 |
| PLT (10^9/L) | 186 (144, 226) | 187 (144, 232) | 0.697 |
| CRP (mg/L) | 4.12 (1.15, 9.94) | 2.86 (0.89, 14.24) | 0.102 |
| TC (mmol/L) | 4.43 (3.61, 5.20) | 4.48 (3.71, 5.33) | 0.257 |
| TG (mmol/L) | 1.42 (0.98, 2.07) | 1.61 (1.11, 2.38) | < 0.001 |
| LDL-C (mmol/L) | 2.65 (2.05, 3.28) | 2.72 (2.11, 3.37) | 0.390 |
| HDL-C (mmol/L) | 1.24 (1.01, 1.45) | 1.23 (1.05, 1.48) | 0.733 |
| Non-HDL-C (mmol/L) | 3.15 (2.46, 3.87) | 3.20 (2.51, 4.02) | 0.209 |
| AIP | 0.06 (-0.11, 0.25) | 0.11 (-0.07, 0.34) | < 0.001 |
| AC | 2.56 (1.94, 3.28) | 2.60 (1.99, 3.33) | 0.292 |
| LCI | 14.03 (7.39, 24.85) | 15.77 (7.69, 32.16) | 0.001 |
| CRI-I | 3.56 (2.94, 4.28) | 3.60 (2.99, 4.33) | 0.292 |
| CRI-II | 2.14 (1.69, 2.77) | 2.22 (1.69, 2.73) | 0.492 |
| FBG (mmol/L) | 6.34 (5.22, 8.38) | 6.32 (5.29, 8.26) | 0.896 |
| TyG | 8.94 (8.51, 9.42) | 9.04 (8.60, 9.56) | 0.003 |
| UREA (mmol/L) | 5.98 (4.92, 7.49) | 6.88 (5.45, 9.02) | < 0.001 |
| CREA (μmol/L) | 69.4 (58.4, 85.1) | 83.0 (69.1, 105.4) | < 0.001 |
| UA_admission (μmol/L) | 308 (248, 373) | 456 (423, 511) | < 0.001 |
| UA_3d (μmol/L) | 286 (219, 363) | 462 (411, 513) | < 0.001 |
| K (mmol/L) | 3.84 (3.61, 4.08) | 3.86 (3.58, 4.16) | 0.227 |
| Na (mmol/L) | 140.3 (138.4, 142.0) | 140.5 (138.8, 142.2) | 0.240 |
| Cl (mmol/L) | 104.7 (102.4, 107.0) | 104.4 (102.0, 106.7) | 0.120 |
| PTA (%) | 112 (98, 126) | 113 (99, 127) | 0.241 |
| TT (s) | 16.9 (15.7, 17.9) | 17.2 (16.2, 18.2) | < 0.001 |
| INR | 0.97 (0.93, 1.04) | 0.97 (0.92, 1.02) | 0.067 |
| APTT (s) | 28.0 (26.3, 29.9) | 28.3 (26.6, 30.2) | 0.097 |
| PT (s) | 11.1 (10.5, 11.9) | 11.1 (10.6, 11.8) | 0.825 |
| FIB (g/L) | 3.00 (2.51, 3.76) | 3.06 (2.52, 3.76) | 0.565 |
The characteristics of included participants classified by comorbidity in training dataset.
SBP, systolic blood pressure; DBP, diastolic blood pressure; TOAST, Trial of Org 10172 in Acute Stroke Treatment; LAA, large-artery atherosclerosis; SAO, small artery occlusion; CE, Cardioembolism; SOE, stroke of other determined etiologies; SUE, stroke of undetermined etiologies; GCS, Glasgow Coma Scale; mRS, Modified Rankin Scale; NIHSS, National Institutes of Health Stroke Scale; HTN, hypertension; AF, atrial fibrillation; CHD, coronary heart disease; HLP, hyperlipidemia; DM, diabetes mellitus; BMI, body mass index; NLR, neutrophil-to-lymphocyte ratio; LMR, lymphocyte-to-monocyte ratio; SII, systemic inflammatory index; PLR, platelet-to-lymphocyte ratio; HALP, hemoglobin, albumin, lymphocyte, platelet score; RBC, red blood cell; HGB, hemoglobin; HCT, hematocrit; MCHC, mean corpuscular hemoglobin concentration; RDW-CV, red blood cell distribution width-coefficient of variation; TC, total cholesterol; TG, triglyceride; LDL-C, low-density lipoprotein cholesterol; HDL-C, high-density lipoprotein cholesterol; non-HDL-C, non-high-density lipoprotein cholesterol; AIP, atherogenic index of plasma; AC, atherogenic coefficient; LCI, lipoprotein combine index; CRI-I, Castelli’s index-I; CRI-II, Castelli’s index-II; FBG, fasting blood glucose; TyG, triglyceride-glucose index; K, potassium; Na, sodium; UA, uric acid; PTA, prothrombin activity; TT, thrombin time; INR, international normalized ratio; APTT, activated partial thromboplastin time; PT, prothrombin time; FIB, fibrinogen; bold font indicates statistically significant differences.
Table 4
| Variables | Non-comorbidity (N = 57) | Comorbidity (N = 51) | P |
|---|---|---|---|
| Age (years) | 67 (58, 77) | 71 (63, 79) | 0.162 |
| Gender (Male, n, %) | 36 (63) | 31 (61) | 0.956 |
| Marriage (Other status, n, %) | 3 (5) | 4 (8) | 0.705 |
| Nationality (Ethnic minority, n, %) | 2 (4) | 0 (0) | 0.497 |
| APT, n (Yes, %) | 8 (14) | 11 (22) | 0.439 |
| Antihypertensive therapy, n (Yes, %) | 31 (54) | 37 (73) | 0.08 |
| Antidiabetic therapy, n (Yes, %) | 9 (16) | 9 (18) | 1 |
| Statins therapy, n (Yes, %) | 8 (14) | 11 (22) | 0.439 |
| Urate-lowering therapy, n (Yes, %) | 0 (0) | 1 (2) | 0.472 |
| Time of onset (h) | 48 (24, 168) | 48 (19.5, 204) | - |
| TOAST, n (%) | - | ||
| LAA | 10 (18) | 12 (24) | |
| SAO | 20 (35) | 31 (61) | |
| CE | 3 (5) | 4 (8) | |
| SOE | 2 (4) | 3 (6) | |
| SUE | 1 (2) | 1 (2) | |
| GCS_admission | 15 (15, 15) | 15 (15, 15) | - |
| mRS_admission | 1 (0,1) | 1 (0,2) | - |
| NIHSS_admission | 2 (0, 3) | 2 (0, 4) | - |
| SBP (mmHg) | 141 ± 25 | 141 ± 21 | 0.995 |
| DBP (mmHg) | 87 ± 16 | 84 ± 13 | 0.304 |
| Drinking (Yes, n, %) | 9 (16) | 13 (25) | 0.312 |
| Smoking (Yes, n, %) | 6 (11) | 7 (14) | 0.831 |
| HTN (Yes, n, %) | 43 (75) | 42 (82) | 0.522 |
| DM (Yes, n, %) | 15 (26) | 13 (25) | 1 |
| AF (Yes, n, %) | 2 (4) | 6 (12) | 0.145 |
| CHD (Yes, n, %) | 3 (5) | 6 (12) | 0.302 |
| HLP (Yes, n, %) | 27 (47) | 29 (57) | 0.428 |
| BMI (Kg/m^2) | 26.18 (24.11, 27.34) | 25.80 (23.75, 27.40) | 0.667 |
| WBC (10^9/L) | 6.7 (5.6, 8.5) | 6.7 (5.6, 8.4) | 0.735 |
| NEU (10^9/L) | 4.39 (3.41, 6.43) | 4.42 (3.29, 5.96) | 0.453 |
| LYM (10^9/L) | 1.46 ± 0.50 | 1.63 ± 0.60 | 0.111 |
| MON (10^9/L) | 0.65 (0.37, 0.82) | 1.01 (0.46, 1.71) | 0.009 |
| NLR | 3.70 (2.29, 4.83) | 2.92 (2.00, 3.98) | 0.11 |
| LMR | 1.96 (1.00, 3.81) | 1.00 (1.00, 2.88) | 0.057 |
| SII | 693 (444, 1048) | 558 (381, 749) | 0.167 |
| SIRI | 2.33 (1.06, 3.94) | 2.92 (1.33, 4.93) | 0.372 |
| PNR | 44.79 (28.18, 59.63) | 44.34 (35.01, 56.94) | 0.396 |
| PLR | 137.14 (104.33, 178.89) | 126.34 (99.68, 169.12) | 0.304 |
| MHR | 0.44 (0.28, 0.71) | 0.81 (0.44, 1.22) | 0.002 |
| NHR | 3.50 (2.61, 5.32) | 3.77 (2.66, 5.30) | 0.758 |
| PHR | 152.82 (107.33, 208.59) | 180.58 (125.79, 229.65) | 0.13 |
| HRR | 9.69 ± 1.97 | 9.95 ± 1.95 | 0.491 |
| HALP | 36.96 (25.31, 52.14) | 45.34 (27.60, 57.08) | 0.148 |
| RBC (10^12/L) | 4.31 (3.76, 4.77) | 4.43 (3.92, 4.88) | 0.489 |
| HGB (g/L) | 130 ± 21 | 132 ± 21 | 0.614 |
| HCT (%) | 39.14 ± 6.16 | 39.62 ± 6.23 | 0.69 |
| MCV (fL) | 91.9 ± 5.2 | 91.8 ± 4.4 | 0.939 |
| MCHC (g/L) | 331 ± 10 | 333 ± 13 | 0.519 |
| MCH (pg) | 30.5 ± 2.1 | 30.6 ± 1.7 | 0.772 |
| RDW-CV (%) | 13.3 (12.9, 13.9) | 13.2 (12.8, 14.1) | 0.5 |
| PLT (10^9/L) | 195 (161, 234) | 191 (168, 246) | 0.59 |
| CRP (mg/L) | 4.86 (1.67, 14.24) | 3.14 (0.94, 14.24) | 0.488 |
| TC (mmol/L) | 4.61 (3.89, 5.15) | 3.97 (3.04, 5.03) | 0.042 |
| TG (mmol/L) | 1.47 (0.93, 1.83) | 1.55 (1.02, 2.55) | 0.35 |
| LDL-C (mmol/L) | 2.81 ± 0.97 | 2.44 ± 0.89 | 0.041 |
| HDL-C (mmol/L) | 1.28 (1.12, 1.50) | 1.21 (0.98, 1.42) | 0.102 |
| Non-HDL-C (mmol/L) | 3.08 (2.66, 3.80) | 2.68 (2.05, 3.61) | 0.072 |
| AIP | 0.03 ± 0.27 | 0.14 ± 0.28 | 0.048 |
| AC | 2.50 (1.82, 3.08) | 2.32 (1.79, 3.07) | 0.629 |
| LCI | 12.24 (7.59, 22.75) | 11.65 (6.01, 21.04) | 0.582 |
| CRI-I | 3.50 (2.82, 4.08) | 3.32 (2.80, 4.07) | 0.629 |
| CRI-II | 2.17 ± 0.72 | 2.07 ± 0.69 | 0.439 |
| FBG (mmol/L) | 6.27 (5.46, 7.71) | 5.94 (5.11, 7.52) | 0.447 |
| TyG | 8.94 (8.56, 9.28) | 8.93 (8.48, 9.38) | 0.588 |
| UREA (mmol/L) | 6.26 (4.71, 7.19) | 6.60 (5.28, 8.37) | 0.045 |
| CREA (μmol/L) | 64.0 (54.8, 72.8) | 85.9 (71.3,100.0) | < 0.001 |
| UA_admission (μmol/L) | 311.3 ± 106.0 | 463.9 ± 66.7 | < 0.001 |
| UA_3d (μmol/L) | 264 (197, 361) | 478 (432, 523) | < 0.001 |
| K (mmol/L) | 3.86 ± 0.38 | 3.84 ± 0.44 | 0.787 |
| Na (mmol/L) | 140.8 (139.0, 142.0) | 140.7 (139.5, 142.5) | 0.653 |
| Cl (mmol/L) | 105.7 (104.2, 107.5) | 105.3 (102.6, 107.1) | 0.21 |
| PTA (%) | 111 ± 18 | 109 ± 22 | 0.577 |
| TT (s) | 17.0 ± 1.6 | 17.2 ± 1.4 | 0.507 |
| INR | 0.98 (0.93, 1.03) | 0.98 (0.94, 1.03) | 0.88 |
| APTT (s) | 28.7 (26.9, 30.8) | 28.6 (26.7, 30.7) | 1 |
| PT (s) | 11.1 (10.4, 12.0) | 11.1 (10.6, 11.8) | 0.56 |
| FIB (g/L) | 3.27 (2.70, 4.38) | 3.12 (2.63, 3.88) | 0.473 |
Baseline characteristics of independent validation dataset.
APT, antiplatelet therapy; SBP, systolic blood pressure; DBP, diastolic blood pressure; LAA, large-artery atherosclerosis; SAO, small artery occlusion; CE, Cardioembolism; SOE, stroke of other determined etiologies; SUE, stroke of undetermined etiologies; GCS, Glasgow Coma Scale; mRS, Modified Rankin Scale; NIHSS, National Institutes of Health Stroke Scale; HTN, hypertension; AF, atrial fibrillation; CHD, coronary heart disease; HLP, hyperlipidemia; DM, diabetes mellitus; BMI, body mass index; NLR, neutrophil-to-lymphocyte ratio; LMR, lymphocyte-to-monocyte ratio; SII, systemic inflammatory index; PLR, platelet-to-lymphocyte ratio; HALP, hemoglobin, albumin, lymphocyte, platelet score; RBC, red blood cell; HGB, hemoglobin; HCT, hematocrit; MCHC, mean corpuscular hemoglobin concentration; RDW-CV, red blood cell distribution width-coefficient of variation; TC, total cholesterol; TG, triglyceride; LDL-C, low-density lipoprotein cholesterol; HDL-C, high-density lipoprotein cholesterol; non-HDL-C, non-high-density lipoprotein cholesterol; AIP, atherogenic index of plasma; AC, atherogenic coefficient; LCI, lipoprotein combine index; CRI-I, Castelli’s index-I; CRI-II, Castelli’s index-II; FBG, fasting blood glucose; TyG, triglyceride-glucose index; K, potassium; Na, sodium; UA, uric acid; PTA, prothrombin activity; TT, thrombin time; INR, international normalized ratio; APTT, activated partial thromboplastin time; PT, prothrombin time; FIB, fibrinogen. Bold font indicates statistically significant differences.
Univariate and multivariate analyses for HUA-IS comorbidity
Ten metabolic indicators (lipid, glucose, and uric acid metabolism) were included, followed by univariate and multivariate analyses. Before PSM, UA_admission (OR: 1.02, 95% CI: 1.02-1.02, P < 0.001), UA_3d (OR: 1.01, 95% CI: 1.01-1.01, P < 0.001), TyG (OR: 1.32, 95% CI: 1.17-1.48, P < 0.001), TG (OR: 1.05, 95% CI: 1.01-1.09, P = 0.027), AIP (OR: 2.21, 95% CI: 1.59-3.07, P < 0.001), and LCI (OR: 1.00, 95% CI: 1.00-1.00, P = 0.022) showed significant associations with the comorbidity in multivariate models. After PSM, only five metabolic parameters, namely, UA_3d (OR: 1.02, 95% CI: 1.02-1.02, P < 0.001), TyG (OR: 1.40, 95% CI: 1.21-1.62, P < 0.001), TG (OR: 1.13, 95% CI: 1.05-1.22, P = 0.002), AIP (OR: 2.74, 95% CI: 1.80-4.19, P < 0.001), and LCI (OR: 1.01, 95% CI: 1.00-1.01, P = 0.001) were significantly associated with increased risk of HUA-IS comorbidity in fully adjusted models. All associations were statistically significant (P < 0.05), visually summarized in Figures 2A, B, Supplementary Table S7.
Figure 2

Forest plot displays the results of univariate and multivariate analyses assessing the associations between metabolic parameters and the risk of HUA-IS comorbidity (A) pre-PSM and (B) post-PSM. IS, ischemic stroke; HUA, hyperuricemia; OR, odd ratio; PSM, propensity score matching.
Association of lipid parameters with HUA-IS comorbidity
Subsequently, we performed quantile stratification on the aforementioned five statistically significant metabolic parameters following PSM (Supplementary Table S8). After PSM, the quartiles of UA_3d were not significantly associated with the comorbidity (all P-values > 0.05, in all models). Elevated risks of HUA-IS comorbidity were observed in the highest quartile (Q4) of the following indicators in fully adjusted multivariate models: TyG (OR: 1.92, 95% CI: 1.40-2.62, P < 0.001), TG (OR: 2.60, 95% CI: 1.90-3.56, P < 0.001), AIP (OR: 2.00, 95% CI: 1.42-2.81, P < 0.001), LCI(OR: 1.68, 95% CI: 1.25-2.27, P = 0.001). Furthermore, significant dose-response associations were confirmed for all above indicators, with a trend P-value < 0.05 across increasing quartiles (Figures 3A, B, Supplementary Table S9).
Figure 3

Assessment of the associations between metabolic parameter quartiles and the risk of HUA-IS comorbidity using fully adjusted multivariate models (A) pre-PSM and (B) post-PSM. IS, ischemic stroke; HUA, hyperuricemia; PSM, propensity score matching.
RCS analysis
Although significant linear associations were observed for four indicators before (Figure 4) and after PSM (Figure 5), only TG and LCI demonstrated significant nonlinear relationships (nonlinear P < 0.05). Specifically, for TG, the risk of comorbidity showed a pronounced increase with increasing TG levels below the threshold of 3.69 mmol/L (pre-PSM) and 3.81 mmol/L (post-PSM). Above these cutoffs (TG > 3.69 and 3.81 mmol/L), the risk continued to decrease (Figure 4B, Figure 5B). To verify whether the inverted U-shaped effect was due to the small TG sample, we identified subsets with TG ≥ 3.69 (pre-PSM) and ≥ 3.81 (post-PSM) mmol/L, which included 360 patients (8%) and 160 patients (8%), respectively. Excluding these patients, repeated RCS analyses showed the nonlinear relationship was no longer significant (nonlinear P-values: 0.544 and 0.246, Supplementary Figures S3A, B). Thus, the U-shaped effect may reflect the sparse high-TG sample rather than a true biological effect. Besides, regarding the LCI, its inflection points were 18.79 (before PSM) and 19.17 (following PSM), respectively. When LCI values were below these thresholds, the risk of comorbidity increased in a statistically significant manner with the elevation of LCI; once LCI exceeded these inflection points, the rate of risk elevation began to decelerate, reflecting a nonlinear dose-response relationship between LCI and comorbidity risk (Figures 4D, 5D).
Figure 4

RCS reveals the non-linear associations between metabolic parameters (A) TyG, (B) TG, (C) AIP, and (D) LCI and the risk of comorbidity before PSM. RCS, restricted cubic spline; PSM, propensity score matching.
Figure 5
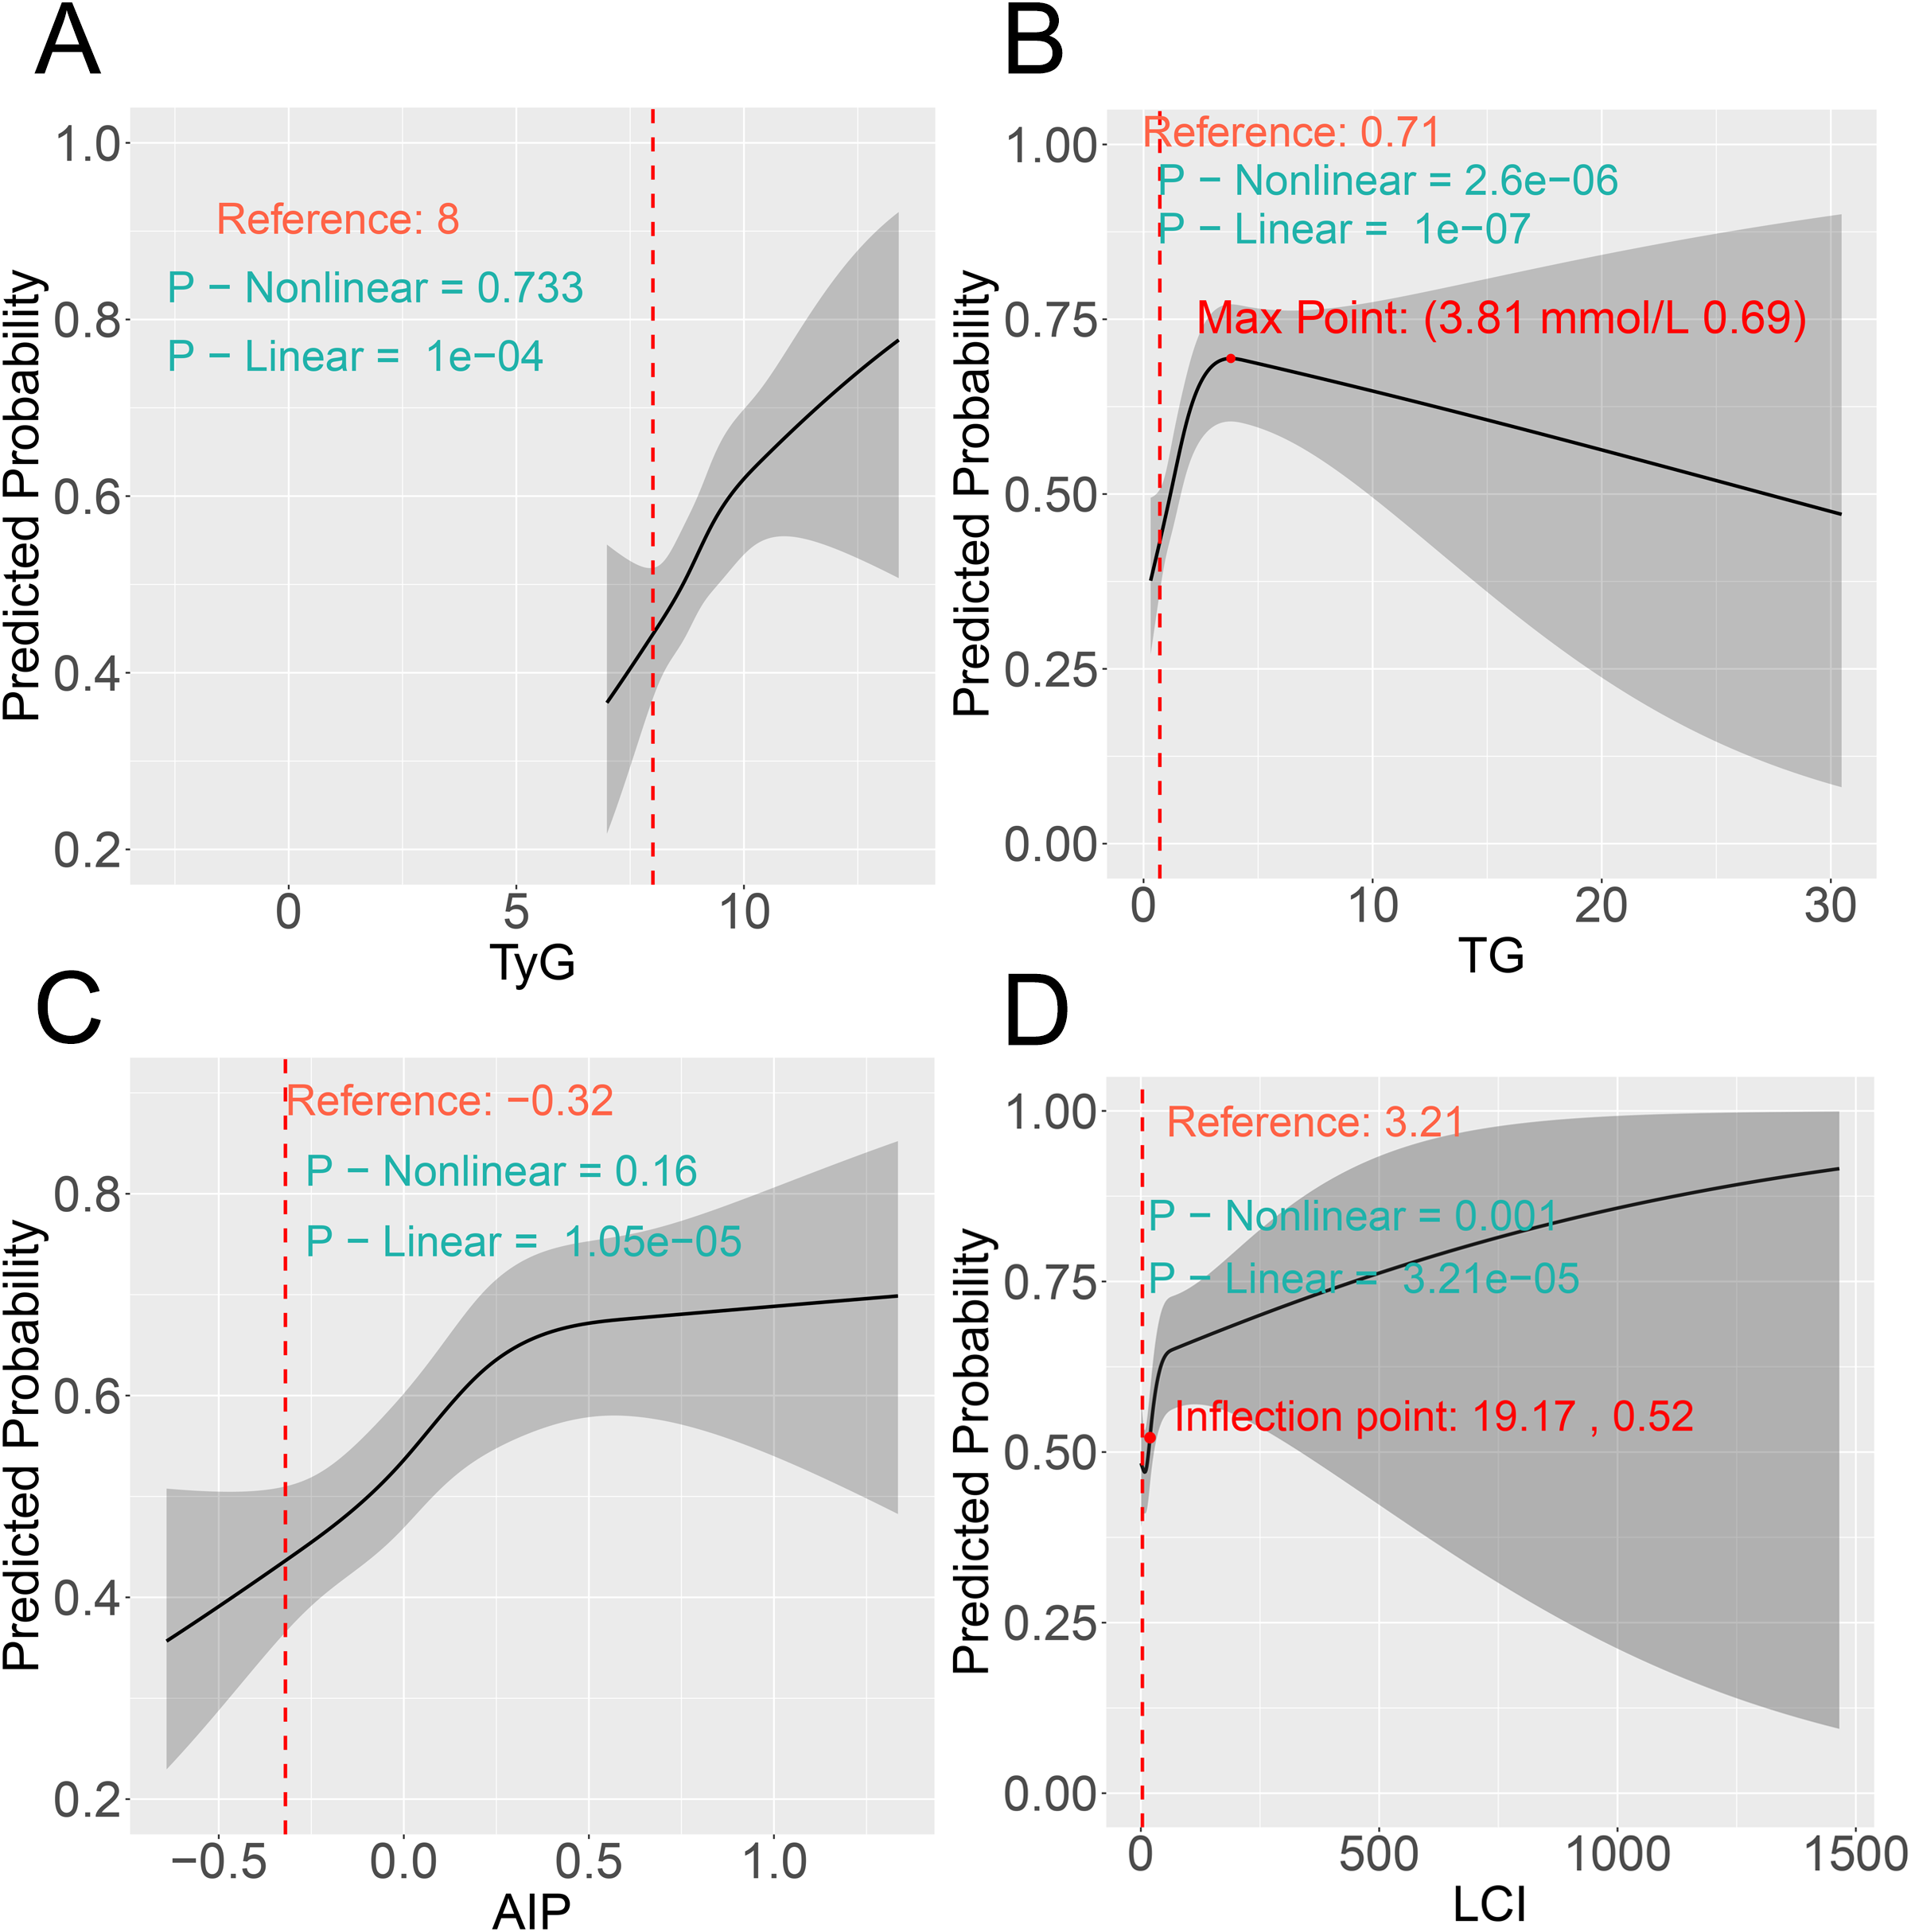
RCS reveals the non-linear associations between metabolic parameters (A) TyG, (B) TG, (C) AIP, and (D) LCI and the risk of comorbidity after PSM. RCS, restricted cubic spline; PSM, propensity score matching.
Clinlabomics models of comorbidity
A total of 23 differentially expressed variables from the training set were subjected to LASSO regression analysis, which identified 11 feature variables for subsequent model development (Figures 6A-C). However, considering the associations of age, gender, TyG, and TG with the comorbidity, we incorporated these variables into subsequent model construction. Eleven algorithms were used to develop Clinlabomics models based on the training set, with the optimal Clinlabomics model (established by the rpart algorithm) identified (F1-score: 0.960; sensitivity: 0.965; specificity: 0.954; AUC: 0.986, 95% CI: 0.981-0.992) (Figure 6D). Subsequently, in the training set, hyperparameter tuning was conducted on the optimal model, with the complete tuning procedure depicted in Figure 6E. The optimal hyperparameter for the rpart algorithm was identified as cp=0.0017. In the training set, ROC curves were generated and AUC values were calculated for the untuned and tuned models, demonstrating a slightly higher AUC in the tuned model (0.987, 95% CI: 0.982-0.993) compared to the untuned model (0.986, 95% CI: 0.981-0.992) (Figure 6F). Ultimately, the optimally tuned Clinlabomics model was selected, with ROC curves generated across the training set, testing set (AUC: 0.955, 95% CI: 0.939-0.972), and validation set (AUC: 0.957, 95% CI: 0.915-0.999) (Figure 7A). Calibration curves demonstrated that, for the training, testing, and validation sets, the slopes of the relationship between estimated and observed probabilities approximated to 1 (with corresponding intercepts near 0), indicating robust calibration performance across these datasets and high concordance between estimated and actual event probabilities (Figure 7B). In addition, the Brier score was low for the training (0.034), testing (0.084), and validation (0.068) sets, indicating the model’s accurate assessment with minimal bias across these datasets. Furthermore, for the three datasets, their DCA curves exhibited significantly higher standardized net benefit than the “none” (no risk stratification) strategy across a wide high-risk threshold range, indicating the model’s robust clinical decision-making net benefit across these datasets (Figure 7C). Subsequently, feature importance ranking (Figure 7D) and SHAP-based interpretation (Figure 7E) were performed for the optimal model, revealing the UA_admission, UA_3d, TG, LCI, AIP, TyG as the influential metabolic factors. Randomized SHAP visualization of a subject mitigated the model’s black-box limitation by elucidating impactful variables, aiding individualized diagnosis and treatment (Figure 7F). Subsequently, the validation set was used as a new dataset. Without group labels, it was assessed by the model, classifying 57 as comorbidity and 51 as non-comorbidity (Figure 7G). Probabilities < 40%, 40–70%, and >70% were defined as low-risk, intermediate-risk, and high-risk, respectively. Comparison with original labels showed that 50 (87.7%, probability < 40%) non-comorbidity and 50 (98.0%, probability > 70%) comorbidity patients were accurately identified (Figure 7H), indicating favorable discriminative ability of our optimal Clinlabomics model. To identify comorbid populations from healthy controls, we excluded hyperuricemia-negative IS patients from the non-comorbid group and analyzed the data via the aforementioned methods. The rpart algorithm remained optimal (Supplementary Figure 4A), with an optimal cp of 0.00015 after tuning (Supplementary Figure 4B), though the adjusted model’s AUC did not differ from the unadjusted model’s AUC (Supplementary Figure 4 C). The optimal Clinlabomics model exhibited AUCs of 0.974 (95%CI: 0.968–0.980), 0.916 (95%CI: 0.896–0.937), and 0.976 (95%CI: 0.949–1.00) across three datasets, with corresponding Brier scores of 0.051, 0.093, and 0.087 (Supplementary Figure 5A). Calibration and DCA curves (Supplementary Figures 5B, C) confirmed its strong performance in distinguishing comorbid patients from healthy controls. Feature importance ranking and SHAP plots highlighted UA, UA_3d, LCI, AIP, TyG, and TG as key predictors (Supplementary Figures 5D-F). In the validation set (72 unlabeled subjects), the model identified 45 comorbid patients and 27 healthy controls (Supplementary Figure 5G), with correct classification rates of 95.2% (20/21) for healthy controls and 78.4% (40/51) for comorbid patients (Supplementary Figure 5H). Meanwhile, we also attempted to build models for the IS population, but failed due to overfitting of ML algorithms, so no IS-specific comorbidity model was established.
Figure 6

Feature selection, Clinlabomics model development, and optimal Clinlabomics model. (A) Regularization parameter selection for LASSO regression. The X-axis represents log(λ), where λ refers to the regularization parameter of LASSO. The Y-axis represents Binomial Deviance, a metric for assessing model fitting performance, smaller values indicate better concordance between the model and the data. The numbers above the plot represent the count of feature variables retained by the model at the corresponding log(λ) values. (B) Variable coefficient trajectories derived from LASSO regression, which illustrates the dynamic changes in the regression coefficients of each feature as the regularization intensity varies. The X-axis represents L1 Norm, corresponding to the intensity of the LASSO regularization term; a larger L1 norm indicates stronger regularization constraints, leading to greater shrinkage of feature coefficients. The Y-axis represents Coefficients, representing the coefficient values of individual features in the model. (C) Variables with positive, zero, and negative coefficients identified via LASSO analysis are labeled with orange, yellow, and blue, respectively, with specific variables displayed on the right. The gray line (s=0.0055) indicates a critical value of the penalty parameter λ, marking the threshold for optimal variable selection. (D) ROC curves of Clinlabomics models developed by 11 different ML algorithms. (E) Visualization of the hyperparameter tuning process and determination of optimal hyperparameters for the Clinlabomics model constructed using the optimal rpart algorithm. (F) ROC curves of the optimal rpart algorithm with and without hyperparameter tuning. LASSO, Least Absolute Shrinkage and Selection Operator; ROC, receiver operating characteristic; ML, machine learning.
Figure 7

Optimal Clinlabomics model, its interpretation, and discriminative ability. (A) ROC curves and corresponding AUC values, (B) Calibration curves, and (C) DCA curves of the Clinlabomics model (built with optimal hyperparameters) across three datasets. (D) Feature importance ranking of the included variables. (E) SHAP interpretation of the included variables, which illustrates the magnitude, direction, and association between feature values and their contributions to the model. The y-axis lists features ranked by their impact; the x-axis (SHAP value) reflects the direction and strength of a feature’s contribution to the model’s estimate (positive SHAP values increase comorbidity risk, while negative values decrease it); colors denote the feature’s own value level (orange = high feature value, purple = low feature value), and each dot represents the contribution of the feature in a single sample. (F) SHAP waterfall plot illustrates the step-by-step contribution of each feature to the model’s estimate for a single sample. Each feature’s block (yellow = positive contribution, purple = negative contribution) corresponds to its SHAP value, representing how much the feature shifts the estimate away from the average level. Ultimately, the total positive contributions outweigh the negative ones, resulting in the sample’s estimated probability (0.999) being substantially higher than the model’s mean estimate. (G) Probability distribution of the validation set (labels removed) via the optimal model. (H) The probability distribution of the optimal model accurately identifies non-comorbidity (probability < 40%) and comorbidity (probability > 70%) groups in the independent validation dataset. UA, represents UA_admission.
Discussion
This study identified critical metabolic indicators (UA_3d, TyG, TG, AIP, and LCI), associated with HUA-IS comorbidity. It further constructed Clinlabomics models employing 11 advanced machine learning algorithms and ascertained the optimal model. Furthermore, through feature importance analysis and SHAP interpretation, we addressed the inherent “black-box” constraints of machine learning-driven modeling. Leveraging these integrated analyses, we identified metabolic parameters strongly linked to HUA-IS comorbidity, specifically TyG, TG, AIP, and LCI.
Hyperuricemia (HUA), a prevalent metabolic abnormality, is of significant value in patients with IS. Şengüldür et al. revealed that HUA increases the risk of IS by 2.4-fold (OR: 2.402, 95% CI: 1.792–3.221) (43). Besides, HUA is also linked to delayed neurological recovery, elevated risk of recurrent stroke, and increased mortality (44), making it a clinically important issue in cerebrovascular diseases (CVD). In terms of mortality prediction, SUA level serves as an independent predictor of in-hospital death in IS patients (hazard ratio [HR]:1.02, 95% CI: 1.00 - 1.03) (45). The risk is markedly heightened when HUA coincides with a high-inflammatory state, resulting in a 4.09-fold increase in mortality and a 98% higher risk of major disability among AIS patients (46). Furthermore, elevated SUA was independently associated with spontaneous hemorrhagic transformation in male IS patients (47). Notably, Mendelian randomization analysis also confirmed that higher SUA levels are positively associated with an increased risk of IS and worse clinical outcomes (48). Interestingly, anti-hyperuricemia treatment offers a potential avenue for improving prognosis. In patients with HTN and HUA, such treatment correlates with a reduced incidence of composite CVD (OR: 0.93, 95% CI: 0.88 - 0.99) (49). Therefore, these findings underscore the critical role of HUA in stroke progression and highlight the potential benefits of urate-lowering therapy in high-risk populations.
Furthermore, the TyG index, derived from FBG and TG, acts as a well-validated surrogate marker for insulin resistance (IR). IR, regarded as one of the core underlying mechanisms of HUA, exacerbates SUA accumulation by impairing renal UA excretion (50). For instance, observational studies have confirmed this positive correlation (23, 51), and findings from the China Health and Retirement Longitudinal Study (CHARLS) further corroborate that an elevated baseline TyG index is significantly linked to a higher incidence risk of HUA (52). Beyond its association with HUA, the TyG index also exhibits a robust relationship with IS risk. Data from the Kailuan Prospective Cohort Study showed that a higher TyG index was associated with a significantly elevated incidence of IS (HR: 1.35, 95% CI: 1.31–1.40) (53). Notably, a meta-analysis of cerebrovascular disease studies further strengthened this link, reporting that a higher TyG index correlated with an increased risk of IS (OR: 1.37, 95% CI: 1.22–1.54) (16). Given its dual associations with HUA and IS, the TyG index may serve as a crucial risk factor for HUA-IS comorbidity, offering a simple and accessible marker to identify individuals at heightened risk of concurrent HUA and IS.
More importantly, HUA also exerts a synergistic effect with dyslipidemia and other metabolic disturbances to drive vascular pathological remodeling, ultimately worsening prognosis in patients with IS. A community-based cross-sectional study conducted among middle-aged and elderly Chinese individuals indicated that non-HDL-C and other conventional lipid profiles, especially TG, are significantly correlated with HUA, suggesting a shared metabolic pathway between lipid dysregulation and SUA elevation (54). Similarly, data from the Korea National Health and Nutrition Examination Survey (KNHANES, 2016–2017) reinforced the association between dyslipidemia, including TG, one of its abnormal components, and elevated SUA levels in adults, further supporting the intrinsic link between lipid parameters and urate homeostasis (55). For instance, a cross-sectional study indicated a positive correlation between AIP and the prevalence of HUA among middle-aged and elderly Chinese individuals, supporting its utility as a discriminative marker (56). Consistent with these findings, Huang et al. validated the estimated value of AIP for HUA using National Health and Nutrition Examination Survey (NHANES) data, reporting a fully adjusted OR of 3.04 (95% CI: 1.93–4.79) (57). Beyond its role in HUA, dyslipidemia is a well-established modifiable risk factor for CVD, including stroke (58). We previously applied an unsupervised clustering algorithm to identify a distinct phenotype of AIS, in which both traditional (TC, TG, HDL-C, and LDL-C) and non-traditional (e.g., AIP, LCI, non-HDL-C, AC, CRI-I, and CRI-II) lipid parameters were significantly elevated (17). Of note, Jia et al. reported that after multivariable adjustment, TG were significantly linked to an increased risk of IS (HR: 1.12 (Q4 vs. Q1), 95%CI: 1.03–1.23; P-trend = 0.0095) (59). In recent years, non-traditional lipid profiles primarily serve as independent predictors for CVD (60, 61). Based on a meta-analysis, Liu et al. reported that elevated non-traditional lipid levels are significantly associated with an increased risk of IS (62). Furthermore, non-traditional lipid parameters may predict carotid plaque vulnerability in AIS patients (63). Evidence shows that elevated AIP significantly increases the risk of IS, as demonstrated in long-term retrospective cohorts (64, 65). Furthermore, higher AIP levels are correlated with an increased risk of the large artery atherosclerosis (LAA) subtype (66) and serve as an independent predictor of poor functional outcomes in AIS patients (OR = 1.84, 95% CI: 1.23 - 2.53) (67). In addition, a hospital-based observational study in China indicates that AC and LCI serve as significant predictors of both intracranial and extracranial atherosclerotic stenosis in IS patients (38).
Notably, we used the “Icare” package to build Clinlabomics models using 11 ML algorithms, based on clinical and laboratory indicators, enabling in-depth mining of hidden data insights. Feature importance ranking and SHAP interpretation addressed the traditional “black-box” issue of models established by ML algorithms. Additionally, individual patient SHAP interpretation facilitates personalized and precision medicine. We revealed that the Clinlabomics model developed by the rpart algorithm exhibited the optimal performance. Similarly, Liu et al. demonstrated that the model developed using the rpart algorithm exhibited high accuracy (0.911), sensitivity (0.851), and specificity (0.821) in diagnosing obstructive coronary artery disease (CAD) (68). Furthermore, Shah et al. employed a classification tree model based on the rpart algorithm to identify ocular baseline factors predictive of treatment frequency in patients with neovascular age-related macular degeneration (nAMD) (69). These findings collectively demonstrate that the model developed by the rpart algorithm exhibits favorable discriminative performance. Nevertheless, large-scale and prospective multicenter studies are required to validate the generalizability and robustness of this optimal Clinlabomics model.
Notably, admission UA levels, which reflect acute-phase status, are prone to interference from stress, failing to reflect chronic baseline metabolic status, whereas comorbidity risk hinges on long-term metabolic abnormalities. For one thing, insufficient statistical power for admission UA levels arose from incomplete adjustment for potential confounders (e.g. dietary data, genetic susceptibility, etc.). For another, acute-phase UA may merely serve as a marker of IS, reflecting oxidative stress-induced damage (70), rather than a direct pathogenic factor for comorbidities, resulting in no significant association between acute-phase UA and comorbidity. Regarding UA on the third day of hospitalization, its quartile grouping may have failed to capture UA’s threshold effect. However, this negative finding does not negate UA’s potential link to HUA-IS comorbidity but highlights the limited clinical value of acute-phase levels. Future studies should focus on chronic baseline UA (pre-admission measurements) and dynamic UA changes (admission-to-discharge rate of change), alongside more precise confounder adjustment, more sensitive statistical models, multicenter designs with an expanded sample size, and optimized strategies to capture UA’s threshold effect (e.g., refined quartile stratification), to clarify the true association between chronic UA level and comorbidity.
For the RCS curve of TG and HUA-IS comorbidity risk, an inverted U-shaped association was observed. However, after excluding the small sample of patients with TG levels above the threshold, the nonlinear association was no longer statistically significant. These findings suggest that the observed inverted U-shaped relationship is primarily attributable to sparse sampling of the high-TG population rather than a true biological effect. Future studies should expand the sample size in prospective studies within the high-TG interval (particularly focusing on the hyperlipidemia population) to more reliably validate the validity of this potential association.
However, this study has several limitations. First, despite rigorous adjustment for known confounders, residual confounding may persist due to unmeasured cardiovascular or metabolic risk factors, both of which may influence outcomes through complex biological pathways. Second, as a single-center retrospective study, inherent constraints of this design should be acknowledged: specifically, the selection of controls (stroke-like symptoms but negative imaging findings) may affect the association between metabolic parameters and comorbidities, and while assay standardization was maintained within our center, subtle variability in detection techniques cannot be completely ruled out. Additionally, this retrospective design only captures cross-sectional associations at a specific time point, failing to establish a causal relationship or clarify the temporal sequence between variables. Third, the single-center design limits the generalizability of our findings. Specifically, in multi-center settings, differences across institutions in case mix (e.g., baseline patient characteristics) and standardization of assays may hinder external validity. Last but not least, future studies should address these limitations by adopting large-scale, multi-center prospective cohorts, optimizing control group selection, particularly including asymptomatic healthy controls, to mitigate selection bias, standardizing assay methods across centers, and supplementing key covariates (including comprehensive dietary assessments and UA metabolism-related gene polymorphisms). Such investigations will better elucidate the associations between metabolic parameters and HUA-IS comorbidities, further validate the efficacy of these parameters for risk assessment, and thereby generate more robust clinical evidence to guide clinical practice.
In real-world clinical practice, the Clinlabomics model constructed based on metabolic and routine clinical indicators, enables rapid screening for HUA-IS comorbidity in suspected patients during early hospitalization, effectively addressing the issue of missed diagnoses in primary hospitals. Second, individualized intervention can be achieved through risk stratification: high-risk patients are prioritized to receive targeted therapy, while low-risk patients undergo routine follow-up, thereby enhancing the efficiency of clinical management. Finally, these metabolic indicators can serve as markers for monitoring treatment efficacy, thereby establishing a closed-loop management framework of “screening-intervention-monitoring.
Conclusion
In conclusion, this study identified TyG, TG, AIP, and LCI as metabolic parameters significantly associated with HUA-IS comorbidity, developed an optimal Clinlabomics model based on the rpart algorithm for risk assessment, and revealed their critical role in comorbidity. This provided new insights for comorbidity research regarding metabolic biomarkers. However, further validation through large-scale, multi-center prospective cohorts is essential to confirm the generalizability and their clinical utility for risk assessment and treatment guidance for HUA-IS comorbidity.
Statements
Data availability statement
The original contributions presented in the study are included in the article/Supplementary Material. Further inquiries can be directed to the corresponding author.
Ethics statement
The studies involving humans were approved by the Ethics Committee of the Suining Central Hospital. The studies were conducted in accordance with the local legislation and institutional requirements. The participants provided their written informed consent to participate in this study.
Author contributions
YJ: Conceptualization, Data curation, Formal analysis, Investigation, Software, Writing – original draft, Methodology. QL: Conceptualization, Data curation, Writing – original draft, Writing – review & editing, Methodology. DH: Formal analysis, Methodology, Visualization, Writing – review & editing. HL: Software, Validation, Writing – review & editing. SC: Conceptualization, Data curation, Investigation, Writing – review & editing. HX: Data curation, Investigation, Methodology, Writing – review & editing. QW: Methodology, Software, Visualization, Writing – review & editing. MZ: Conceptualization, Supervision, Funding acquisition, Writing – review & editing. JH: Conceptualization, Data curation, Investigation, Project administration, Supervision, Visualization, Writing – review & editing.
Funding
The author(s) declared that financial support was received for this work and/or its publication. This study was supported by Sichuan Science and Technology Program (2021YFS0358).
Acknowledgments
We sincerely acknowledge Professor Huaichao Luo and his team from Sichuan Cancer Hospital for developing the “Icare” package, which assisted us in efficiently establishing Clinlabomics models of HUA-IS comorbidity, identifying the optimal model, conducting visualization, and effectively addressing the black-box problem of Clinlabomics models. We extend our sincere gratitude again to Professor Huaichao Luo and his team!
Conflict of interest
The author(s) declared that this work was conducted in the absence of any commercial or financial relationships that could be construed as a potential conflict of interest.
Generative AI statement
The author(s) declared that generative AI was not used in the creation of this manuscript.
Any alternative text (alt text) provided alongside figures in this article has been generated by Frontiers with the support of artificial intelligence and reasonable efforts have been made to ensure accuracy, including review by the authors wherever possible. If you identify any issues, please contact us.
Publisher’s note
All claims expressed in this article are solely those of the authors and do not necessarily represent those of their affiliated organizations, or those of the publisher, the editors and the reviewers. Any product that may be evaluated in this article, or claim that may be made by its manufacturer, is not guaranteed or endorsed by the publisher.
Supplementary material
The Supplementary Material for this article can be found online at: https://www.frontiersin.org/articles/10.3389/fendo.2025.1737419/full#supplementary-material
References
1
Collaborators GF . Burden of disease scenarios for 204 countries and territories, 2022-2050: A forecasting analysis for the global burden of disease study 2021. Lancet. (2024) 403:2204–56. doi: 10.1016/s0140-6736(24)00685-8
2
Collaborators GBDS . Global, regional, and national burden of stroke and its risk factors, 1990-2019: A systematic analysis for the global burden of disease study 2019. Lancet Neurol. (2021) 20:795–820. doi: 10.1016/S1474-4422(21)00252-0
3
Feigin VL Brainin M Norrving B Martins S Sacco RL Hacke W et al . World stroke organization (Wso): global stroke fact sheet 2022. Int J Stroke. (2022) 17:18–29. doi: 10.1177/17474930211065917
4
Maruhashi T Hisatome I Kihara Y Higashi Y . Hyperuricemia and endothelial function: from molecular background to clinical perspectives. Atherosclerosis. (2018) 278:226–31. doi: 10.1016/j.atherosclerosis.2018.10.007
5
Kimura Y Tsukui D Kono H . Uric acid in inflammation and the pathogenesis of atherosclerosis. Int J Mol Sci. (2021) 22:12394. doi: 10.3390/ijms222212394
6
Shen S He F Cheng C Xu B Sheng J . Uric acid aggravates myocardial ischemia-reperfusion injury via ros/nlrp3 pyroptosis pathway. BioMed Pharmacother. (2021) 133:110990. doi: 10.1016/j.biopha.2020.110990
7
Zhu HY Zhao SZ Zhang ML Wang Y Pan ZM Cheng HR et al . Elevated serum uric acid increases the risk of ischemic stroke recurrence and its inflammatory mechanism in older adults. Front Aging Neurosci. (2022) 14:822350. doi: 10.3389/fnagi.2022.822350
8
Li M Wang H Gao Y . Serum uric acid levels and recurrence rate of ischemic stroke: A meta-analysis. Horm Metab Res. (2023) 55:493–7. doi: 10.1055/a-2091-1951
9
Mapoure YN Ayeah CM Ba H Hentchoya R Luma HN . The prognostic value of serum uric acid in the acute phase of ischemic stroke in black africans. J Stroke Cerebrovasc Dis. (2018) 27:783–92. doi: 10.1016/j.jstrokecerebrovasdis.2017.10.006
10
Wang P Li X He C Zhai Y Sun H Zhang Y et al . Hyperuricemia and prognosis of acute ischemic stroke in diabetic patients. Neurol Res. (2019) 41:250–6. doi: 10.1080/01616412.2018.1553347
11
Ament Z Bevers MB Wolcott Z Kimberly WT Acharjee A . Uric acid and gluconic acid as predictors of hyperglycemia and cytotoxic injury after stroke. Transl Stroke Res. (2021) 12:293–302. doi: 10.1007/s12975-020-00862-5
12
Hong Y Feng M . Severity and prognosis of vascular dementia in patients with acute cerebral infarction combined with H-type hypertension and its correlation with uric acid levels. Neuropsychiatr Dis Treat. (2025) 21:1261–70. doi: 10.2147/ndt.S508965
13
Zhang P Wang R Guo ZN Jin H Qu Y Zhen Q et al . Baseline uric acid levels and intravenous thrombolysis outcomes in patients with acute ischemic stroke: A prospective cohort study. J Am Heart Assoc. (2024) 13:e033407. doi: 10.1161/jaha.123.033407
14
Guo Z Wu S Zheng M Xia P Li Q He Q et al . Association of impaired fasting glucose with cardiometabolic multimorbidity: the kailuan study. J Diabetes Investig. (2025) 16:129–36. doi: 10.1111/jdi.14316
15
Yang Y Huang X Wang Y Leng L Xu J Feng L et al . The impact of triglyceride-glucose index on ischemic stroke: A systematic review and meta-analysis. Cardiovasc Diabetol. (2023) 22:2. doi: 10.1186/s12933-022-01732-0
16
Nayak SS Kuriyakose D Polisetty LD Patil AA Ameen D Bonu R et al . Diagnostic and prognostic value of triglyceride glucose index: A comprehensive evaluation of meta-analysis. Cardiovasc Diabetol. (2024) 23:310. doi: 10.1186/s12933-024-02392-y
17
Jiang Y Dang Y Wu Q Yuan B Gao L You C . Using a K-means clustering to identify novel phenotypes of acute ischemic stroke and development of its clinlabomics models. Front Neurol. (2024) 15:1366307. doi: 10.3389/fneur.2024.1366307
18
Quiñones Galvan A Natali A Baldi S Frascerra S Sanna G Ciociaro D et al . Effect of insulin on uric acid excretion in humans. Am J Physiol. (1995) 268:E1–5. doi: 10.1152/ajpendo.1995.268.1.E1
19
Gu Q Hu X Meng J Ge J Wang SJ Liu XZ . Associations of triglyceride-glucose index and its derivatives with hyperuricemia risk: A cohort study in chinese general population. Int J Endocrinol. (2020) 2020:3214716. doi: 10.1155/2020/3214716
20
Wan X Xu C Lin Y Lu C Li D Sang J et al . Uric acid regulates hepatic steatosis and insulin resistance through the nlrp3 inflammasome-dependent mechanism. J Hepatol. (2016) 64:925–32. doi: 10.1016/j.jhep.2015.11.022
21
Lai H Tu Y Liao C Zhang S He L Li J . Joint assessment of abdominal obesity and non-traditional lipid parameters for primary prevention of cardiometabolic multimorbidity: insights from the China health and retirement longitudinal study 2011-2018. Cardiovasc Diabetol. (2025) 24:109. doi: 10.1186/s12933-025-02667-y
22
Wen X Leng P Wang J Yang G Zu R Jia X et al . Clinlabomics: leveraging clinical laboratory data by data mining strategies. BMC Bioinf. (2022) 23:387. doi: 10.1186/s12859-022-04926-1
23
Gou R Dou D Tian M Chang X Zhao Y Meng X et al . Association between triglyceride glucose index and hyperuricemia: A new evidence from China and the United States. Front Endocrinol (Lausanne). (2024) 15:1403858. doi: 10.3389/fendo.2024.1403858
24
Huang X Jiang X Wang L Chen L Wu Y Gao P et al . Visceral adipose accumulation increased the risk of hyperuricemia among middle-aged and elderly adults: A population-based study. J Transl Med. (2019) 17:341. doi: 10.1186/s12967-019-2074-1
25
Huo RR Zhai L Liao Q You XM . Changes in the triglyceride glucose-body mass index estimate the risk of stroke in middle-aged and older chinese adults: A nationwide prospective cohort study. Cardiovasc Diabetol. (2023) 22:254. doi: 10.1186/s12933-023-01983-5
26
Wang RH Wen WX Jiang ZP Du ZP Ma ZH Lu AL et al . The clinical value of neutrophil-to-lymphocyte ratio (Nlr), systemic immune-inflammation index (Sii), platelet-to-lymphocyte ratio (Plr) and systemic inflammation response index (Siri) for predicting the occurrence and severity of pneumonia in patients with intracerebral hemorrhage. Front Immunol. (2023) 14:1115031. doi: 10.3389/fimmu.2023.1115031
27
Jin Z Wu Q Chen S Gao J Li X Zhang X et al . The associations of two novel inflammation indexes, sii and siri with the risks for cardiovascular diseases and all-cause mortality: A ten-year follow-up study in 85,154 individuals. J Inflammation Res. (2021) 14:131–40. doi: 10.2147/jir.S283835
28
Cao W Song Y Bai X Yang B Li L Wang X et al . Systemic-inflammatory indices and clinical outcomes in patients with anterior circulation acute ischemic stroke undergoing successful endovascular thrombectomy. Heliyon. (2024) 10:e31122. doi: 10.1016/j.heliyon.2024.e31122
29
Xu Q Wu Q Chen L Li H Tian X Xia X et al . Monocyte to high-density lipoprotein ratio predicts clinical outcomes after acute ischemic stroke or transient ischemic attack. CNS Neurosci Ther. (2023) 29:1953–64. doi: 10.1111/cns.14152
30
Zhang A Zhu Y Liao J Wu D Yan X Chen J et al . The association of systemic inflammatory response index and neutrophil-to-high-density lipoprotein ratio mediated by fasting blood glucose with 90-day prognosis in acute ischemic stroke patients. Neuroepidemiology. (2025) 59:31–42. doi: 10.1159/000539132
31
Chen J Wang B Liu C Li C Meng T Wang J et al . Association between platelet to high-density lipoprotein cholesterol ratio (Phr) and hypertension: evidence from nhanes 2005-2018. Lipids Health Dis. (2024) 23:346. doi: 10.1186/s12944-024-02342-3
32
Qin Z Liao N Lu X Duan X Zhou Q Ge L . Relationship between the hemoglobin-to-red cell distribution width ratio and all-cause mortality in ischemic stroke patients with atrial fibrillation: an analysis from the mimic-iv database. Neuropsychiatr Dis Treat. (2022) 18:341–54. doi: 10.2147/ndt.S350588
33
Zuo L Dong Y Liao X Hu Y Pan Y Yan H et al . Low halp (Hemoglobin, albumin, lymphocyte, and platelet) score increases the risk of post-stroke cognitive impairment: A multicenter cohort study. Clin Interv Aging. (2024) 19:81–92. doi: 10.2147/cia.S432885
34
Huo RR Liao Q Zhai L You XM Zuo YL . Interacting and joint effects of triglyceride-glucose index (Tyg) and body mass index on stroke risk and the mediating role of tyg in middle-aged and older chinese adults: A nationwide prospective cohort study. Cardiovasc Diabetol. (2024) 23:30. doi: 10.1186/s12933-024-02122-4
35
Qu L Fang S Lan Z Xu S Jiang J Pan Y et al . Association between atherogenic index of plasma and new-onset stroke in individuals with different glucose metabolism status: insights from charls. Cardiovasc Diabetol. (2024) 23:215. doi: 10.1186/s12933-024-02314-y
36
Guo J Wang A Wang Y Liu X Zhang X Wu S et al . Non-traditional lipid parameters as potential predictors of asymptomatic intracranial arterial stenosis. Front Neurol. (2021) 12:679415. doi: 10.3389/fneur.2021.679415
37
Si Y Liu J Han C Wang R Liu T Sun L . The correlation of retinol-binding protein-4 and lipoprotein combine index with the prevalence and diagnosis of acute coronary syndrome. Heart Vessels. (2020) 35:1494–501. doi: 10.1007/s00380-020-01627-8
38
Yu S Yan L Yan J Sun X Fan M Liu H et al . The predictive value of nontraditional lipid parameters for intracranial and extracranial atherosclerotic stenosis: A hospital-based observational study in China. Lipids Health Dis. (2023) 22:16. doi: 10.1186/s12944-022-01761-4
39
Jiang Y Meng L Liu Z Wu Q Dang Y You C . Associations between folate intake, serum folate, and stroke risk: the mediating role of dietary inflammatory index from nhanes 2007-2018. J Stroke Cerebrovasc Dis. (2025) 34:108318. doi: 10.1016/j.jstrokecerebrovasdis.2025.108318
40
Dong W Jiang H Li Y Lv L Gong Y Li B et al . Interpretable machine learning analysis of immunoinflammatory biomarkers for predicting chd among nafld patients. Cardiovasc Diabetol. (2025) 24:263. doi: 10.1186/s12933-025-02818-1
41
Mao Y Weng J Xie Q Wu L Xuan Y Zhang J et al . Association between dietary inflammatory index and stroke in the us population: evidence from nhanes 1999-2018. BMC Public Health. (2024) 24:50. doi: 10.1186/s12889-023-17556-w
42
Nielsen RL Monfeuga T Kitchen RR Egerod L Leal LG Schreyer ATH et al . Data-driven identification of predictive risk biomarkers for subgroups of osteoarthritis using interpretable machine learning. Nat Commun. (2024) 15:2817. doi: 10.1038/s41467-024-46663-4
43
Şengüldür E Demir MC . Evaluation of the association of serum uric acid levels and stroke in emergency department patients. Duzce Med J (Düzce Tıp Dergisi). (2024) 26:112–7. doi: 10.18678/dtfd.1457023
44
Chaudhary NS Bridges SL Jr. Saag KG Rahn EJ Curtis JR Gaffo A et al . Severity of hypertension mediates the association of hyperuricemia with stroke in the regards case cohort study. Hypertension. (2020) 75:246–56. doi: 10.1161/hypertensionaha.119.13580
45
Yamanie N Felistia Y Susanto NH Lamuri A Sjaaf AC Miftahussurur M et al . Prognostic model of in-hospital ischemic stroke mortality based on an electronic health record cohort in Indonesia. PloS One. (2024) 19:e0305100. doi: 10.1371/journal.pone.0305100
46
Wang C Zhou M Kang T You S Cao Y Kong W et al . The prognostic value of combined uric acid and neutrophil-to-lymphocyte ratio in acute ischemic stroke patients treated with intravenous thrombolysis. BMC Neurol. (2024) 24:183. doi: 10.1186/s12883-024-03628-w
47
Tang Y Liu MS Fu C Li GQ . Sex-dependent association analysis between serum uric acid and spontaneous hemorrhagic transformation in patients with ischemic stroke. Front Neurol. (2023) 14:1103270. doi: 10.3389/fneur.2023.1103270
48
Chen S Chen Z Xu Q Jiang X Lin C Ji J . Dual effects of serum urate on stroke risk and prognosis: insights from mendelian randomization. Front Neurol. (2024) 15:1359292. doi: 10.3389/fneur.2024.1359292
49
Zeng F Huang R Lu Y Wu Z Wang L . Association of anti-hyperuricemia treatment and prevalent cardiovascular disease in hypertensive patients. Arch Med Sci. (2020) 16:545–50. doi: 10.5114/aoms.2019.84397
50
Perez-Ruiz F Aniel-Quiroga MA Herrero-Beites AM Chinchilla SP Erauskin GG Merriman T . Renal clearance of uric acid is linked to insulin resistance and lower excretion of sodium in gout patients. Rheumatol Int. (2015) 35:1519–24. doi: 10.1007/s00296-015-3242-0
51
He H Cheng Q Chen S Li Q Zhang J Shan G et al . Triglyceride-glucose index and its additive interaction with abcg2/slc2a9 polygenic risk score on hyperuricemia in middle age and older adults: findings from the dlcc and bhmc study. Ann Med. (2024) 56:2434186. doi: 10.1080/07853890.2024.2434186
52
Han Y Zhou Z Zhang Y Zhao G Xu B . The association of surrogates of insulin resistance with hyperuricemia among middle-aged and older individuals: A population-based nationwide cohort study. Nutrients. (2023) 15:3139. doi: 10.3390/nu15143139
53
Xia X Chen S Tian X Xu Q Zhang Y Zhang X et al . Association of triglyceride-glucose index and its related parameters with atherosclerotic cardiovascular disease: evidence from a 15-year follow-up of kailuan cohort. Cardiovasc Diabetol. (2024) 23:208. doi: 10.1186/s12933-024-02290-3
54
Xu J Peng H Ma Q Zhou X Xu W Huang L et al . Associations of non-high density lipoprotein cholesterol and traditional blood lipid profiles with hyperuricemia among middle-aged and elderly chinese people: A community-based cross-sectional study. Lipids Health Dis. (2014) 13:117. doi: 10.1186/1476-511x-13-117
55
Son M Seo J Yang S . Association between dyslipidemia and serum uric acid levels in korean adults: korea national health and nutrition examination survey 2016-2017. PloS One. (2020) 15:e0228684. doi: 10.1371/journal.pone.0228684
56
Xu F Ma C Wang S Li Q Zhang Z He M . Higher atherogenic index of plasma is associated with hyperuricemia: A national longitudinal study. Int J Endocrinol. (2024) 2024:4002839. doi: 10.1155/2024/4002839
57
Huang J Chen C Jie C Li R Chen C . L-shaped relationship between atherogenic index of plasma with uric acid levels and hyperuricemia risk. Front Endocrinol (Lausanne). (2024) 15:1461599. doi: 10.3389/fendo.2024.1461599
58
Kloska A Malinowska M Gabig-Cimińska M Jakóbkiewicz-Banecka J . Lipids and lipid mediators associated with the risk and pathology of ischemic stroke. Int J Mol Sci. (2020) 21:3618. doi: 10.3390/ijms21103618
59
Jia YP Wang JM Lyu JQ Yang HH Miao MY Wang X et al . Triglyceride-rich lipoproteins cholesterol, 10-years atherosclerotic cardiovascular disease risk, and risk of myocardial infarction and ischemic stroke. J Lipid Res. (2024) 65:100653. doi: 10.1016/j.jlr.2024.100653
60
Arsenault BJ Rana JS Stroes ES Després JP Shah PK Kastelein JJ et al . Beyond low-density lipoprotein cholesterol: respective contributions of non-high-density lipoprotein cholesterol levels, triglycerides, and the total cholesterol/high-density lipoprotein cholesterol ratio to coronary heart disease risk in apparently healthy men and women. J Am Coll Cardiol. (2009) 55:35–41. doi: 10.1016/j.jacc.2009.07.057
61
Ridker PM Rifai N Cook NR Bradwin G Buring JE . Non-hdl cholesterol, apolipoproteins a-I and B100, standard lipid measures, lipid ratios, and crp as risk factors for cardiovascular disease in women. Jama. (2005) 294:326–33. doi: 10.1001/jama.294.3.326
62
Liu Y Jin X Fu K Li J Xue W Tian L et al . Non-traditional lipid profiles and the risk of stroke: A systematic review and meta-analysis. Nutr Metab Cardiovasc Dis. (2023) 33:698–714. doi: 10.1016/j.numecd.2023.01.003
63
Zhao Z Wang H Hou Q Zhou Y Zhang Y . Non-traditional lipid parameters as potential predictors of carotid plaque vulnerability and stenosis in patients with acute ischemic stroke. Neurol Sci. (2023) 44:835–43. doi: 10.1007/s10072-022-06472-3
64
Zheng H Wu K Wu W Chen G Chen Z Cai Z et al . Relationship between the cumulative exposure to atherogenic index of plasma and ischemic stroke: A retrospective cohort study. Cardiovasc Diabetol. (2023) 22:313. doi: 10.1186/s12933-023-02044-7
65
Zhang Y Chen S Tian X Xu Q Xia X Zhang X et al . Elevated atherogenic index of plasma associated with stroke risk in general chinese. Endocrine. (2024) 84:934–42. doi: 10.1007/s12020-023-03677-0
66
Zhong W Zhu N Shen X Ge Z Liu X Zhang G et al . Association between the atherogenic index of plasma and risk of large-artery atherosclerotic ischemic stroke. Front Neurol. (2025) 16:1529628. doi: 10.3389/fneur.2025.1529628
67
Liu H Liu K Pei L Li S Zhao J Zhang K et al . Atherogenic index of plasma predicts outcomes in acute ischemic stroke. Front Neurol. (2021) 12:741754. doi: 10.3389/fneur.2021.741754
68
Liu B Yu W Zhang F Shi Y Yang L Jiang Q et al . Detecting obstructive coronary artery disease with machine learning: rest-only gated single photon emission computed tomography myocardial perfusion imaging combined with coronary artery calcium score and cardiovascular risk factors. Quant Imaging Med Surg. (2023) 13:1524–36. doi: 10.21037/qims-22-758
69
Shah P Rafijah N Tang Y Sivaprasad S Mathis T Margaron P et al . Baseline characteristics associated with the first year treatment interval of intravitreal faricimab in neovascular age-related macular degeneration (Namd). BMJ Open Ophthalmol. (2024) 9: e001855. doi: 10.1136/bmjophth-2024-001855
70
Tan Y Lin X Xie L . The role of oxidative stress in the association between metabolic score for insulin resistance and stroke: evidence from two large population-based studies. Exp Gerontol. (2025) 205:112761. doi: 10.1016/j.exger.2025.112761
Summary
Keywords
Clinlabomics models, comorbidity, hyperuricemia, ischemic stroke, metabolic parameters, Shapley additive explanations
Citation
Jiang Y, Li Q, Hu D, Liao H, Chen S, Xu H, Wu Q, Zhao M and He J (2026) Identifying metabolic parameters as key indicators of hyperuricemia and ischemic stroke comorbidity via interpretable Clinlabomics models. Front. Endocrinol. 16:1737419. doi: 10.3389/fendo.2025.1737419
Received
01 November 2025
Revised
16 December 2025
Accepted
17 December 2025
Published
13 January 2026
Volume
16 - 2025
Edited by
Pradeep Kumar Dabla, G B Pant Institute of Postgraduate Medical Education and Research (GIPMER), Delhi, India
Reviewed by
Erdinç Şengüldür, Duzce Universitesi Tip Fakultesi, Türkiye
Dharmsheel Shrivastav, Noida International University, India
Updates
Copyright
© 2026 Jiang, Li, Hu, Liao, Chen, Xu, Wu, Zhao and He.
This is an open-access article distributed under the terms of the Creative Commons Attribution License (CC BY). The use, distribution or reproduction in other forums is permitted, provided the original author(s) and the copyright owner(s) are credited and that the original publication in this journal is cited, in accordance with accepted academic practice. No use, distribution or reproduction is permitted which does not comply with these terms.
*Correspondence: Jimin He, 960918743@qq.com
†These authors have contributed equally to this work
Disclaimer
All claims expressed in this article are solely those of the authors and do not necessarily represent those of their affiliated organizations, or those of the publisher, the editors and the reviewers. Any product that may be evaluated in this article or claim that may be made by its manufacturer is not guaranteed or endorsed by the publisher.