 Ava Orr1,2*
 Rebekah L. Kendall1
 Zeina Jaffar1
 Jon Graham2,3
 Christopher T. Migliaccio1Jonathon Knudson2Curtis Noonan2Erin L. Landguth2
- 1Center for Environmental Health Sciences, Biomedical & Pharmaceutical Sciences, University of Montana, Missoula, MT, United States
- 2Center for Population Health Research, School of Public and Community Health Sciences, University of Montana, Missoula, MT, United States
- 3Mathematical Sciences, University of Montana, Missoula, MT, United States
Introduction: This systematic review and meta-analysis investigate the relationship between PM2.5 exposure and increased influenza risk (e.g., increased hospital admissions, confirmed influenza cases), synthesizing previous findings related to pollutant effects and exposure durations.
Methods: We searched PubMed, Web of Science, and Scopus for relevant studies up to 1 January 2010, following Preferred Reporting Items for Systematic reviews and Meta-Analysis (PRISMA) guidelines for selection and analysis.
Results: Our review included 16 studies and found that a 10 μg/m3 increase in daily PM2.5 levels was associated with an increase of 1.5% rise in influenza risk (95% CI: 0.08%, 2.2%), with significant variations across different temperatures and lag times post-exposure. The analysis revealed heightened risks, with the most significant increases observed under extreme temperature conditions. Specifically, colder conditions were associated with a 14.2% increase in risk (RR = 14.2%, 95% CI: 3.5%, 24.9%), while warmer conditions showed the highest increase, with a 29.4% rise in risk (RR = 29.4%, 95% CI: 7.8%, 50.9%). Additionally, adults aged 18–64 were notably affected (RR = 4%, 95% CI: 2.9%, 5.1%).
Discussion: These results highlight PM2.5's potential to impair immune responses, increasing flu susceptibility. Despite clear evidence of PM2.5's impact on flu risk, gaps remain concerning exposure timing and climate effects. Future research should broaden to diverse regions and populations to deepen understanding and inform public health strategies.
Introduction
Influenza, an acute viral respiratory infection, has long posed a substantial global health challenge with approximately 1 billion individuals falling victim to the disease and an annual death toll ranging from 290,000 to 650,000 worldwide (1). The persistent threat of influenza is not only confined to its annual toll but also extends to the potential of a catastrophic pandemic. Drawing parallels to the 1918 Spanish flu, which resulted in a devastating death toll of between 20 and 50 million individuals, the WHO has warned that the emergence of a similar pandemic is not a question of “if” but “when” (2). Historical and contemporary studies indicate that the ever-evolving nature of influenza viruses, coupled with increased interactions between humans and animals, significantly raise the risk of a new pandemic strain emerging. These historical along with recent pandemics serve as stark reminders of the potential impacts and that advanced surveillance and preparation strategies are essential for mitigation (3).
Seasonal flu affects all individuals in every county, but specific populations are at higher risk, including children, the elderly, pregnant women, and individuals with chronic medical conditions, as well as groups with greater risk factors for health inequities (4). Recent research has expanded the understanding of external factors influencing influenza dynamics. Climate change and environmental variables, such as colder temperatures, drier climates, and air pollutants, particularly PM2.5, have been identified as critical determinants in influenza transmission (5–8).
Accumulating epidemiological evidence indicates an association between elevated PM2.5 levels and increased respiratory health risks, including heightened susceptibility to influenza infection. Previous studies have consistently reported a positive relationship bewtween PM2.5 exposure and influenza incidence, although results vary bygeographical region, population demographics, and exposure timing (9, 10). Despite these individual findings, a notable gap remains, as no systematic review or meta-analysis has yet comprehensively summarized existing evidence to clarify the strength, timing, and consistency of the PM2.5 influenza association across different settings and populations. Addressing this gap is essential to provide robust evidence for public health strategies aimed at mitigating influenza risks associated with air pollution.
This study offered novelty by systematically synthesizing existing epidemiological evidence on the relationship between PM2.5 exposure and influenza, particularly within the context of environmental changes driven by climate change and rising air pollution levels. By conducting a systematic review and meta-analysis, this research identified critical patterns, highlighted differences across populations, and clarified the timing of PM2.5 exposure impacts. These insights are essential for public health interventions, guiding policy decisions, and supporting proactive measures against the combined threats posed by influenza, air pollution, and climate change. Future research must adopt a balanced approach, integrating associative studies—examining epidemiological relationships—and mechanistic studies that explore underlying biological pathways. Clarifying both how and why PM2.5 affects influenza susceptibility will enable public health strategies to be tailored specifically to diverse global contexts, accounting for regional variations in air pollution sources, population vulnerabilities, and environmental changes.
Methods
Search strategy
The systematic review and meta-analysis were performed in accordance with the Preferred Reporting Items for Systematic Reviews and Meta-Analyses (PRISMA) guidelines and checklist in the Supplementary File (11) and complies with the recommendations of Meta-analysis of Observational Studies in Epidemiology (12).
This review focused specifically on PM2.5 due to its well-documented impact on respiratory health and its widespread monitoring, which ensured consistency across studies for a precise meta-analysis. Including other particulate sizes (e.g., PM10) would have added variability, as they differ in measurement and health impacts. We excluded influenza-like illness (ILI) studies to avoid conflating outcomes with non-influenza cases, focusing only on confirmed influenza results. Three electronic databases (PubMed, Scopus, and Web of Science) were systematically searched to find relevant studies in English between the time frame from January 1, 2010 to September 30, 2023, a time frame chosen to avoid overlap with previous reviews. Flow diagram for study selections are detailed in Figure 1. Briefly, a combination of keywords and search terms that included, but were not limited to, the following: “Influenza PM2.5”, “Influenza Air Pollution”, “Particulate Matter Influenza”, “Short Lag Influenza PM2.5”, and “Long Lag Influenza PM2.5.” Additionally, studies that provided mechanistic insights into the connection between PM2.5 and influenza were included. The results were then restricted to studies of humans. In addition, the reference lists of all included articles and pertinent reviews were also screened manually to identify more studies.
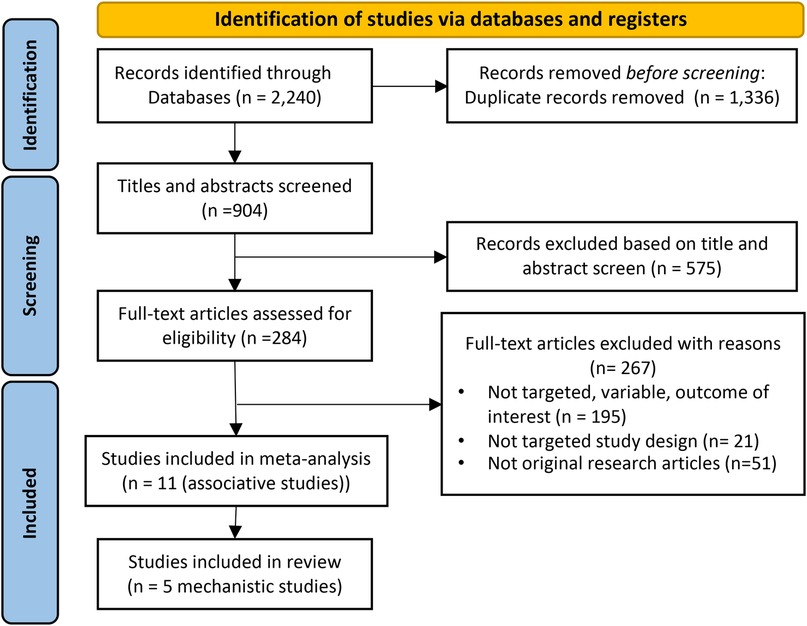
Figure 1. PRISMA flow diagram of study selection. Initially, 2,240 records were identified. Post-duplicate removal, 904 records were screened, leading to 575 being excluded after title and abstract review. Further assessment of 284 full-text articles resulted in 267 exclusions due to various reasons, leaving 16 studies (11 associative and 5 mechanistic) included in the final review.
Inclusion and exclusion criteria
The studies included had to meet the following inclusion criteria grouped according to the population-exposure-comparator-outcome (PECO) framework (13, 14). Potential sources of bias in this systematic review include publication bias (studies with positive findings are more likely to be published), heterogeneity in study design and exposure assessment methods, and variations in the measurement of influenza incidence across different studies.
• Population—population-based studies with no restriction on sex, age, or region
• Exposures—studies of short-term (0–7 days) or long-term (+7 days) exposures to any PM2.5
• Comparators—studies with clearly defined non-exposed or lower-exposure comparison groups
• Outcomes—studies assessing the incidence of influenza, measured by infection rates.
• Studies published in a peer-reviewed journal with full text available.
Studies with the following descriptions were excluded:
• Population—nonhuman studies (e.g., animal studies)
• Exposures—studies focused not on the health effects caused by PM2.5
• Outcomes—studies without an assessment of human health outcome
Study selection
All studies included in the final review or synthesis were identified in several stages, beginning with automation tools, including a Python web scraping script using package “Biopython”, were employed initially to pull all relevant articles based on keywords, duplicates were then (15). Then, (A.O. and R.L.K.) independently reviewed the titles and abstracts of the remaining studies to remove obviously irrelevant articles. Finally, the remaining studies were screened for full texts for eligibility. Any uncertainty and disagreement were solved by discussion between the two reviewers.
Data extraction
For each eligible study, the following information was extracted: first authors and publication year, study period, setting, design and population, sample size, exposure assessment method, exposure window, outcome, statistical method, and effect estimates (i.e., the effect estimates of influenza risk related to PM2.5 exposures). We collected data from sub studies within each eligible paper. Each study ran multiple models, often exploring different exposure windows, population subgroups, or analytical methods. Two authors (A.O. and R.L.K.) independently performed the procedure, and any conflict was discussed between the two reviewers.
Study quality assessment
We assessed study quality using the Newcastle-Ottawa Scale (NOS) for non-randomized studies in meta-analyses (16). Discrepancies were resolved through discussions to ensure a rigorous evaluation. The NOS tool, applied manually, considered factors such as study group selection, comparability, and outcome assessment. This dual-reviewer approach aimed to provide a comprehensive and robust assessment of bias risk, contributing to the overall quality of the systematic review. No automation tools were used in the risk of bias assessment. The NOS uses the star system with a maximum nine stars and evaluates three domains with a total of eight items: the selection of the study groups, the comparability of the groups, and the ascertainment of the outcome of interest. The quality of observational studies was categorized based on the total stars received: seven to nine stars denoted high quality, five to six stars indicated moderate quality, and four or fewer stars were indicative of low quality (Supplementary Table S2).
Statistical analysis
All studies included substudies, which allowed us to subgroup the results into different categories such as lags, age groups, and other relevant stratifications. Data for these subgroups were extracted from the results sections of each paper. The extraction process varied between studies, with necessary conversions performed as described below.
To uniformly measure the effects of PM2.5 exposures on influenza risk, effect estimates of relative risks (RR) (or similar measure) and their corresponding 95% confidence intervals (CI) were gathered from each study. It is noted that the availability of RRs across all studies was not uniform, as certain studies presented data in terms of excess rates or percent changes. To address this difference, percent change was converted to RR using the formula RR = 1 + Percent Change/100 and excess rate was converted by RR = Excess Rate + 1, ensuring a standardized and comparable metric for analysis.
Random- or fixed-effects meta-analysis was conducted on the extracted RR for each study to quantify the combined effects of PM2.5 exposure on influenza risk using R software (Version 4.3.2; R Development Core Team) “metafor” and “meta” packages (17, 18). To address the degree of heterogeneity within the included articles, we used the Q statistic-based χ2 test and I2 statistic by the Cochrane guideline (19). Low, moderate, and high hetergeneity were considered when I2 was less than 30%, between 30% to 75%, and exceeding 75%, respectively. A random-effects meta-analysis model was used. Publication bias was examined for the effect of PM2.5 exposure through a combination of funnel plots and the Egger's test.
To identify the source of heterogeneity, we also conducted a subgroup analysis based on sample size, patient ages, seasonality, and different lag exposure periods, allowing for the dissection of various sources within the collected data. Based on the included articles, we divided sample size into 6 groups: NA, <1 k, 1 k–10 k, 11 k–25 k, 30 k–90 k, 100 k; Age into 3 groups: <18, 18–64, >64, with a final group including “all” ages; Season (based on temperature) into 2 groups: Hot (24.2 °C–32.9 °C) and Cold (−4.5 °C–10.1 °C); Lagged exposures into 5 groups: “0–1”, “2–3”, “4–7”, “0–14”, “8–31”.
In the synthesis of mechanistic outcomes, quantitative analyses were not conducted due to variations in methods across the studies. Instead, a narrative overview was carried out, characterizing the mechanisms involved in immune responses triggered by PM2.5 leading to increased risk for infection of influenza.
Results
The initial search yielded 2,240 records of which 1,336 were removed due to duplication. The remaining 859 were screened with 575 being further removed based on a review of the title and abstract. A total of 284 citations were fully screened. Consequently, a total of 16 studies were included in this systematic review and meta-analysis: 11 studies for the meta-analysis with another 5 that focused on the mechanistic underpinnings of the association between PM2.5 exposure and influenza (see Figure 1 and Supplementary Figure S2).
Characteristics of the studies
The selected studies included different study designs and statistical methods: one case-crossover analysis (20), three studies employed distributed lag nonlinear models within their respective design (21–23), two studies utilized generalized additive models (24, 25), two applied random forest models (26, 27), two used regression models (28, 29), and one time series model (30). Each study had its own sub studies, often dividing the analysis by factors such as age, gender, temperature, and other demographic or environmental variables to assess subgroup-specific impacts. This allowed for detailed stratifications and comparisons, shedding light on how different population segments—children, the elderly, or those living in higher-temperature zones, for example—respond to similar exposure levels. Geographic diversity among the studies was notable, with nine based in China and one each from Thailand and the USA, collectively encompassing 3,510,530 influenza cases. Additionally, five mechanistic studies were included in a narrative overview to provide a broader understanding of underlying biological pathways. More specific details on each study and their subgroup analyses are outlined in Table 1.
Table 1. Studies included in the meta-analysis investigating for the relationship between PM2.5 and Influenza.
Results of the 11 association studies
The overall weighted averaged pooled RR (Figure 2) along with the meta-analysis RR revealed that for each 10 μg/m3 increase in PM2.5, the risk of influenza increased by 11.6% and 1.5%, respectively (averaged RR = 11.6 95% CI: 2.5%, 23.7%; weighted meta-analysis RR = 1.5 95% CI: 0.8%, 2.2%). The observed difference between the overall weighted average pooled RR (11.6%) and the meta-analysis RR (1.5%) arises from differences in calculation methods. Specifically, the weighted average pooled RR was derived by directly averaging reported RRs from individual studies, weighted by study size or precision, while the meta-analysis RR was calculated using a more robust statistical approach, accounting explicitly for between-study heterogeneity and precision (e.g., random-effects meta-analysis). Consequently, the meta-analysis RR provides a more conservative and statistically rigorous estimate of the association. It is important to note that the heterogeneity of results was extremely high among the studies (Table 2). The I2 statistic indicated that approximately 91.90% of the variability in effect estimates can be attributed to heterogeneity rather than random chance, and the estimated amount of total heterogeneity τ² was calculated to be 0.0014. This high heterogeneity implies that the observed association between influenza and PM2.5 might vary widely across different factors not explicitly accounted for in the analysis. Variations in study design, such as the geographical location, population demographics, and seasonality, as well as differences in analytical methods—like adjustments for confounders and the specific models used to estimate risk—can all influence the observed effect sizes. For instance, studies using different definitions of influenza cases or various lag periods between PM2.5 exposure and influenza outcomes may yield varying risk estimates. Subgroup analyses highlighted that factors such as season, age groups, and gender had notable impacts on heterogeneity (p < 0.05), which underscores that these design and analytical choices affect the robustness and comparability of results.
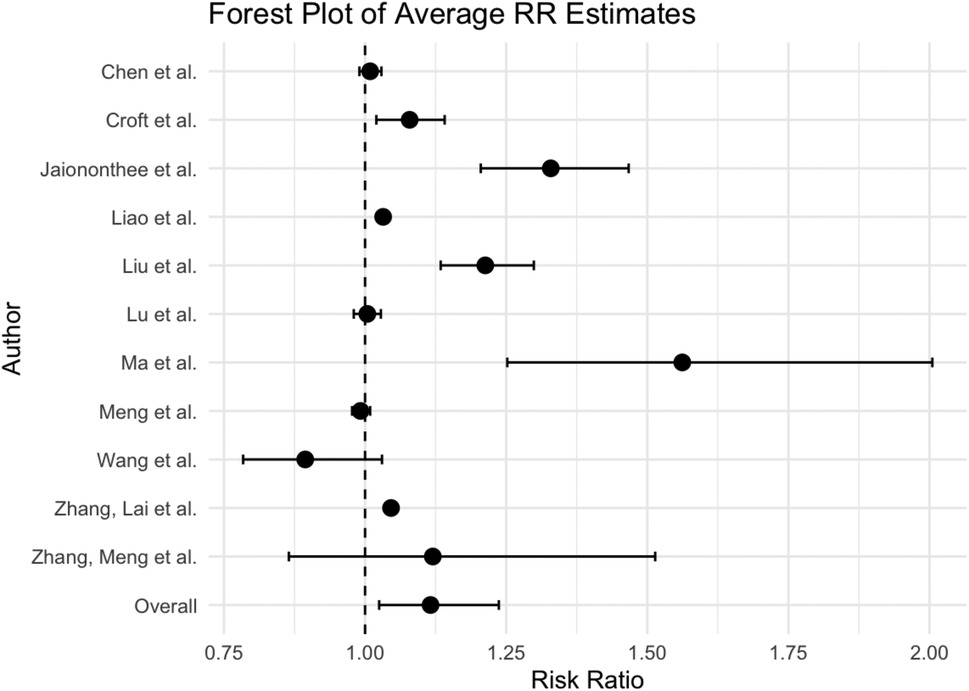
Figure 2. Forest plot of meta-analysis of the effect on the risk of influenza associated with PM2.5.
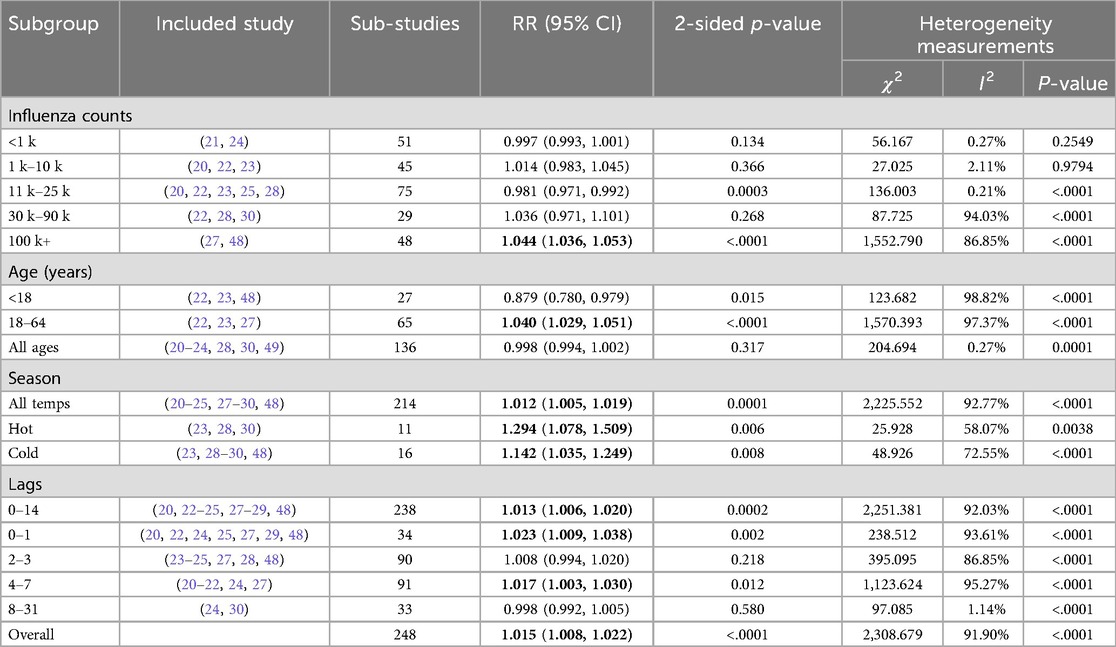
Table 2. Subgroup pooled analysis for the heterogeneity factors in the included articles. Relative Risk (RR), χ2 the Q statistic-based test and I2 statistic bolded values indicate confidence intervals that do not overlap 1.
Our analysis indicates that the risk of influenza due to PM2.5 exposure varies with seasons, showing stronger risk estimates during warmer flu seasons RR = 29.4% (95% CI: 7.8%, 50.9%) and colder seasons RR = 14.2% (95% CI: 3.5%, 24.9%). Heterogeneity among studies within a particular temperature group was moderate, 58.07% and 72.55%. Additionally, focusing on the 18–64 age group, we observed a slight increase in influenza risk due to PM2.5, RR = 4% (95% CI: 2.9%, 5.1%), with the heterogeneity across studies being non-significant. Of the studies that showed significant heterogeneity, the subgroup analysis by influenza counts demonstrated that larger populations (100K+) yielded higher risk estimates than smaller populations: RR = 4.4% (95% CI: 3.6%, 5.3%) per 10 μg/m3 increase in PM2.5, respectively.
Publication bias
Publication bias results from the regression test for funnel plot asymmetry revealed a z-value of 1.6282 with a corresponding p-value of 0.1035. Although this p-value exceeds the conventional cutoff for statistical significance (0.05), suggesting no significant funnel plot asymmetry, the limited number of studies included reduces the statistical power of this test. Therefore, the possibility of publication bias cannot be completely excluded, and findings should be interpreted with caution (see Supplementary Figure S1). Future studies with larger sample sizes would help provide more robust evaluations of publication bias.
Mechanistic effects
There were five studies that delved into the mechanistic underpinnings of the association between PM2.5 exposure and influenza (10, 31–34). Hsiao et al., identified certain chemicals within PM2.5 that are correlated with the presence of active influenza viruses, illuminating a potential chemical process that might facilitate the transmission of influenza. This research suggests that the chemical constituents of PM2.5 could play a crucial role in enabling these particles to act as carriers or vectors for the influenza virus (33). Kumar et al. found that exposure to PM2.5 can lead to failure to sustain optimal levels of interleukin 22 (IL-22), coupled with an inability to induce IL-22 production during flu infection. This inadequacy in maintaining IL-22 levels was proposed as a catalyst for aberrant epithelial repair and compromised immune responses, potentially escalating flu severity (31). Moreover, a different study elucidated the impairment of pulmonary immune defense mechanisms and lung tissue cell injury due to prolonged PM2.5 exposure, attributing increased post-infection death rates to the resultant downregulation of immune defenses (32). Additionally, findings from another investigation highlighted how PM2.5 compromised innate immune responses, rendering individuals susceptible to influenza by suppressing critical factors like the NLRP3 inflammasome and interferon-beta (IFN-β) expression (10). Lastly, a study exploring wood smoke particles during wildfires revealed dynamic changes in pulmonary macrophage and T-cell subsets in response to WSP and influenza challenge, providing insights into the nuanced immune response alterations triggered by these environmental factors during viral infection (34).
Discussion
Key findings
Our meta-analysis highlights the association between increased PM2.5 exposure and heightened influenza risk, with an overall 1.5% increase in relative risk (RR) per 10 µg/m3 increment of PM2.5. This relationship is significant but requires nuanced interpretation, especially given the high heterogeneity across studies. Our findings demonstrate the necessity of exploring factors beyond pooled averages, considering subgroup analyses that reveal the differential impact of PM2.5 across diverse populations. However, several limitations warrant further discussion, particularly concerning the subgroup analyses. While these analyses contribute valuable insight, the potential influence of confounding factors—such as socioeconomic status, baseline health, or lifestyle variations—is often under-addressed, risking overinterpretation of observed subgroup effects.
High variability exists among the included studies in terms of both study context and design. Variations in subgroup results could stem from factors other than PM2.5 exposure, such as underlying health status, access to healthcare, or differences in exposure measurement techniques. While the study stratifications—based on age, gender, temperature, and seasonal factors—provide compelling findings, they also introduce complexities that require careful consideration to avoid attributing all observed differences solely to PM2.5. Additional exploration of these confounders is essential to accurately interpret the observed associations. Potential limitations related to existing data sources were also identified, including inconsistencies in air pollution measurement techniques, variability in influenza reporting methods, and biases inherent in meta-analytic approaches. These limitations underscore the need for standardized methodologies and more consistent data collection practices in future research to ensure comparability and enhance the robustness of conclusions. Below, we discuss these findings in the context of each sub analysis grouping and their possible linkages to the impact of PM2.5 exposure on compromised immune response to influenza.
Short- and long-term Pm2.5 exposure periods affects influenza risk
Our meta-analysis revealed that nearly all lag periods of PM2.5 exposure influence influenza risk. We examined various lag periods, from immediate (“0–1” day) to extended (“8–31” days), to understand the temporal relationship between PM2.5 exposure and influenza risk.
For the short lag periods (“0–7” days), we observed an increase in influenza risk, suggesting an almost immediate effect of PM2.5 on influenza susceptibility. These observations align with previous research linking PM2.5 exposure to increased influenza risk and respiratory issues within a week of exposure (24, 25, 27–29, 35, 36). Mechanistic studies shed light on this relationship, showing that short-term PM2.5 exposure can trigger interleukin-6 (IL-6) synthesis, enhancing early immune response (32). However, short-term (<7 days) exposure can lead to reduced IL-6 production, subsequently compromising the immune response, and diminishing influenza resistance in mice (32). Further research indicates that PM2.5 can impede the production of critical immune factors like IL-1β and interferon-beta (IFN-β), potentially aggravating flu infections and suppressing certain immune pathways (10). Additionally, Kumar et al. (31) highlighted that while initial PM exposure increased IL-22 expression in the lungs, short-term exposure or subsequent influenza infection in PM-exposed mice resulted in reduced IL-22 expression, potentially contributing to aggravated lung injury during influenza infection (31).
The highest influenza risk was noted during the longer PM2.5 lag periods (“4–7” days). This could suggest a more pronounced impact of prolonged PM2.5 exposure on the respiratory system and immune response. We did look at a longer lag effect (7–14 days) which was significant; however, due to the small number of studies looking at this period of time, we did not include it in the final analysis. Mechanistic insights into extended exposure periods indicate that PM2.5 might compromise the immune system, rendering individuals more susceptible to influenza later. For instance, Ma et al. indicated that prolonged PM2.5 exposure diminished the expression of IL-6 and IFN-β in pulmonary macrophages, reducing resistance to influenza viruses (32). Another study highlighted a decrease in the production of IL-1β and IFN-β following PM2.5 exposure (10). Other studies with longer correlations emerged in Montana, USA, between elevated PM2.5 levels during the wildfire season and increased influenza activity in the subsequent season, suggesting a potential immune suppression pathway due to prolonged exposure (9). Another study by Orr et al. found that residents in Seeley Lake, Montana, USA, had decreased lung function after prolonged exposure to PM2.5 from wildfires long after the initial exposure event (37). These insights demonstrate the complexity of PM2.5's influence on influenza transmission, showing that it is affected by exposure duration, timing, and environmental events like wildfires, thus emphasizing the multifaceted factors influencing influenza risk in the presence of PM2.5.
Impact of seasonality on flu and Pm2.5 exposure in temperate and tropical locations
The influence of geographic locations, specifically temperate vs. tropical regions, on influenza patterns is well-established, with differences in environmental conditions leading to distinct viral transmission dynamics that vary with climatic conditions (23, 28–30, 38). Temperate zones experience seasonal flu peaks with onsets occurring after dry and cold periods (8, 39). In some tropical regions, influenza epidemics are reported during wetter periods, while others similar regions experience year-round peaks or do not exhibit clear seasonal patterns (40, 41). However, our meta-analysis revealed a disparity in the geographic distribution of studies, with most of the studies in tropical to subtropical areas. Our findings show that seasonal flu risks are heightened during warmer seasons, a trend likely influenced by the higher temperatures and humidity in tropical regions. These findings underscore the importance of developing region-specific flu prevention strategies, considering the continuous presence of the virus in tropical regions and the seasonal peaks in temperate zones.
The relationship between temperature, air pollution, and the immune response to influenza is complex and varies across different demographic groups and environmental conditions. High temperatures, particularly when combined with air pollutants like PM2.5, have been shown to significantly affect susceptibility to influenza. This impact is notably pronounced in certain demographic groups, including individuals aged 18–64 years. The interaction of high temperatures with pollutants such as ozone also exacerbates respiratory issues, as indicated by multiple studies (21, 22, 42).
In colder climates, particularly during winter, the combination of lower temperatures and decreased humidity is conducive to the stability and transmission of the influenza virus (43). These environmental conditions not only facilitate the virus's survival but also may impair immune responses, increasing vulnerability to influenza (44). Additionally, during cold periods, there is an increased likelihood of people remaining indoors near one another, which further enhances the transmission of the virus. Warm temperatures, conversely, present a more complex scenario in terms of influenza impact. While warm weather might reduce the stability and transmission of the influenza virus, studies by Zhang, Meng et al. and Shin et al. indicate a complicated relationship between temperature, air pollution, and flu susceptibility in these conditions (23, 36). In warmer climates, the role of air pollution becomes more significant in influencing respiratory health, which might affect influenza transmission dynamics.
Effect of study system and design
Our results demonstrated that factors such as population size, and age-specific analyses can influence the observed strength of association between PM2.5 exposure and influenza risk. Regarding influenza counts, larger populations often provide more robust and reliable statistical associations. This is a well-established principle in epidemiological studies, reflected in our findings of stronger inferences in studies with larger influenza counts aligning with existing research norms (45).
Our age-specific analyses showed a significant impact of PM2.5 exposure on influenza risk predominantly in the 18–64 age group, showing a reduced risk for individuals under 18. Intriguingly, no significant effect was observed in those over 64, as indicated by the relative risk value of 0.937 (95% CI: 0.887, 0.987). This absence of a noticeable effect in the elderly population, typically considered highly vulnerable to influenza, raises important questions. It could be hypothesized that this group may have reduced exposure to outdoor air pollution due to limited mobility or spending less time outdoors. Furthermore, the elderly might benefit from more robust public health interventions, like increased vaccination rates or better access to healthcare, which could mitigate the impact of PM2.5 on influenza risk.
For the 18–64 age group, factors unique to this demographic, such as increased periods spent outdoors, leading to higher exposure to pollution, and lifestyle characteristics that may contribute to elevated risk. Additionally, underlying health conditions that are more prevalent in this demographic might amplify the effects of PM2.5. Further compounding this issue is the role of immune system maturity and the presence of comorbidities, both of which are more pronounced in the adult population and may enhance vulnerability to the combined effects of influenza and air pollution. Research has shown that immune responses can vary significantly with age due to immunosenescence, which is the gradual deterioration of the immune system associated with aging. This can affect how the immune system responds to infections like influenza and to vaccinations (46). Studies have also shown that immune responses in individuals with conditions like obesity and type 2 diabetes mellitus, which are more common in adults, can significantly influence the efficacy of the influenza vaccine, highlighting the complex interaction between PM2.5 exposure and influenza risk in this age group (47).
Research gaps and future perspectives
Influenza remains a formidable challenge in global public health, often heightened by the looming threat of pandemics. Our meta-analysis has delved into the intricate relationships between PM2.5 exposure and influenza risk, shedding light on the dynamic interplay of environmental factors and their health impacts. While PM2.5 levels are decreasing in some parts of the world due to stringent regulations, they are concurrently rising in others, fueled by increasing human populations and climate-induced changes such as wildfires. This emphasizes the importance of addressing air pollution within influenza public health strategies.
However, notable limitations exist. Variability in air pollution measurement methods, geographic coverage, and influenza reporting practices introduce inconsistencies, complicating meta-analysis interpretations. Standardized data collection and reporting are essential for future research. Confounders such as socioeconomic status, healthcare access, and vaccination rates, which significantly affect influenza vulnerability, were inadequately addressed. Future studies should incorporate robust methodologies to manage these confounders effectively. Additionally, interactions between PM2.5 and other pollutants (e.g., nitrogen oxides, ozone, sulfur dioxide) that may amplify influenza susceptibility remain under-explored. Future research should prioritize comprehensive multi-pollutant analyses to clarify these interactions. Lastly, the predominance of studies from China limits the global applicability of findings. Enhanced international collaboration and geographically diverse research are essential to improve generalizability and inform effective global public health policies.
Conclusion
From our work, a key takeaway emerges: the impact of PM2.5 on influenza risk is multifaceted, influenced by exposure duration, population demographics, and environmental variables. This complexity highlights the necessity of both associative and mechanistic studies. While our analysis has provided valuable insights, it also reveals the need for more comprehensive research. To address this complexity effectively, future research must adopt a balanced approach, integrating associative studies—examining epidemiological relationships—and mechanistic studies that explore underlying biological pathways. Clarifying both how and why PM2.5 affects influenza susceptibility will enable public health strategies to be tailored specifically to diverse global contexts, accounting for regional variations in air pollution sources, population vulnerabilities, and environmental changes. This comprehensive, dual-focused research approach is critical for developing responsive and sustainable interventions capable of reducing influenza risks across varying environmental and demographic s
Data availability statement
The original contributions presented in the study are included in the article/Supplementary Material, further inquiries can be directed to the corresponding author.
Author contributions
AO: Conceptualization, Data curation, Formal analysis, Methodology, Writing – original draft, Writing – review & editing. RK: Data curation, Methodology, Writing – review & editing. ZJ: Writing – review & editing. JG: Formal analysis, Writing – review & editing. CM: Writing – review & editing. JK: Formal analysis, Writing – review & editing. CN: Conceptualization, Funding acquisition, Writing – review & editing. EL: Conceptualization, Funding acquisition, Methodology, Supervision, Writing – review & editing.
Funding
The author(s) declare that financial support was received for the research and/or publication of this article. This work was supported by National Institute of General Medical Sciences of the National Institutes of Health, United States (Award numbers P20GM130418). The funder of the study had no role in study design, data collection, data analysis, data interpretation, or writing of the report.
Acknowledgments
The authors would like to thank editors and reviewers.
Conflict of interest
The authors declare that the research was conducted in the absence of any commercial or financial relationships that could be construed as a potential conflict of interest.
Publisher's note
All claims expressed in this article are solely those of the authors and do not necessarily represent those of their affiliated organizations, or those of the publisher, the editors and the reviewers. Any product that may be evaluated in this article, or claim that may be made by its manufacturer, is not guaranteed or endorsed by the publisher.
Supplementary material
The Supplementary Material for this article can be found online at: https://www.frontiersin.org/articles/10.3389/fepid.2025.1475141/full#supplementary-material
References
2. United Nations News. World must be ready to respond to next pandemic: WHO chief. United Nations News (2023). Available at: https://news.un.org/en/story/2023/05/1136912 (Accessed October 20, 2023).
3. Holton E. The 1918 flu and COVID-19: a tale of two pandemics Anthony Fauci and Jeffery Taubenberger launch demystifying medicine's 2021 season. The NIH Catalyst. (2021) 29(2). https://irp.nih.gov/catalyst/29/2/the-1918-flu-and-covid-19-a-tale-of-two-pandemics
4. Mamelund SE, Shelley-Egan C, Rogeberg O. The association between socioeconomic status and pandemic influenza: systematic review and meta-analysis. PLoS One. (2021) 16(9):e0244346. doi: 10.1371/journal.pone.0244346
5. Lowen AC, Mubareka S, Steel J, Palese P. Influenza virus transmission is dependent on relative humidity and temperature. PLoS Pathog. (2007) 3(10):e151. doi: 10.1371/journal.ppat.0030151
6. Park J-E, Son W-S, Ryu Y, Choi SB, Kwon O, Ahn I. Effects of temperature, humidity, and diurnal temperature range on influenza incidence in a temperate region. Influenza Other Respir Viruses. (2020) 14(1):11–8. doi: 10.1111/irv.12682
7. Chong KC, Chen Y, Chan EYY, Lau SYF, Lam HCY, Wang P, et al. Association of weather, air pollutants, and seasonal influenza with chronic obstructive pulmonary disease hospitalization risks. Environ Pollut. (2022) 293:118480. doi: 10.1016/j.envpol.2021.118480
8. Shaman J, Pitzer VE, Viboud C, Grenfell BT, Lipsitch M. Absolute humidity and the seasonal onset of influenza in the continental United States. PLoS Biol. (2010) 8(2):e1000316. doi: 10.1371/journal.pbio.1000316
9. Landguth EL, Holden ZA, Graham J, Stark B, Mokhtari EB, Kaleczyc E, et al. The delayed effect of wildfire season particulate matter on subsequent influenza season in a mountain west region of the USA. Environ Int. (2020) 139:105668. doi: 10.1016/j.envint.2020.105668
10. Tao RJ, Cao WJ, Li MH, Yang L, Dai RX, Luo XL, et al. PM2.5 Compromises antiviral immunity in influenza infection by inhibiting activation of NLRP3 inflammasome and expression of interferon-β. Mol Immunol. (2020) 125:178–86. doi: 10.1016/j.molimm.2020.07.001
11. Page MJ, McKenzie JE, Bossuyt PM, Boutron I, Hoffmann TC, Mulrow CD, et al. The PRISMA 2020 statement: an updated guideline for reporting systematic reviews. Br Med J. (2021) 372:n71. doi: 10.1136/bmj.n71
12. Stroup DF, Berlin JA, Morton SC, Olkin I, Williamson GD, Rennie D, et al. Meta-analysis of observational studies in epidemiology: a proposal for reporting. JAMA. (2000) 283(15):2008–12. doi: 10.1001/jama.283.15.2008
13. Morgan RL, Whaley P, Thayer KA, Schünemann HJ. Identifying the PECO: a framework for formulating good questions to explore the association of environmental and other exposures with health outcomes. Environ Int. (2018) 121(Pt 1):1027. doi: 10.1016/j.envint.2018.07.015
14. Moher D, Liberati A, Tetzlaff J, Altman DG, Group P. Preferred reporting items for systematic reviews and meta-analyses: the PRISMA statement. Int J Surg. (2010) 8(5):336–41. doi: 10.1016/j.ijsu.2010.02.007
15. Cock PJA, Antao T, Chang JT, Chapman BA, Cox CJ, Dalke A, et al. Biopython: freely available python tools for computational molecular biology and bioinformatics. Bioinformatics. (2009) 25(11):1422–3. doi: 10.1093/bioinformatics/btp163
16. Wells GA, Shea B, O'Connell D, Peterson J, Welch V, Losos M, et al. The Newcastle-Ottawa Scale (NOS) for Assessing the Quality of Nonrandomised Studies in Meta-Analyses. Ottawa Hospital Research Institute (2000). Available at: http://www.ohri.ca/programs/clinical_epidemiology/oxford.asp (Accessed November 19, 2023).
17. Viechtbauer W. Conducting meta-analyses in R with the metafor package. J Stat Softw. (2010) 36(3):1–48. doi: 10.18637/jss.v036.i03
18. Schwarzer G. Meta: an R package for meta-analysis. R News. (2007) 7(3):40–5. doi: 10.32614/CRAN.package.meta
19. Higgins JPT, Thomas J, Chandler J, Cumpston M, Li T, Page MJ, et al., editors. Cochrane Handbook for Systematic Reviews of Interventions version 6.5 (updated August 2024). Cochrane (2024). Available at: www.training.cochrane.org/handbook (Accessed Novemeber 01, 2023).
20. Croft DP, Zhang W, Lin S, Thurston SW, Hopke PK, van Wijngaarden E, et al. Associations between source-specific particulate matter and respiratory infections in New York state adults. Environ Sci Technol. (2020) 54(2):975–84. doi: 10.1021/acs.est.9b04295
21. Ma P, Zhou N, Wang X, Zhang Y, Tang X, Yang Y, et al. Stronger susceptibilities to air pollutants of influenza A than B were identified in subtropical Shenzhen, China. Environ Res. (2023) 219:115100. doi: 10.1016/j.envres.2022.115100
22. Wang X, Cai J, Liu X, Wang B, Yan L, Liu R, et al. Impact of PM2.5 and ozone on incidence of influenza in Shijiazhuang. China: a time-series study. Environ Sci Pollut Res. (2023) 30(4):10426–43. doi: 10.1007/s11356-022-22814-2
23. Zhang R, Meng Y, Song H, Niu R, Wang Y, Li Y, et al. The modification effect of temperature on the relationship between air pollutants and daily incidence of influenza in Ningbo, China. Respir Res. (2021) 22(1):153. doi: 10.1186/s12931-021-01744-6
24. Lu B, Wang Y, Zhu Z, Zhang Z, Dong T, Li F, et al. Epidemiological and genetic characteristics of influenza virus and the effects of air pollution on laboratory-confirmed influenza cases in Hulunbuir, China, from 2010 to 2019. Epidemiol Infect. (2020) 148:e159. doi: 10.1017/S0950268820001387
25. Meng Y, Lu Y, Xiang H, Liu S. Short-term effects of ambient air pollution on the incidence of influenza in Wuhan, China: a time-series analysis. Environ Res. (2021) 192:110327. doi: 10.1016/j.envres.2020.110327
26. Chen Y, Leng K, Lu Y, Wen L, Qi Y, Gao W, et al. Epidemiological features and time-series analysis of influenza incidence in urban and rural areas of Shenyang, China, 2010–2018. Epidemiol Infect. (2020) 148:e29. doi: 10.1017/S0950268820000151
27. Zhang R, Lai KY, Liu W, Liu Y, Lu J, Tian L, et al. Community-level ambient fine particulate matter and seasonal influenza among children in Guangzhou, China: a Bayesian spatiotemporal analysis. Sci Total Environ. (2022) 826:154135. doi: 10.1016/j.scitotenv.2022.154135
28. Chen G, Zhang W, Li S, Zhang Y, Williams G, Huxley R, et al. The impact of ambient fine particles on influenza transmission and the modification effects of temperature in China: a multi-city study. Environ Int. (2017) 98:82–8. doi: 10.1016/j.envint.2016.10.004
29. Liu XX, Li Y, Qin G, Zhu Y, Li X, Zhang J, et al. Effects of air pollutants on occurrences of influenza-like illness and laboratory-confirmed influenza in hefei, China. Int J Biometeorol. (2019) 63(1):51–60. doi: 10.1007/s00484-018-1633-0
30. Jainonthee C, Wang YL, Chen CWK, Jainontee K. Air pollution-related respiratory diseases and associated environmental factors in Chiang Mai, Thailand, in 2011–2020. Trop Med Infect Dis. (2022) 7(11):341. doi: 10.3390/tropicalmed7110341
31. Kumar A, Patel VS, Harding JN, You D, Cormier SA. Exposure to combustion derived particulate matter exacerbates influenza infection in neonatal mice by inhibiting IL22 production. Part Fibre Toxicol. (2021) 18(1):43. doi: 10.1186/s12989-021-00438-7
32. Ma JH, Song SH, Guo M, Zhou J, Liu F, Peng L, et al. Long-term exposure to PM2.5 lowers influenza virus resistance via down-regulating pulmonary macrophage Kdm6a and mediates histones modification in IL-6 and IFN-β promoter regions. Biochem Biophys Res Commun. (2017) 493(2):1122–8. doi: 10.1016/j.bbrc.2017.09.013
33. Hsiao TC, Cheng PC, Chi KH, Wang HY, Pan SY, Kao C, et al. Interactions of chemical components in ambient PM(2.5) with influenza viruses. J Hazard Mater. (2022) 423(Pt B):127243. doi: 10.1016/j.jhazmat.2021.127243
34. Vose A, McCravy MS, Yang Z, Que LG, Hollingsworth JW, Tighe RM. Woodsmoke particle exposure in mice confers protective benefit against PR8 influenza virus. TP2 TP002 Immunology and Inflammation in Pulmonary Infections. American Thoracic Society International Conference Abstracts. American Thoracic Society (2021). p. A1267.
35. Croft DP, Zhang W, Lin S, Thurston SW, Hopke PK, Masiol M, et al. The association between respiratory infection and air pollution in the setting of air quality policy and economic change. Ann Am Thorac Soc. (2019) 16(3):321–30. doi: 10.1513/AnnalsATS.201810-691OC
36. Shin HH, Maquiling A, Thomson EM, Park IW, Stieb DM, Dehghani P. Sex-difference in air pollution-related acute circulatory and respiratory mortality and hospitalization. Sci Total Environ. (2022) 806(Pt 3):150515. doi: 10.1016/j.scitotenv.2021.150515
37. Orr A, Migliaccio C AL, Buford M, Ballou S, Migliaccio CT. Sustained effects on lung function in community members following exposure to hazardous PM2.5 levels from wildfire smoke. Toxics. (2020) 8(3):53. doi: 10.3390/toxics8030053
38. Rittweger J, Gilardi L, Baltruweit M, Dally S, Erbertseder T, Mittag U, et al. Temperature and particulate matter as environmental factors associated with seasonality of influenza incidence—an approach using Earth observation-based modeling in a health insurance cohort study from Baden-Württemberg (Germany). Environ Health. (2022) 21(1):131. doi: 10.1186/s12940-022-00927-y
39. Si X, Wang L, Mengersen K, Hu W. Epidemiological features of seasonal influenza transmission among 11 climate zones in Chinese mainland. Infect Dis Poverty. (2024) 13(1):4. doi: 10.1186/s40249-024-01173-9
40. Zhu A-Q, Li Z-J, Zhang H-J. Spatial timing of circulating seasonal influenza A and B viruses in China from 2014 to 2018. Sci Rep. (2023) 13(1):7149. doi: 10.1038/s41598-023-33726-7
41. Tamerius J, Nelson MF, Zhou SZ, Viboud C, Miller MA, Alonso WJ. Global influenza seasonality: reconciling patterns across temperate and tropical regions. Environ Health Perspect. (2011) 119(4):439–45. doi: 10.1289/ehp.1002383
42. Wong CM, Yang L, Thach TQ, Chau PY, Chan KP, Thomas GN, et al. Modification by influenza on health effects of air pollution in Hong Kong. Environ Health Perspect. (2009) 117(2):248–53. doi: 10.1289/ehp.11605
43. Yin Y, Lai M, Zhou S, Chen Z, Jiang X, Wang L, et al. Effects and interaction of temperature and relative humidity on the trend of influenza prevalence: a multi-central study based on 30 provinces in mainland China from 2013 to 2018. Infect Dis Model. (2023) 8(3):822–31. doi: 10.1016/j.idm.2023.07.005
44. Kudo E, Song E, Yockey LJ, Rakib T, Wong PW, Homer RJ, et al. Low ambient humidity impairs barrier function and innate resistance against influenza infection. Proc Natl Acad Sci U S A. (2019) 116(22):10905–10. doi: 10.1073/pnas.1902840116
45. Hajian-Tilaki K. Sample size estimation in epidemiologic studies. Caspian J Intern Med. (2011) 2(4):289–98.24551434
46. Lambert ND, Ovsyannikova IG, Pankratz VS, Jacobson RM, Poland GA. Understanding the immune response to seasonal influenza vaccination in older adults: a systems biology approach. Expert Rev Vaccines. (2012) 11(8):985–94. doi: 10.1586/erv.12.61
47. Wiggins KB, Smith MA, Schultz-Cherry S. The nature of immune responses to influenza vaccination in high-risk populations. Viruses. (2021) 13(6):1109. doi: 10.3390/v13061109
48. Liao Y, Sun J, Qian Z, Mei S, Li Y, Lu Y, et al. Modification by seasonal influenza and season on the association between ambient air pollution and child respiratory diseases in Shenzhen, China. Atmos Environ. (2020) 234:117621. doi: 10.1016/j.atmosenv.2020.117621
Keywords: fine particulate matter, lag effects, respiratory viral, infections, influenza
Citation: Orr A, Kendall RL, Jaffar Z, Graham J, Migliaccio CT, Knudson J, Noonan C and Landguth EL (2025) A systematic review and meta-analysis on the association between PM2.5 exposure and increased influenza risk. Front. Epidemiol. 5:1475141. doi: 10.3389/fepid.2025.1475141
Received: 2 August 2024; Accepted: 27 March 2025;
Published: 11 April 2025.
Edited by:
L. Gayani Tillekeratne, Duke University, United StatesReviewed by:
Nicole Rübsamen, University of Münster, GermanyMajid Kermani, Iran University of Medical Sciences, Iran
Mahima Habil, Dr. B. R. Ambedkar University, India
Copyright: © 2025 Orr, Kendall, Jaffar, Graham, Migliaccio, Knudson, Noonan and Landguth. This is an open-access article distributed under the terms of the Creative Commons Attribution License (CC BY). The use, distribution or reproduction in other forums is permitted, provided the original author(s) and the copyright owner(s) are credited and that the original publication in this journal is cited, in accordance with accepted academic practice. No use, distribution or reproduction is permitted which does not comply with these terms.
*Correspondence: Ava Orr, YXZhLm9yckBtc28udW10LmVkdQ==