 Vanessa Meyer
 Donovan Sean Saccone
 Fidele Tugizimana
 Furaha Florence Asani
 Tamsyn Jacki Jeffery
 Liza Bornman*
- Department of Biochemistry, University of Johannesburg, Johannesburg, South Africa
Background: The disparity in prevalence of infectious diseases across the globe is common knowledge. Vitamin D receptor (VDR)-mediated toll-like receptor (TLR) 2/1 signaling produces antimicrobial peptides, which is critical as a first line of defense in innate immunity. Numerous studies disclosed the independent role of genetic polymorphisms in this pathway, vitamin D status or season and more recently epigenetics, as factors contributing to infectious disease predisposition. Few studies address the interaction between environment, genetics, and epigenetics. Here, we hypothesized that VDR-mediated TLR2/1 signaling is influenced by a combination of environment, epigenetics and genetics, collectively influencing differential innate immunity.
Methods: Healthy Black and White South Africans (n = 100) donated blood, while ultraviolet index (UVI) was recorded for the duration of the study. LC-MS/MS supported 25(OH)D3 quantification. Monocyte/macrophage cultures, supplemented with/without 1,25(OH)2D3, were activated with the TLR2/1 elicitor, Pam3CSK4. VDR, cathelicidin antimicrobial peptide, hCAP-18, and 25-hydroxyvitamin D3-24-hydroxylase expression were quantified by RT-qPCR or flow cytometry. Pyrosequencing facilitated VDR methylation analysis and single-nucleotide polymorphism (SNP) genotyping in regions pinpointed through a bioinformatics workflow.
Results: Season interacted with race showing 25(OH)D3 deficiency in Blacks. UVI correlated with 25(OH)D3 and VDR methylation, likely influencing race differences in the latter. Regarding the TLR2/1 pathway, race differences in SNP genotype distribution were confirmed and functional analysis of VDR-mediated signaling showed interaction between race, season, and 25(OH)D3 status. Multivariate OPLS-DA mirrored several interactions between UVI, 25(OH)D3 status, DNA sequence, and methylation variants. Methylation of the third cytosine-phosphate-guanine dinucleotide (CpG) in the promoter CpG island (CGI) 1062, CGI 1062 CpG 3, significantly discriminated a 5.7-fold above average mean in VDR protein level upon TLR2/1 elicitation, the variation of which was further influenced by 25(OH)D3 status and the VDR SNP TaqI.
Conclusion: Regulation of VDR-mediated TLR2/1 signaling is multifactorial, involving interaction between environment [UVI and consequent 25(OH)D3 status], epigenetics (VDR methylation at key regulatory sites), and genetics (TLR1, TIRAP, and VDR SNPs).
Introduction
In addition to its role in maintaining calcium–phosphorus homeostasis, vitamin D is a potent modulator of both innate and adaptive immunity, is involved in the regulation of cell growth and differentiation, detoxification of xenobiotics, and activation of monocytes/macrophages (1, 2). These actions of vitamin D are almost entirely dependent on the interaction between the most biologically active form of vitamin D, 1,25-dihydroxyvitamin D3 [1,25(OH)2D3], and the vitamin D receptor (VDR) transcription factor. Bound to 1,25(OH)2D3, the VDR regulates the expression of a myriad of genes (3, 4). Cathelicidin antimicrobial peptide (CAMP) and 25-hydroxyvitamin D3-24-hydroxylase (CYP24A1) are examples of two well-characterized vitamin D target genes, respectively, encoding the cathelicidin antimicrobial peptide (hCAP-18) and multifunctional vitamin D catabolizing enzyme.
Toll-like receptor 2/1 (TLR2/1) triggering activates a signaling cascade inducing both VDR (5) and CYP27B1 in monocytes/macrophages. CYP27B1 catalyzes de novo production of 1,25(OH)2D3 from accumulated 25(OH)D3; delivered to the cells via the vitamin D binding protein (DBP), encoded by GC. The liganded VDR–transcription factor complex binds to vitamin D response elements (VDREs) in CAMP, activating CAMP expression and the production of hCAP-18. hCAP-18 is synthesized as a proprotein consisting of an N-terminal cathelin domain and a C-terminal LL-37 domain (6). While the cathelin domain is a cysteine protease inhibitor with broad spectrum antibacterial activity (7), LL-37 directly inhibits mycobacterial replication (5, 8), has antifungal activity against Candida albicans (9), and antiviral activity against HIV (10).
Since CAMP expression is dependent on vitamin D, and vitamin D deficiency has been linked to several infectious diseases including tuberculosis (11), sepsis (12), bacterial infections after kidney transplants (13), and HIV (14), it is not surprising that more than 100 clinical trials have assessed the efficacy of vitamin D supplementation as adjunct therapy in the treatment of various infectious diseases. However, the outcome of clinical trials has been conflicting and this is often attributed to differences in study design, baseline vitamin D status of participants, and outcome measurements. In fact, it appears that individuals can be classified into three groups: (i) those with a low response, (ii) those with a medium response, and (iii) those with a high response to vitamin D supplementation (15). These interindividual differences may result from variation in the regulation of VDR expression at both a genetic and epigenetic level (16). For example, VDR function to transactivate CAMP is influenced by the VDR single nucleotide polymorphism (SNP) FokI (rs2228570) and ethnicity (17), while vitamin D insensitivity in breast cancer cells has been attributed to CpG methylation of the VDR primary promoter (18). Thus, both genetics and epigenetics have the potential to influence the response to vitamin D. Indeed, a double-blind randomized controlled trial assessing the impact of high-dose vitamin D3 during intensive-phase antimicrobial treatment of pulmonary tuberculosis showed that vitamin D only increased the time for sputum culture conversion in participants carrying the CC genotype of the VDR SNP TaqI (rs731236) (19). Additionally, VDR expression is influenced by the environment. For example, narrow-band UVB induces miRNA-125b (20), which directly regulates VDR mRNA translation, decreasing VDR protein level (21, 22). Seasonal variation in ultraviolet index (UVI) further correlates with circulating vitamin D (23). Thus, seasonal variation in UVI directly influences VDR function by altering the availability of the free 1,25(OH)2D3. Indirectly, changes in 1,25(OH)2D3 concentration may itself regulate VDR expression through multifunctional, 1,25(OH)2D3-responsive, enhancers located within the VDR itself (24). The complex regulation of the VDR through genetics, epigenetics, and environment (16) may therefore provide insight into inter-individual variation in response to vitamin D and the efficacy of vitamin D to enhance immune function.
Here, we evaluate (1) the effect of VDR methylation on the TLR2/1-VDR signaling pathway and (2) the impact of genetic and environmental factors on differential immune signaling. It was hypothesized that VDR-mediated TLR2/1 signaling is influenced by a combination of environment, epigenetics and genetics, collectively influencing differential innate immunity in healthy South Africans. Using an in vitro model, stimulating monocytes from healthy individuals with a TLR2/1 elicitor, we avoided pathogen-mediated changes in DNA methylation (25, 26).
Results presented here provide support for multifactorial regulation of VDR-mediated, TLR2/1 signaling, involving interaction between environment, epigenetics, and genetics. UVI influences 25(OH)D3 status, which regulates VDR expression through VDR methylation, while enhancing the extent and rate of VDR transactivation of CAMP encoding the antimicrobial peptide hCAP-18.
Materials and Methods
Sample Collection and Environment
In accordance with the Declaration of Helsinki, the Human Research Ethics Committee of the South African National Blood Service (SANBS HREC clearance certificate number 2010/01) and the Ethics Committee, Faculty of Science, University of Johannesburg (2010/06/03) approved the study. After written informed consent, the SANBS collected blood from randomly selected healthy Black (n = 50; age 17–62 years; 25 males and 25 females) and White (n = 50; age 17–69 years; 25 males and 25 females) South Africans living in Gauteng, SA. Samples were collected across all seasons, though no White individuals were collected in winter for functional analysis. UVI was obtained from the South African Weather Service weather station in Irene, Pretoria, Gauteng. As 25(OH)D3 has a half-life of 2–4 weeks in circulation (27), the approximate UVI that each individual could have been exposed to was calculated as the 4-week average before blood collection, using the average hourly UVI between 11.00 a.m. and 14.00 p.m. across the years of sample collection (2011–2014).
Quantification of Circulating 25(OH)D3
Liquid chromatography tandem mass spectrometry (LC-MS/MS) facilitated quantification of 25(OH)D3 concentration in the Department of Clinical Biochemistry, University Hospital of South Manchester (UK), including four human serum pools from the Vitamin D External Quality Assessment Scheme (DEQAS, UK). A concentration of ≥50 nmol/L was considered normal/sufficient (28). 25(OH)D3 concentration was below the detection limit (3 nmol/L) in four Black samples, while sample was insufficient for six Blacks and eight Whites.
Bioinformatics
To identify putative functional loci that could influence VDR expression and function through genetic and/or epigenetic mechanisms, a bioinformatics workflow was developed (Methods S1.1, Figures S1 and S2, and Table S1 in Supplementary Material).
DNA Methylation Analysis
Monocytes were isolated and gDNA extracted, at time zero, as previously described (17). VDR methylation analysis by bisulfite pyrosequencing was outsourced to EpigenDx, Inc. (MA, USA). Selected sites typed included 10 CpGs in CpG island (CGI) 1066 spanning enhancer U3 (chr12:48340628-48340806, hg19), 56 CpGs in CGI 1062 spanning the primary promoter (chr12:48299359-48298799), 12 CpGs in CGI 1061 spanning exon 3 (chr12:48258845-48259024), and 18 CpGs in CGI 1060 spanning exon 9 (chr12:48238512-48238799). CpGs were numbered in the 5′–3′ direction.
Genotyping
Genotyping by pyrosequencing was outsourced to EpigenDx, Inc. (MA, USA). Typed SNPs included GC rs7041, rs4588, and rs146681395; TLR1 rs5743551 (A7202G), rs146940675, rs4833095 (N248S), rs111807776, rs143576765, rs5743618 (I602S), rs151036585, rs5743613 (P315L), rs185747096, rs146782074, and rs200631178; TLR2 rs3804099 (T597C); TiRAP rs8177374 (S180L) and rs141792148; VDR rs11168312, rs11568820 (Cdx-2), rs182743714, rs184448883, rs4516035 (GATA), rs2228570 (FokI), rs187018098, rs71951818, rs1544410 (BsmI), rs7975232 (ApaI), rs731236 (TaqI), and rs4987032; CYP24A1 rs6068812; and DMNT3A rs1550117 and rs112621472.
Monocyte/Macrophage Culture and Treatment
To estimate TLR2/1 pathway efficacy, VDR mRNA, VDR protein, CAMP mRNA, hCAP-18 peptide, and CYP24A1 mRNA, hereafter referred to as functional variables, were quantified following different treatments of monocyte/macrophage cultures that were established as previously described (17). Some monocytes were retained for functional analysis at time zero (baseline). The rest were settled in culture for 16 h prior to 24 h treatment with the vehicle control, 1,25(OH)2D3 (10 nM, Sigma Aldrich, St Louis, MO, USA), the TLR2/1 elicitor Pam3CSK4, (6.5 µg/ml culture media, EMC microcollections, Tuebingen, Germany), or both the elicitor and 1,25(OH)2D3.
mRNA and Protein Quantification
The relative level of VDR, CAMP, and CYP24A1 mRNA was quantified by RT-qPCR and VDR protein and intracellular hCAP-18 peptide by flow cytometry as previously described (17). Gene normalization was performed against two stably expressed reference genes: ubiquitin C (UBC) and tyrosine-3-monooxygenase/tryptophan-5-monooxygenase activation protein, zeta polypeptide (YWHAZ). Gene expression was quantified using the comparative CT method according to the MIQE guidelines, using inter-run calibrators and qBASEPLUS software. To compensate for variability in fluorescence readings between experiments on the flow cytometer, the median fluorescence intensity (MFI) of broad-spectrum calibration beads was used to normalize data and thereby provide a calibrator for instrument-related variation in the flow cytometry readings over time. For hCAP-18, mouse IgG1 anti-human hCAP-18 primary antibodies (10 µg/ml, Abcam, Cambridge, UK) and APC-conjugated goat anti-mouse IgG1 secondary antibodies (2 µg/mL, Abcam, Cambridge, UK) were used. Western blotting facilitated tracing of hCAP-18 processing and secretion (Methods S1.2 in Supplementary Material).
Statistical Analysis
IBM® SPSS® Statistics (v 23; SPSS Inc., Chicago, IL, USA) and SIMCA (v 14; Umetrics, Umea, Sweden) facilitated statistical analysis. Normal distributions were obtained by natural logarithm (ln) transformation of all functional data, except VDR protein. Correlation coefficients were computed using Pearson or Spearman’s rho. A general linear model was used for multivariate analysis of variance to assess main effects and factor interaction. Mann–Whitney U tested methylation differences. Pearson’s Chi-square test for independence assessed SNP distribution. Orthogonal projections to latent structures discriminant analysis (OPLS-DA, Methods S1.3 and Figures S3 and S4 in Supplementary Material) facilitated the study of the multivariate effect of VDR methylation, SNPs, and environment on TLR2/1-VDR signaling.
Results
Differences in Plasma 25(OH)D3 Concentration Are Influenced by Race and Season
Plasma 25(OH)D3 concentration was quantified by LC-MS/MS (Figure 1). Race had a significant main effect on 25(OH)D3 concentration (P < 0.001). Overall, Blacks were deficient (<50 nmol/L) with a significantly lower 25(OH)D3 concentration (P < 0.010) than Whites, who had normal levels (≥50 nmol/L). Race interacted significantly with season (P < 0.010), showing a lower 25(OH)D3 concentration in Blacks in winter (P < 0.050) and spring (P < 0.001), but not in summer and autumn.
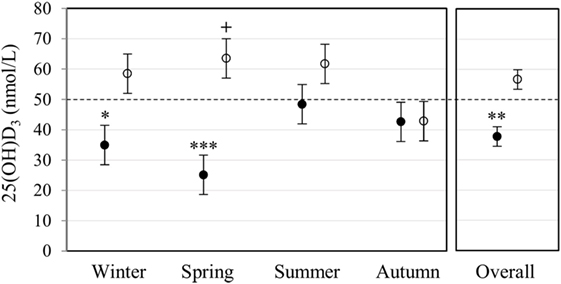
Figure 1. Race and season influenced plasma 25(OH)D3 concentration. The error bar plot shows the mean plasma 25(OH)D3 concentration, quantified by liquid chromatography tandem mass spectrometry, for healthy Black (filled markers, n = 50) and White (open markers, n = 53) South Africans, collected in winter (Black n = 17, White n = 10), spring (Black n = 10, White n = 16), summer (Black n = 10, White n = 11), and autumn (Black n = 13, White n = 16). Blacks were deficient (<50 nmol/L), having a significantly lower plasma 25(OH)D3 concentration than Whites in winter (*P < 0.050), spring (***P < 0.001), and overall (**P < 0.010). Overall, whites had normal 25(OH)D3 levels (≥50 nmol/L, ≤125 nmol/L), with a significantly higher plasma 25(OH)D3 concentration in spring compared to autumn (+P < 0.050). P-Values were adjusted using Bonferroni correction. Error bars show the unadjusted least significant difference at P < 0.050. The dotted line indicates the border between normal and deficient.
VDR Methylation Differs between Races
To assess the impact of VDR methylation on TLR2/1-VDR signaling, VDR methylation was quantified by bisulfite pyrosequencing. Regional methylation (Figure 2A) was compared between Blacks and Whites across the VDR in key CGIs identified through a bioinformatics workflow (Methods S1.1, Figures S1 and S2, and Table S1 in Supplementary Material). Comparing regional methylation, Whites had significantly lower levels at CGI 1062 (P < 0.001) and CGI 1060a (CpG 1-5, 5′ of TaqI, Figure 2A, P < 0.010) than Blacks, but higher levels at CGI 1060b (CpG 7-18, 3′ of TaqI, Figure 2A, P < 0.001). Significant racial differences in site-specific methylation (Results S2.2 and Figure S5 in Supplementary Material) were common in CGI 1062 (27/56) and 1060 (10/18), but less so in CGI 1066 (1/10) and1061 (3/12).
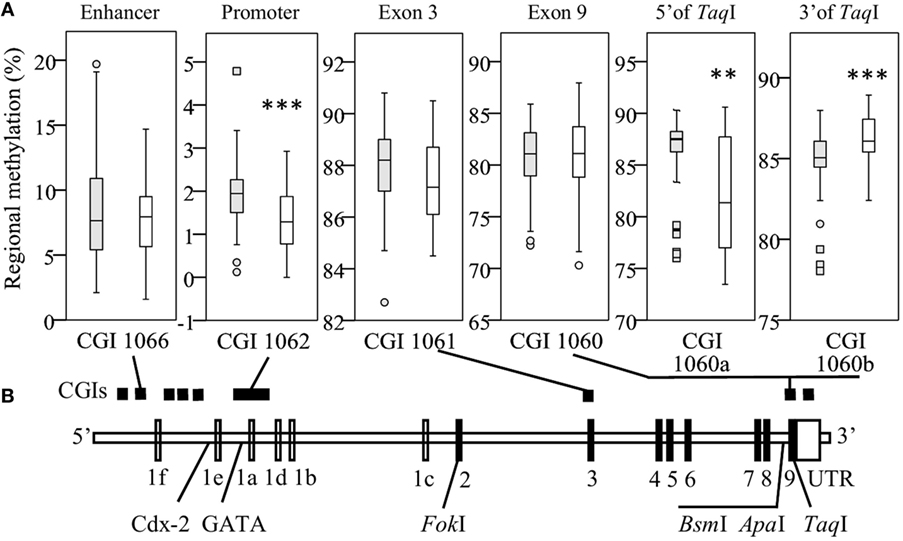
Figure 2. Race differences in regional vitamin D receptor (VDR) methylation. Box-and-whisker plots show the spread of regional methylation, quantified by bisulfite pyrosequencing, at the selected CpG islands (CGIs) (A) in context of VDR non-coding (unfilled) and coding exons (filled) and key single-nucleotide polymorphisms (B); CGI 1066 spanning an enhancer, 1062 the primary promoter, 1061 exon 3 and 1060 exon 9, and the promoter of a non-coding transcript. Compared to Black South Africans (filled boxes, n = 50), methylation in Whites (open boxes, n = 50) was significantly lower in CGI 1062 (***P < 0.001) and 1060a (**P < 0.010), but higher in CGI 1060b (***P < 0.001). Box-and-whisker plots show the median (line in box), interquartile range (IQR, height of box), 95% CI (whiskers, extending to 1.5 IQRs or minimum and maximum values if no case has a value in that range), outliers (○, between 1.5 IQRs and 3 IQRs from the end of a box), and extreme outliers (◻, more than 3 IQRs from the end of a box). Site-specific methylation is shown in Figures S5A–D in Supplementary Material.
TLR-VDR Pathway Genetics Differs between Races
To assess genetic variation between individuals in the TLR2/1-VDR signaling pathway, SNPs in several genes of the pathway and in the de novo methyltransferase enzyme, DNMT3A, were genotyped by pyrosequencing. Several SNPs, including DNMT3A SNPs, were monomorphic in the study population. Except for VDR BsmI and TaqI, the frequency distribution of polymorphic SNPs differed significantly between Blacks and Whites (Table 1). The 1000 Genomes Deep Catalog of Human Genetic Variation confirmed race-specific genotype frequency distribution, also for BsmI and TaqI though not for ApaI, comparing Africans (Yoruba) and Caucasians (Table S2 in Supplementary Material).
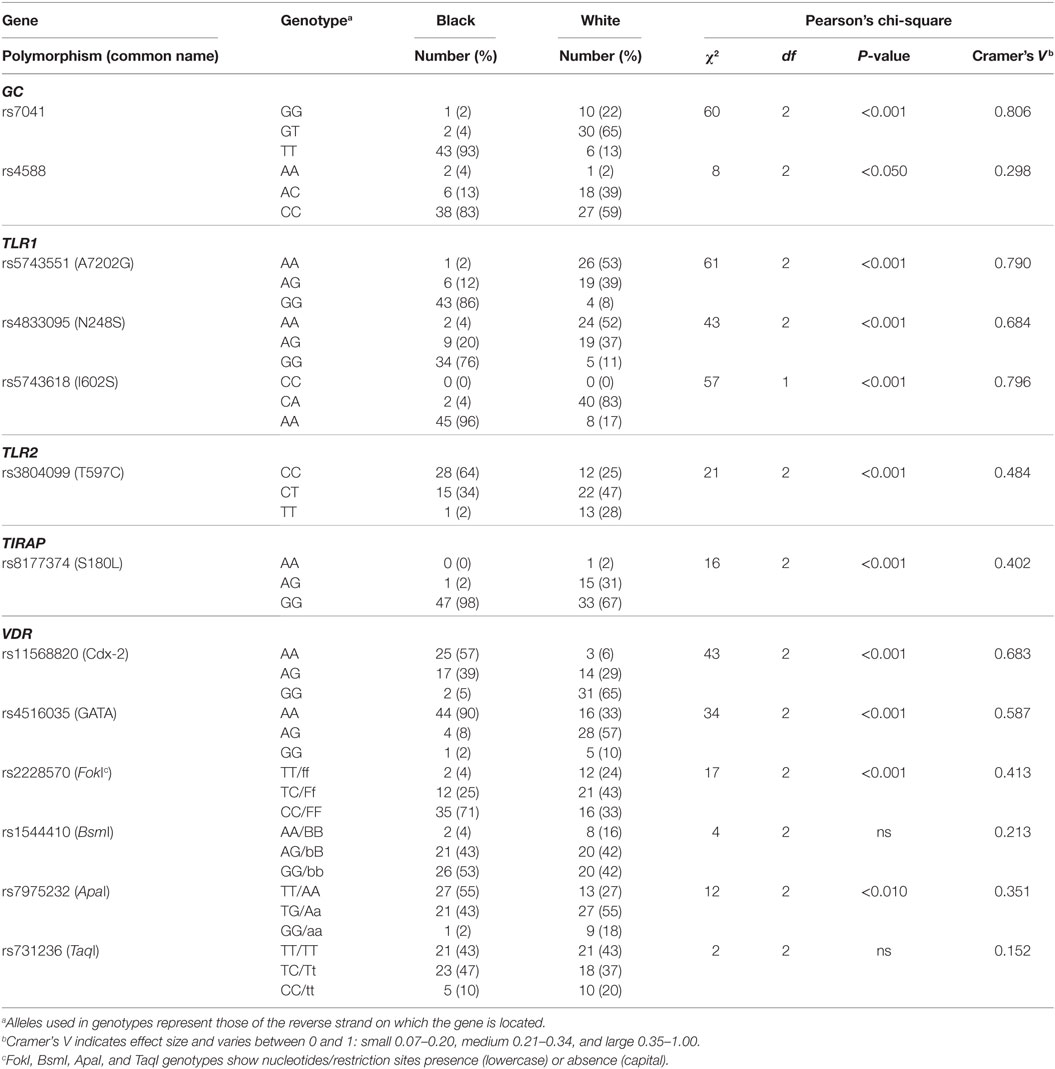
Table 1. Differential genotype distribution for polymorphic single-nucleotide polymorphism (SNPs) in the toll-like receptor (TLR)–vitamin D receptor (VDR) pathway in Black and White South Africans.
Multivariate Effects of Race, Plasma 25(OH)D3 Status, Season, and Treatment on Functional Variables upon Elicitation of TLR2/1-VDR Signaling
To assess the efficacy of the TLR2/1-VDR signaling regarding functional variables in the pathway (VDR mRNA, VDR protein, CAMP mRNA, hCAP-18, and CYP24A1 mRNA), multivariate analysis of the effect of race, 25(OH)D3 status, season, and treatment (with/without in vitro 1,25(OH)2D3 supplementation and/or TLR2/1 elicitation) was performed (Table 2). Treatment had a significant main effect on functional variables (Figure 3), while season, race, and 25(OH)D3 status showed several complex interactions regarding VDR mRNA and VDR protein (Figure 4), CAMP mRNA and CYP24A1 mRNA (Figure 5) and hCAP-18 (Figure 6). TLR2/1 elicitation induced VDR protein (Figure 3B, P < 0.001), while 1,25(OH)2D3 induced CAMP mRNA and CYP24A1 mRNA (Figures 3C,E, P < 0.001). Considering interactions, 25(OH)D3-deficient Blacks had significantly lower VDR mRNA in summer than deficient Whites or Whites and Blacks with a normal 25(OH)D3 status (P < 0.050, Figure 4A). In contrast, 25(OH)D3-deficient Whites had significantly lower VDR mRNA in autumn than deficient Blacks or Whites and Blacks with a normal 25(OH)D3 status (P < 0.050). VDR protein dropped significantly in summer and autumn for Whites and Blacks, respectively, showing a significant race difference in summer (P < 0.050, Figure 4B). CAMP mRNA increased significantly from summer to autumn in Whites, being significantly higher than Blacks (P < 0.050, Figure 5A). Whites with a normal 25(OH)D3 status had significantly higher CYP24A1 mRNA than 25(OH)D3-deficient Whites or Blacks and Blacks with a normal 25(OH)D3 status (P < 0.050, Figure 5B). A notable decrease in hCAP-18 was observed in Whites from spring through summer to autumn being significantly higher in spring and significantly lower in autumn, compared to Blacks (P < 0.050, Figure 6A). All individuals with a normal 25(OH)D3 status showed a similar, significant decrease in hCAP-18 from spring to autumn (P < 0.050, Figure 6B). Blacks with a normal 25(OH)D3 status had significantly more hCAP-18, than normal Whites and deficient Blacks or Whites (P < 0.050, Figure 6C). To confirm that the intracellular decrease in hCAP-18 in response to seasons with higher 1,25(OH)2D3 reflects hCAP-18 processing and LL-37 secretion, we performed Western blotting on 20 additional randomly selected healthy Black (n = 10) and White (n = 10) South Africans. These individuals, collected in winter and for whom no other variables were quantified, were also included in 25(OH)D3 quantification (shown in Figure 1). Western blotting showed individual-specific hCAP-18 processing and LL-37 secretion, which depended on 25(OH)D3 status, extent of 1,25(OH)2D3 supplementation, and incubation time (Figure 7). For example, an individual with a sufficient 25(OH)D3 status (>50 nmol/L, Figure 7A) had the highest level of intracellular LL-37 under control condition and already secreted LL-37 upon TLR2/1 elicitation at 16 h, and secreted even more with moderate 1,25(OH)2D3 supplementation (10 nM) or at 24 h. However, with excessive (50 nM) supplementation, the individual secreted less (16 h) or none (24 h). In contrast, 25(OH)D3-deficient individuals secreted LL-37 slower and required at least 50 nM of 1,25(OH)2D3 to secrete at 16 h (Figure 7C). An individual with severe 25(OH)D3 deficiency (23.2 nmol/L) secreted LL-37 only after 24 h in the presence of 50 nM 1,25(OH)2D3 (Figure 7D). It should be noted that secreted LL-37 was undetectably low in 13 of the 20 randomly selected individuals subjected to Western blotting.
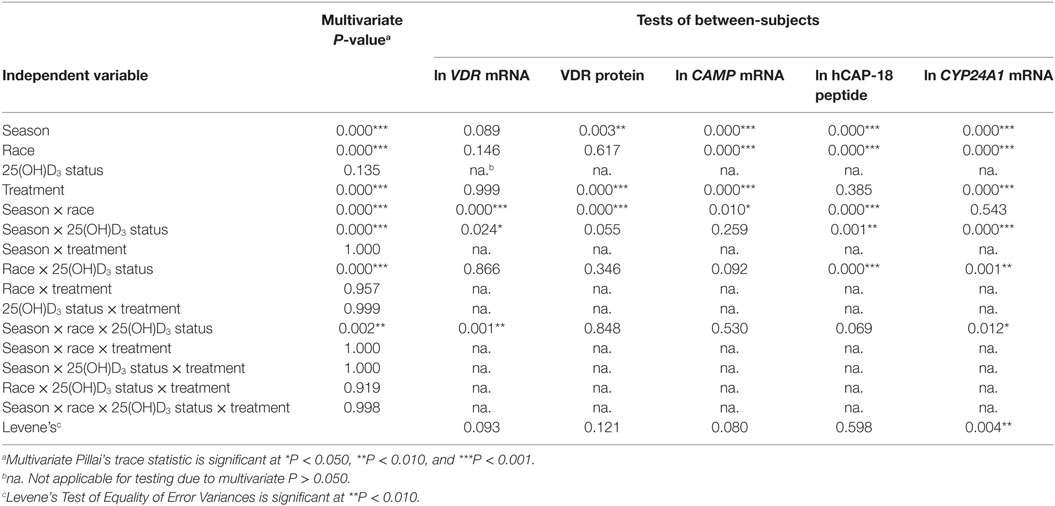
Table 2. Multivariate main and interaction effects of season, race, 25(OH)D3 status, and treatment on the functional variables marking TLR2/1 vitamin D receptor (VDR)-mediated signaling.
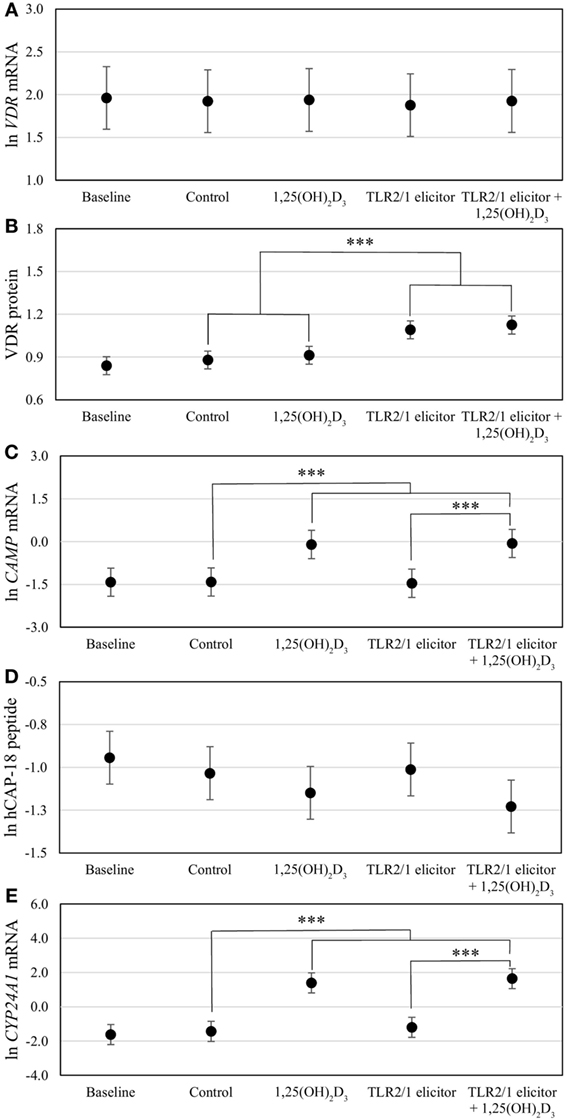
Figure 3. Differential vitamin D receptor (VDR)-mediated innate immune response to toll-like receptor (TLR) 2/1 elicitation, with or without in vitro 1,25(OH)2D3 supplementation. The error bar plots show mean levels for VDR mRNA (A), VDR protein (B), CAMP mRNA (C), hCAP-18 peptide (D), and CYP24A1 mRNA (E), for healthy South Africans (n = 100). Gene expression (mRNA) was quantified by RT-qPCR and protein or peptide level by flow cytometry. Significant treatment effects are shown (***P < 0.001). All significant differences were maintained after Bonferroni correction. Error bars show the least significant difference at P < 0.050.
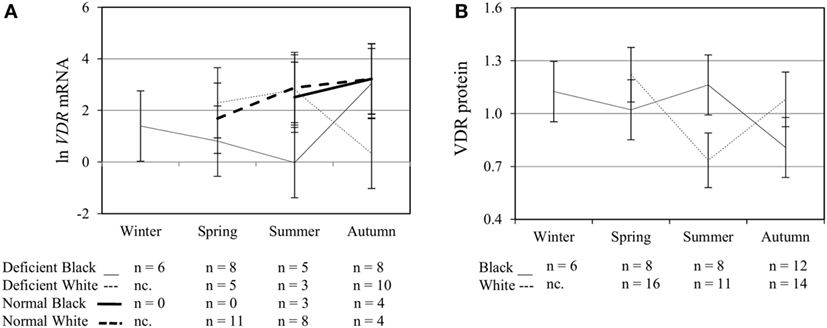
Figure 4. Interaction between season, race, and 25(OH)D3 status influence vitamin D receptor (VDR) mRNA and protein level. The line graphs show the interaction effects for VDR mRNA (A) and protein (B) level, quantified by RT-qPCR and flow cytometry, in monocytes/macrophages from healthy Black (n = 34) and White (n = 41) South Africans. Season, race, and 25(OH)D3 status interacted significantly to influence VDR mRNA (P < 0.001), while season and race showed interaction effects on VDR protein (P < 0.001). Error bars show the least significant difference at P < 0.050. nc. = not collected.
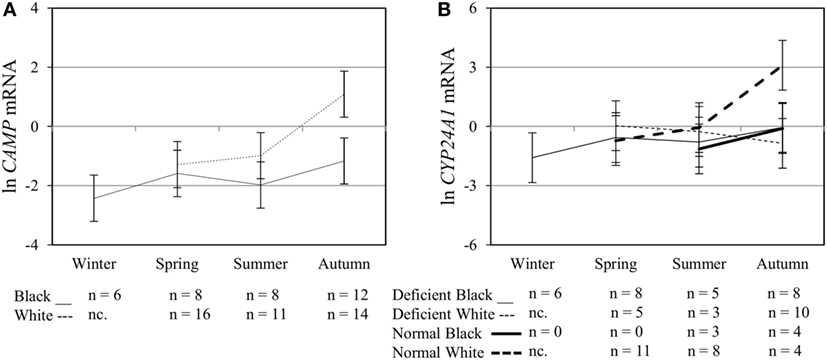
Figure 5. Interaction between season, race, and 25(OH)D3 status influence vitamin D receptor (VDR) transactivation of cathelicidin antimicrobial peptide (CAMP) and 25-hydroxyvitamin D3-24-hydroxylase (CYP24A1). The line graphs show the interaction effects for CAMP mRNA (A) and CYP24A1 mRNA (B) level, quantified by RT-qPCR, in monocytes/macrophages from healthy Black (n = 34) and White (n = 41) South Africans. Season and race interacted significantly to influence CAMP mRNA (P < 0.050), while season, race, and 25(OH)D3 status showed interaction effects on CYP24A1 mRNA levels (P < 0.050). Error bars show the least significant difference at P < 0.050. nc. = not collected.
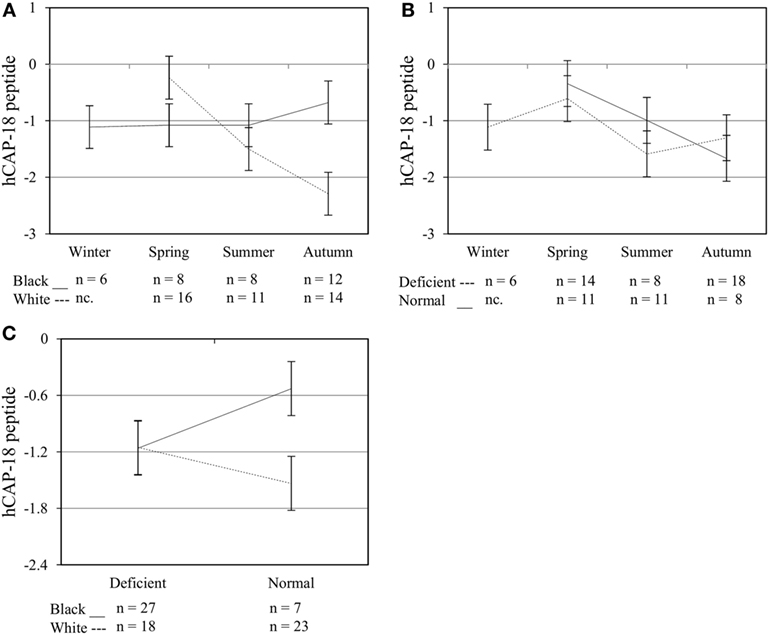
Figure 6. Interaction between season, race, and 25(OH)D3 status influence intracellular hCAP-18 peptide level. The line graphs show the interaction effects for hCAP-18 peptide level, quantified by flow cytometry, in monocytes/macrophages from healthy Black (n = 34) and White (n = 41) South Africans. Season and race [(A), P < 0.001], season, and 25(OH)D3 status [(B), P < 0.010], and race and 25(OH)D3 status [(C), P < 0.001] interacted significantly to influence hCAP-18 levels. Error bars show the least significant difference at P < 0.050. nc. = not collected.
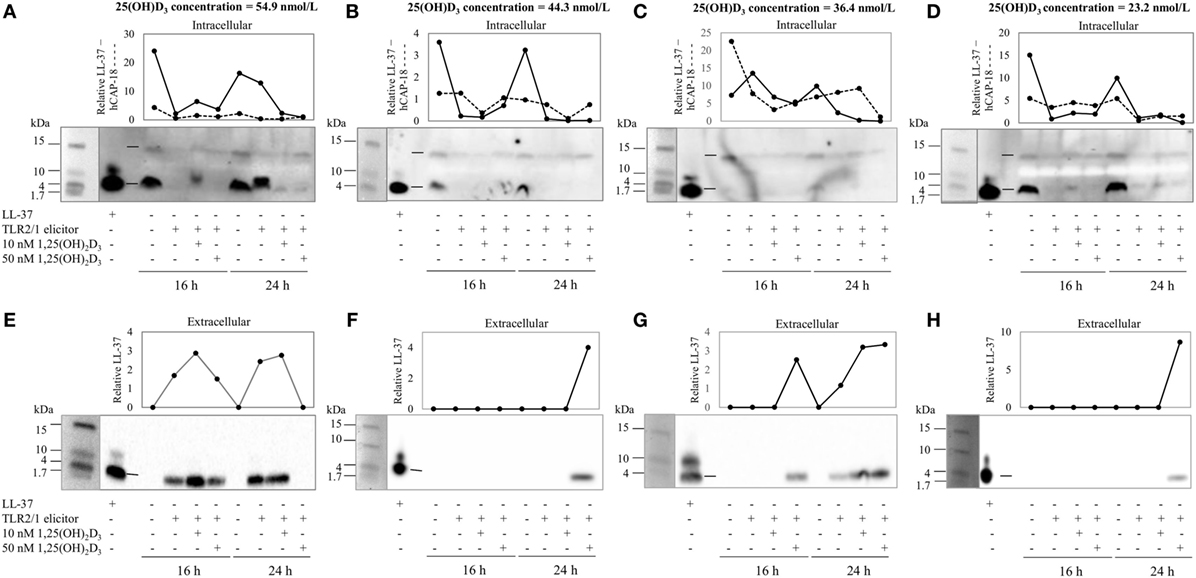
Figure 7. The rate of hCAP-18 processing and secretion is individual-specific and 1,25(OH)2D3-dependent. The Western blots and accompanying line graphs (densitometry results) show the relative levels of hCAP-18 (15 kDa) and LL-37 (4 kDa) in monocytes/macrophages [intracellular, (A–D)] and LL-37 secreted into culture media [extracellular, (E–H)] in response to toll-like receptor (TLR) 2/1 elicitation in the absence or presence 10 or 50 nM 1,25(OH)2D3 at 16 h and 24 h. Four individuals from a study of healthy South Africans (n = 20) are shown, representing Blacks and Whites of different 25(OH)D3 status [(A,E): 25(OH)D3 sufficient White; (B,F): 25(OH)D3-deficient White; (C,G): 25(OH)D3-deficient Black; and (D,H): 25(OH)D3-deficient Black]. Relative protein or peptide level in monocytes/macrophages or culture media (enriched for proteins < 50 kDa through ultrafiltration) was quantified and normalized to total protein loaded (dotted line, cathelin; solid line, LL-37). Single dashes on blots, between lanes for LL-37 standard and control sample, indicate the position of hCAP-18 (15 kDa), without signaling peptide (3 kDa, not detected), and LL-37 (4 kDa) cleaved from cathelin (11 kDa, not detected).
Correlation Analysis
To further explore the relation between independent variables (UVI, 25(OH)D3 concentration, age and regional methylation) and dependent functional variables, following different treatments, correlation analysis was performed (Table 3). UVI correlated moderately with circulating 25(OH)D3, which in turn showed a moderate, negative correlation with regional methylation of the VDR promoter CGI 1062. Regarding inter-CGI correlations, CGI 1066 and 1060b correlated negatively with CGI 1062, 1061, and 1060a. The significant correlation between 25(OH)D3 and methylation was maintained irrespective of season, with partial correlations controlling for seasonal changes in UVI yielding similar correlation coefficients (data not shown). Considering functional variables, regional methylation showed moderate correlation with VDR protein under certain treatments: CGI 1066 and 1060b (positive for all treatments but baseline); 1060a (negative for all treatments but baseline); 1062 and 1061 (negative for 1,25(OH)2D3 and/or TLR2/1 elicitor). As expected, each functional variable showed correlation between all treatments (not shown). In addition, VDR mRNA showed a number of moderate positive correlations with CAMP mRNA, across a number of treatments, similarly so, CAMP with CYP24A1 mRNA. Age showed a moderate negative correlation with hCAP-18 peptide with TLR2/1 elicitor + 1,25(OH)2D3 (r = −0.330, P < 0.01, n = 99).
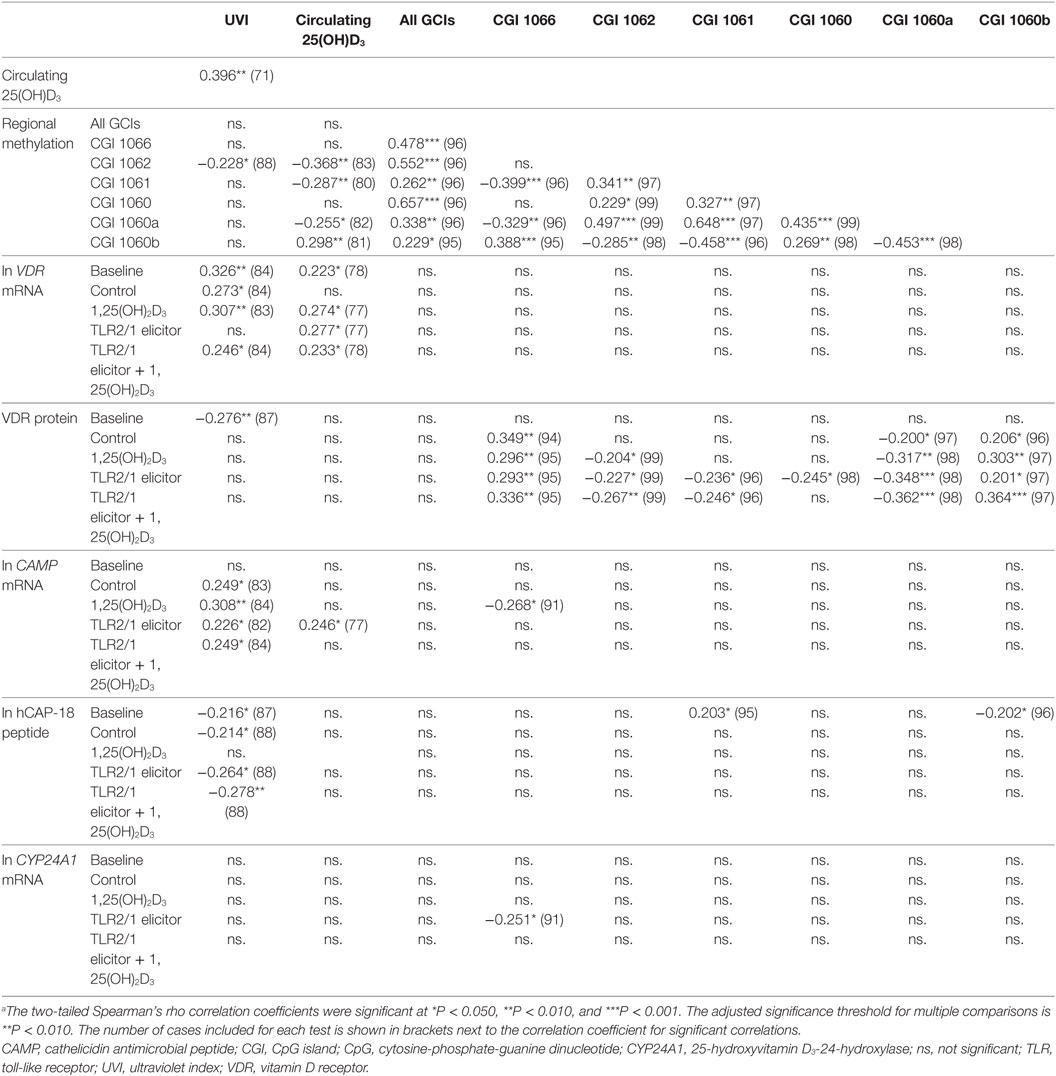
Table 3. Significant correlations between independent environmental variables [season (UVI), plasma 25(OH)D3 concentration] and dependent TLR2/1-VDR signaling variables, marking VDR expression (VDR mRNA, VDR protein) and function (CAMP mRNA, CYP24A1 mRNA, hCAP-18 protein)a.
The Combined Impact of Genetics, Epigenetics, and Environment on TLR2/1-VDR Signaling
To identify the main variables underlying differential levels of VDR and downstream targets (CAMP, hCAP-18, and CYP24A1), the multivariate OPLS-DA statistical method was performed and validated as described (Methods S1.3 in Supplementary Material). Evaluation of the loadings S-plots (Methods S1.3 and Figure S4 in Supplementary Material) and descriptive assessment of the scores space for each model, identified combined effects of genetics, VDR methylation, vitamin D status, and UVI on the efficacy of TLR2/1-VDR signaling, as assessed by the level of functional variables produced in response to various treatments. Functional variables were categorized as above/below average and X (independent) variables that significantly (P ≤ 0.050) and/or measurably (≥1.5-fold or ≤0.667) discriminate mean values for above/below average response were recorded with their correlation (Table 4). Methylation at CGI 1062, CpG 3 significantly and most notably discriminate mean values for above and below average VDR protein level, particularly with TLR2/1 elicitation. Other sizeable methylation–function interactions observed that were significant and occurred in at least two treatments of a functional variable included 1060 CpG 6 [positive impact on VDR mRNA with 1,25(OH)2D3 supplementation or TLR2/1 elicitation], 1062 CpG 23 (negative impact on hCAP-18 at control and elicitation, with or without supplementation), and CGI 1060a across several neighboring CpGs [1060 CpG 1-5, negative impact for 1,25(OH)2D3 supplementation, TLR2/1 elicitation or both, clustering by 25(OH)D3 status in the absence of supplement and by the TaqI VDR SNP with/without supplement]. Methylation at CGI 1066, CpG 1-6 also influenced VDR protein level positively following 1,25(OH)2D3 treatment, with or without TLR2/1 elicitor, showing clustering based on race and SNPs in VDR (BsmI, ApaI, and TaqI), TLR1 (I602S), and TIRAP (S180L), particularly in the presence of supplement. Compared to VDR protein, CAMP mRNA level was inversely impacted by CGI 1066, CpG 1-6 methylation, following 1,25(OH)2D3 treatment, while it clustered only based on 25(OH)D3 status and TaqI. Methylation of the CpG located at TaqI was the only methylation site with significant impact on VDR mRNA level following 1,25(OH)2D3 or TLR2/1 elicitor, but not both. Considering environmental factors, UVI and 25(OH)D3 significantly influenced VDR mRNA level following treatment with 1,25(OH)2D3, TLR2/1 elicitor, or both. VDR protein level at baseline and CAMP and CYP24A1 mRNA upon elicitation were significantly influenced by 25(OH)D3. 25(OH)D3 status and TaqI most consistently showed clustering during descriptive assessment of the scores space of computed models. Model construction for hCAP-18 was less favorable and we were unable to identify clustering. Clustering by season, although tested, was not observed.
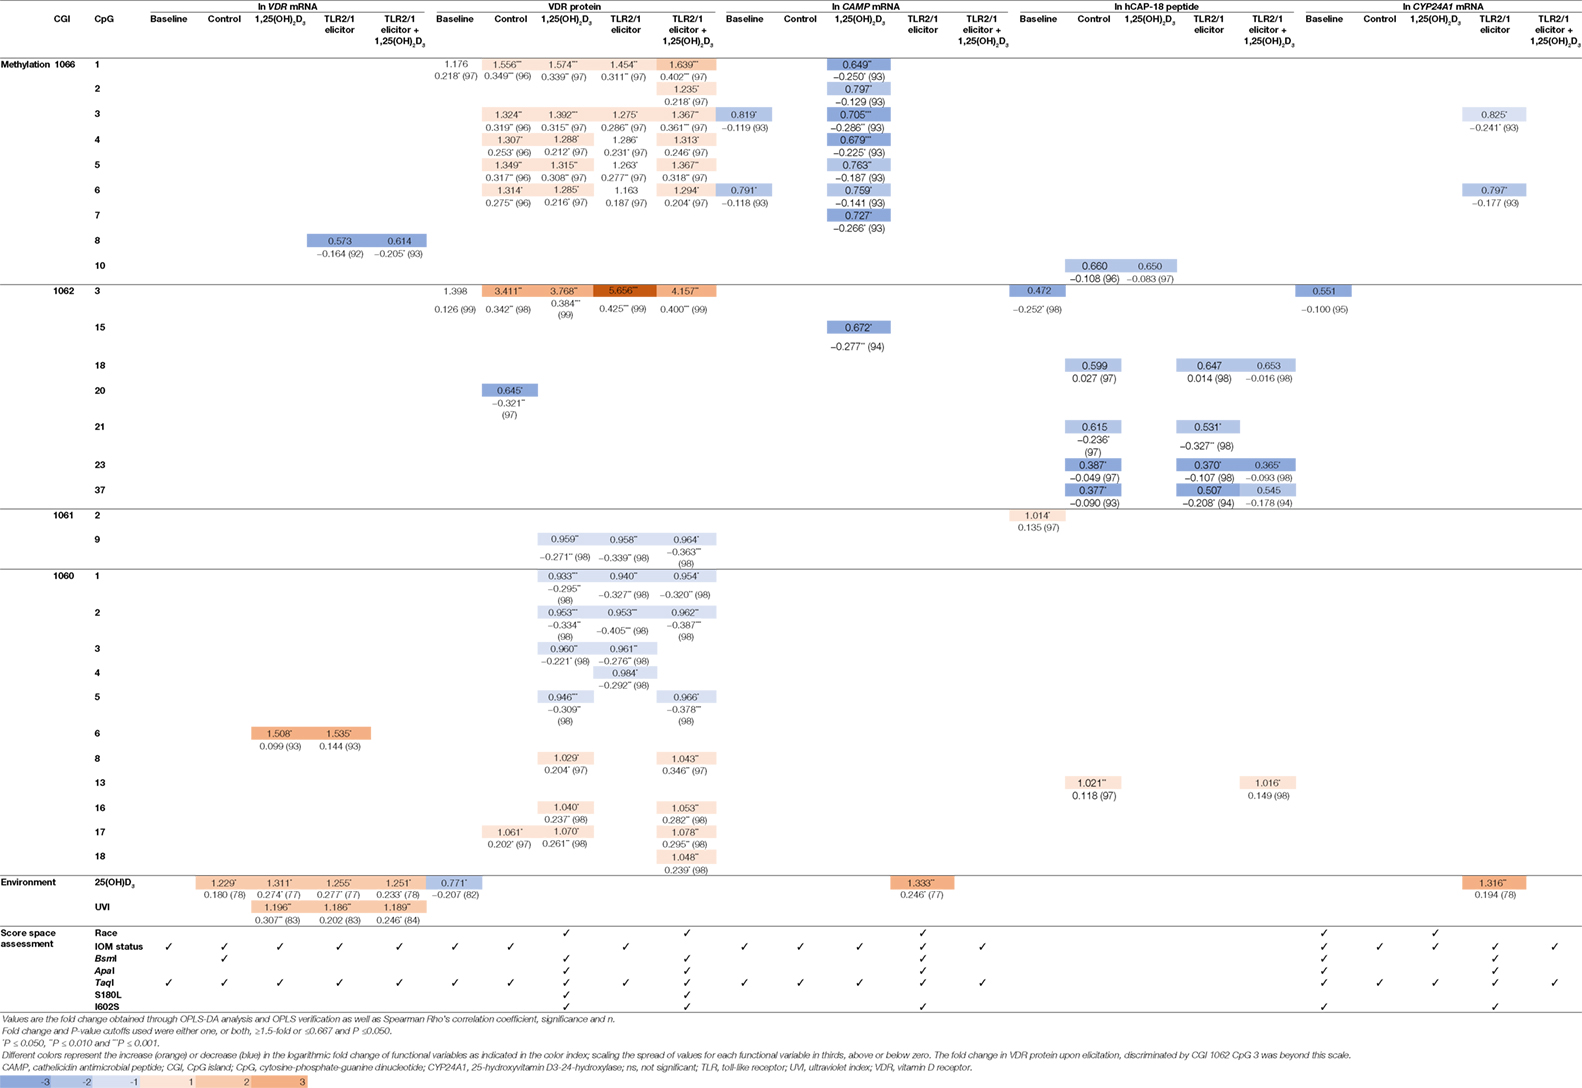
Table 4. Fold change (above/below average means) and correlation for functional variables, significantly and/or prominently, impacted by VDR methylation, 25(OH)D3, and UVI, together with population clustering, observed through score space assessment.
Discussion
Using a healthy South African cohort, we studied the combined effect of VDR methylation, TLR2/1-VDR pathway SNPs, and environment on TLR2/1 signaling and inter-individual variation in the response to vitamin D supplementation.
Results support race-related seasonal variation in 25(OH)D3 status (29), though, on average, Blacks were 25(OH)D3 deficient irrespective of season (Figure 1). Since TLR2/1-VDR signaling to induce CAMP greatly depends on the availability of 1,25(OH)2D3, Black South Africans may have an overall weaker immune response to bacterial pathogens and may benefit from vitamin D supplementation all year round. However, 25(OH)D3, season, and race showed complex interactions that influence TLR2/1-VDR signaling, rendering blanket supplementation presumptuous. For example, not all Blacks in the current study were 25(OH)D3 deficient (14% were sufficient). Western blotting of secreted LL-37 showed a decreased LL-37 secretion upon supplementation of 25(OH)D3 sufficient individuals (Figure 7), supporting the proposed U-shaped relationship between serum 25(OH)D3 and health (30).
As expected for regional methylation of expressed genes (31), VDR enhancer (1066) and promoter (1062) CGIs were hypomethylated, while the gene-body CGIs (1061 and 1060) were hypermethylated (Figure 2). Blacks had significantly higher methylation at CGI 1062 and CGI 1060a, but lower methylation at 1060b than Whites. The race-specific variation in methylation observed here agrees with Heyn et al. (32) and Adkins et al. (33) who independently showed genome-wide methylation differences between populations, contributing to natural variation. Similarly, Andraos et al. (34) showed significantly higher methylation levels in the Nigerian Yoruba population compared to European Caucasians at several CpG sites within VDR CGI 1060. CGI 1060 spans key features; the 5′ splice site for exon 9 (partly encoding the ligand binding domain for VDR), TaqI/CpG 6 embedded in a putative VDRE (35) and the promoter of an untranslated transcript (AK024830) for which the transcription start site is a few bp downstream of a miRNA-125b target site. Thus, differential methylation within this region of the VDR may have profound effects on the expression of VDR and subsequent efficacy of the TLR2/1-VDR signaling pathway. Indeed, we have previously shown ethnicity-dependent methylation of VDR CGI 1060 to distinguish tuberculosis cases from controls (34).
The significant correlation between VDR methylation and plasma 25(OH)D3 supports the proposed relationship between vitamin D and the epigenome (36–39). The inverse relationship between vitamin D and VDR methylation, especially at the primary promoter-spanning CGI 1062, suggests that in addition to the decrease in ligand, increased promoter methylation may be present in vitamin D-deficient individuals, further dampening the TLR2/1-VDR signal. Thus, vitamin D may interact with the epigenome to influence immune function. Indeed, the higher the methylation at CGI 1062 and 1060a, the less VDR protein is present in response to 1,25(OH)2D3 supplementation and/or TLR2/1 elicitation (Table 3).
Besides epigenetic differences, SNP frequency distribution for all, except VDR BsmI and TaqI, differed significantly between races with large effect sizes observed for GC rs7041, TLR1 A7202G, N248S and I602S, and VDR Cdx-2 (Table 1). Similar results were obtained for the 1000 Genomes Project’s YRI and CEU populations, except for TaqI and BsmI being significant, but not ApaI (Table S2 in Supplementary Material). These striking differences in frequency distribution of disease-associated or functionally relevant SNPs support the likelihood of inter-individual variation in TLR2/1-VDR signaling, response to vitamin D supplementation and immune function. For example, the two GC SNPs rs7041 and rs4588 create the three common Gc/DBP isoforms (Gc1F, Gc1S, and Gc2) showing significant geographical- and race-specific distribution patterns. The Gc1F alleles (rs7041: T allele, rs4588: C allele) are more common among African-Americans and Africans, while the Gc1S alleles (rs7041: G allele, rs4588: C allele) are more common among Europeans (40, 41). Gc1F and Gc1S have a stronger affinity for 25(OH)D compared to Gc2 (42), proposed to deliver 25(OH)D more efficiently to target tissues (43). Gc1F/Gc1F homozygotes have the lowest DBP level and Gc1S/Gc1S the highest, yet the bioavailable (unbound or free) 25(OH)D is similar between the isoforms (44). Thus, the efficacy of 25(OH)D3 delivery to target cells may be influenced by genetics and may contribute to the differential response to vitamin D supplementation.
The in vitro model used confirmed the induction of VDR by TLR2/1 elicitation (5) and ligand dependance of VDR transactivation of CAMP and CYP24A1 (Figure 3). Observed interactions, regarding race, season and 25(OH)D3 status (Figures 4–6) supported the observed correlation between UVI and 25(OH)D3 status (23), influencing gene expression and hCAP-18 processing; both processes seemingly hampered/delayed in Blacks or 25(OH)D3 deficient individuals. This was also observed for LL-37 secretion in Western blot findings (Figure 7). Significant down regulation of VDR protein in Whites in summer likely reflected negative auto-regulation (24) or UVI-mediated miR125b regulation (20–22).
The relation between VDR methylation and functional variables (Table 4) was best observed for VDR protein levels, with CpG sites across the enhancer (CGI 1066), promoter (CGI 1062), exon 3 (CGI 1061) and exon 9 (CGI 1060) showing power to discriminate individuals with above average VDR protein levels from those with below average levels. This supports, in part, the univariate correlation of regional methylation observed most commonly with VDR protein (Table 3). The significant, large discriminatory power of CGI 1062 CpG 3 in the primary promoter of VDR to distinguish a 5.7-fold above average mean VDR protein level upon elicitation, may relate to the colocation of a binding site for the E2F transcription factor 7, a member of the V$E2FF matrix family (Matrix Library 10.0, Genomatix 2016 (35)), implicated in negative regulation of DNA binding and transcription (45). Comparing the V$E2FF matrix to the sequence around CGI 1062 CpG 3, showed a matrix and core similarity of 1 and 0.875, respectively, with high conservation across the CpG 3 cytosine-guanine dinucleotide that forms part of the matrix core. Notably, a CpG-ruinous SNPs (C/G) in the second position of the dinucleotide, unique to Africans (5% “C,” 1000 Genomes Browser), have been reported. The positive correlation between VDR protein level and methylation at CGI 1062 CpG 3 may support methylation-sensitive suppressor activity, alleviated by DNA methylation. The positive impact of CGI 1060 CpG 6 methylation, possible only when TaqI is “C,” seen for VDR mRNA with supplementation or elicitation, support a TB case control finding from our laboratory showing concomitant decreased methylation of CGI 1060a associating with protection from TB (34) and correlating with increased VDR levels in the current study (Table 3). The prominence of TaqI-based clustering across all variables and treatments, except for hCAP-18, further confirms the importance of this SNP, commonly found associated with diverse diseases and first reported to be associated with infectious disease by Bellamy et al. (46). Pam3CSK4 is a strong activator of NF-κB1 (47) and the negative impact of methylation at 1062 CpG 23 on hCAP-18 may relate to its location adjacent to an NF-κB1 and SP-1 binding site in the primary promoter of VDR.
Overall, it appears that individuals who respond with an above average level of VDR protein upon TLR2/1 elicitation display hypermethylation at CGI 1066 CpG 1 and 3, as well as at CGI 1062 CpG 3, while displaying hypomethylation at CGI 1061 CpG 9 and CGI 1060a CpG 1-4 (Figure 8). While the VDR SNP TaqI and 25(OH)D3 influenced the variation within the study population with elicitation, without 1,25(OH)2D3 supplementation, 25(OH)D3 status was no longer identified as a contributing factor upon 1,25(OH)2D3 supplementation. Moreover, the effect of several SNPs became apparent only in the presence 1,25(OH)2D3 supplementation. This suggests that 25(OH)D3 status may have a larger effect on TLR2/1, VDR-mediated signaling than these genetic variables.
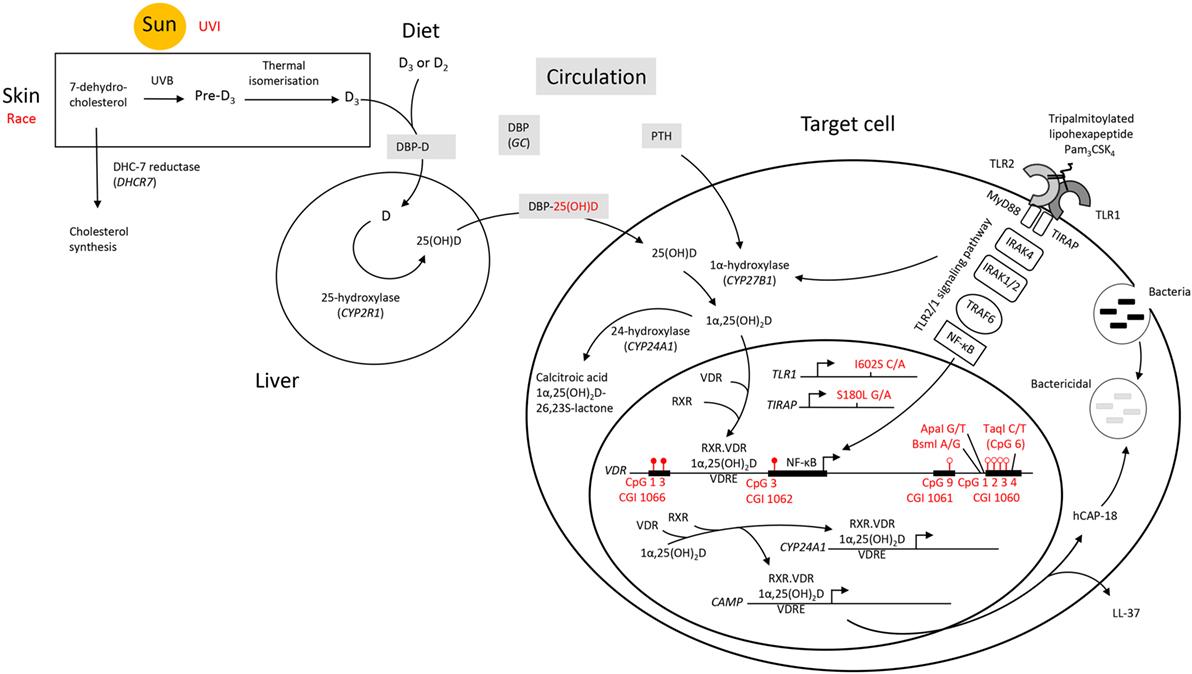
Figure 8. A schematic diagram summarizing factors influencing the signaling efficacy of the TLR2/1-VDR pathway in response to TLR2/1 elicitation. Pam3CSK4 (Pam3CysSerLys4), a synthetic tripalmitoylated lipopeptide, mimics the acylated amino terminus of bacterial lipoproteins and is recognized by TLR2, cooperating with TLR1 to induce signaling that activates the pro-inflammatory transcription factor NF-κB, inducing CYP27B1 and VDR. Factors found to influence VDR expression are indicated in red. UVI correlated with 25(OH)D3, known to autoregulate VDR. Individuals who responded with an above average level of VDR protein upon TLR2/1 elicitation were hypermethylated at CGI 1066 (CpG 1 and 3) and CGI 1062 (CpG 3), while hypomethylated at CGI 1061 (CpG 9) and CGI 1060 (CpG 1–4). With in vitro 1,25(OH)2D3 supplementation CGI 1062 CpG 3 was slightly less discriminatory upon TLR2/1 elicitation, but remained a significant variable to discriminate above/below average VDR protein level. However, with supplementation the population clustered by race and all genetic variants indicated (TLR1 SNP I602S, TIRAP SNP S180L, and VDR SNPs BsmI, ApaI, and TaqI, see Table 4), compared to clustering by vitamin D status and TaqI alone, without supplementation. Methylation at CpG 6 of CGI 1060 (dictated by TaqI, with which it overlaps) together with UVI and circulating 25(OH)D3, significantly discriminated a 1.2-1.5-fold change in VDR mRNA with supplement or elicitation. Abbreviations: CAMP, cathelicidin antimicrobial peptide; CGI, CpG island; CpG, cytosine-phosphate-guanine dinucleotide; CYP, cytochrome P-450 enzyme; CYP24A1, 25-hydroxyvitamin D3-24-hydroxylase; D2, ergocalciferol; D3, cholecalciferol; DBP, vitamin D binding protein; GC, group component or gene encoding DBP; hCAP-18, human cathelicidin antimicrobial peptide 18; LL-37, cathelicidin antimicrobial peptide fragment; 1,25(OH)2D3 1,25-dihydroxycholecalciferol; 25(OH)D3, 25-hydroxycholecalciferol; NF-κB, nuclear factor kappa B; Pam3CSK4, synthetic tripalmitoylated lipohexapeptide, PTH parathyroid hormone; RXR retinoid X receptor; TIRAP, TIR, toll-interleukin 1 receptor domain-containing adaptor protein; TLR, toll-like receptor; UVB, ultraviolet B rays; UVI, ultraviolet index; VDR, vitamin D receptor gene; VDR, vitamin D receptor protein; VDRE, vitamin D receptor element.
Taken together, results presented here provide support for multifactorial regulation of VDR-mediated TLR2/1 signaling, involving interaction between environment, epigenetics, and genetics. UVI influences 25(OH)D3 status, which regulates VDR expression through VDR methylation, while enhancing the extent and rate of VDR transactivation of CAMP encoding the antimicrobial peptide hCAP-18. The complex interaction between these factors may shed further light on the disparity in infectious diseases across the globe.
Ethics Statement
In accordance with the Declaration of Helsinki, ethical clearance was obtained from the South African National Blood Service (SANBS) and the Faculty of Science, University of Johannesburg. After informed consent, the SANBS collected blood from randomly selected healthy Black (n = 50; age 17–62 years; 25 males and 25 females) and White (n = 50; age 17–69; 25 males and 25 females) South Africans living in Gauteng, SA.
Author Contributions
LB designed the study; VM, DS, FA, and TJ acquired the data; VM, FT, and LB analyzed the data; VM and LB wrote the manuscript; DS, FA, TJ, and FT revised the manuscript; and all authors approved the final version to be published and agree to be accountable for all aspects of the work.
Conflict of Interest Statement
The authors declare that the research was conducted in the absence of any commercial or financial relationships that could be construed as a potential conflict of interest.
Acknowledgments
We thank Dr. Caradee Wright, South African Medical Research Council and Mr. Gerrie Coetzee, South African Weather Service for UVI data. We thank Mr. B. R. Jones and Dr. Abhimanyu for contributing to sample collection for Western Blot analysis and Dr. H.-A. Byth-Illing for helpful discussions on manuscript preparation.
Funding
The authors declare no conflict of interest. The work was funded by grants to LB; the National Research foundation of South Africa (NRF, Grant No. 81774) and Cancer Association of South Africa (CANSA).
Supplementary Material
The Supplementary Material for this article can be found online at http://journal.frontiersin.org/article/10.3389/fimmu.2017.01048/full#supplementary-material.
Abbreviations
CAMP, cathelicidin antimicrobial peptide; CGI, CpG island; CpG, Cytosine-phosphate-guanine dinucleotide; CYP cytochrome P-450 enzyme; CYP24A1, 25-hydroxyvitamin D3-24-hydroxylase; DBP, vitamin D-binding protein; GC, group-specific component; hCAP-18, human cathelicidin antimicrobial peptide 18 kDa; IOM, Institute of Medicine; LL-37, cathelicidin antimicrobial peptide fragment; 1,25(OH)2D3, 1,25-dihydroxycholecalciferol; 25(OH)D3, 25-hydroxycholecalciferol; NF-κB, nuclear factor kappa B; OPLS-DA, Orthogonal projections to latent structures discriminant analysis; Pam3CSK4, synthetic triacylated lipopeptide; N-palmitoyl-S-[2,3-bis(palmitoyloxy)-(2RS)-propyl]-[R]-cysteinyl-[S]-seryl-[S]-lysyl-[S]-lysyl-[S]-lysyl-[S]-lysyl × 3HCL; SANBS, South African National Blood Service; SNP, single-nucleotide polymorphism; TiRAP, toll-interleukin 1 receptor (TIR) domain-containing adaptor protein; TLR, toll-like receptor; UVB, ultraviolet B rays; UVI, ultraviolet index; VDR, vitamin D receptor.
References
1. Baeke F, Takiishi T, Korf H, Gysemans C, Mathieu C. Vitamin D: modulator of the immune system. Curr Opin Pharmacol (2010) 10:482–96. doi:10.1016/j.coph.2010.04.001
2. Haussler MR, Whitfield GK, Kaneko I, Haussler CA, Hsieh D, Hsieh J-C, et al. Molecular mechanisms of vitamin D action. Calcif Tissue Int (2013) 92:77–98. doi:10.1007/s00223-012-9619-0
3. Ramagopalan SV, Heger A, Berlanga AJ, Maugeri NJ, Lincoln MR, Burrell A, et al. A ChIP-seq defined genome-wide map of vitamin D receptor binding: associations with disease and evolution. Genome Res (2010) 20:1352–60. doi:10.1101/gr.107920.110
4. Seuter S, Neme A, Carlberg C. Epigenome-wide effects of vitamin D and their impact on the transcriptome of human monocytes involve CTCF. Nucleic Acids Res (2016) 44:4090–104. doi:10.1093/nar/gkv1519
5. Liu PT, Stenger S, Li H, Wenzel L, Tan BH, Krutzik SR, et al. Toll-like receptor triggering of a vitamin D-mediated human antimicrobial response. Science (2006) 311:1770–3. doi:10.1126/science.1123933
6. Vandamme D, Landuyt B, Luyten W, Schoofs L. A comprehensive summary of LL-37, the factotum human cathelicidin peptide. Cell Immunol (2012) 280:22–35. doi:10.1016/j.cellimm.2012.11.009
7. Zaiou M, Nizet V, Gallo RL. Antimicrobial and protease inhibitory functions of the human cathelicidin (hCAP18/LL-37) prosequence. J Invest Dermatol (2003) 120:810–6. doi:10.1046/j.1523-1747.2003.12132.x
8. Lai Y, Gallo RL. AMPed up immunity: how antimicrobial peptides have multiple roles in immune defense. Trends Immunol (2009) 30:131–41. doi:10.1016/j.it.2008.12.003
9. Ordonez SR, Amarullah IH, Wubbolts RW, Veldhuizen EJA, Haagsman HP. Fungicidal mechanisms of cathelicidins LL-37 and CATH-2 revealed by live-cell imaging. Antimicrob Agents Chemother (2014) 58:2240–8. doi:10.1128/AAC.01670-13
10. Bergman P, Walter-Jallow L, Broliden K, Agerberth B, Söderlund J. The antimicrobial peptide LL-37 inhibits HIV-1 replication. Curr HIV Res (2007) 5:410–5. doi:10.2174/157016207781023947
11. Abhimanyu, Meyer V, Jeffery TJ, Bornman L. Vitamin D status in South Africa and tuberculosis. Lung (2015) 193:975–84. doi:10.1007/s00408-015-9789-4
12. Upala S, Sanguankeo A, Permpalung N. Significant association between vitamin D deficiency and sepsis: a systematic review and meta-analysis. BMC Anesthesiol (2015) 15:84. doi:10.1186/s12871-015-0063-3
13. Park Y-J, Kim S-U, Lee K-H, Lee J-H, Kwon E, Jung H-Y, et al. Vitamin D deficiency is associated with increased risk of bacterial infections after kidney transplantation. Korean J Intern Med (2017) 32:505–13. doi:10.3904/kjim.2015.214
14. Lake JE, Adams JS. Vitamin D in HIV-infected patients. Curr HIV/AIDS Rep (2011) 8:133–41. doi:10.1007/s11904-011-0082-8
15. Seuter S, Virtanen JK, Nurmi T, Pihlajamäki J, Mursu J, Voutilainen S, et al. Molecular evaluation of vitamin D responsiveness of healthy young adults. J Steroid Biochem Mol Biol (2016). doi:10.1016/j.jsbmb.2016.06.003
16. Saccone D, Asani F, Bornman L. Regulation of the vitamin D receptor gene by environment, genetics and epigenetics. Gene (2015) 561:171–80. doi:10.1016/j.gene.2015.02.024
17. O Neill V, Asani FF, Jeffery TJ, Saccone DS, Bornman L. Vitamin D receptor gene expression and function in a South African population: ethnicity, vitamin D and FokI. PLoS One (2013) 8:e67663. doi:10.1371/journal.pone.0067663
18. Marik R, Fackler M, Gabrielson E, Zeiger MA, Sukumar S, Stearns V, et al. DNA methylation-related vitamin D receptor insensitivity in breast cancer. Cancer Biol Ther (2010) 10:44–53. doi:10.4161/cbt.10.1.11994
19. Martineau AR, Timms PM, Bothamley GH, Hanifa Y, Islam K, Claxton AP, et al. High-dose vitamin D(3) during intensive-phase antimicrobial treatment of pulmonary tuberculosis: a double-blind randomised controlled trial. Lancet Lond Engl (2011) 377:242–50. doi:10.1016/S0140-6736(10)61889-2
20. Gu X, Nylander E, Coates PJ, Nylander K. Effect of narrow-band ultraviolet B phototherapy on p63 and microRNA (miR-21 and miR-125b) expression in psoriatic epidermis. Acta Derm Venereol (2011) 91:392–7. doi:10.2340/00015555-1086
21. Essa S, Reichrath S, Mahlknecht U, Montenarh M, Vogt T, Reichrath J. Signature of VDR miRNAs and epigenetic modulation of vitamin D signaling in melanoma cell lines. Anticancer Res (2012) 32(1):383–9.
22. Mohri T, Nakajima M, Takagi S, Komagata S, Yokoi T. MicroRNA regulates human vitamin D receptor. Int J Cancer (2009) 125:1328–33. doi:10.1002/ijc.24459
23. Klingberg E, Oleröd G, Konar J, Petzold M, Hammarsten O. Seasonal variations in serum 25-hydroxy vitamin D levels in a Swedish cohort. Endocrine (2015) 49:800–8. doi:10.1007/s12020-015-0548-3
24. Zella LA, Meyer MB, Nerenz RD, Lee SM, Martowicz ML, Pike JW. Multifunctional enhancers regulate mouse and human vitamin D receptor gene transcription. Mol Endocrinol (2010) 24:128–47. doi:10.1210/me.2009-0140
25. Sharma G, Sowpati DT, Singh P, Khan MZ, Ganji R, Upadhyay S, et al. Genome-wide non-CpG methylation of the host genome during M. tuberculosis infection. Sci Rep (2016) 6:25006. doi:10.1038/srep25006
26. Zheng L, Leung ETY, Wong HK, Lui G, Lee N, To K-F, et al. Unraveling methylation changes of host macrophages in Mycobacterium tuberculosis infection. Tuberc Edinb Scotl (2016) 98:139–48. doi:10.1016/j.tube.2016.03.003
27. Lips P. Vitamin D status and nutrition in Europe and Asia. J Steroid Biochem Mol Biol (2007) 103:620–5. doi:10.1016/j.jsbmb.2006.12.076
28. Ross AC, Manson JE, Abrams SA, Aloia JF, Brannon PM, Clinton SK, et al. The 2011 report on dietary reference intakes for calcium and vitamin D from the Institute of Medicine: what clinicians need to know. J Clin Endocrinol Metab (2011) 96:53–8. doi:10.1210/jc.2010-2704
29. Coussens AK, Naude CE, Goliath R, Chaplin G, Wilkinson RJ, Jablonski NG. High-dose vitamin D3 reduces deficiency caused by low UVB exposure and limits HIV-1 replication in urban Southern Africans. Proc Natl Acad Sci U S A (2015) 112:8052–7. doi:10.1073/pnas.1500909112
30. Amrein K, Quraishi SA, Litonjua AA, Gibbons FK, Pieber TR, Camargo CA, et al. Evidence for a U-shaped relationship between prehospital vitamin D status and mortality: a cohort study. J Clin Endocrinol Metab (2014) 99:1461–9. doi:10.1210/jc.2013-3481
31. Ndlovu MN, Denis H, Fuks F. Exposing the DNA methylome iceberg. Trends Biochem Sci (2011) 36:381–7. doi:10.1016/j.tibs.2011.03.002
32. Heyn H, Moran S, Hernando-Herraez I, Sayols S, Gomez A, Sandoval J, et al. DNA methylation contributes to natural human variation. Genome Res (2013) 23:1363–72. doi:10.1101/gr.154187.112
33. Adkins RM, Krushkal J, Tylavsky FA, Thomas F. Racial differences in gene-specific DNA methylation levels are present at birth. Birth Defects Res A Clin Mol Teratol (2011) 91:728–36. doi:10.1002/bdra.20770
34. Andraos C, Koorsen G, Knight JC, Bornman L. Vitamin D receptor gene methylation is associated with ethnicity, tuberculosis, and TaqI polymorphism. Hum Immunol (2011) 72:262–8. doi:10.1016/j.humimm.2010.12.010
35. Cartharius K, Frech K, Grote K, Klocke B, Haltmeier M, Klingenhoff A, et al. MatInspector and beyond: promoter analysis based on transcription factor binding sites. Bioinformatics (2005) 21:2933–42. doi:10.1093/bioinformatics/bti473
36. Fetahu IS, Höbaus J, Kállay E. Vitamin D and the epigenome. Front Physiol (2014) 5:164. doi:10.3389/fphys.2014.00164
37. Rawson JB, Sun Z, Dicks E, Daftary D, Parfrey PS, Green RC, et al. Vitamin D intake is negatively associated with promoter methylation of the Wnt antagonist gene DKK1 in a large group of colorectal cancer patients. Nutr Cancer (2012) 64:919–28. doi:10.1080/01635581.2012.711418
38. Tapp HS, Commane DM, Bradburn DM, Arasaradnam R, Mathers JC, Johnson IT, et al. Nutritional factors and gender influence age-related DNA methylation in the human rectal mucosa. Aging Cell (2013) 12:148–55. doi:10.1111/acel.12030
39. Zhu H, Bhagatwala J, Huang Y, Pollock NK, Parikh S, Raed A, et al. Race/ethnicity-specific association of vitamin D and global DNA methylation: cross-sectional and interventional findings. PLoS One (2016) 11:e0152849. doi:10.1371/journal.pone.0152849
40. McGrath JJ, Saha S, Burne THJ, Eyles DW. A systematic review of the association between common single nucleotide polymorphisms and 25-hydroxyvitamin D concentrations. J Steroid Biochem Mol Biol (2010) 121:471–7. doi:10.1016/j.jsbmb.2010.03.073
41. Speeckaert M, Huang G, Delanghe JR, Taes YEC. Biological and clinical aspects of the vitamin D binding protein (Gc-globulin) and its polymorphism. Clin Chim Acta (2006) 372:33–42. doi:10.1016/j.cca.2006.03.011
42. Arnaud J, Constans J. Affinity differences for vitamin D metabolites associated with the genetic isoforms of the human serum carrier protein (DBP). Hum Genet (1993) 92:183–8. doi:10.1007/BF00219689
43. Lauridsen AL, Vestergaard P, Hermann AP, Brot C, Heickendorff L, Mosekilde L, et al. Plasma concentrations of 25-hydroxy-vitamin D and 1,25-dihydroxy-vitamin D are related to the phenotype of Gc (vitamin D-binding protein): a cross-sectional study on 595 early postmenopausal women. Calcif Tissue Int (2005) 77:15–22. doi:10.1007/s00223-004-0227-5
44. Powe CE, Evans MK, Wenger J, Zonderman AB, Berg AH, Nalls M, et al. Vitamin D-binding protein and vitamin D status of black Americans and white Americans. N Engl J Med (2013) 369:1991–2000. doi:10.1056/NEJMoa1306357
45. Westendorp B, Mokry M, Groot Koerkamp MJA, Holstege FCP, Cuppen E, de Bruin A. E2F7 represses a network of oscillating cell cycle genes to control S-phase progression. Nucleic Acids Res (2012) 40:3511–23. doi:10.1093/nar/gkr1203
46. Bellamy R, Ruwende C, Corrah T, McAdam KP, Thursz M, Whittle HC, et al. Tuberculosis and chronic hepatitis B virus infection in Africans and variation in the vitamin D receptor gene. J Infect Dis (1999) 179:721–4. doi:10.1086/314614
Keywords: VDR, DNA methylation, TLR2/1, Vitamin D, polymorphism, cathelicidin, race, UVI
Citation: Meyer V, Saccone DS, Tugizimana F, Asani FF, Jeffery TJ and Bornman L (2017) Methylation of the Vitamin D Receptor (VDR) Gene, Together with Genetic Variation, Race, and Environment Influence the Signaling Efficacy of the Toll-Like Receptor 2/1-VDR Pathway. Front. Immunol. 8:1048. doi: 10.3389/fimmu.2017.01048
Received: 07 April 2017; Accepted: 14 August 2017;
Published: 11 September 2017
Edited by:
Jagadeesh Bayry, Institut national de la santé et de la recherche médicale, FranceReviewed by:
Bernhard Ryffel, Centre national de la recherche scientifique (CNRS), FranceIrene Garcia, Université de Genève, Switzerland
Copyright: © 2017 Meyer, Saccone, Tugizimana, Asani, Jeffery and Bornman. This is an open-access article distributed under the terms of the Creative Commons Attribution License (CC BY). The use, distribution or reproduction in other forums is permitted, provided the original author(s) or licensor are credited and that the original publication in this journal is cited, in accordance with accepted academic practice. No use, distribution or reproduction is permitted which does not comply with these terms.
*Correspondence: Liza Bornman, bGl6YWJAdWouYWMuemE=