 Georgina Gyetvai
 Trisha Hughes
 Florence Wedmore
 Cieron Roe
 Lamia Heikal
 Pietro Ghezzi
 Manuela Mengozzi
- Department of Clinical and Experimental Medicine, Brighton and Sussex Medical School, Brighton, United Kingdom
Several studies have shown that erythropoietin (EPO) has neuroprotective or neuroreparative actions on diseases of the nervous system and that improves oligodendrocyte (OL) differentiation and myelination in vivo and in vitro. This study aims at investigating the early molecular mechanisms for the pro-myelinating action of EPO at the gene expression level. For this purpose, we used a differentiating OL precursor cell line, rat central glia-4 cells. Cells were differentiated or not, and then treated with EPO for 1 or 20 h. RNA was extracted and changes in the gene expression profile were assessed using microarray analysis. Experiments were performed in biological replicates of n = 4. Differentiation alone changed the expression of 11% of transcripts (2,663 out of 24,272), representing 2,436 genes, half of which were upregulated and half downregulated. At 20 h of treatment, EPO significantly affected the expression of 99 genes that were already regulated by differentiation and of 150 genes that were not influenced by differentiation alone. Analysis of the transcripts most upregulated by EPO identified several genes involved in lipid transport (e.g., Cd36) and lipid metabolism (Ppargc1a/Pgc1alpha, Lpin1, Pnlip, Lpin2, Ppard, Plin2) along with Igf1 and Igf2, growth factors known for their pro-myelinating action. All these genes were only induced by EPO and not by differentiation alone, except for Pnlip which was highly induced by differentiation and augmented by EPO. Results were validated by quantitative PCR. These findings suggest that EPO might increase remyelination by inducing insulin-like growth factors and increasing lipid metabolism.
Introduction
Myelination is essential for the proper functioning of the central nervous system (CNS). Oligodendrocyte (OL) damage and remyelination failure cause progressive neurological disability in chronic demyelinating diseases, including multiple sclerosis (MS), and also play a role in the pathogenesis of other neurological diseases, such as stroke, amyotrophic lateral sclerosis, and Alzheimer’s disease (1, 2).
Myelination occurs in development and continues postnatally. OL progenitor cells (OPCs) are present in the adult CNS; upon OL injury, OPCs contribute to OL regeneration and remyelination. However, in demyelinating diseases endogenous remyelination is insufficient to re-establish motor and cognitive performance. Absence of remyelination is often due to the inability of OPCs to differentiate and mature to produce myelin. Therapeutic agents that can stimulate OPCs to differentiate and remyelinate axons could improve neurological functions and clinical outcome in many pathologies (3, 4).
Erythropoietin (EPO) has neuroprotective and neuroreparative actions in many models of disease and injury of the nervous system (5); although recent evidence points to the role of the EPOR/CD131 heteromeric receptor in mediating EPO reparative functions (6), EPO can act also through the classical EPOR homodimer (7, 8). EPO induces neurogenesis and oligodendrogenesis (9, 10); it preserves myelin and increases myelin basic protein (MBP) expression in experimental models of demyelination and in white matter injury (11, 12). EPO increases the differentiation of OL precursors and the maturation of late stage OLs in vitro and in vivo (8, 10, 13).
Understanding the mechanism by which EPO acts on OLs might help identify therapeutic targets for remyelination.
The mechanisms that mediate differentiation and maturation of OLs are not completely understood. Studies have been hampered by the limited availability of high numbers of primary OPCs. Central Glia-4 (CG4) cells, an OL precursor permanent cell line derived from rat brain, can remyelinate axons in vivo (14). In vitro, in the absence of mitogens and serum, CG4 cells differentiate into MBP-expressing OLs within 48 h; then myelin oligodendrocyte glycoprotein (MOG), a marker of myelin deposition, is produced (15, 16). Therefore, CG4 are considered a good in vitro model of CNS myelination (17). We recently found that EPO increases myelin gene expression in differentiating CG4 cells; EPO promoted differentiation of OPCs into MBP- and MOG-positive OLs (8).
The aim of this study was to investigate the mechanisms mediating the pro-myelinating effects of EPO on CG4 cells. To this purpose, we analyzed the changes in the gene expression profile induced by EPO in differentiating cells at two time points, 1 and 20 h after EPO treatment, focusing on the transcriptional changes occurring during the OPC to OL transition. The results highlight an inducing effect of EPO on genes previously known to play a role in myelination, such as insulin-like growth factor-1 (Igf1), Igf2, protein tyrosine phosphatase receptor type E (Ptpre), as well as genes involved in lipid transport and metabolism, including fatty acid translocase (Fat/Cd36), peroxisome proliferator-activated receptor-gamma coactivator (Ppargc1a/Pgc1alpha), and pancreatic lipase (Pnlip) (18–24).
Materials and Methods
Cell Culture
The wild-type CG4 cell line, a rat OL precursor cell line originally obtained from primary cultures of bipotential oligodendrocyte-type-2-astrocytes (O-2A), was kindly donated by Huseyin Mehmet, Imperial College, London. CG4 cells, as primary O-2A cells, can differentiate into mature OLs by withdrawal of growth factors (bFGF and PDGF) and of B104 mitogens, or into astrocytes by addition of 20% fetal calf serum. Undifferentiated cells are bipolar; after 2 days of differentiation they acquire about 90% of multipolar morphology. Differentiated CG4 cells express myelin proteins, including MBP and MOG (15–17).
CG4 cells overexpressing EPOR (CG4-EPOR) were generated as reported in our previous study (8). Briefly, CG4-EPOR cells were obtained by transduction of CG4 cells with the mouse EPOR gene in a constitutive lentiviral vector, modified to include the V5 epitope, the mouse encephalomyocarditis internal ribosome entry site (IRES) and the enhanced green fluorescent protein (EGFP) reporter. The expression of recombinant V5-tagged EPOR in transduced CG4 cells was verified by measuring by flow cytometry the EGFP reporter expression, and by immunoblotting with the anti-V5-tag mouse monoclonal antibody (Invitrogen), as described (8, 25).
CG4-EPOR cells were seeded in poly-l-ornithine-coated 6-well plates (320,000 cells in 4 ml GM per well). They were maintained at the precursor stage by culture in growth medium (GM), consisting of Dulbecco’s modified Eagle medium (DMEM) (Sigma-Aldrich) supplemented with biotin (10 ng/ml), bFGF (5 ng/ml), PDGF (1 ng/ml), N1 supplement (all from Sigma-Aldrich), and 30% B104-conditioned medium, obtained as previously reported (8). After overnight culture, the cells were induced to differentiate into OLs by switching to differentiation medium (DM), consisting of DMEM-F12 (Invitrogen) supplemented with progesterone (3 ng/ml), putrescine (5 µg/ml), sodium selenite (4 ng/ml), insulin (12.5 µg/ml), transferrin (50 µg/ml), biotin (10 ng/ml), thyroxine (0.4 µg/ml), and glucose (3 g/l) (all from Sigma-Aldrich), as reported (8). After 3 h, some of the cells were treated with recombinant human erythropoietin (rhEPO; Creative Dynamics) at 10 ng/ml and cultured for 1 or 20 h prior to RNA extraction. There is extensive biological cross-reactivity between human EPO and the EPOs of other mammals. Human EPO is approximately 80% homologous to rodent EPO, and it has been shown to be biologically active in rodents for erythropoietic and neurotrophic functions (26, 27). Undifferentiated cells were seeded as above and cultured in GM without switching to DM for the whole length of the experiment.
To measure ERK1/2 phosphorylation by western blot, cells were plated in poly-ornithine coated 24 well plates at 200,000/well in GM for 24 h, then switched to DM and incubated overnight to starve them of growth factors present in GM. Cells were then preincubated with PD184352 (Cell Signaling, #12147) or DMSO for 1 h, then treated with or without EPO at 10 ng/ml for the indicated times. PD184352 was dissolved in DMSO at 25 mg/ml and then diluted in DM at the indicated concentrations.
RNA Extraction
Each sample was lysed with 1 ml QIAzol (QIAGEN). Total RNA was extracted by using the miRNeasy system and protocol (QIAGEN). RNA purity and integrity were determined using a NanoDrop ND-1000 (NanoDrop Technologies) and an Agilent 2100 Bioanalyzer (Agilent Technologies). All samples had a A260/A280 ratio >1.8 and RNA Integrity Number >9.
Microarrays
All experimental conditions were performed in quadruplicate; undifferentiated cells were cultured in quadruplicate but only three random samples were used for microarray analysis and all of the four samples for quantitative PCR (qPCR) validation. In total, 19 arrays were completed: 3 undifferentiated (und) and 16 differentiated: 4 differentiated (ctr) and 4 differentiated + EPO (EPO) at each time point (4 and 23 h of differentiation; 1 and 20 h after EPO treatment, respectively).
RNA was amplified, labeled, and hybridized onto Single Color SurePrint G3 Rat GE 8 × 60K Microarrays (AMADID:028279; Agilent) at Oxford Gene Technology, Oxford, UK. Following hybridization, the arrays were scanned to derive the array images. Feature extraction software v10.7.3.1 was used to generate the array data from the images.
Microarray Data Analysis
Raw data in standard format from the microarray experiment have been deposited in the Gene Expression Omnibus (GEO) database of NCBI (28) and are accessible through GEO Series accession number GSE84687.1 Raw data were normalized and analyzed using GeneSpring (Agilent) and Excel software. Transcript expression levels between the experimental groups were compared by Student’s t-test done on the log2 of the gProcessed Signal, obtaining uncorrected p-values. Subsequent multiple comparison corrections were performed using the Benjamini-Hochberg False Discovery Rate procedure, obtaining adjusted p-values. Fold change in the expression was calculated as the ratio between the average of the gProcessed Signals of the various groups and expressed as log2. Differences in expression with an adjusted p-value < 0.05 and an absolute fold change ≥ 1.5 (log2 fold change ≥ 0.58) were considered statistically significant. Functional annotation and biological term enrichment was done using the Database for Annotation, Visualization, and Integrated Discovery (DAVID)2 (29). DAVID calculates a modified Fisher’s exact p-value to demonstrate enrichment. Categories with p-value < 0.05 were considered significantly enriched.
Microarray Data Validation by RT-qPCR
Reverse transcription (RT) and real-time qPCR were carried out as reported (30) on total RNA from quadruplicate samples, using TaqMan® gene expression assays (Applied Biosystems/Life Technologies) and Brilliant III qPCR master mix (Stratagene/Agilent Technologies). Gene expression was quantified using the ΔΔCt method, according to Applied Biosystems’ guidelines. Results were normalized to HPRT1 expression (reference gene) and expressed as log2 of the relative expression (ratio) vs one of the control samples (as indicated), chosen as the calibrator.
Western Blot Analysis
Cells were lysed in RIPA buffer (Thermo Fisher Scientific) and total cellular extracts were incubated on ice for 30 min and then cleared by centrifugation (15,000 g for 20 min at 4°C). Protein concentration was measured with the BCA kit (Pierce) and 30 µg of cellular proteins were analyzed by 10% sodium dodecyl sulfate-polyacrylamide gel electrophoresis and transferred to a nitrocellulose membrane (Millipore) by electroblotting. Membranes were blocked for 1 h with 5% bovine serum albumin (BSA, Sigma-Aldrich) in TBS and then probed with rabbit polyclonal anti-phospho-ERK1/2 (Cell Signaling, #9101) followed by detection with goat-anti-rabbit-IgG-horseradish peroxidase conjugate (Sigma-Aldrich, #A0545), all in 5% BSA in TBS with 0.1% Tween 20 (Sigma-Aldrich). Membranes were then stripped with Re-Blot Plus Strong Solution (Millipore) and then blocked and reprobed with rabbit polyclonal anti-ERK1/2 (Cell Signaling, #9102). Protein bands were visualized using ECL detection reagent (GE Healthcare) and exposing the membranes to autoradiography films (Hyperfilms, GE Healthcare).
Results
Experimental Design
Undifferentiated CG4 cells cultured for 1 day in GM were switched to DM and treated with EPO (10 ng/ml) after 3 h; gene expression analysis was performed 1 and 20 h upon EPO stimulation (at 4 and 23 h of differentiation, respectively). The dose of EPO was chosen based on dose–response experiments published in our previous study; since in these cells EPO dose-dependently induced MOG and MBP expression with maximal induction at 8 ng/ml and no further increase at 80 and 400 ng/ml, the dose of 10 ng/ml was used throughout this study (8). EPO-treated were compared with untreated differentiating cells; the effect of differentiation was investigated by comparison with undifferentiated cells cultured for 1 day in GM in the same experimental conditions. Genes differentially expressed were identified by setting a cutoff fold change (FC) of 1.5 (log2 FC = 0.58) and cutoff p-value < 0.05 after applying the Benjamini–Hochberg (BH) correction for multiple tests.
Genes Regulated by Differentiation and EPO
At 20 h, culture in DM changed the expression of 2,663 out of 24,272 transcripts. Five genes represented by duplicate probes changed in opposite directions were excluded from the analysis; when genes were represented by duplicate or triplicates probes consistently changed in the same direction, only the most significantly changed one was included, obtaining 2,436 genes, of which 99 were further changed in the same direction by EPO; 21,609 transcripts were unaffected by differentiation, of which 174, representing 150 genes, were changed by EPO (Figure 1). The relative expression changes of all genes affected by differentiation (2,436; 1,164 upregulated and 1,272 downregulated; Figure 1) and/or by EPO (278; 177 upregulated and 101 downregulated; Figure 1) and details about the redundant probes removed are reported in Files S1–S3 in Supplementary Material.
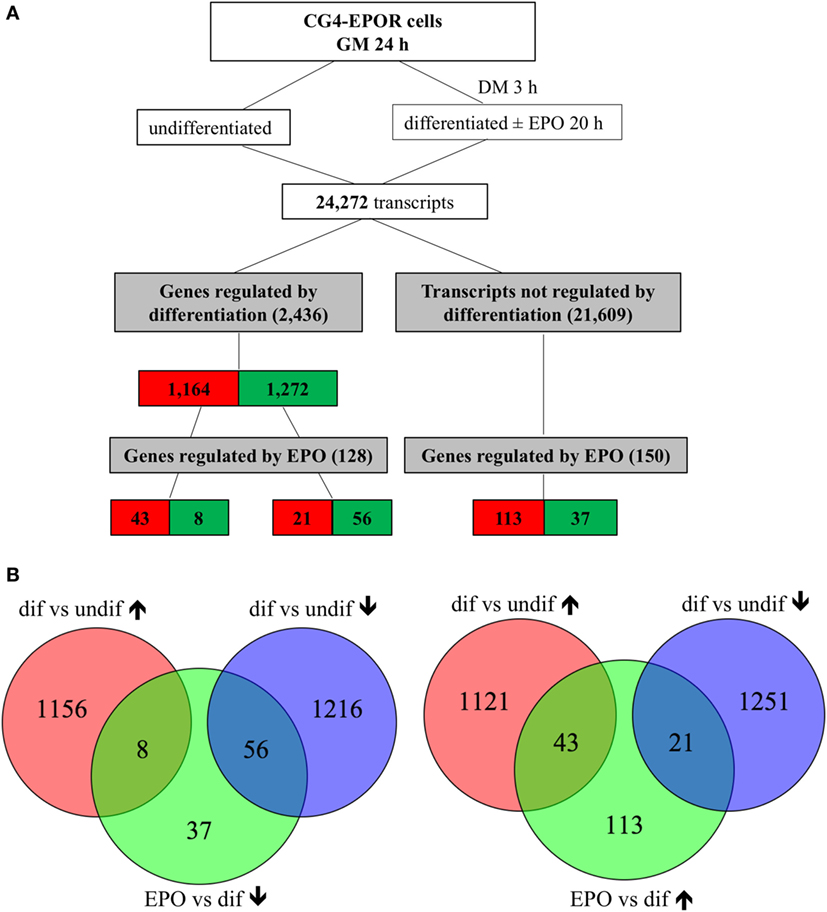
Figure 1. Transcripts regulated by erythropoietin (EPO) at 20 h in differentiating central glia-4 (CG4) cells. Cells cultured for 1 day in growth medium (GM) were switched to differentiation medium (DM); after 3 h, EPO was added and cells were incubated for further 20 h. (A) Transcripts regulated by differentiation were selected by comparing differentiating (23 h culture with DM) vs undifferentiated cells and transcripts regulated by EPO by comparing EPO-treated (20 h) vs untreated differentiating cells. Cutoff for selection was a fold change of 1.5 and BH adj. p-value < 0.05. The number of transcripts resulting from filtering is indicated and color coded (red, increased; green, decreased). (B) Venn diagrams representing the overlap between transcripts regulated by differentiation and downregulated (left diagrams) or upregulated (right diagrams) by EPO, selected as described in (A).
On the other hand, 1 h of EPO treatment had little effect on the gene expression profile. Culture for 4 h in DM affected 931 transcripts out of 24,272; after removing one gene represented by duplicate probes changed in opposite directions, and redundant probes, 878 genes were obtained; of these, 461 were upregulated and 417 downregulated. The addition of EPO for the last hour increased the expression of only six transcripts, corresponding to five genes (Egr1, H19, Fos, Arl4a, Irx2), of which three (Egr1, Fos, and Irx2) had been decreased, and therefore changed in the opposite direction, by previous culture in DM; the remaining two, H19 and Arl4a, had been unaffected by differentiation. The experimental design flowchart at 1 h is shown in Figure S1 in Supplementary Material and the whole list of the genes affected by differentiation and/or by EPO at 1 h, with details about the removed probes, is provided in Files S4 and S5 in Supplementary Material.
To understand the general function of the genes up- or downregulated in differentiating cells at 20 h, we used DAVID to identify the overrepresented GO categories with biological process (BP) designation (GO:BP).
Strongly proliferating OPCs need to exit the cell cycle to start differentiating and producing myelin proteins (31). Therefore, unsurprisingly, the top overrepresented GO:BP categories identified by DAVID analysis of the 1,272 genes downregulated by differentiation (full list, File S1 in Supplementary Material) included “cell division” and “mitotic nuclear division.” Thus, differentiation inhibited the expression of many genes driving cell proliferation; this confirms previous studies in CG4 cells (15, 32) and in primary OLs (33, 34).
Erythropoietin further downregulated the expression of 56 genes already decreased by differentiation, and of 37 of the unaffected ones (Figure 1; File S3 in Supplementary Material); the top enriched GO:BP terms in both groups of genes included “DNA replication”; only 8 transcripts were downregulated by EPO but upregulated by differentiation, and a PubMed search did not highlight any link with OLs or myelination. Therefore, analysis of the EPO-downregulated genes revealed a strong inhibitory action of EPO on a network of genes involved in cell proliferation, some of which were already affected by differentiation; however, it did not suggest any other mechanism that might be triggered by EPO through gene downregulation. The DAVID analysis of the genes downregulated by differentiation and/or by EPO is reported in File S6 in Supplementary Material.
Among the 1,164 genes upregulated by differentiation alone (full list, File S1 in Supplementary Material), the top enriched GO:BP categories were “nervous system development” (n = 25), which included genes involved in myelination, such as Mag and Erbb2 (35), “cell adhesion” (n = 30), including genes previously found upregulated in differentiating OLs, such as Cd9, Neo1, Ninj2, Opcml, Tnr (36), “fatty acid beta-oxidation” (n = 10), and “glycolysis” (n = 9), both required to provide intermediates for myelin synthesis and energy to support the myelination process (Table 1) (37, 38). EPO further upregulated 43 of the transcripts already increased by differentiation alone (Figure 1; File S2 in Supplementary Material), among which DAVID analysis did not highlight any enriched GO:BP category. However, by manual analysis we identified two myelin genes [Mag and Pmp2, a peripheral myelin protein which is also present in the CNS (39)], one gene belonging to the GO:BP “nervous system development” (Mag) and three genes to “cell adhesion” (Cdhr2, Mag, Ntm) but none to “fatty acid beta-oxidation” or “glycolysis.” Twenty-one transcripts were upregulated by EPO but downregulated by differentiation, including low density lipoprotein receptor (Ldlr), which is expressed in mature OLs (40) and myelin transcription factor 1 (Myt1), whose multiple functions on proliferation and differentiation of OLs, likely dependent on interacting molecules, have not been fully characterized (33).
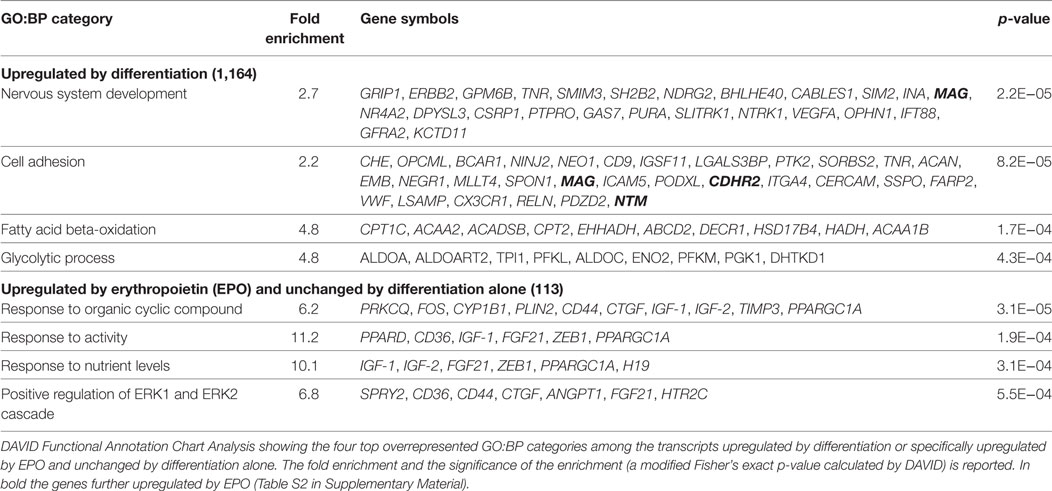
Table 1. Top enriched functional GO:BP categories in transcripts upregulated by differentiation or specifically upregulated by EPO at 20 h.
Genes Specifically Induced by EPO
We then looked at the transcripts specifically increased by EPO but unchanged by differentiation alone (113; Figure 1). The 15 most induced genes in this group are reported in Table 2 (full list, File S2 in Supplementary Material). Some of these genes have been described to play a role in myelination, including Igf1 and Igf2 (21), and Ptpre, a protein tyrosine phospatase whose knockouts have defects in myelination (19). Interestingly, PTPRE also inhibits ERK activation (41). DAVID analysis identified enrichment of generic GO:BP terms including “response to organic cyclic compounds” (n = 10), “response to activity” (n = 6), “response to nutrient levels” (n = 6), and positive regulation of ERK1 and ERK2 cascade (n = 7) (Table 1).
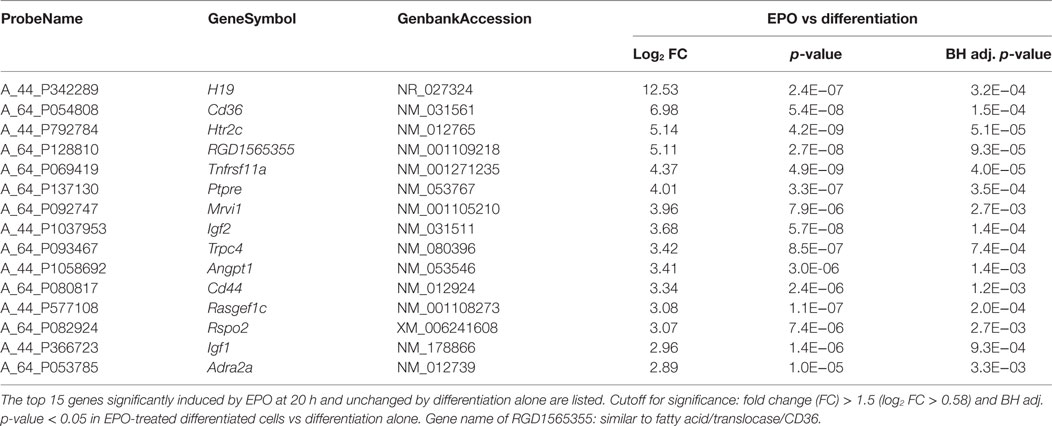
Table 2. Top 15 transcripts upregulated by erythropoietin (EPO) in differentiating cells at 20 h.
EPO Increases the Expression of Cd36 and of Genes Involved in Lipid Metabolism
We noticed, in the list in Table 2, a strong effect of EPO (about 50-fold induction) on Cd36, which mediates long-chain fatty acid uptake and metabolism (22, 42).
We, therefore, searched manually for other genes involved in lipid transport and metabolism among all the transcripts increased by EPO, including those also changed by differentiation alone (177; Figure 1; File S2 in Supplementary Material). We specifically searched for genes annotated with GO:0006629 “lipid metabolic process,” GO:0006631 “fatty acid metabolism,” GO:0006635 “fatty acid beta-oxidation,” GO:0019395 “fatty acid oxidation,” and GO:0015909 “long-chain fatty acid transport.” Other than Cd36, our search identified Ppargc1a/Pgc1alpha, lipin 1 (Lpin1), Lpin2, Pnlip, peroxisome proliferator-activated receptor delta (Ppard), and perilipin 2 (Plin2). The effect of EPO on the expression of these genes in differentiating cells is reported in Table 3.
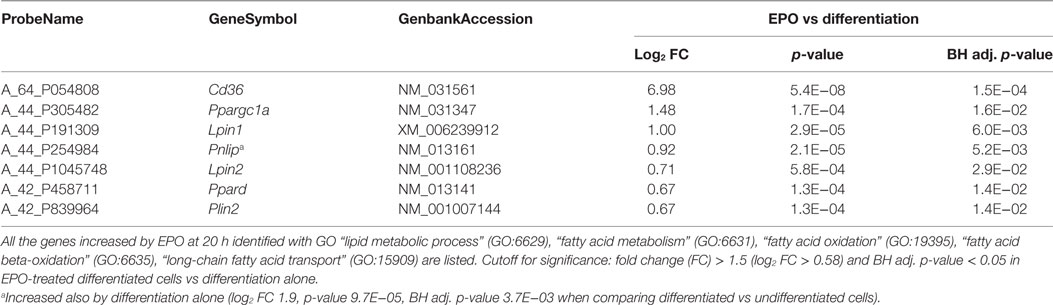
Table 3. Transcripts involved in lipid transport and metabolism induced by erythropoietin (EPO) at 20 h in differentiating cells.
Validation of Microarray Data by qPCR
Microarray expression of eight genes of interest induced by EPO at 20 h, including the Igfs, Ptpre, some of the genes involved in lipid transport and metabolism and one myelin gene, Pmp2, was validated by RT-qPCR, using the same RNA used for the microarray experiment and RNA from a completely independent experiment (Figure 2). EPO-induced expression of all the eight genes tested was confirmed by RT-qPCR.
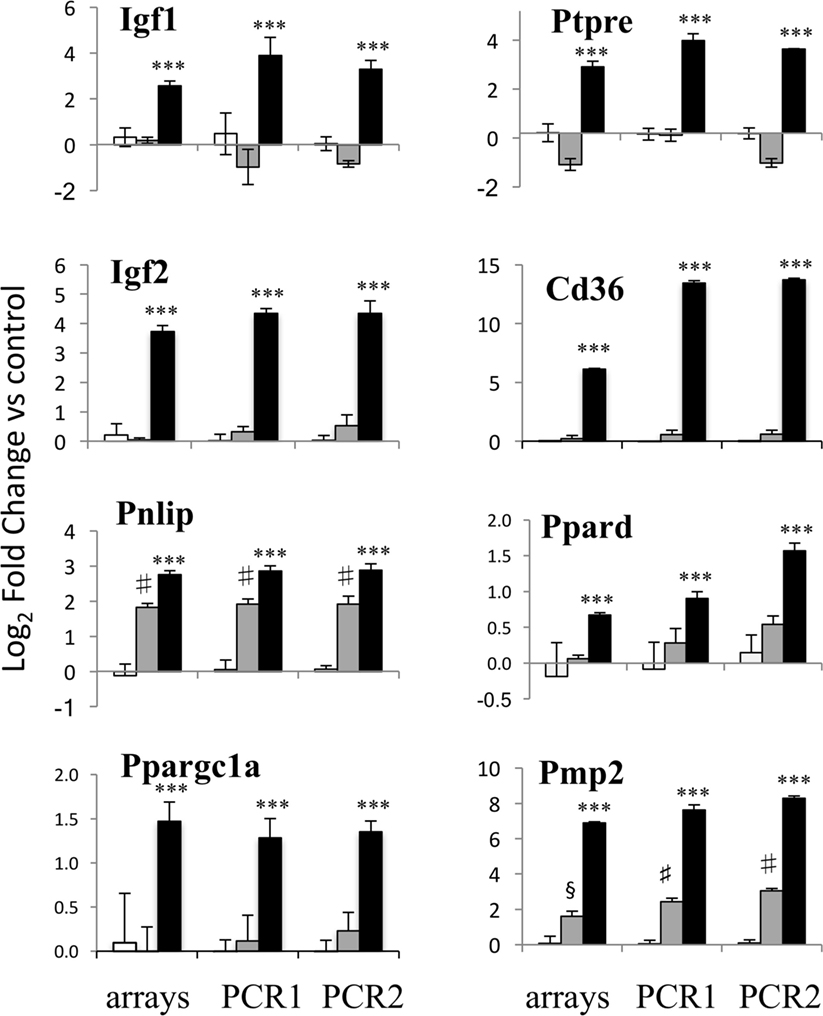
Figure 2. PCR validation of the microarray data. Results for eight genes at 20 h of erythropoietin (EPO) treatment are shown, comparing expression data from microarrays (left) with results from PCR analysis of the RNA from the same experiment (middle) and RNA from an independent experiment (right). Results for undifferentiated (white bars), differentiating (gray bars) and EPO-treated (black bars) differentiating samples are shown. Data are expressed as log2 fold change vs one of the respective undifferentiated samples and are the mean ± SD of four biological replicates. ***p < 0.001 vs differentiation alone; §p < 0.01 vs undifferentiated; #p < 0.001 undifferentiated by two-tailed Student’s t-test.
An Inhibitor of ERK Potentiates EPO-Induced Mog Expression
To investigate whether EPO-induced PTPRE might contribute to the increased myelin gene expression, possibly by inhibiting ERK1/2 activation, we used an inhibitor of ERK1/2 phosphorylation, PD184352. In cells incubated with DM for 1 day, EPO increased the phosphorylation of ERK1/2, which peaked at 10 min and returned to background level at 2 h (Figure 3A). Preincubation with PD184352 (0.1–2 µm) for 1 h completely inhibited EPO-induced ERK1/2 phosphorylation (Figure 3B), showing that the inhibitor was functionally active; PD184352 also potentiated EPO-induced Mog expression (Figure 3C). This result showed that inhibition of the phosphorylation of ERK1/2, achieved by EPO by inducing PTPRE, might be a mechanism by which EPO increases myelin gene expression.
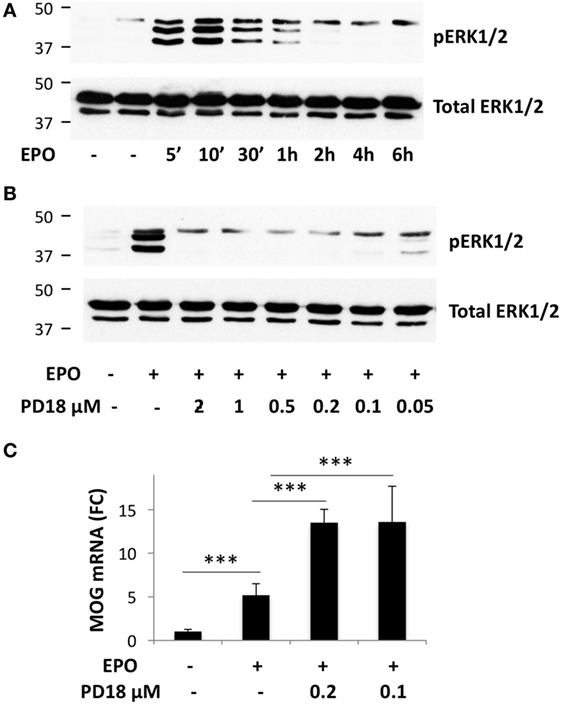
Figure 3. Inhibition of ERK1/2 phosphorylation potentiates erythropoietin (EPO)-induced Mog expression. (A) Time-course of EPO-induced phosphorylation of ERK1/2. (B) Dose–response of PD184352 on inhibition of ERK1/2 phosphorylation. (A,B) Cells were plated in GM for 24 h, then switched to DM and incubated overnight before treatment with medium alone or EPO at 10 ng/ml for the time indicated (A), or treated with DMSO or with different concentrations of PD184352 for 1 h and then with EPO 10 ng/ml for 10 min. Phosphorylated ERK1/2 (upper bands) or total ERK1/2 as the loading control (lower bands) were analyzed by western blot. (C) PD184352 increases EPO-induced Mog expression. Cells were plated in GM for 24 h, then switched to DM and treated with DMSO or PD184352 for 1 h and then with EPO at 10 ng/ml. Mog expression was measured by RT-qPCR at day 3. Data are the mean ± SD of four biological replicates and are representative of three independent experiments. ***p < 0.001 by two-tailed Student’s t-test.
Discussion
The purpose of this study was to use gene expression profiling of CG4 OL cells to investigate the mechanism underlying the pro-myelinating action of EPO that we previously reported (8).
To this aim, we used CG4 cells transduced to overexpress EPOR. Evidence in the literature reports EPO effects on OLs, from cytoprotection to enhancement of differentiation and myelination, in vitro and in vivo (8, 10–13). EPOR is expressed in OLs in physiologic conditions, and its levels are increased by hypoxia, injury, and chronic disease (43, 44), suggesting the involvement of the EPO–EPOR pathway in remyelination upon injury and disease of the CNS. The low availability of high numbers of primary OPCs makes it difficult to study the mechanisms mediating EPO pro-myelinating effects. To circumvent this problem, we used the CG4 cell line, a well-documented in vitro model of CNS myelination (17). However, as reported in our previous study, wild-type CG4 cells do not express EPOR; in cells transduced to express EPOR, EPO increased myelin gene expression, and we demonstrated, using clones with differential EPOR expression, that the response to EPO was increased as the level of EPOR increased, and was actually due to expression of EPOR and not to the vector itself (8).
In our in vitro system, we observed an inducing effect of EPO on genes previously known to play a role in myelination, such as Igf1, Igf2, and Ptpre, as well as genes involved in lipid transport and metabolism, including Fat/Cd36, Ppargc1a/Pgc1alpha, and Pnlip (18–24).
In general, the changes in gene expression profile induced by EPO identified two patterns.
For 43 transcripts, EPO amplified the effect of differentiation, augmenting their induction. These include three of the genes identified by DAVID in the functional groups “nervous system differentiation” and “cell adhesion” (Cdhr2, Mag, Ntm). In addition, Mag and Pnlip were reported as upregulated in primary rat OL compared with OPC (20, 34, 36, 45).
A second group of genes was represented by the 113 transcripts upregulated by EPO and differentiation but not by differentiation alone. These include a number of genes identified in previous studies to be expressed in primary myelinating OL [Acy3, Adamts4, Insc, Pdlim2, Prkcq (46, 47)], suggesting EPO may support OPC differentiation. This helps to explain the mechanism, at the gene expression level, of the pro-differentiating action of EPO on OLs described in other studies (10, 12, 13).
Among the genes whose expression was induced by DM and EPO but not by differentiation alone, the Igfs (Igf1 and Igf2) were among the top ones. IGF-1 effects on myelination in vivo and in vitro are well known (21, 48, 49). Of note, EPO-induced IGF-1 has been proposed as a mediator of EPO regenerative and remyelinating effects in the peripheral nervous system in rats (50). Therefore, IGF-1 might contribute to the effects of EPO in this system.
Both IGF-1 and IGF-2 are pro-myelinating cytokines, although the role of IGF-1 is better described (49). Interestingly, in the context of clinical samples, data in GEO3 (GSE38010) from Steinman’s group (51) show downregulation of Igf2 in chronic MS plaques compared to healthy controls whereas Igf1 expression did not change significantly.
Another gene among the top 15 induced by EPO was protein tyrosine phosphatase (PTP) receptor type E (Ptpre). Ranjan and Hudson found that PTP inhibitors decreased OL differentiation, and Ptpre, together with other PTP, was expressed in differentiating CG4 cells (18). Other PTPs have a role in OL maturation and myelination; Ptpa loss increased OPC proliferation (52); Ptprz knock out mice did not recover from EAE as well as controls and remyelination in MS plaques was associated with an upregulation of PTPRZ (53); also, hypomyelination was observed in Ptpre knock out mice (19).
A link between PTPRE and OL differentiation might be provided by its ability to inhibit the ERK pathway (41). The role of ERK in myelination is controversial; overall ERK activation increases myelination, for instance increasing myelin thickness (54). However, ERK also mediates cell proliferation induced by growth factors that maintain the OPCs in an undifferentiated state, including PDGF (55); of note, PTPRE inhibits PDGF signaling (56). In this context, since we are focusing on the early events necessary to drive myelination during OPC to OL transition, it is likely that ERK activation needs to be inhibited to inhibit OPC proliferation and promote OL differentiation. EPO-induced ERK1/2 activation in these cells, detected only at 10–60 min and then rapidly switched off, might be a negative feedback mechanism, not mediating but counteracting EPO-induced myelination; in this regard, we have previously shown that inhibiting Egr2, downstream to ERK, Mog expression is increased (8). Therefore, EPO-induced PTPRE, by inhibiting the ERK pathway, might favor OL differentiation.
Another pathway that seems a major target of EPO in differentiating OL is that of fatty acid transport and oxidation. Fat/Cd36 was the second top induced gene. Of note, clinical data in GEO from Steinman’s group, mentioned above [see text footnote 3; GSE38010 (51)] report downregulation of Cd36 in chronic MS plaques compared to healthy controls. The role of CD36 in mediating fatty acid uptake to enhance fatty acid oxidation has been described in muscle, heart, and adipose tissue (22, 42, 57); in macrophages, uptake of triacylglycerol-carrying lipoproteins via CD36 and lipolysis of triglycerides by lysosomal acid lipase increase oxidative phosphorylation of fatty acids and drive alternative (M2) macrophage activation (58). Together with Cd36, EPO increased the expression of Pnlip, recently shown to be expressed at high levels in differentiating OLs (20), possibly augmenting fatty acid uptake and utilization in OLs.
In addition, EPO-induced Ppargc1a/PGC-1alpha might mediate increased mitochondrial biogenesis; of note, EPO increases mitochondrial metabolism in heart and in muscle via PGC-1alpha (59, 60); moreover, both CD36 and PGC-1alpha can be induced via AMP kinase (AMPK) activation (61, 62), and EPO can activate AMPK in heart, in muscle and in white adipocytes (60, 63, 64). In the brain, EPO protection from ischemic damage is associated with preservation of Pgc1alpha expression (65); interestingly, PGC-1alpha is expressed in MBP-positive OL in the cerebellum and pharmacological upregulation of PGC-1alpha in OLs increased their differentiation, suggesting that PGC-1alpha has a role in CNS myelination (23, 66).
Altogether, increased expression of Cd36, Pnlip, Pgc1alpha, and other genes involved in lipid transport and metabolism (including Ldlr, not listed in Table 2 because inhibited by differentiation alone) suggests that EPO can increase lipid utilization in these cells; fatty acids might then be used for myelin synthesis. In support of this, supplementation of OL with polyunsaturated fatty acids, and in particular with gamma-linoleic acid, can increase OL differentiation and myelin gene expression (67).
It is also tempting to speculate that EPO might have the ability to induce a metabolic shift toward oxidative phosphorylation fueled by fatty acid oxidation, described in macrophages as a driver of M2 polarization (58, 68, 69), which might favor the differentiation of proliferating OPCs, mainly relying on aerobic glycolysis as a source of energy (38), into mature OLs. Although the brain mainly utilizes glucose as a source of energy, recent studies demonstrate that fatty acid oxidation can occur in neural and glial cells, including OLs (70–73). In addition, active mitochondrial metabolism has been recently described in mature OLs, previously thought to produce almost exclusively lactate to support neuron and axon survival (37, 74, 75). Interestingly, decreased oxidation of very long-chain fatty acids, reduced oxygen consumption and increased glycolysis have been described as mechanisms by which TNF inhibits OL differentiation (70, 76). Of note, dimethyl fumarate, a current effective therapy for recurrent MS, was found to increase oxidative metabolism and antioxidants levels and decrease the amount of lipids in OLs, suggesting that augmented lipid metabolism in OLs might mediate therapeutic effects in MS (77). It is interesting to note that PTPRE can also dephosphorylate insulin receptor (78), potentially inhibiting insulin signals and glucose utilization in these cells.
In conclusion, we have identified genes specifically induced by EPO in differentiating OLs which might contribute to the myelinating effects of EPO; while IGF-1 had been reported as a mediator of EPO’s myelinating effects in the peripheral nervous system, increased EPO-induced Igf1 and Igf2 expression in OLs had never been described. As for the EPO inducing effect on PTPRE, it is interesting to note that another phosphatase, dual-specificity protein phosphatase 5 (Dusp5), was among the few genes induced by EPO in rats with cerebral ischemia, where EPO treatment is protective (30). Of note, DUSP5 and PTPRE can downregulate the ERK pathway (41, 79). An effect of EPO on PGC-1alpha has been described in other systems (59, 60, 65); associated with CD36, Pnlip and other genes involved in lipid metabolism, including Ppard, Lpin1, and Lpin2, might contribute to mediate EPO-induced myelination, as highlighted in Figure 4. Interestingly, the IGFs can increase fatty acid oxidation by upregulating CD36 (80). Further investigation is needed to establish whether these genes mapping to different pathways might separately contribute or work together to mediate EPO’s pro-myelinating effects.
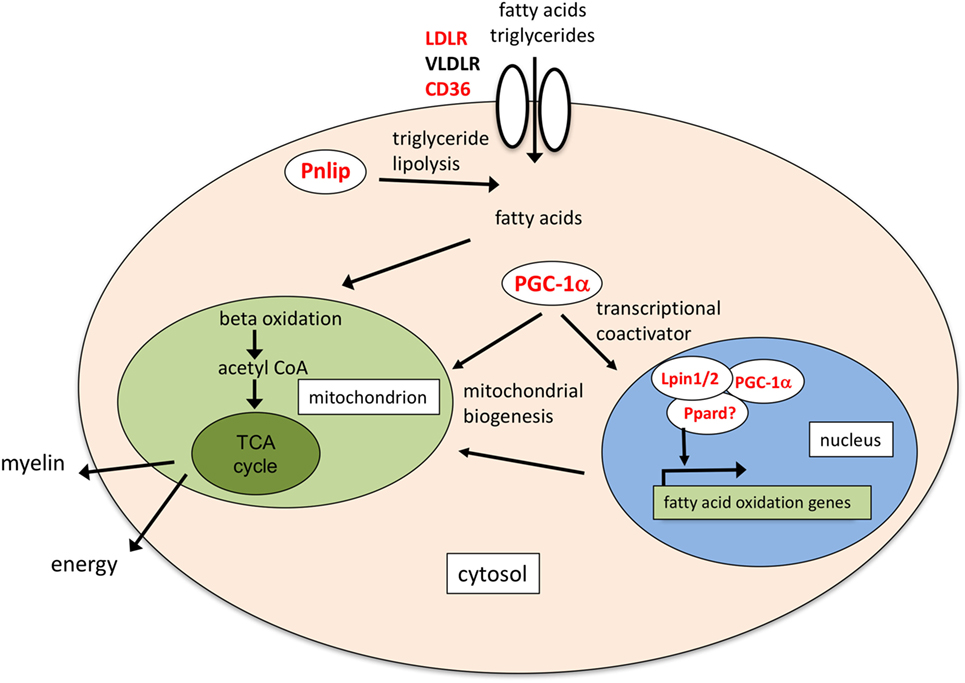
Figure 4. Schematic of the possible molecular functions of lipid transport and metabolism genes induced by erythropoietin (EPO). Pnlip hydrolyzes triglycerides into fatty acids (20, 34); CD36 mediates transport of long-chain fatty acids and triacylglycerol-carrying low density lipoproteins (22, 42). Together with low density lipoprotein receptor (LDLR) and very low density LR (VLDLR), expressed in mature OLs (40), it might provide a source of fatty acids to increase fatty acid oxidation. Ppargc1a/PGC-1alpha, Lpin1, and Ppard increase mitochondrial biogenesis and fatty acid oxidation (24, 81–83). In mouse liver, Lpin1 can act as a transcriptional coactivator interacting with PGC-1alpha and peroxisome proliferator-activated receptor alpha (Ppara) (81). Lpin1 can also interact with Ppard, which might, therefore, be part of the coactivation complex (84). Fatty acid oxidation might provide acetyl CoA for myelin synthesis, or increase ATP production through the TCA cycle. In red the genes induced by EPO.
A limitation of this study is that our results were obtained in an OL cell line in which EPOR was overexpressed. To generalize the relevance of our conclusions, our observations need to be confirmed in primary cells, including human cells, and eventually in vivo. In addition, the CG4 OL cell line is a model of CNS myelination, and therefore, our conclusions cannot be extended to the peripheral nervous system.
Author Contributions
GG, TH, FW, CR, LH, and MM performed experiments; GG, MM, LH, and PG designed experiments; GG, TH, and MM analyzed data; MM, GG, TH, and PG wrote the manuscript; all authors critically revised and approved the manuscript.
Conflict of Interest Statement
The authors declare that the research was conducted in the absence of any commercial or financial relationships that could be construed as a potential conflict of interest.
Acknowledgments
The authors thank Alexander Annenkov for providing the CG4-EPOR cells used in this study.
Funding
Supported by the RM Phillips Trust (PG), the Brighton Centre for Regenerative Medicine, University of Brighton (GG) and the Brighton and Sussex Medical School as part of the Independent Research Project of TH, FW, and CR.
Supplementary Material
The Supplementary Material for this article can be found online at http://www.frontiersin.org/article/10.3389/fimmu.2017.01394/full#supplementary-material.
Footnotes
References
1. Franklin RJ, Gallo V. The translational biology of remyelination: past, present, and future. Glia (2014) 62(11):1905–15. doi:10.1002/glia.22622
2. Fumagalli M, Lecca D, Abbracchio MP. CNS remyelination as a novel reparative approach to neurodegenerative diseases: the roles of purinergic signaling and the P2Y-like receptor GPR17. Neuropharmacology (2016) 104:82–93. doi:10.1016/j.neuropharm.2015.10.005
3. Kremer D, Kury P, Dutta R. Promoting remyelination in multiple sclerosis: current drugs and future prospects. Mult Scler (2015) 21(5):541–9. doi:10.1177/1352458514566419
4. Tauheed AM, Ayo JO, Kawu MU. Regulation of oligodendrocyte differentiation: insights and approaches for the management of neurodegenerative disease. Pathophysiology (2016) 23(3):203–10. doi:10.1016/j.pathophys.2016.05.007
5. Sargin D, Friedrichs H, El-Kordi A, Ehrenreich H. Erythropoietin as neuroprotective and neuroregenerative treatment strategy: comprehensive overview of 12 years of preclinical and clinical research. Best Pract Res Clin Anaesthesiol (2010) 24(4):573–94. doi:10.1016/j.bpa.2010.10.005
6. Brines M, Cerami A. Erythropoietin-mediated tissue protection: reducing collateral damage from the primary injury response. J Intern Med (2008) 264(5):405–32. doi:10.1111/j.1365-2796.2008.02024.x
7. Um M, Gross AW, Lodish HF. A “classical” homodimeric erythropoietin receptor is essential for the antiapoptotic effects of erythropoietin on differentiated neuroblastoma SH-SY5Y and pheochromocytoma PC-12 cells. Cell Signal (2007) 19(3):634–45. doi:10.1016/j.cellsig.2006.08.014
8. Cervellini I, Annenkov A, Brenton T, Chernajovsky Y, Ghezzi P, Mengozzi M. Erythropoietin (EPO) increases myelin gene expression in CG4 oligodendrocyte cells through the classical EPO receptor. Mol Med (2013) 19:223–9. doi:10.2119/molmed.2013.00013
9. Zhang J, Li Y, Cui Y, Chen J, Lu M, Elias SB, et al. Erythropoietin treatment improves neurological functional recovery in EAE mice. Brain Res (2005) 1034(1–2):34–9. doi:10.1016/j.brainres.2004.11.036
10. Hassouna I, Ott C, Wustefeld L, Offen N, Neher RA, Mitkovski M, et al. Revisiting adult neurogenesis and the role of erythropoietin for neuronal and oligodendroglial differentiation in the hippocampus. Mol Psychiatry (2016) 21(12):1752–67. doi:10.1038/mp.2015.212
11. Cho YK, Kim G, Park S, Sim JH, Won YJ, Hwang CH, et al. Erythropoietin promotes oligodendrogenesis and myelin repair following lysolecithin-induced injury in spinal cord slice culture. Biochem Biophys Res Commun (2012) 417(2):753–9. doi:10.1016/j.bbrc.2011.12.029
12. Jantzie LL, Miller RH, Robinson S. Erythropoietin signaling promotes oligodendrocyte development following prenatal systemic hypoxic-ischemic brain injury. Pediatr Res (2013) 74(6):658–67. doi:10.1038/pr.2013.155
13. Sugawa M, Sakurai Y, Ishikawa-Ieda Y, Suzuki H, Asou H. Effects of erythropoietin on glial cell development; oligodendrocyte maturation and astrocyte proliferation. Neurosci Res (2002) 44(4):391–403. doi:10.1016/S0168-0102(02)00161-X
14. Setzu A, Ffrench-Constant C, Franklin RJ. CNS axons retain their competence for myelination throughout life. Glia (2004) 45(3):307–11. doi:10.1002/glia.10321
15. Louis JC, Magal E, Muir D, Manthorpe M, Varon S. CG-4, a new bipotential glial cell line from rat brain, is capable of differentiating in vitro into either mature oligodendrocytes or type-2 astrocytes. J Neurosci Res (1992) 31(1):193–204. doi:10.1002/jnr.490310125
16. Solly SK, Thomas JL, Monge M, Demerens C, Lubetzki C, Gardinier MV, et al. Myelin/oligodendrocyte glycoprotein (MOG) expression is associated with myelin deposition. Glia (1996) 18(1):39–48. doi:10.1002/(SICI)1098-1136(199609)18:1<39::AID-GLIA4>3.0.CO;2-Z
17. Stariha RL, Kim SU. Mitogen-activated protein kinase signalling in oligodendrocytes: a comparison of primary cultures and CG-4. Int J Dev Neurosci (2001) 19(4):427–37. doi:10.1016/S0736-5748(01)00025-9
18. Ranjan M, Hudson LD. Regulation of tyrosine phosphorylation and protein tyrosine phosphatases during oligodendrocyte differentiation. Mol Cell Neurosci (1996) 7(5):404–18. doi:10.1006/mcne.1996.0029
19. Peretz A, Gil-Henn H, Sobko A, Shinder V, Attali B, Elson A. Hypomyelination and increased activity of voltage-gated K(+) channels in mice lacking protein tyrosine phosphatase epsilon. EMBO J (2000) 19(15):4036–45. doi:10.1093/emboj/19.15.4036
20. Dugas JC, Tai YC, Speed TP, Ngai J, Barres BA. Functional genomic analysis of oligodendrocyte differentiation. J Neurosci (2006) 26(43):10967–83. doi:10.1523/JNEUROSCI.2572-06.2006
21. Zeger M, Popken G, Zhang J, Xuan S, Lu QR, Schwab MH, et al. Insulin-like growth factor type 1 receptor signaling in the cells of oligodendrocyte lineage is required for normal in vivo oligodendrocyte development and myelination. Glia (2007) 55(4):400–11. doi:10.1002/glia.20469
22. Glatz JF, Luiken JJ, Bonen A. Membrane fatty acid transporters as regulators of lipid metabolism: implications for metabolic disease. Physiol Rev (2010) 90(1):367–417. doi:10.1152/physrev.00003.2009
23. Xiang Z, Krainc D. Pharmacological upregulation of PGC1alpha in oligodendrocytes: implications for Huntington’s disease. J Huntingtons Dis (2013) 2(1):101–5. doi:10.3233/JHD-130046
24. Huang TY, Zheng D, Houmard JA, Brault JJ, Hickner RC, Cortright RN. Overexpression of PGC-1alpha increases peroxisomal activity and mitochondrial fatty acid oxidation in human primary myotubes. Am J Physiol Endocrinol Metab (2017) 312(4):E253–63. doi:10.1152/ajpendo.00331.2016
25. Annenkov A, Rigby A, Amor S, Zhou D, Yousaf N, Hemmer B, et al. A chimeric receptor of the insulin-like growth factor receptor type 1 (IGFR1) and a single chain antibody specific to myelin oligodendrocyte glycoprotein activates the IGF1R signalling cascade in CG4 oligodendrocyte progenitors. Biochim Biophys Acta (2011) 1813(8):1428–37. doi:10.1016/j.bbamcr.2011.04.006
26. Wen D, Boissel JP, Tracy TE, Gruninger RH, Mulcahy LS, Czelusniak J, et al. Erythropoietin structure-function relationships: high degree of sequence homology among mammals. Blood (1993) 82(5):1507–16.
27. Brines ML, Ghezzi P, Keenan S, Agnello D, de Lanerolle NC, Cerami C, et al. Erythropoietin crosses the blood-brain barrier to protect against experimental brain injury. Proc Natl Acad Sci U S A (2000) 97(19):10526–31. doi:10.1073/pnas.97.19.10526
28. Barrett T, Wilhite SE, Ledoux P, Evangelista C, Kim IF, Tomashevsky M, et al. NCBI GEO: archive for functional genomics data sets – update. Nucleic Acids Res (2013) 41(Database issue):D991–5. doi:10.1093/nar/gks1193
29. Huang da W, Sherman BT, Lempicki RA. Systematic and integrative analysis of large gene lists using DAVID bioinformatics resources. Nat Protoc (2009) 4(1):44–57. doi:10.1038/nprot.2008.211
30. Mengozzi M, Cervellini I, Villa P, Erbayraktar Z, Gokmen N, Yilmaz O, et al. Erythropoietin-induced changes in brain gene expression reveal induction of synaptic plasticity genes in experimental stroke. Proc Natl Acad Sci U S A (2012) 109(24):9617–22. doi:10.1073/pnas.1200554109
31. Nave KA. Oligodendrocytes and the “micro brake” of progenitor cell proliferation. Neuron (2010) 65(5):577–9. doi:10.1016/j.neuron.2010.02.026
32. Tretiakova A, Krynska B, Gordon J, Khalili K. Human neurotropic JC virus early protein deregulates glial cell cycle pathway and impairs cell differentiation. J Neurosci Res (1999) 55(5):588–99. doi:10.1002/(SICI)1097-4547(19990301)55:5<588::AID-JNR6>3.0.CO;2-A
33. Nielsen JA, Berndt JA, Hudson LD, Armstrong RC. Myelin transcription factor 1 (Myt1) modulates the proliferation and differentiation of oligodendrocyte lineage cells. Mol Cell Neurosci (2004) 25(1):111–23. doi:10.1016/j.mcn.2003.10.001
34. Swiss VA, Nguyen T, Dugas J, Ibrahim A, Barres B, Androulakis IP, et al. Identification of a gene regulatory network necessary for the initiation of oligodendrocyte differentiation. PLoS One (2011) 6(4):e18088. doi:10.1371/journal.pone.0018088
35. Kim JY, Sun Q, Oglesbee M, Yoon SO. The role of ErbB2 signaling in the onset of terminal differentiation of oligodendrocytes in vivo. J Neurosci (2003) 23(13):5561–71.
36. Nielsen JA, Maric D, Lau P, Barker JL, Hudson LD. Identification of a novel oligodendrocyte cell adhesion protein using gene expression profiling. J Neurosci (2006) 26(39):9881–91. doi:10.1523/JNEUROSCI.2246-06.2006
37. Schoenfeld R, Wong A, Silva J, Li M, Itoh A, Horiuchi M, et al. Oligodendroglial differentiation induces mitochondrial genes and inhibition of mitochondrial function represses oligodendroglial differentiation. Mitochondrion (2010) 10(2):143–50. doi:10.1016/j.mito.2009.12.141
38. Lunt SY, Vander Heiden MG. Aerobic glycolysis: meeting the metabolic requirements of cell proliferation. Annu Rev Cell Dev Biol (2011) 27:441–64. doi:10.1146/annurev-cellbio-092910-154237
39. Narayanan V, Kaestner KH, Tennekoon GI. Structure of the mouse myelin P2 protein gene. J Neurochem (1991) 57(1):75–80. doi:10.1111/j.1471-4159.1991.tb02101.x
40. Zhao S, Hu X, Park J, Zhu Y, Zhu Q, Li H, et al. Selective expression of LDLR and VLDLR in myelinating oligodendrocytes. Dev Dyn (2007) 236(9):2708–12. doi:10.1002/dvdy.21283
41. Wabakken T, Hauge H, Finne EF, Wiedlocha A, Aasheim H. Expression of human protein tyrosine phosphatase epsilon in leucocytes: a potential ERK pathway-regulating phosphatase. Scand J Immunol (2002) 56(2):195–203. doi:10.1046/j.1365-3083.2002.01126.x
42. McFarlan JT, Yoshida Y, Jain SS, Han XX, Snook LA, Lally J, et al. In vivo, fatty acid translocase (CD36) critically regulates skeletal muscle fuel selection, exercise performance, and training-induced adaptation of fatty acid oxidation. J Biol Chem (2012) 287(28):23502–16. doi:10.1074/jbc.M111.315358
43. Siren AL, Fasshauer T, Bartels C, Ehrenreich H. Therapeutic potential of erythropoietin and its structural or functional variants in the nervous system. Neurotherapeutics (2009) 6(1):108–27. doi:10.1016/j.nurt.2008.10.041
44. Ott C, Martens H, Hassouna I, Oliveira B, Erck C, Zafeiriou MP, et al. Widespread expression of erythropoietin receptor in brain and its induction by injury. Mol Med (2015) 21(1):803–15. doi:10.2119/molmed.2015.00192
45. Hu JG, Wang YX, Zhou JS, Chen CJ, Wang FC, Li XW, et al. Differential gene expression in oligodendrocyte progenitor cells, oligodendrocytes and type II astrocytes. Tohoku J Exp Med (2011) 223(3):161–76. doi:10.1620/tjem.223.161
46. Cahoy JD, Emery B, Kaushal A, Foo LC, Zamanian JL, Christopherson KS, et al. A transcriptome database for astrocytes, neurons, and oligodendrocytes: a new resource for understanding brain development and function. J Neurosci (2008) 28(1):264–78. doi:10.1523/JNEUROSCI.4178-07.2008
47. Zhang Y, Chen K, Sloan SA, Bennett ML, Scholze AR, O’Keeffe S, et al. An RNA-sequencing transcriptome and splicing database of glia, neurons, and vascular cells of the cerebral cortex. J Neurosci (2014) 34(36):11929–47. doi:10.1523/JNEUROSCI.1860-14.2014
48. Carson MJ, Behringer RR, Brinster RL, McMorris FA. Insulin-like growth factor I increases brain growth and central nervous system myelination in transgenic mice. Neuron (1993) 10(4):729–40. doi:10.1016/0896-6273(93)90173-O
49. Ye P, Li L, Richards RG, DiAugustine RP, D’Ercole AJ. Myelination is altered in insulin-like growth factor-I null mutant mice. J Neurosci (2002) 22(14):6041–51.
50. Wang W, Li D, Li Q, Wang L, Bai G, Yang T, et al. Erythropoietin promotes peripheral nerve regeneration in rats by upregulating expression of insulin-like growth factor-1. Arch Med Sci (2015) 11(2):433–7. doi:10.5114/aoms.2015.50976
51. Han MH, Lundgren DH, Jaiswal S, Chao M, Graham KL, Garris CS, et al. Janus-like opposing roles of CD47 in autoimmune brain inflammation in humans and mice. J Exp Med (2012) 209(7):1325–34. doi:10.1084/jem.20101974
52. Wang PS, Wang J, Zheng Y, Pallen CJ. Loss of protein-tyrosine phosphatase alpha (PTPalpha) increases proliferation and delays maturation of oligodendrocyte progenitor cells. J Biol Chem (2012) 287(15):12529–40. doi:10.1074/jbc.M111.312769
53. Harroch S, Furtado GC, Brueck W, Rosenbluth J, Lafaille J, Chao M, et al. A critical role for the protein tyrosine phosphatase receptor type Z in functional recovery from demyelinating lesions. Nat Genet (2002) 32(3):411–4. doi:10.1038/ng1004
54. Ishii A, Fyffe-Maricich SL, Furusho M, Miller RH, Bansal R. ERK1/ERK2 MAPK signaling is required to increase myelin thickness independent of oligodendrocyte differentiation and initiation of myelination. J Neurosci (2012) 32(26):8855–64. doi:10.1523/JNEUROSCI.0137-12.2012
55. Bhat NR, Zhang P. Activation of mitogen-activated protein kinases in oligodendrocytes. J Neurochem (1996) 66(5):1986–94. doi:10.1046/j.1471-4159.1996.66051986.x
56. Shimizu H, Nakagawa Y, Murakami C, Aoki N, Kim-Mitsuyama S, Miyazaki H. Protein tyrosine phosphatase PTPepsilonM negatively regulates PDGF beta-receptor signaling induced by high glucose and PDGF in vascular smooth muscle cells. Am J Physiol Cell Physiol (2010) 299(5):C1144–52. doi:10.1152/ajpcell.00536.2009
57. Jay AG, Hamilton JA. The enigmatic membrane fatty acid transporter CD36: new insights into fatty acid binding and their effects on uptake of oxidized LDL. Prostaglandins Leukot Essent Fatty Acids (2016). doi:10.1016/j.plefa.2016.05.005
58. Huang SC, Everts B, Ivanova Y, O’Sullivan D, Nascimento M, Smith AM, et al. Cell-intrinsic lysosomal lipolysis is essential for alternative activation of macrophages. Nat Immunol (2014) 15(9):846–55. doi:10.1038/ni.2956
59. Carraway MS, Suliman HB, Jones WS, Chen CW, Babiker A, Piantadosi CA. Erythropoietin activates mitochondrial biogenesis and couples red cell mass to mitochondrial mass in the heart. Circ Res (2010) 106(11):1722–30. doi:10.1161/CIRCRESAHA.109.214353
60. Wang L, Jia Y, Rogers H, Suzuki N, Gassmann M, Wang Q, et al. Erythropoietin contributes to slow oxidative muscle fiber specification via PGC-1alpha and AMPK activation. Int J Biochem Cell Biol (2013) 45(7):1155–64. doi:10.1016/j.biocel.2013.03.007
61. Kim MS, Lee GH, Kim YM, Lee BW, Nam HY, Sim UC, et al. Angiotensin II causes apoptosis of adult hippocampal neural stem cells and memory impairment through the action on AMPK-PGC1alpha signaling in heart failure. Stem Cells Transl Med (2017) 6(6):1491–503. doi:10.1002/sctm.16-0382
62. Momken I, Chabowski A, Dirkx E, Nabben M, Jain SS, McFarlan JT, et al. A new leptin-mediated mechanism for stimulating fatty acid oxidation: a pivotal role for sarcolemmal FAT/CD36. Biochem J (2017) 474(1):149–62. doi:10.1042/BCJ20160804
63. Li XJ, Wang XW, Du YJ. Protective effects of erythropoietin on myocardial infarction in rats: the role of AMP-activated protein kinase signaling pathway. Am J Med Sci (2011) 342(2):153–9. doi:10.1097/MAJ.0b013e318210041d
64. Wang L, Di L, Noguchi CT. AMPK is involved in mediation of erythropoietin influence on metabolic activity and reactive oxygen species production in white adipocytes. Int J Biochem Cell Biol (2014) 54:1–9. doi:10.1016/j.biocel.2014.06.008
65. Yuen CM, Sun CK, Lin YC, Chang LT, Kao YH, Yen CH, et al. Combination of cyclosporine and erythropoietin improves brain infarct size and neurological function in rats after ischemic stroke. J Transl Med (2011) 9:141. doi:10.1186/1479-5876-9-141
66. Camacho A, Huang JK, Delint-Ramirez I, Yew Tan C, Fuller M, Lelliott CJ, et al. Peroxisome proliferator-activated receptor gamma-coactivator-1 alpha coordinates sphingolipid metabolism, lipid raft composition and myelin protein synthesis. Eur J Neurosci (2013) 38(5):2672–83. doi:10.1111/ejn.12281
67. van Meeteren ME, Baron W, Beermann C, Dijkstra CD, van Tol EA. Polyunsaturated fatty acid supplementation stimulates differentiation of oligodendroglia cells. Dev Neurosci (2006) 28(3):196–208. doi:10.1159/000091917
68. Tannahill GM, Iraci N, Gaude E, Frezza C, Pluchino S. Metabolic reprograming of mononuclear phagocytes in progressive multiple sclerosis. Front Immunol (2015) 6:106. doi:10.3389/fimmu.2015.00106
69. O’Neill LA, Kishton RJ, Rathmell J. A guide to immunometabolism for immunologists. Nat Rev Immunol (2016) 16(9):553–65. doi:10.1038/nri.2016.70
70. Cimini A, Bernardo A, Cifone MG, Di Marzio L, Di Loreto S. TNFalpha downregulates PPARdelta expression in oligodendrocyte progenitor cells: implications for demyelinating diseases. Glia (2003) 41(1):3–14. doi:10.1002/glia.10143
71. Taib B, Bouyakdan K, Hryhorczuk C, Rodaros D, Fulton S, Alquier T. Glucose regulates hypothalamic long-chain fatty acid metabolism via AMP-activated kinase (AMPK) in neurons and astrocytes. J Biol Chem (2013) 288(52):37216–29. doi:10.1074/jbc.M113.506238
72. Panov A, Orynbayeva Z, Vavilin V, Lyakhovich V. Fatty acids in energy metabolism of the central nervous system. Biomed Res Int (2014) 2014:472459. doi:10.1155/2014/472459
73. Sayre NL, Sifuentes M, Holstein D, Cheng SY, Zhu X, Lechleiter JD. Stimulation of astrocyte fatty acid oxidation by thyroid hormone is protective against ischemic stroke-induced damage. J Cereb Blood Flow Metab (2017) 37(2):514–27. doi:10.1177/0271678X16629153
74. Lee Y, Morrison BM, Li Y, Lengacher S, Farah MH, Hoffman PN, et al. Oligodendroglia metabolically support axons and contribute to neurodegeneration. Nature (2012) 487(7408):443–8. doi:10.1038/nature11314
75. Amaral AI, Hadera MG, Tavares JM, Kotter MR, Sonnewald U. Characterization of glucose-related metabolic pathways in differentiated rat oligodendrocyte lineage cells. Glia (2016) 64(1):21–34. doi:10.1002/glia.22900
76. Bonora M, De Marchi E, Patergnani S, Suski JM, Celsi F, Bononi A, et al. Tumor necrosis factor-alpha impairs oligodendroglial differentiation through a mitochondria-dependent process. Cell Death Differ (2014) 21(8):1198–208. doi:10.1038/cdd.2014.35
77. Huang H, Taraboletti A, Shriver LP. Dimethyl fumarate modulates antioxidant and lipid metabolism in oligodendrocytes. Redox Biol (2015) 5:169–75. doi:10.1016/j.redox.2015.04.011
78. Nakagawa Y, Aoki N, Aoyama K, Shimizu H, Shimano H, Yamada N, et al. Receptor-type protein tyrosine phosphatase epsilon (PTPepsilonM) is a negative regulator of insulin signaling in primary hepatocytes and liver. Zoolog Sci (2005) 22(2):169–75. doi:10.2108/zsj.22.169
79. Caunt CJ, Keyse SM. Dual-specificity MAP kinase phosphatases (MKPs): shaping the outcome of MAP kinase signalling. FEBS J (2013) 280(2):489–504. doi:10.1111/j.1742-4658.2012.08716.x
80. Heron-Milhavet L, Haluzik M, Yakar S, Gavrilova O, Pack S, Jou WC, et al. Muscle-specific overexpression of CD36 reverses the insulin resistance and diabetes of MKR mice. Endocrinology (2004) 145(10):4667–76. doi:10.1210/en.2003-1543
81. Reue K, Brindley DN. Thematic review series: glycerolipids. Multiple roles for lipins/phosphatidate phosphatase enzymes in lipid metabolism. J Lipid Res (2008) 49(12):2493–503. doi:10.1194/jlr.R800019-JLR200
82. Csaki LS, Reue K. Lipins: multifunctional lipid metabolism proteins. Annu Rev Nutr (2010) 30:257–72. doi:10.1146/annurev.nutr.012809.104729
83. Bojic LA, Telford DE, Fullerton MD, Ford RJ, Sutherland BG, Edwards JY, et al. PPARdelta activation attenuates hepatic steatosis in Ldlr-/- mice by enhanced fat oxidation, reduced lipogenesis, and improved insulin sensitivity. J Lipid Res (2014) 55(7):1254–66. doi:10.1194/jlr.M046037
Keywords: central glia-4, microarrays, CD36, Pnlip, IGF-1, tissue-protective cytokines, repair, ERK1/2
Citation: Gyetvai G, Hughes T, Wedmore F, Roe C, Heikal L, Ghezzi P and Mengozzi M (2017) Erythropoietin Increases Myelination in Oligodendrocytes: Gene Expression Profiling Reveals Early Induction of Genes Involved in Lipid Transport and Metabolism. Front. Immunol. 8:1394. doi: 10.3389/fimmu.2017.01394
Received: 06 September 2017; Accepted: 09 October 2017;
Published: 26 October 2017
Edited by:
Fulvio D’Acquisto, Queen Mary University of London, United KingdomReviewed by:
Diana Boraschi, Consiglio Nazionale Delle Ricerche (CNR), ItalySermin Genc, Dokuz Eylül University, Turkey
Copyright: © 2017 Gyetvai, Hughes, Wedmore, Roe, Heikal, Ghezzi and Mengozzi. This is an open-access article distributed under the terms of the Creative Commons Attribution License (CC BY). The use, distribution or reproduction in other forums is permitted, provided the original author(s) or licensor are credited and that the original publication in this journal is cited, in accordance with accepted academic practice. No use, distribution or reproduction is permitted which does not comply with these terms.
*Correspondence: Manuela Mengozzi, bS5tZW5nb3p6aUBic21zLmFjLnVr