 Lydia J. Bradley1
 Amy Ward1
 Madeleine C. Y. Hsue1
 Jian Liu2
 David A. Copland2
 Andrew D. Dick1,2,3
 Lindsay B. Nicholson1*
- 1School of Cellular and Molecular Medicine, University of Bristol, Bristol, United Kingdom
- 2Academic Unit of Ophthalmology, Translational Health Sciences, University of Bristol, Bristol, United Kingdom
- 3University College London, Institute of Ophthalmology, London, United Kingdom
Ocular inflammation imposes a high medical burden on patients and substantial costs on the health-care systems that mange these often chronic and debilitating diseases. Many clinical phenotypes are recognized and classifying the severity of inflammation in an eye with uveitis is an ongoing challenge. With the widespread application of optical coherence tomography in the clinic has come the impetus for more robust methods to compare disease between different patients and different treatment centers. Models can recapitulate many of the features seen in the clinic, but until recently the quality of imaging available has lagged that applied in humans. In the model experimental autoimmune uveitis (EAU), we highlight three linked clinical states that produce retinal vulnerability to inflammation, all different from healthy tissue, but distinct from each other. Deploying longitudinal, multimodal imaging approaches can be coupled to analysis in the tissue of changes in architecture, cell content and function. This can enrich our understanding of pathology, increase the sensitivity with which the impacts of therapeutic interventions are assessed and address questions of tissue regeneration and repair. Modern image processing, including the application of artificial intelligence, in the context of such models of disease can lay a foundation for new approaches to monitoring tissue health.
Introduction
Ocular inflammation is an important medical concern with a wide range of manifestations from the easily treatable to sight threatening. It arises both as an ocular specific condition and in association with systemic disease and it manifests as more than 30 defined uveitic phenotypes. The pathogenesis is complex and multifactorial and there is a lively debate as to the relative contribution of subclinical infection, autoinflammation and autoimmunity (1, 2). Conventional approaches to imaging do not distinguish between these different causes.
Animal models of uveitis are often autoimmune (e.g. experimental autoimmune uveitis; EAU), inspired in the mouse by early work identifying susceptible strains (3, 4) and used widely to probe important aspects of immune function including tolerance (5, 6), regulation (7, 8), microbiome (9), lymphocyte dynamics (10) and macrophage/monocyte function (11). But other models of ocular inflammation are also important, including endotoxin induced uveitis (EIU) (12–14) and primed mycobacterial uveitis (PMU) (15). Ocular infectious disease can also be studied and has proven to be an informative model of inflammation (16–18).
Over the last 15 years, techniques for imaging the mouse retina have advanced substantially, first with fundal photography, acquired by topical endoscopic fundal imaging (TEFI) (19–21) facilitating clinical grading by individuals blinded to the origin of the images. Then followed by adaptation of clinical tools (12) and development of the Micron system for imaging rodent eyes (Phoenix technologies, CA). These advances have made acquisition of experimental image data more accessible and routine (12, 22–24). The application of optical coherence tomography (OCT) to the mouse eye adds new information on changes deep in the tissue. The eye offers unique advantages for imaging studies of the autoimmune process in a target tissue, permitting serial assessment, and sophisticated quantification of different parameters of inflammation that go beyond more general clinical scores used in models such as experimental autoimmune encephalomyelitis.
Advances in image processing that have been developed in patient populations can also find application in experimental studies. There is potential for automatic segmentation of structures (in which the boundaries between, for example, different layers of the retina are identified in an unsupervised process), quantification of infiltration and disease classification by machine learning, which can be used to support unsupervised clinical assessment (25, 26). This is seen in the recent application of deep learning to EAU (27). Alternative powerful technologies are also available; using bioluminescent reporters, can delineate sequential cell population specific patterns of infiltration (28, 29), and multi-optical imaging approaches can produce data on phenotype and the spatial relationship between different cell types (30). Objective measurements, that provide a more granular multi-modal analysis of the state of the tissue, can then form the basis for quantifying the impact of treatment on ocular disease not limited to a single time-point but integrated across a longer disease course.
Ocular Tissue and Inflammation
EAU is often studied with a focus on the acute inflammation that occurs with the explosive influx of immune cells that flood into the tissue in the first wave of clinical disease. But it has been apparent for a number of years (31, 32) that it can also be used to develop insights into the processes of persistent disease and tissue remodeling. For example, memory cells that reside in the bone marrow are implicated in chronic retinal degeneration (33) and persistent inflammation can lead to retinal angiogenesis (34). In both mouse (35) and human (36), chronic disease can drive the development of ectopic lymphoid like structures and is accompanied by changes in the other lymphocyte populations and vascular remodeling (10, 34). The ocular tissue can therefore exist in a minimum of four well demarcated states (Figure 1).
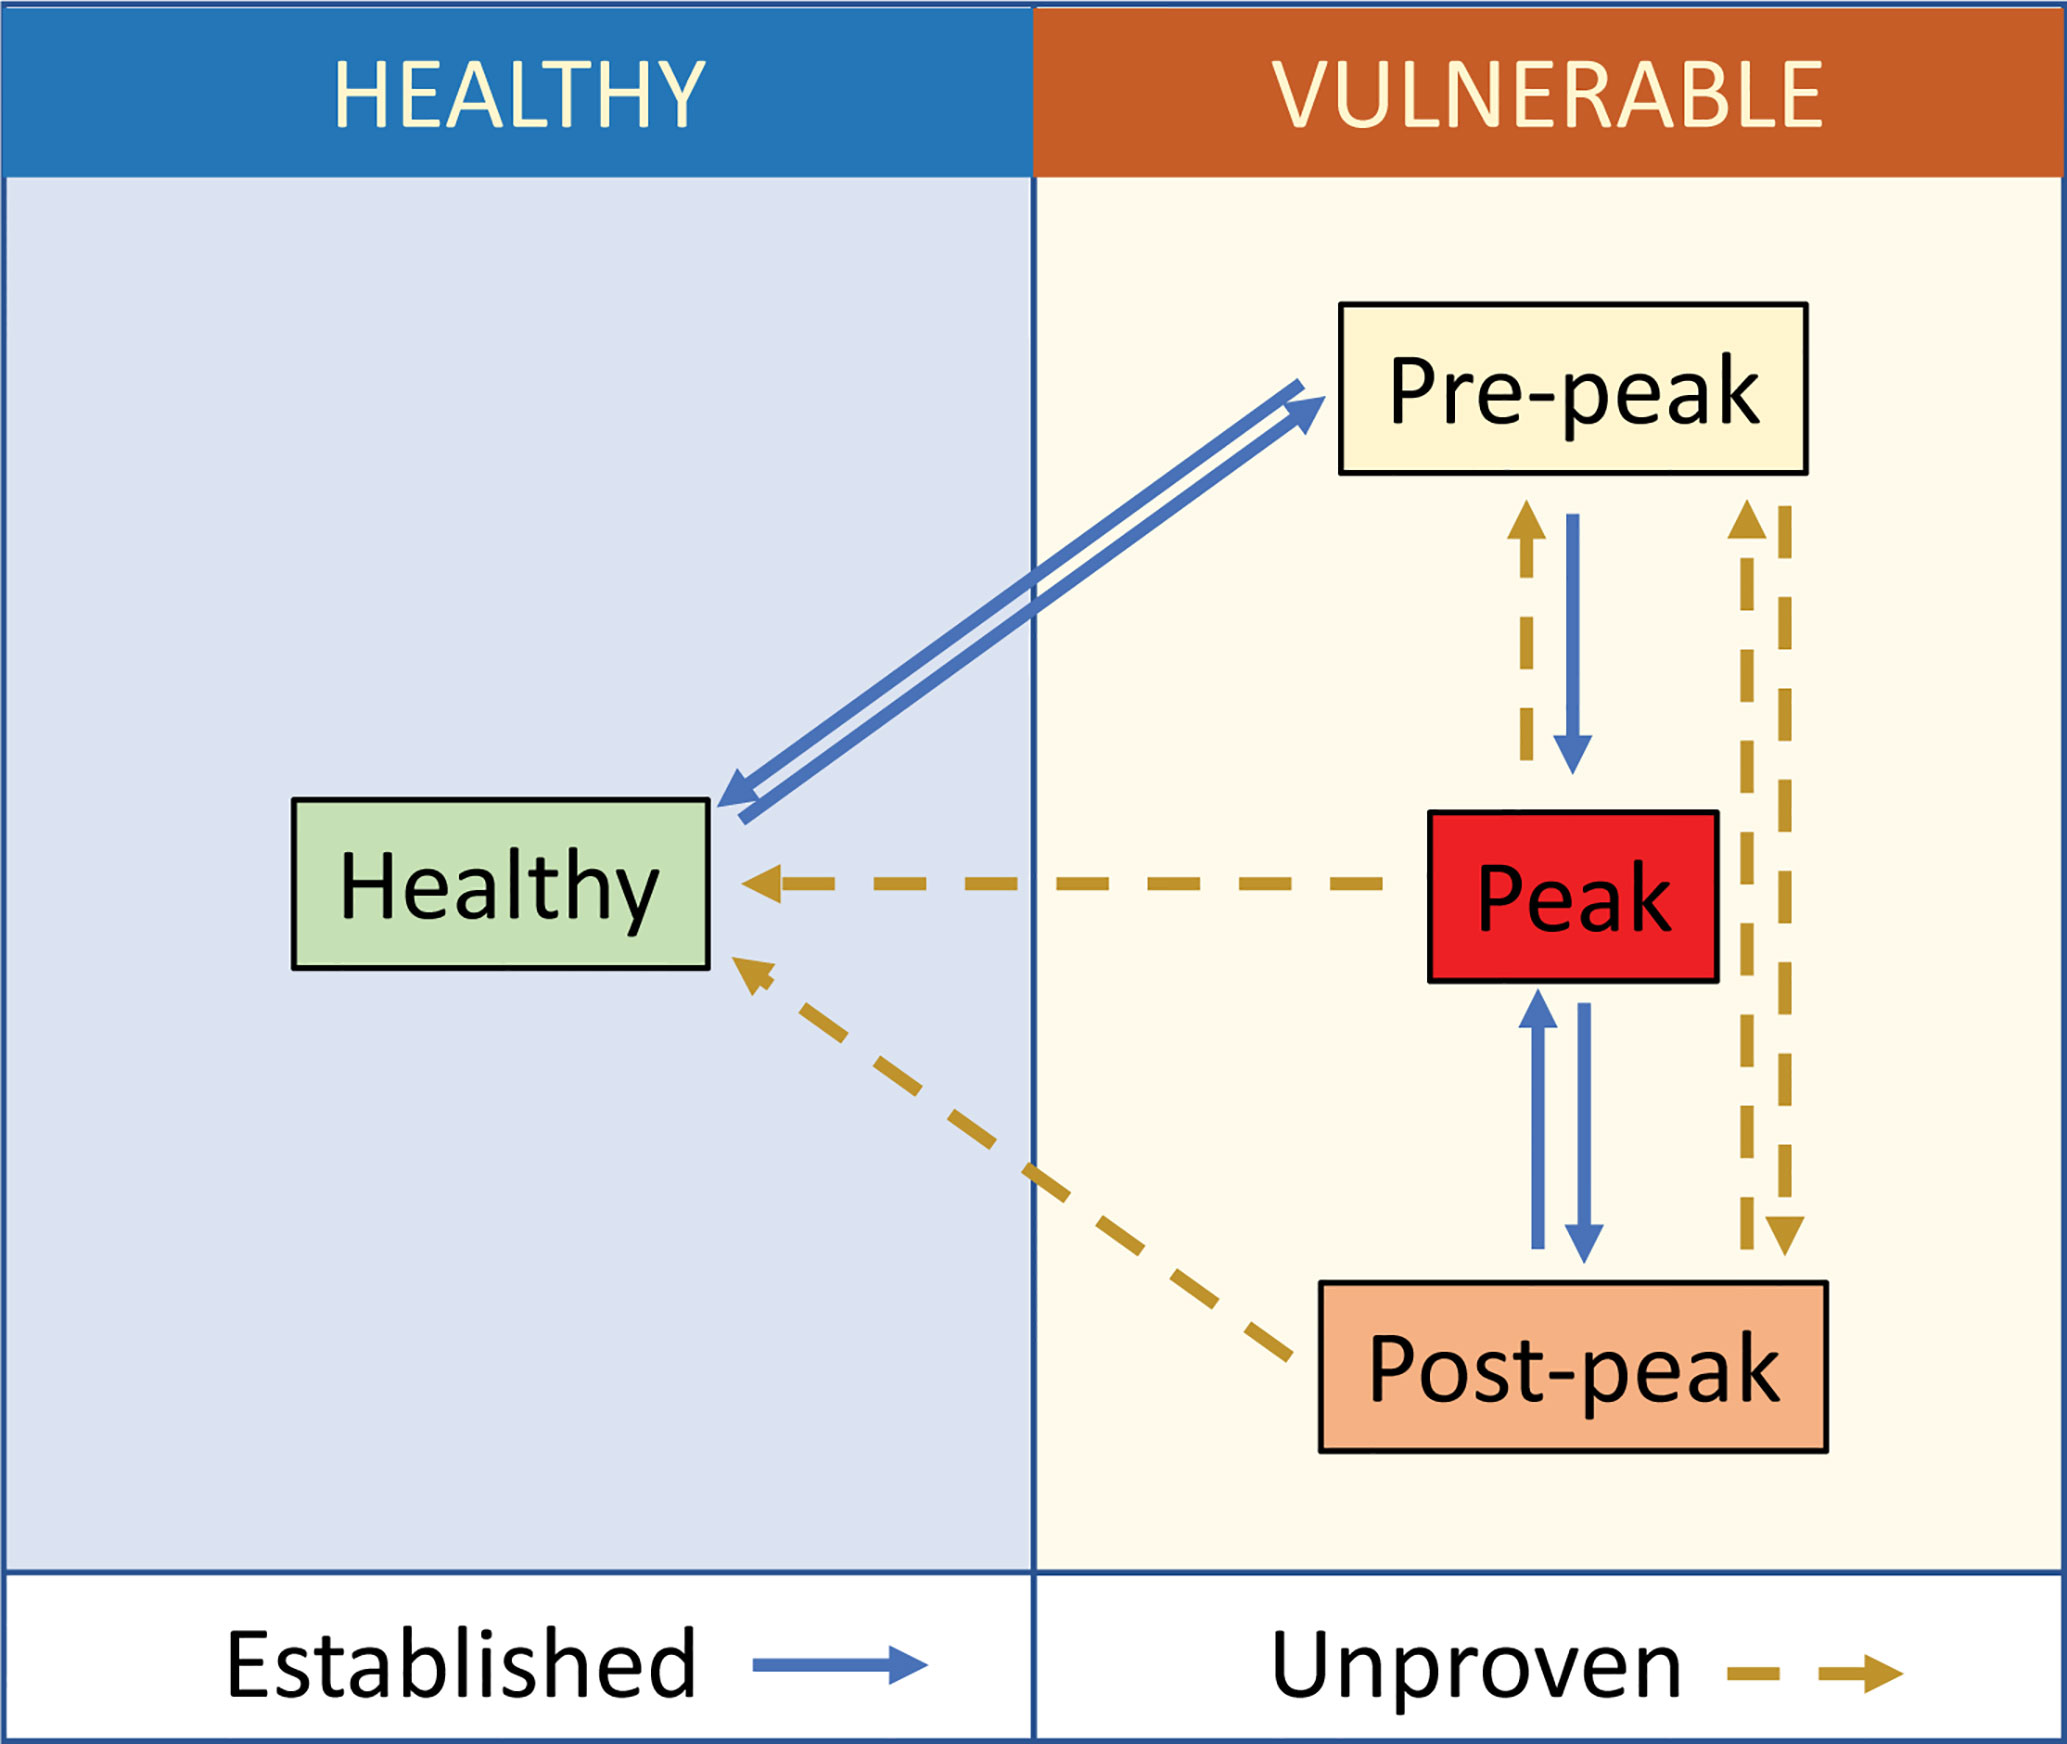
Figure 1 Tissue states in ocular inflammation. Healthy ocular tissue is ‘immune-privileged’ and under low-level immunosurveillance. Specific (ocular antigen driven) and non-specific (extra-ocular inflammation) stimuli disturb this homeostasis and increase interactions across the blood retinal barrier making the tissue more vulnerable to the development of disease. In uveitis following active immunization, this starts with the prodrome (8), which can resolve back to the healthy state. When the prodrome progresses to clinical EAU in immunocompetent animals, there is an influx of cells to a maximum (peak) followed by a reduction in immune cell content, which does not return to base line. The post-peak (in EAU described as secondary regulation) is distinguished from the pre-peak by changes in the relative proportion of different lymphocyte populations (CD4 T regulatory cells, CD8 T resident memory cells). There is currently no evidence that disease proceeds directly from pre-peak to post-peak, nor that eyes that have reached peak disease ever return to the normal healthy state.
Healthy tissue resists insult and maintains normal visual function. In the EAU model, there are a minimum of three non-healthy states, which correlate with changes in immune cell content and vascular function (31). Vulnerable tissue may be in the prodromal phase of EAU, at peak of disease, with active infiltration by many different leukocytes, or vulnerable but to a greater or lesser extent recovered, which state is described as post-peak. It is possible to observe experimentally that the pre-peak state can resolve to a state of health, or progress to peak disease. Tissue can reach peak disease from either the pre-peak state or as a relapse from the post-peak state (37). But it is unknown whether from peak or post-peak, tissue can ever return to a healthy state. In the broader context, a useful framework for these changes is found in the extensive literature describing the development and resolution of inflammation, but here too, the question of active resolution in the tissue and the mechanisms by which it occurs remains controversial (38). While this review focuses studies in the eye, it is evident that other diseases and disease models, such as arthritis, can be fitted into a similar framework (39).
One essential tool for advancing understanding of these different tissue states is a rigorous method of clinical assessment that separates healthy tissue from the vulnerable and that also distinguishes between different states of the vulnerable tissue. Such a scheme could then complement studies describing gene expression in different forms of ocular inflammation (13, 40). Recent advances in the range and quality of techniques that can be applied to quantify ocular inflammatory disease make such objective and transferrable assessments increasingly feasible.
Assessment of Ocular Inflammation
The measurement of inflammatory activity is a core objective for clinical studies of uveitis and has inspired work that seeks to improve its ability to discriminate between lower levels of disease as well as improving its sensitivity (41). Progress in this area can also inform animal studies.
Clinical Scoring
In human eye disease, improvements in imaging have driven diagnostic sensitivity and specificity (42, 43). Scoring systems serve as tools for categorizing disease activity into ordinal groups and as a convenient measure of clinical outcome and directional change. The first aqueous and vitreous inflammation scoring systems based on ophthalmic observation of cell counts in patients were published in 1959 (44, 45), but consensus recommendations did not emerge until 2005, under the umbrella of the Standardization of Uveitis Nomenclature (SUN) workshop (46). For some diseases, for example Behçet’s disease, specific scoring systems have proven useful is assessing treatment response (47). It is a recognized concern with scoring systems that there is a tension between precision and simplicity. Levels of interobserver agreement remain modest and non-linearity in the scaling can lead to poor resolution of differences in disease especially at lower levels of inflammation (48–50). The use of digital images, where biological data is quantified as pixel values, expands the possibilities for analysis by computer imaging (25) for example for automated grading of vitreous haze (51). Scoring of clinical disease in EAU has evolved from early approaches using slit-lamp aided visualization and semi-quantitative histological scoring to more sophisticated scoring approaches based on blinded assessment of fundal photographs (20, 21, 23, 52, 53) and most recently using machine learning. Scoring can be on a simple ordinal scale (0–4) or can categorize disease into three indicators of inflammation and one of structural damage with inflammation and structural damage reported independently or as a summary score (0–5) calculated as the total or average score for the eye (10, 21, 54) (Table 1). When applied as a summary score, this approach can be insensitive to differences in aspects of the underlying pathology, for example in Figure 2, the two images, although clearly different, received the same summary clinical score.

Table 1 Scheme for scoring clinical ocular inflammation.
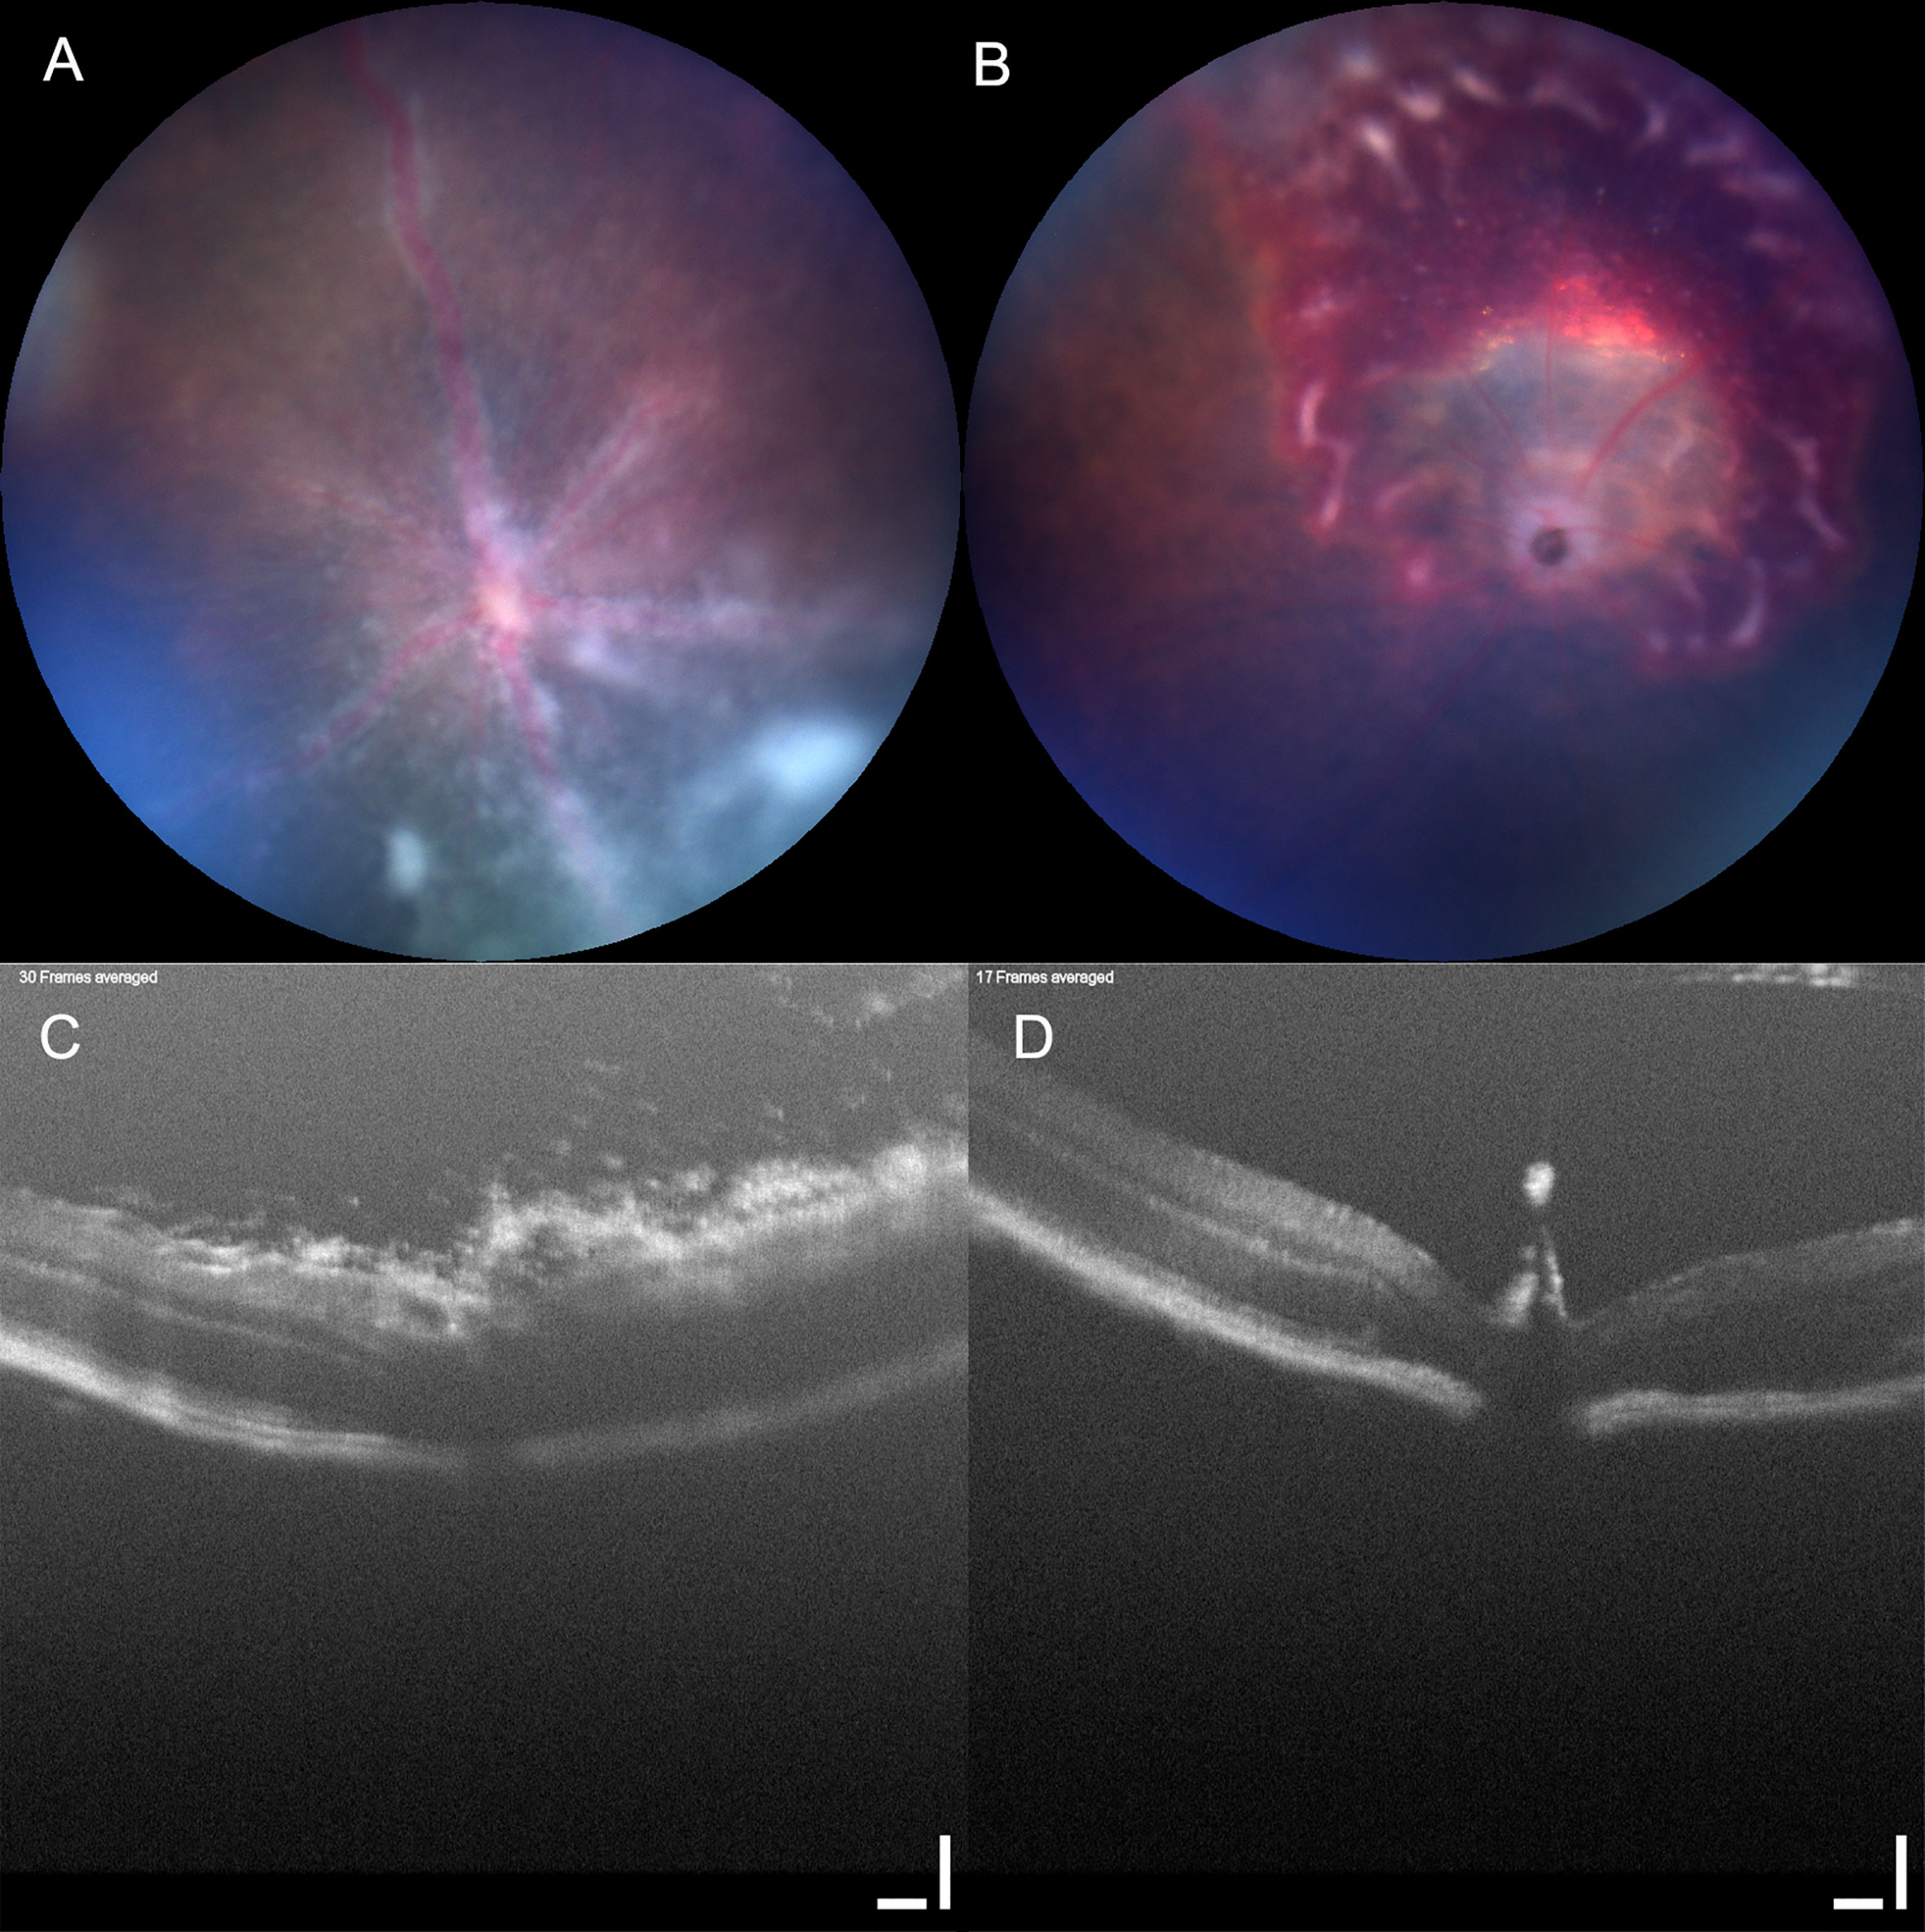
Figure 2 Clinical score can be insensitive to underlying pathology. Mouse eyes imaged using Micron IV with OCT (Phoenix technology group, CA). Two mouse eyes (A, C) and (B, D) imaged using Micron IV (Phoenix technology group, CA) and assessed by fundal photography (A, B) and OCT (C, D). Retinal photographs scored in a set of images by an observer blinded to the treatment groups, both received the same summary clinical score. Scale bar 100 µm.
Complementing photography is optical coherence tomography (OCT). Developed in the 1990s (55, 56) it has rapidly become the state of the art for non-invasive retinal imaging. OCT is an interferometric technique providing depth resolved cross sectional images of the retina, known as B-scans. In normal eyes the vitreous is optically transparent, retinal layers show different degrees of backscatter, and in humans the RPE is one of the most hyper-reflective layers. Modern OCT in humans can also go some way to visualizing the choroid beneath the RPE (57). OCT can resolve retinal substructure and its vasculature, can be important in the diagnosis and image guided management of human uveitis and can capture changes in the state of the tissue through time in EAU (12, 24, 58, 59).
Ocular Tissue Analysis
In contrast to the wealth of sophisticated imaging that can be directed at the human eye in uveitis, access to human tissue is severely limited. Enucleation of the globe in uveitis is rare and is usually from individuals with long-standing disease (36). But in the EAU model, histology was the first accepted standard for disease assessment (60–62). Immunohistochemistry and immunofluorescence of retinal tissue revealed the profound structural disruption that accompanies acute inflammation, and was used, for example, to show how macrophages reciprocally alter their expression of CD68 and arginase-1 during the persistent (post-peak) phase of uveitis (34). For higher dimensional analysis of cell infiltrate, investigators have used multiparameter flow cytometry which can quantify many different cell populations (8, 63, 64). Sampling the cell infiltrate at different time points has been instrumental in demonstrating important changes in the relative frequencies of CD4 T regulatory cells (65) and CD8 cells (10). In EAU this is strong evidence that at the cellular level as well as in serial imaging studies, the tissue and the immune infiltrate change and adapt through time. Developing improved quantitative methods to assess tissue health in EAU offers more sensitive and specific approaches to analyze the impact of therapies for autoimmunity and inflammation.
Quantitative Assessment of EAU
Using formal criteria, EAU can be assessed semi-quantitatively, but interobserver disagreement and subjectivity limits the usefulness of direct comparison between results from different labs and even individual researchers (21). As with human clinical graders, experience is required to achieve the highest levels of interobserver agreement (66). Employing contemporary technology has the capacity to improve on these limitations. In addition, in EAU as in other medical images, these can be annotated, with the results of end point tissue analysis added to the meta-data associated with the image. This enriches their interpretation and provides a resource that can be applied to other studies. Pooling data from animal cohorts at selected timepoints runs the risk of obscuring subtle patterns, and overweighting the importance of the certain trends. This can be countered by the use of analysis that exploits modern image processing, with its scope for a higher degree of quantitation (66–68). A critical element of complementary analysis is therefore the use of non-invasive techniques and computational means to maximize information retrieved from the data.
Fundus photography, for example obtained by TEFI, correlates well with disease scores from histopathological analysis (20) but the images produce a 2D projection of 3D semi-transparent biological tissue. Spatial information is only available in two dimensions and artifacts are introduced by flattening depth information onto a plane. More accurate measures of infiltrate, oedema and structural changes, that are important manifestations of disease, can be obtained with OCT (24, 59). Because OCT produces a depth profile of different features, it can be more sensitive than 2D fundus imaging in monitoring the appearance and development of pathological changes. In particular, cross sectional images are more sensitive to early disease because they can visualize small amounts of infiltrate around the optic nerve, and measure changes in optic nerve diameter and retinal thickness due to inflammatory oedema (23, 59, 66, 68).
Aqueous and Vitreous Assessment
A defining characteristic of uveitis is cellular infiltrate, and grading is an important quantitative metric in preclinical animal model research. In human disease, anterior uveitis produces ‘flare’ which can be categorized by laser flare photometry and which correlates well with conventional clinical grading (69, 70) while in the vitreous, ‘haze’ is an accepted and clinically validated proxy for inflammatory status in patients (51). Moreover, these changes have a marked impact on visual acuity in humans and so are biologically and clinically relevant outcome measures (50).
In OCT, cells in either chamber appear as hyperreflective dots, whose profile is a function of many variables (71–73). Cells and exudate incrementally reduce the optical transparency of the ocular media leading to the aqueous and vitreous becoming inhomogeneous as disease severity increases. These changes reduce the contrast of object boundaries and the results of qualitative or quantitative image analysis lose precision.
Because of difficulty in imaging the anterior chamber of small eyes, literature for OCT based cell counting in these models is relatively sparse (74). However, automated counts of absolute cell numbers have been obtained with excellent correspondence to manual image counts. This approach has been developed into a fully automated pipeline for cell counting in volumetric OCT images, achieving 98% congruence to manual slit lamp counts. Importantly, the subjective manual element of the segmentation step was eliminated. The automated segmentation step involved removal of anatomical structures connected to image boundaries (75). Compared with counts from histological sections, OCT tended to undercount, which was attributed to insensitivity to cell clumps, sediments and exclusion of the extremities of the iris interface (74). It may also be contributory that histology is unaffected by overlying opacities, whereas OCT is vulnerable to signal degradation. However, histology introduces artifacts and postmortem changes that themselves affect tissue measurement (74).
Loss of precision becomes more evident when imaging the vitreous, where the optical pathway traverses deeper through affected media. Further complicating the analysis of the rodent vitreous, is the anatomical vestige of the hyaloid artery (71, 76), protruding upwards from the optic disc towards the lens. It confuses the vitreoretinal boundary and can appear somewhat discontinuous, with hyperreflective regions that are subjectively indistinguishable from cell clusters.
Automated counting algorithms usually require a preceding segmentation step, that defines a boundary for the area or volume of interest. Variations in signal quality and the ambiguity of discontinuous image features frustrate the development of accurate, fully automated methods of rodent image segmentation and analysis. Quantification of changes in the vitreous has largely been restricted to human images, and global signal parameters, as opposed to absolute cell counts.
To account for signal strength variations in human OCT images, the average intensity of the segmented vitreous compartment can be indexed relative to a hyperreflective reference layer such as the RPE, providing a relative intensity ratio. These ratios correlate moderately with clinical vitreous haze scores, along with other surrogates of disease such as retinal thickness (72, 77). This process has been fully automated using rule-based algorithms for segmentation, reducing subjectivity. The same operation was also performed using a textural descriptor of the vitreous, which was marginally better correlated to clinical scores than vitreous intensity (73). These operations were performed on 2D datasets, obtaining an averaged intensity ratio based on several B-scans and data analyzed in 3D may potentially offer further improvements.
Since the scan region is much smaller than the ocular globe, one consideration is the selection of a representative and informative region of interest (ROI) that must be equivalent between scans and subjects. Within human images, landmarks such as the macula can be located automatically and used as a central anchor point for region boundary positioning (73). In rodents, the optic disc is an obvious landmark choice, but the presence of the hyaloid remnant, particularly in severely diseased eyes warrants additional steps to remove its influence. Recently, an automated method of quantifying vitreous inflammation in clinical fundus photographs has been suggested (50, 51).
Retinal Layers
OCT of the healthy retina produces good definition of the different layers of light sensitive tissue. In uveitis it can resolve and localize lesions and pathologies, and identify vasodilation and perivascular exudate (24, 59). Standard clinical OCT has an axial resolution of less than 4 microns, which can produce images with near histological detail. Thickness is ascertained from OCT images by measuring the distance between two boundaries of choice (Figure 3). Before measurements can be taken, the layers must be defined.
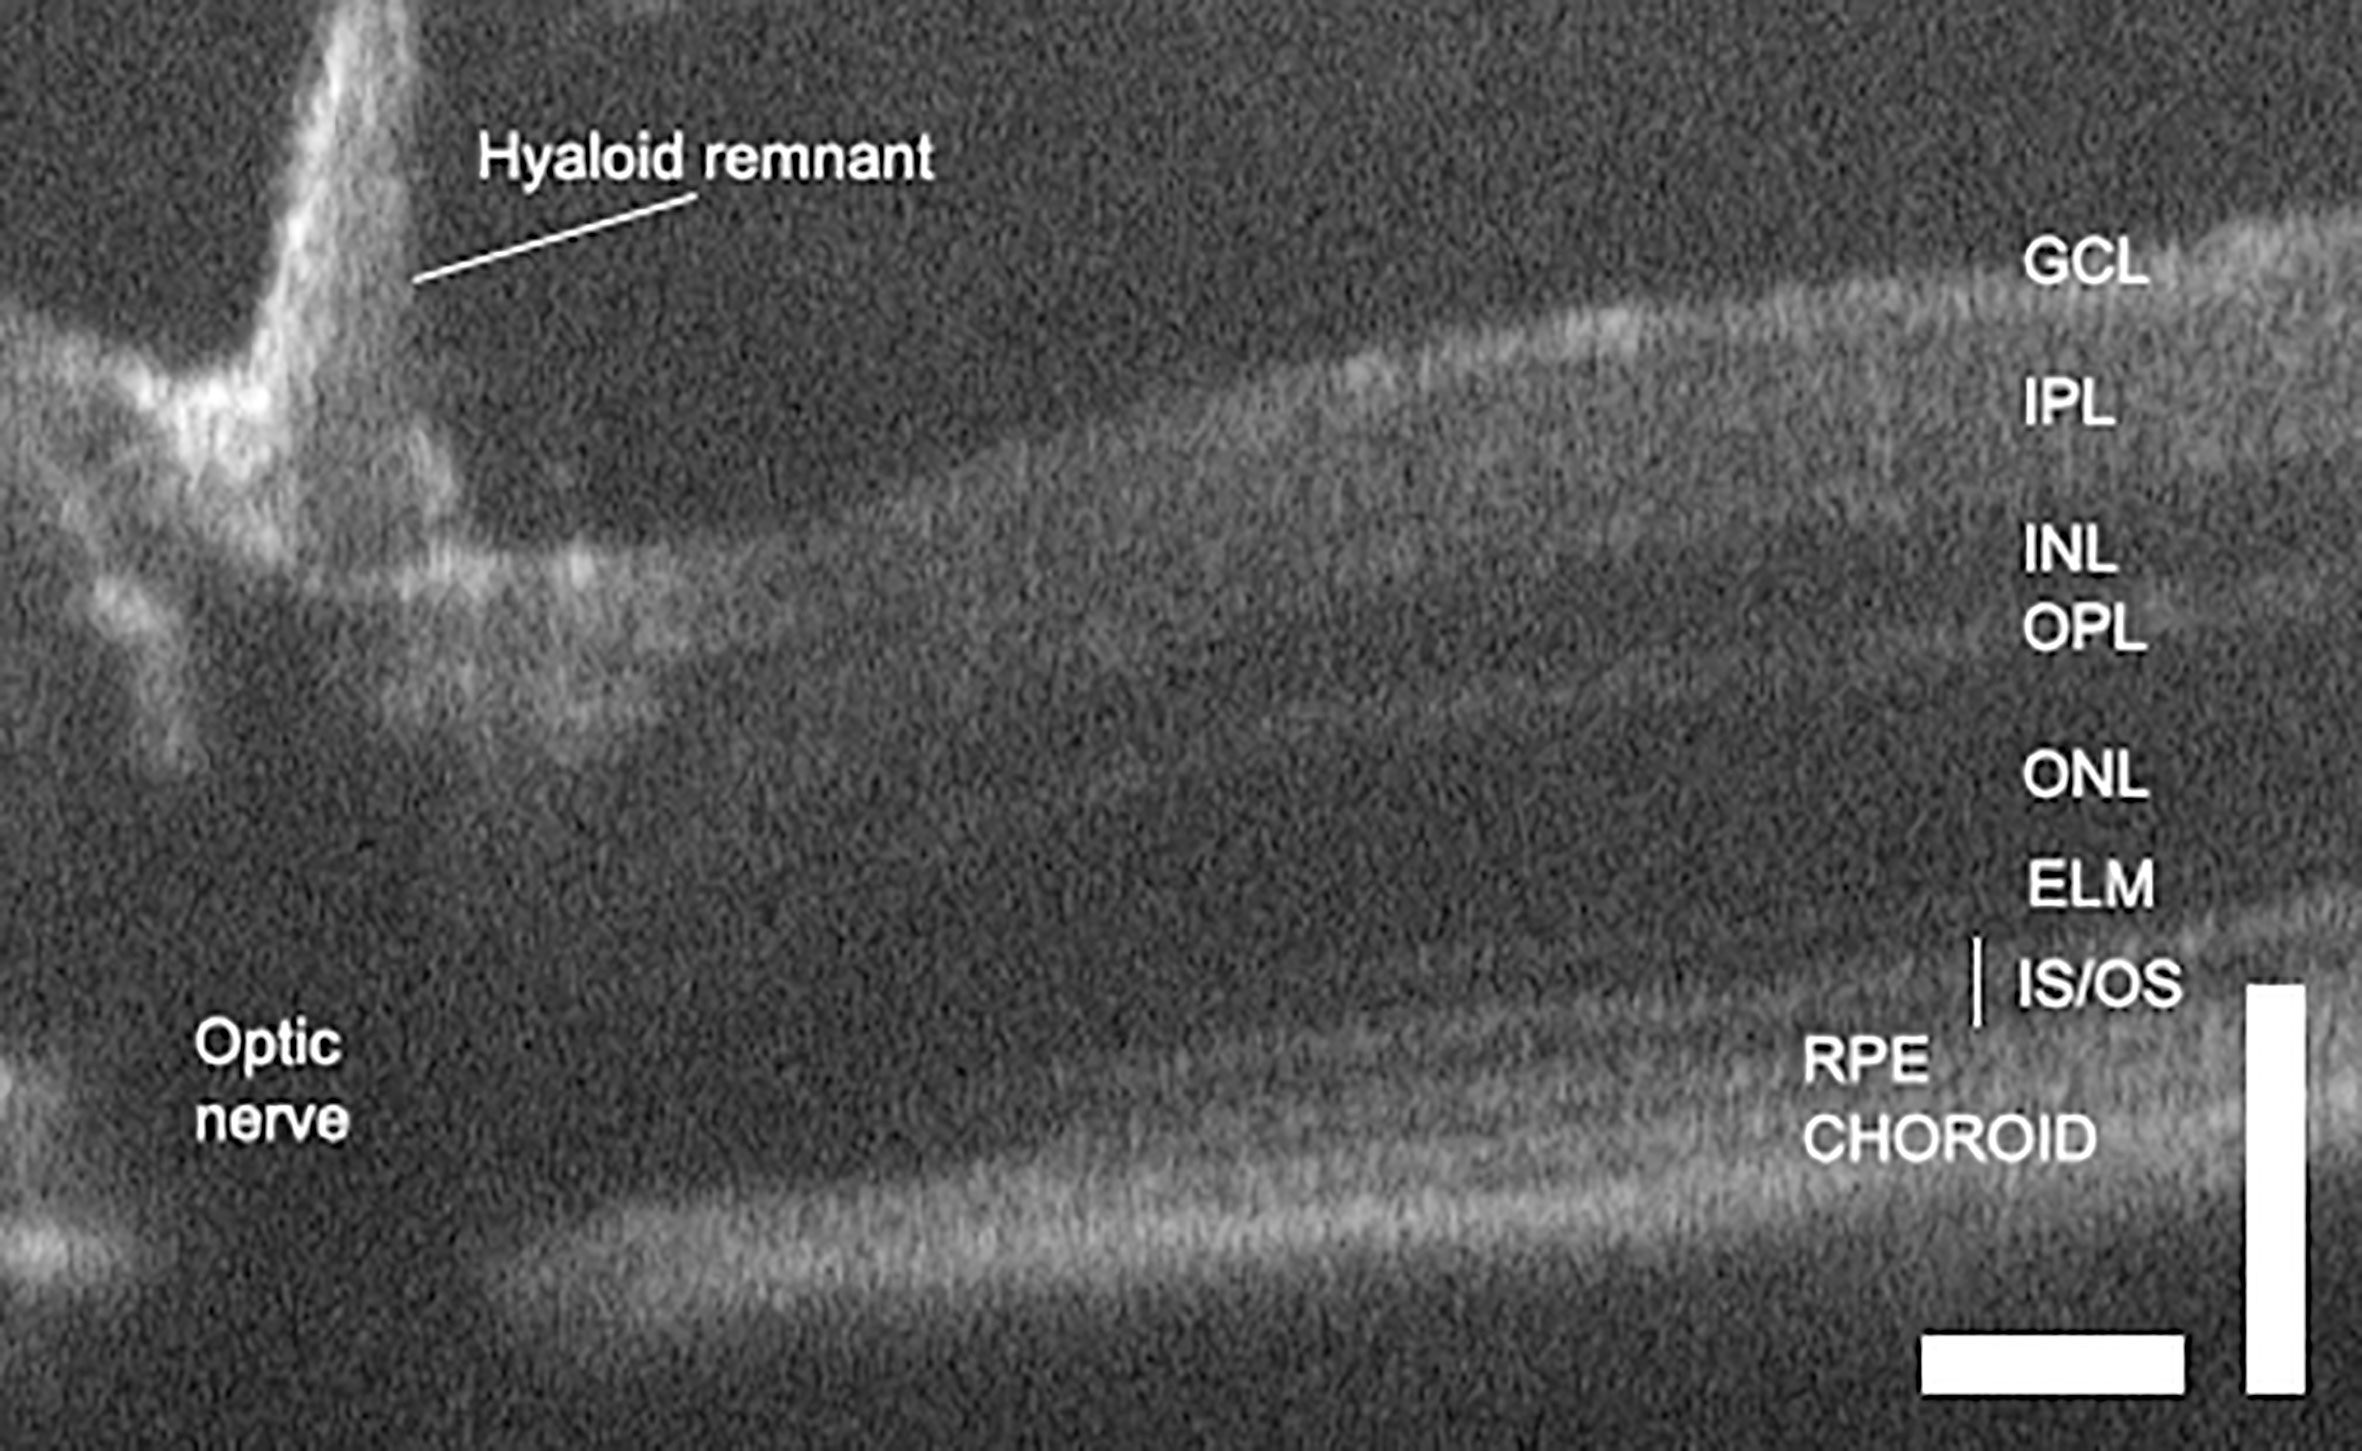
Figure 3 OCT of the normal mouse retina delineates layers and allows retinal dimensions to be quantified. Scale bars are 100 microns and illustrate differences in axial and lateral resolution. GCL, ganglion cell layer; IPL, inner plexiform layer; INL, inner nuclear layer; OPL, outer plexiform layer; ONL, outer nuclear layer; ELM, external limiting membrane; IS/OS, inner and outer segments; RPE, retinal pigment epithelium (68).
Techniques for segmentation to define different retinal layers have progressed through manual, semi-automated and fully automated protocols, with work on human data leading rodent OCT imaging. Both rule-based algorithms and learner-based approaches have been applied to the problem and new approaches are under active investigation. Retinal thickness can be measured by OCT absolutely, using assumptions such as an average tissue refractive index (78), or by fold change compared to pre-disease measurements (66). Both are in high agreement with histological measurements (24, 59, 66, 78, 79). Several schemes exist for displaying changes in thickness. One that is commonly used shows thickness at different distances from the optic nerve head (Supplementary Figure 1).
Rule-based methods execute a pre-programmed set of instructions, designed with the expected properties of the image and the desired features in mind. Many image properties can be analyzed, including intensity variation, geometric contours and texture (80–84). The number of segmented layers defined varies between four and nine, and depends on the approach, with the most successful techniques to date being learner models (26, 80, 85–88)
OCT offers the potential of assessing layer deformation without the artefacts that can be introduced by tissue fixation, sectioning and staining (89). Mechanical deformation can also introduce ambiguous artifacts, with likeness to retinal detachments (78), and congenital abnormalities in the retina may also confound the definition of anatomical normality (90). The literature pertaining to automated quantitation of retinal structure is more extensive than that related to infiltrate, because retinal layer changes are associated with a wide variety of ocular diseases (91, 92). The laminated reflectance profile of the retina’s architecture also lends itself to image segmentation and the measurement of quantitative indices such as layer thickness and geometric descriptors. Protocols for automatic layer segmentation developed for human studies have been tested in different mouse strains. These performed well when assessing the inner retinal layers, but were less successful in defining the murine RPE, whose location displaced distally into the sclera (68).
Longitudinal studies of retinal thickness have revealed details about the kinetics of disease progression, with respect to other important manifestations of pathology (59, 66). In the pre-peak to peak phase of disease, retinal thickness increases rapidly due to inflammatory oedema, correlating with inflammatory infiltrate, measured longitudinally by OCT and confirmed by histology (66, 78). In the post-peak resolution phase, the clearance of exudate reveals features on OCT with greater clarity, such as infiltrate, photoreceptor atrophy, retinal folds and choroiditis (59). Photoreceptor damage persists beyond the peak phase of disease as retinal oedema is slower to resolve than inflammatory infiltrate. When the swelling does subside, the retina thins to below pre-disease levels because of photoreceptor loss. OCT confirms that neither infiltrate or retinal thickness returns to baseline in late disease or even after resolution is complete (20, 59, 78). Therefore, quantitative directional changes and relative rates of change between retinal thickness and inflammatory infiltrate can provide an additional metric for disease activity.
In severe uveitis, retinal layers are obscured by opacification of the vitreous and aqueous due to infiltrate and proteinaceous exudate (59) which presents a challenge for scoring systems, that must be robust to substantial signal variation and may need to incorporate metrics of opacity into the model as proxies of inflammation.
Vasculature
Important changes in the vasculature occur in uveitis, including ischemia, neovascularization and retinal/choroidal vasculitis (93). In disease models these are assessed less commonly than structural changes, but as in humans they are often interrogated by angiography. Confocal scanning laser ophthalmoscopy (SLO) can be coupled to fundus fluorescein angiography (FFA) to quantify vessel diameter and leakage in EAU. When average vascular dilation was measured immediately prior to sacrifice and histology, major vessel diameter was well correlated with retina-choroid thickness and with clinical and histological scores. This indicated that inflammatory vasodilation of superficial vasculature was a novel measure of EAU severity (66). Complementary to dye-based angiography are OCT based methodologies. Vascular dilation and perivascular exudate attributed to retinal vasculitis can be localized to specific retinal layers during the course of EAU (23, 59) and OCT has been used for imaging vasculature disturbances, such as choroiditis and retinal vasculitis (43). Blood flow can be visualized and depth resolved (94) using OCT angiography (OCTA) and this has been used to assess retinal microvascular changes (95, 96).
Many methods of segmenting retinal blood vessels from fundus photographs have been published (97). A much smaller number of approaches have been successfully devised using OCT images, which include the use of multimodal imaging (corresponding fundus photographs) and learner models (98, 99). In humans, segmentation of fine capillary networks has been achieved in OCTA enface images (100) while in mice segmentation of retinal vasculature using OCTA has been reported for longitudinal monitoring of angiogenesis (101). Current advances applying deep learning to vessel segmentation continue to improve the performance of these methods and this has been helped by the public access to data sets (102).
Functional
As EAU progresses, electroretinogram (ERG) amplitudes change. There is a dramatic reduction in function (a and b wave), that accompanies early disease (103), presenting before morphologic changes. These findings indicate that functional loss could be mediated by inflammation rather than just physical damage, and that retinal function is potentially a sensitive early indicator (59, 66). However, photoreceptor damage continues while inflammation is receding and in the post-peak phase, ERG amplitudes are correlated with OCT measures of retinal thickness. As swelling diminishes, photoreceptor atrophy becomes apparent and results in an overall retinal thinning compared to baseline. Neither retinal thickness nor functionality ever fully recover (59, 103).
Taken together, multimodal quantitative measures can provide information on perceptually subtle, but biologically significant changes whose quantification would aid clinical grading and pre-clinical research.
Examples of Multimodal Measurement
A multimodal approach to assessing uveitis is outlined in Figure 4. EAU was induced by the transfer of pathogenic autoantigen reactive T cells. Sequential imaging of all eyes was carried out by fundal photography and OCT. B-scans were segmented manually and measured by an observer blinded to treatment conditions. Measurements of retinal thickness were made at baseline from all eyes (n=11) and these were compared as a Z-score expressing the magnitude of change in thickness on day 13 color coded as the number of standard deviations from baseline (Figure 4D). Figures 4A–C shows images from a representative single eye at baseline and day 13. The retinal photographs (Figure 4A) show that at day 13 there is an enlarged optic nerve, sheathing of the vessels due to cell infiltration (white arrow) and infiltrates in the tissue (black arrow). B-scans (Figure 4B) through the optic nerve, were assembled from multiple averaged frames and are displayed with the accompanying 100 micron scale bars that were used to generate measurements of the retinal thickness following manual segmentation using ImageJ (104). At day 13 it is easy to see objects in the vitreous around the optic nerve. The 3D image (Figure 4C) is prepared from 512 sequential B scans, processed using code in MATLAB (Natick, Massachusetts: The MathWorks Inc) and ImageJ (26) adapted for use with murine images and rendered using ImageJ (1.53 3D viewer plugin). These pictures give a better appreciation of the spatial distribution of the vitreal infiltrate and can be used to make a semi-quantitative estimate of the degree of vitreal infiltration.
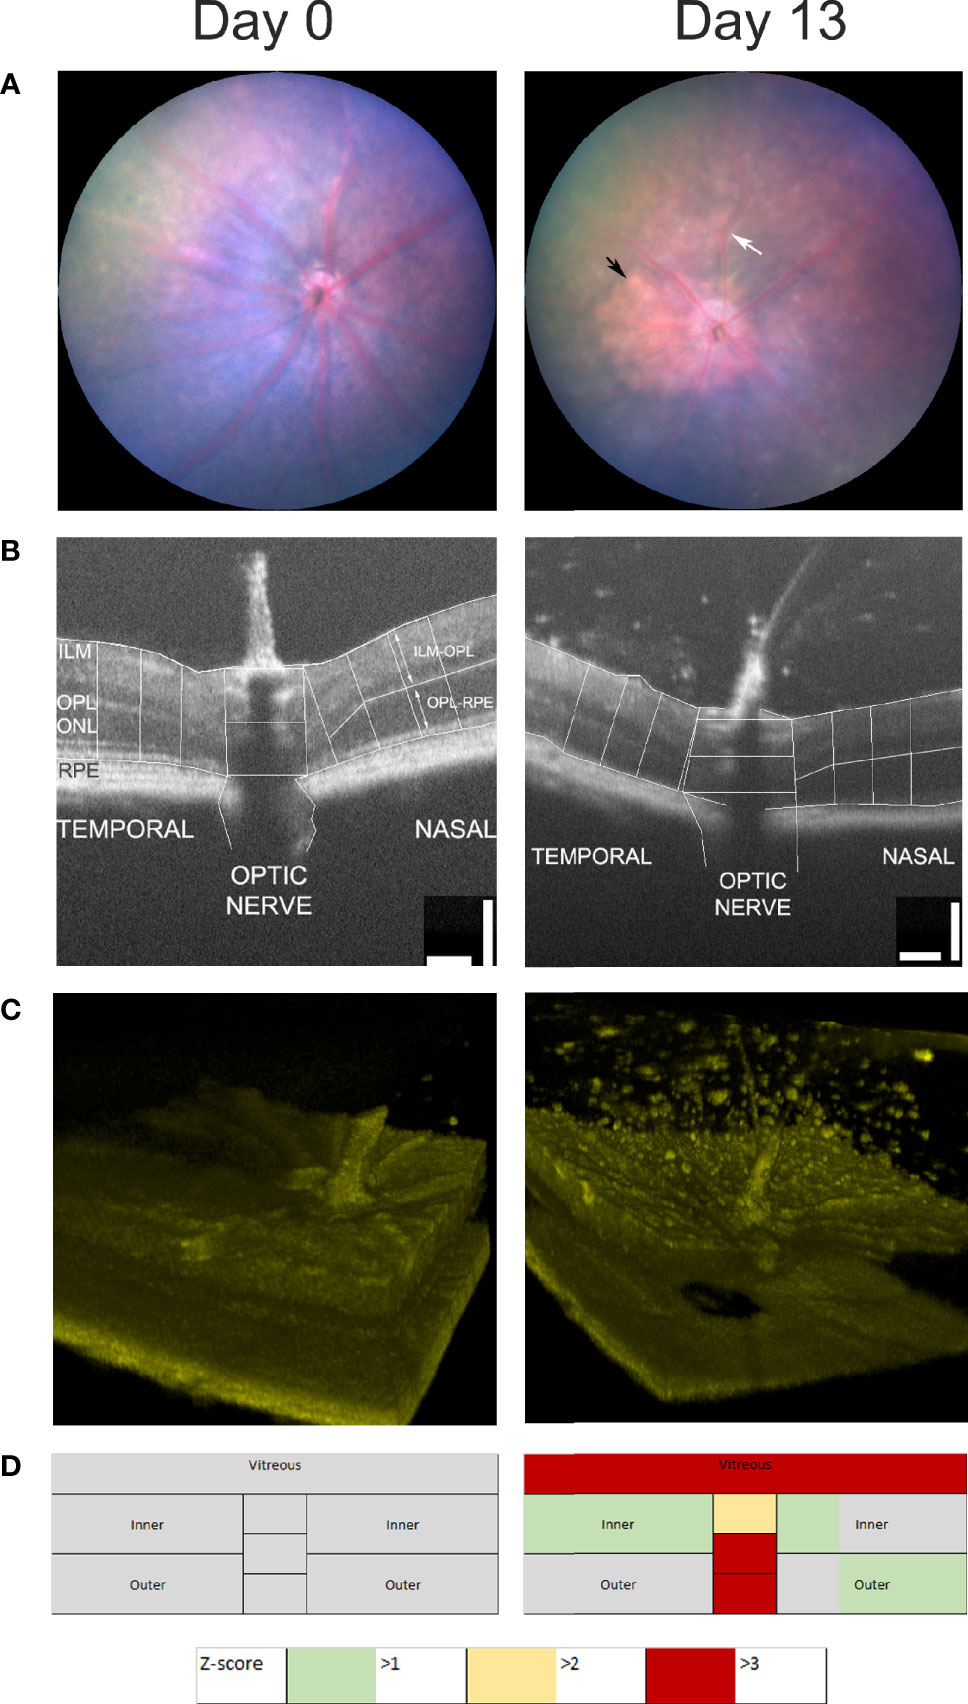
Figure 4 Multimodal analysis of EAU. Mouse eyes were imaged at day 0 and day 13 after the induction of EAU and one representative image of the same eye is shown (A–C). Clinical disease can be assessed by photography (A), measurements of retinal thickness and optic nerve diameter at three points from the temporal, nasal and optic nerve regions of the OCT B-scans (B), 3D-reconstuction of retinal infiltrate (C) and summary data of retinal scores from all groups (D). Summary scores are assembled from unsupervised quantitative assessment of vitreal involvement, manual segmentation and measurement of inner and outer layer thickness and optic nerve diameter transformed and represented as Z-scores.
Following changes in disease scores through time, it is useful to display the aggregate data from the multiple images, and this has been used to produce a color-coded map of the retina, with changes normalized to baseline scans (usually on day 0) and scaled by Z-score. Retinal maps are also useful when comparing the pattern of pathological change between different disease models. For example, compare Figure 4D, which shows that at day 13 the major impact of uveitis is found in the vitreous and the optic nerve with Figure 5 which shows the does dependent effect of intra-vitreal instillation of paraquat, a model of oxidative stress, in C57BL/6 mice. This induces neuronal degeneration which varies with stain (105) and in this case particularly impacts the inner retina, seen as a negative Z-score increasing in magnitude with dose. But quantitative analysis also reveals that at higher concentrations of paraquat, this is accompanied by an expansion of the outer segments, due to inflammation. This finding, using multimodal analysis is in agreement with a previous report showing more pronounced TUNEL-positive cells in the inner retina than in the outer retina of C57BL/6 mice treated intravitreally with paraquat (105).
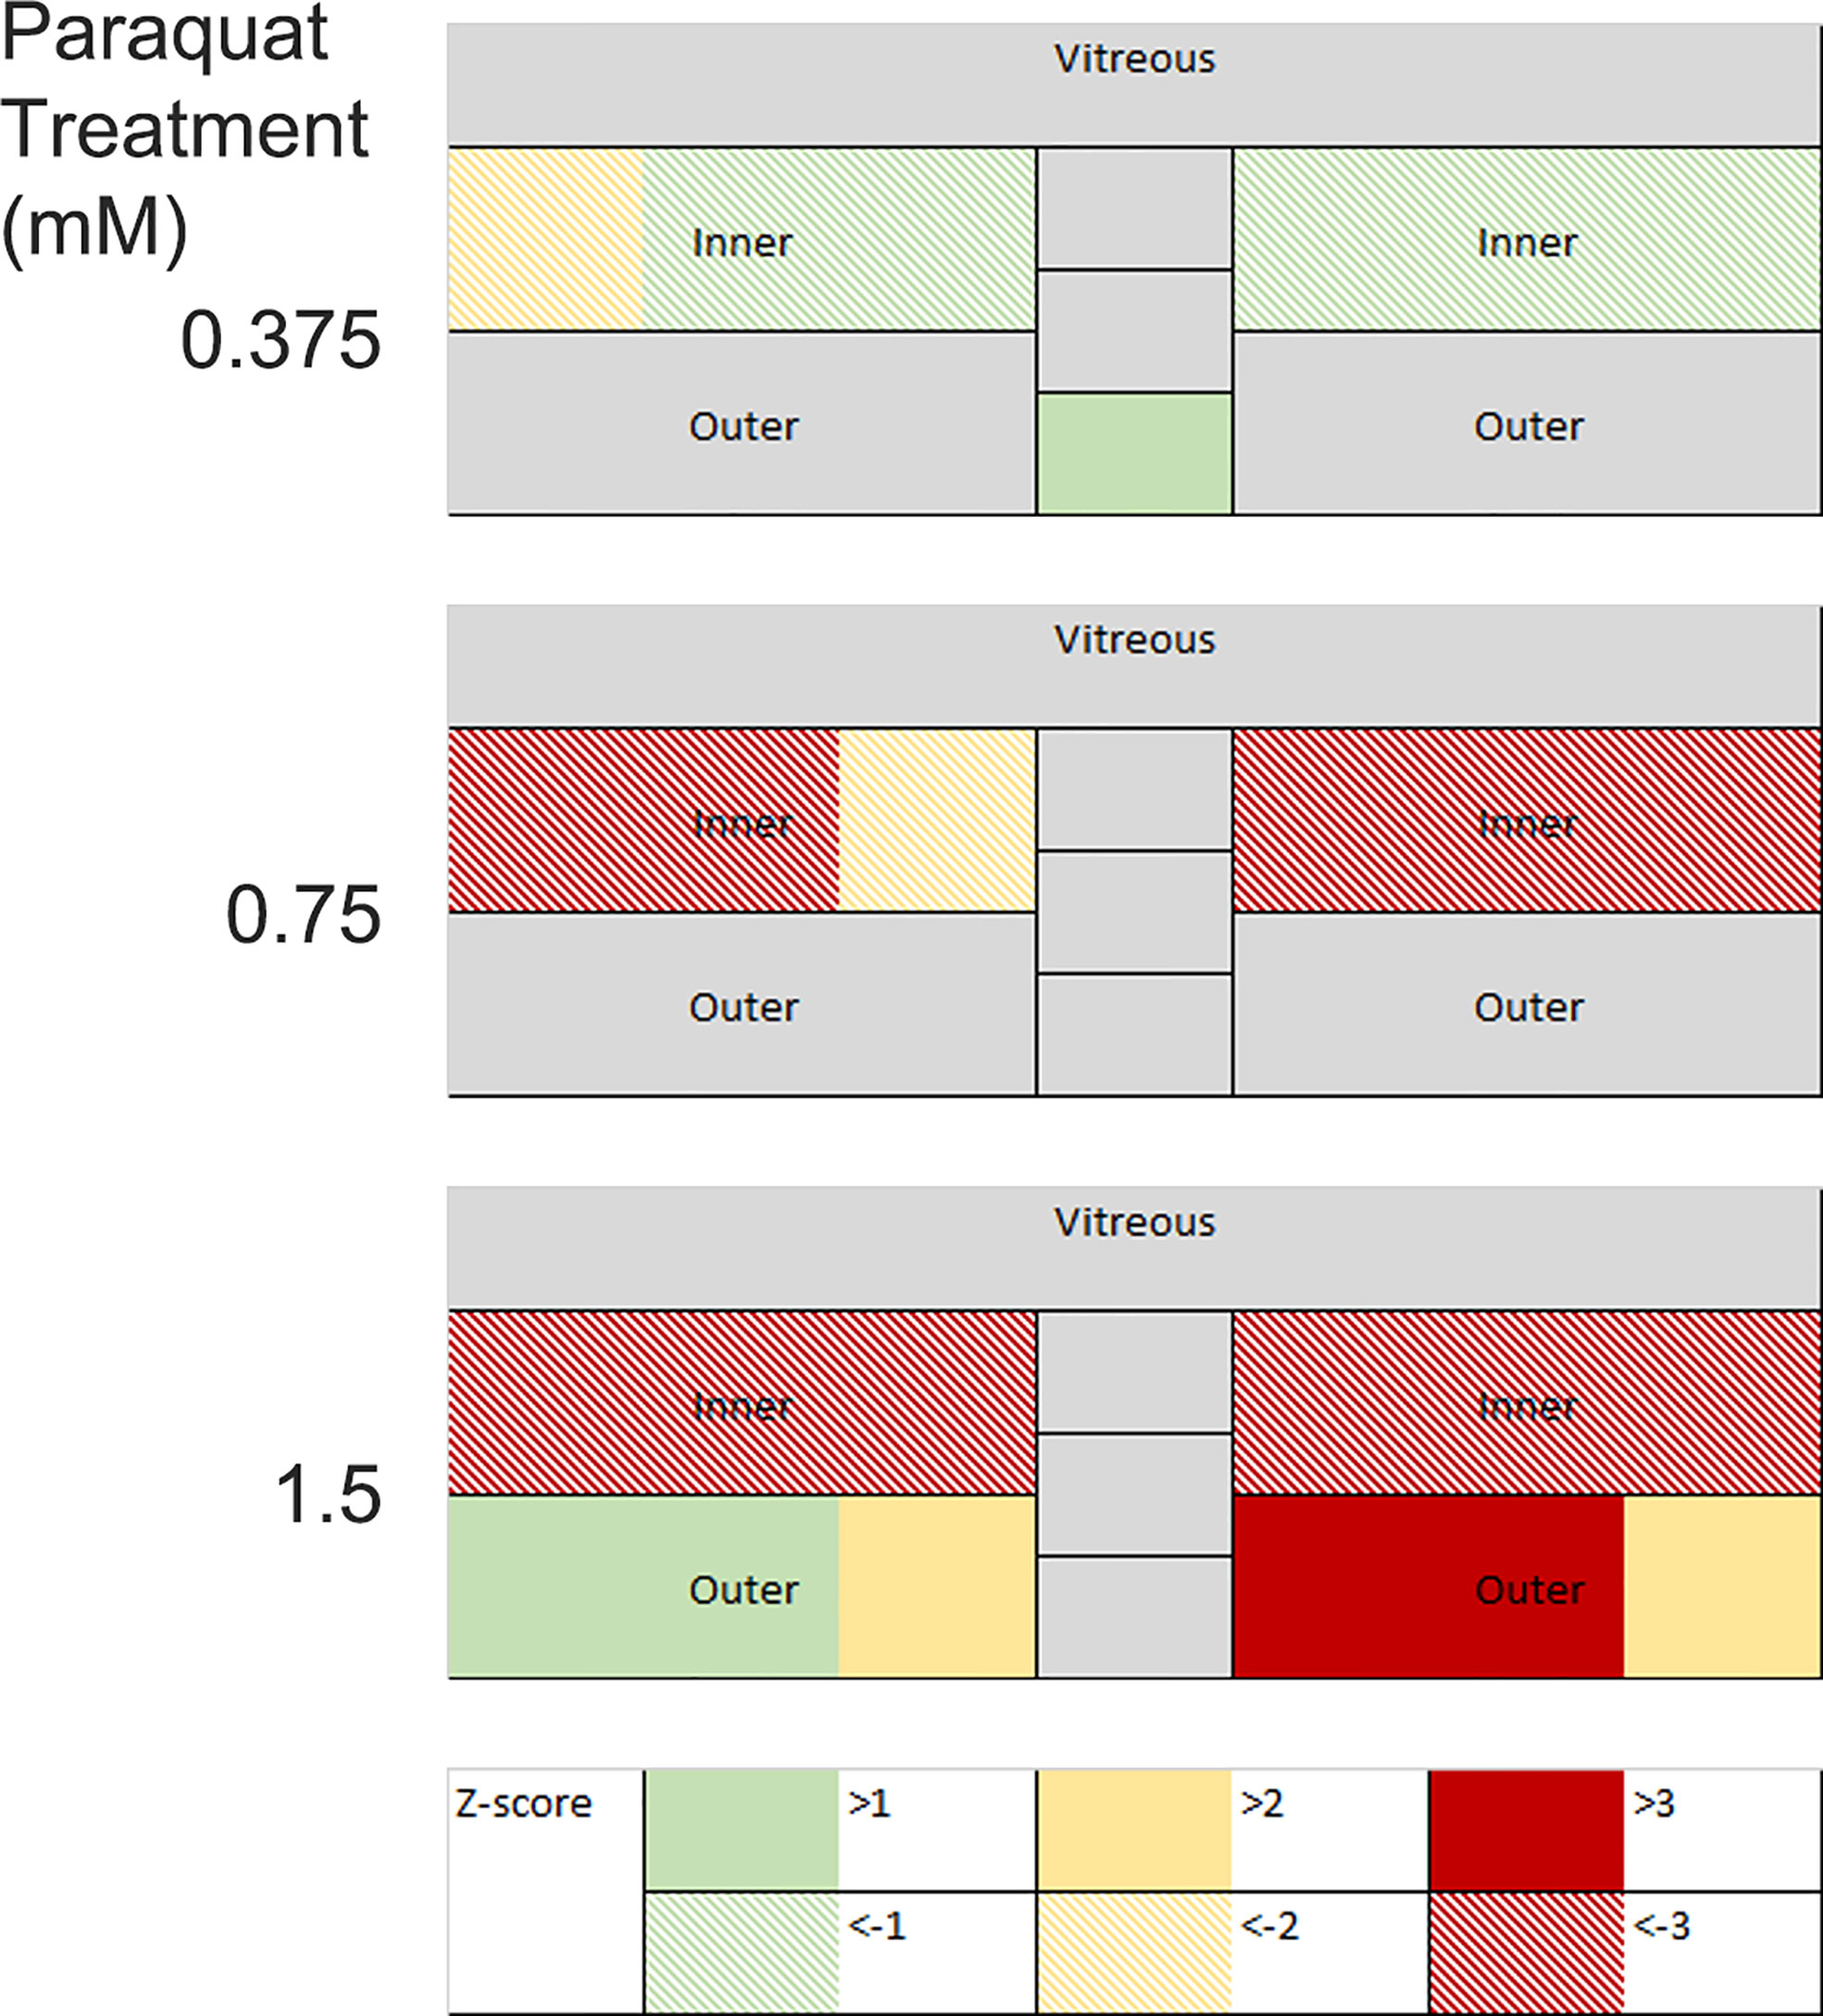
Figure 5 Changes in retinal thickness in mouse eyes following intra-vitreal paraquat instillation were measured on day 10. Images were visualized by OCT, manually segmented, and measured at three points in the temporal, nasal, and optic nerve regions. Measurements are expressed as positive and negative Z-scores relative to a PBS injected control group. Changes in the inner and outer layers are decoupled.
Opportunities for Automation
Machine learning has made an impact in human clinical care in recent years because of its ability to reach expert-level diagnosis. The automated analysis of ocular disease has led the way in carrying these methodologies into the clinic, but they have been less extensively utilized in disease models (106, 107).
Images are inherently data rich because in theory each pixel can be regarded as a separate input parameter (106). This offers opportunities for uncovering novel aspects of pathological processes but also challenges, especially in assembling well annotated data sets that are large enough to avoid overparameterization when they are used to train classification algorithms in a machine learning framework. Advances in predictive statistical methods may in time alleviate the need for such extensive input data. One helpful approach, applied in OCT, is decoupling the methods for segmentation from artificial intelligence driven disease classification (108). This moves practice towards device-independent representation of the disease process, which may aid in comparison between studies carried out by different investigators.
Recently the field has advanced with the application of a deep learning model to analyze photographs of the retinas of mice with EAU. Using a data set of images that was extended by data augmentation, disease images were divided into three categories and by applying deep learning methods (convolutional neural networks) the overall performance assessed by area under the receiver operating characteristic curve (AUC) when the model was applied to an external dataset of 33 images was approximately 0.90 (27).
Another area of opportunity in multi-modal ocular imaging is the fusion of information from different modalities such as fundal photography and OCT (109, 110). Image fusion aims to yield a more complete, accurate and efficient account of an object by combining different visualizations together. Integrating this methodology into the assessment of experimental clinical disease will inform our ability to distinguish between different states of tissue health (Figure 1).
Conclusion
Persistent ocular inflammation is a significant and challenging clinical entity that is associated with long term changes in the retina and serious sight threatening complications (111). Experimental models of non-infectious and infectious ocular inflammation have been widely and successfully deployed. But fundamental insights regarding how tissue homeostasis is perturbed and how it might be restored are still needed (112). Such concerns are important in a much broader context than uveitis. Restoring complex tissues, damaged by persistent inflammation, to normal physiological function will have wide application. Multimodal and quantitative imaging of the eye, in an experimental context, has potential to advance our understanding of the kinetics, cell biology, transcriptomic and proteomic architecture of how this multifactorial process is regulated. By providing non-invasive techniques to probe the underlaying nature of the tissue, there is an opportunity for a more precise and comprehensive discrimination between different states that can be used to stratify information gleaned from detailed examination of the transcriptome and microbiome, multiparameter flow cytometry and proteomics.
Author Contributions
Literature survey and drafting of original manuscript and figures (LB, AW, LN). Preparation and provision of data (AW, MH, JL, DC). All authors contributed to the article and approved the submitted version.
Conflict of Interest
The authors declare that the research was conducted in the absence of any commercial or financial relationships that could be construed as a potential conflict of interest.
Acknowledgments
The authors gratefully acknowledge support of the National Eye Research Centre, Fight for Sight (5077/5078) and the Underwood Trust to research carried out in their laboratories.
Supplementary Material
The Supplementary Material for this article can be found online at: https://www.frontiersin.org/articles/10.3389/fimmu.2021.630022/full#supplementary-material
References
1. Forrester JV, Kuffova L, Dick AD. Autoimmunity, Autoinflammation, and Infection in Uveitis. Am J Ophthalmol (2018) 189:77–85. doi: 10.1016/j.ajo.2018.02.019
2. Lee RWJ, Nicholson LB, Sen HN, Chan CC, Wei L, Nussenblatt RB, et al. Autoimmune and Autoinflammatory Mechanisms in Uveitis. Semin Immunopathol (2014) 36:581–94. doi: 10.1007/s00281-014-0433-9
3. Caspi RR, Roberge FG, Chan CC, Wiggert B, Chader GJ, Rozenszajn LA, et al. A New Model of Autoimmune Disease. Experimental Autoimmune Uveoretinitis Induced in Mice With Two Different Retinal Antigens. J Immunol (1988) 140(5):1490–5.
4. Caspi RR. A Look at Autoimmunity and Inflammation in the Eye. J Clin Invest (2010) 120(9):3073–83. doi: 10.1172/JCI42440
5. Lin HH, Faunce DE, Stacey M, Terajewicz A, Nakamura T, Zhang-Hoover J, et al. The Macrophage F4/80 Receptor Is Required for the Induction of Antigen-Specific Efferent Regulatory T Cells in Peripheral Tolerance. J Exp Med (2005) 201(10):1615–25. doi: 10.1084/jem.20042307
6. Lee DJ, Taylor AW. Recovery From Experimental Autoimmune Uveitis Promotes Induction of Antiuveitic Inducible Tregs. J Leukocyte Biol (2015) 97(6):1101–9. doi: 10.1189/jlb.3A1014-466RR
7. Wang R-X, Yu C-R, Dambuza IM, Mahdi RM, Dolinska M, Sergeey YV, et al. Interleukin-35 Induces Regulatory B Cells That Suppress Autoimmune Disease. Nat Med (2014) 20(6):633–41. doi: 10.1038/nm.3554
8. Kerr EC, Raveney BJE, Copland DA, Dick AD, Nicholson LB. Analysis of Retinal Cellular Infiltrate in Experimental Autoimmune Uveoretinitis Reveals Multiple Regulatory Cell Populations. J Autoimmun (2008) 31:354–61. doi: 10.1016/j.jaut.2008.08.006
9. Horai R, Zárate-Bladés CR, Dillenburg-Pilla P, Chen J, Kielczewski JL, Silver Phyllis B, et al. Microbiota-Dependent Activation of an Autoreactive T Cell Receptor Provokes Autoimmunity in an Immunologically Privileged Site. Immunity (2015) 43(2):343–53. doi: 10.1016/j.immuni.2015.07.014
10. Boldison J, Chu CJ, Copland DA, Lait PJP, Khera TK, Dick AD, et al. Tissue-Resident Exhausted Effector Memory CD8+ T Cells Accumulate in the Retina During Chronic Experimental Autoimmune Uveoretinitis. J Immunol (2014) 192:4541–50. doi: 10.4049/jimmunol.1301390
11. Raveney BJE, Copland DA, Dick AD, Nicholson LB. Tnfr1-Dependent Regulation of Myeloid Cell Function in Experimental Autoimmune Uveoretinitis. J Immunol (2009) 183:2321–9. doi: 10.4049/jimmunol.0901340
12. Chu CJ, Gardner PJ, Copland DA, Liyanage SE, Gonzalez-Cordero A, kleine Holthaus S-M, et al. Multimodal Analysis of Ocular Inflammation Using the Endotoxin-Induced Uveitis Mouse Model. Dis Models Mech (2016) 9(4):473–81. doi: 10.1242/dmm.022475
13. Bell OH, Copland DA, Ward A, Nicholson LB, Lange CAK, Chu CJ, et al. Single Eye mRNA-Seq Reveals Normalisation of the Retinal Microglial Transcriptome Following Acute Inflammation. Front Immunol (2020) 10:3033. doi: 10.3389/fimmu.2019.03033
14. Forrester JV, Worgul BV, Merriam GR Jr. Endotoxin-Induced Uveitis in the Rat. Albrecht Von Graefes Archiv fur Klinische und Experimentelle Ophthalmologie (1980) 213(4):221–33. doi: 10.1007/BF00417543
15. Pepple KL, Rotkis L, Van Grol J, Wilson L, Sandt A, Lam DL, et al. Primed Mycobacterial Uveitis (PMU): Histologic and Cytokine Characterization of a Model of Uveitis in Rats. Invest Ophthalmol Vis Sci (2015) 56(13):8438–48. doi: 10.1167/iovs.15-17523
16. Zinkernagel MS, Bolinger B, Krebs P, Onder L, Miller S, Ludewig B. Immunopathological Basis of Lymphocytic Choriomeningitis Virus-Induced Chorioretinitis and Keratitis. J Virol (2009) 83(1):159–66. doi: 10.1128/jvi.01211-08
17. Zinkernagel MS, Chinnery HR, Ong ML, Petitjean C, Voigt V, McLenachan S, et al. Interferon γ–Dependent Migration of Microglial Cells in the Retina After Systemic Cytomegalovirus Infection. Am J Pathol (2013) 182(3):875–85. doi: 10.1016/j.ajpath.2012.11.031
18. Zinkernagel MS, Petitjean C, Wikstrom ME, Degli-Esposti MA. Kinetics of Ocular and Systemic Antigen-Specific T-Cell Responses Elicited During Murine Cytomegalovirus Retinitis. Immunol Cell Biol (2012) 90(3):330–6. doi: 10.1038/icb.2011.43
19. Paques M, Guyomard JL, Simonutti M, Roux MJ, Picaud S, LeGargasson JF, et al. Panretinal, High-Resolution Color Photography of the Mouse Fundus. Invest Ophthalmol Vis Sci (2007) 48(6):2769–74. doi: 10.1167/iovs.06-1099
20. Copland DA, Wertheim MS, Raveney BJE, Armitage WJ, Nicholson LB, Dick AD. The Clinical Time-Course of Experimental Autoimmune Uveoretinitis Using Topical Endoscopic Fundal Imaging With Histological and Cellular Infiltrate Correlation. Invest Ophthalmol Vis Sci (2008) 49:5458–65. doi: 10.1167/iovs.08-2348
21. Xu HP, Koch P, Chen M, Lau A, Reid DM, Forrester JV. A Clinical Grading System for Retinal Inflammation in the Chronic Model of Experimental Autoimmune Uveoretinitis Using Digital Fundus Images. Exp Eye Res (2008) 87(4):319–26. doi: 10.1016/j.exer.2008.06.012
22. Zhong X, Aredo B, Ding Y, Zhang K, Zhao CX, Ufret-Vincenty RL. Fundus Camera-Delivered Light-Induced Retinal Degeneration in Mice With the RPE65 Leu450met Variant Is Associated With Oxidative Stress and Apoptosis. Invest Ophthalmol Vis Sci (2016) 57(13):5558–67. doi: 10.1167/iovs.16-19965
23. Chen J, Caspi RR. Clinical and Functional Evaluation of Ocular Inflammatory Disease Using the Model of Experimental Autoimmune Uveitis. In: Boyd AS, editor. Immunological Tolerance: Methods and Protocols. New York, NY: Springer New York (2019). p. 211–27.
24. Chu CJ, Herrmann P, Carvalho LS, Liyanage SE, Bainbridge JWB, Ali RR, et al. Assessment and In Vivo Scoring of Murine Experimental Autoimmune Uveoretinitis Using Optical Coherence Tomography. PloS One (2013) 8(5):e63002. doi: 10.1371/journal.pone.0063002
25. Abramoff MD, Garvin MK, Sonka M. Retinal Imaging and Image Analysis. IEEE Rev Biomed Eng (2010) 3:169–208. doi: 10.1109/rbme.2010.2084567
26. Anantrasirichai N, Nicholson LB, Morgan JE, Erchova I, Mortlock K, North RV, et al. Adaptive-Weighted Bilateral Filtering and Other Pre-Processing Techniques for Optical Coherence Tomography. Computerized Med Imaging Graphics (2014) 38(6):526–39. doi: 10.1016/j.compmedimag.2014.06.012
27. Sun J, Huang X, Egwuagu C, Badr Y, Dryden SC, Fowler BT, et al. Identifying Mouse Autoimmune Uveitis From Fundus Photographs Using Deep Learning. Trans Vision Sci Technol (2020) 9(2):59–. doi: 10.1167/tvst.9.2.59
28. Gutowski MB, Wilson L, Van Gelder RN, Pepple KL. In Vivo Bioluminescence Imaging for Longitudinal Monitoring of Inflammation in Animal Models of Uveitis. Invest Ophthalmol Vis Sci (2017) 58(3):1521–8. doi: 10.1167/iovs.16-20824
29. John S, Rolnick K, Wilson L, Wong S, Van Gelder RN, Pepple KL. Bioluminescence for In Vivo Detection of Cell-Type-Specific Inflammation in a Mouse Model of Uveitis. Sci Rep (2020) 10(1):11377. doi: 10.1038/s41598-020-68227-4
30. Radtke AJ, Kandov E, Lowekamp B, Speranza E, Chu CJ, Gola A, et al. Ibex: A Versatile Multiplex Optical Imaging Approach for Deep Phenotyping and Spatial Analysis of Cells in Complex Tissues. Proc Natl Acad Sci USA (2020) 117(52):33455–65. doi: 10.1073/pnas.2018488117
31. Kerr EC, Copland DA, Dick AD, Nicholson LB. The Dynamics of Leukocyte Infiltration in Experimental Autoimmune Uveoretinitis. Prog Retin Eye Res (2008) 27:527–35. doi: 10.1016/j.preteyeres.2008.07.001
32. Shao H, Liao T, Ke Y, Shi H, Kaplan HJ, Sun D. Severe Chronic Experimental Autoimmune Uveitis (EAU) of the C57BL/6 Mouse Induced by Adoptive Transfer of IRBP1–20-Specific T Cells. Exp Eye Res (2006) 82(2):323–31. doi: 10.1016/j.exer.2005.07.008
33. Oh H-M, Yu C-R, Lee Y, Chan C-C, Maminishkis A, Egwuagu CE. Autoreactive Memory CD4+ T Lymphocytes That Mediate Chronic Uveitis Reside in the Bone Marrow Through STAT3-Dependent Mechanisms. J Immunol (2011) 187(6):3338–46. doi: 10.4049/jimmunol.1004019
34. Chen M, Copland DA, Zhao J, Liu J, Forrester JV, Dick AD, et al. Persistent Inflammation Subverts Thrombospondin-1–Induced Regulation of Retinal Angiogenesis and Is Driven by CCR2 Ligation. Am J Pathol (2012) 180(1):235–45. doi: 10.1016/j.ajpath.2011.09.020
35. Kielczewski JL, Horai R, Jittayasothorn Y, Chan C-C, Caspi RR. Tertiary Lymphoid Tissue Forms in Retinas of Mice With Spontaneous Autoimmune Uveitis and Has Consequences on Visual Function. J Immunol (2016) 196(3):1013–25. doi: 10.4049/jimmunol.1501570
36. Epps SJ, Coplin N, Luthert PJ, Dick AD, Coupland SE, Nicholson LB. Features of Ectopic Lymphoid-Like Structures in Human Uveitis. Exp Eye Res (2020) 191:1–9. doi: 10.1016/j.exer.2019.107901
37. Diedrichs-Möhring M, Kaufmann U, Wildner G. The Immunopathogenesis of Chronic and Relapsing Autoimmune Uveitis – Lessons From Experimental Rat Models. Prog Retin Eye Res (2018) 65:107–26. doi: 10.1016/j.preteyeres.2018.02.003
38. Weavers H, Martin P. The Cell Biology of Inflammation: From Common Traits to Remarkable Immunological Adaptations. J Cell Biol (2020) 219(7):1–14. doi: 10.1083/jcb.202004003
39. Jones GW, Hill DG, Jones SA. Understanding Immune Cells in Tertiary Lymphoid Organ Development: It Is All Starting to Come Together. Front Immunol (2016) 7:401. doi: 10.3389/fimmu.2016.00401
40. Heng JS, Hackett SF, Stein-O’Brien GL, Winer BL, Williams J, Goff LA, et al. Comprehensive Analysis of a Mouse Model of Spontaneous Uveoretinitis Using Single-Cell RNA Sequencing. Proc Natl Acad Sci USA (2019), 201915571. doi: 10.1073/pnas.1915571116
41. Montesano G, Way CM, Ometto G, Ibrahim H, Jones PR, Carmichael R, et al. Optimizing OCT Acquisition Parameters for Assessments of Vitreous Haze for Application in Uveitis. Sci Rep (2018) 8:1–7. doi: 10.1038/s41598-018-20092-y
42. Ravin JG. Sesquicentennial of the Ophthalmoscope. Arch Ophthalmol (1999) 117(12):1634–8. doi: 10.1001/archopht.117.12.1634
43. Marchese A, Agarwal A, Moretti AG, Handa S, Modorati G, Querques G, et al. Advances in Imaging of Uveitis. Ther Adv Ophthalmol (2020) 12:2515841420917781. doi: 10.1177/2515841420917781
44. Kimura SJ, Thygeson P, Hogan MJ. Signs and Symptoms of Uveitis. II. Classification of the Posterior Manifestations of Uveitis. Am J Ophthalmol (1959) 47(5 Pt 2):171–6. doi: 10.1016/s0002-9394(14)78240-6
45. Hogan MJ, Kimura SJ, Thygeson P. Signs and Symptoms of Uveitis. I. Anterior Uveitis. Am J Ophthalmol (1959) 47(5 Pt 2):155–70. doi: 10.1016/s0002-9394(14)78239-x
46. Trusko B, Thorne J, Jabs D, Belfort R, Dick A, Gangaputra S, et al. The Standardization of Uveitis Nomenclature (SUN) Project Development of a Clinical Evidence Base Utilizing Informatics Tools and Techniques. Methods Inf Med (2013) 52(3):259–65. doi: 10.3414/me12-01-0063
47. Kaburaki T, Namba K, Sonoda K-H, Kezuka T, Keino H, Fukuhara T, et al. Behçet’s Disease Ocular Attack Score 24: Evaluation of Ocular Disease Activity Before and After Initiation of Infliximab. Japanese J Ophthalmol (2014) 58(2):120–30. doi: 10.1007/s10384-013-0294-0
48. Denniston AK, Keane PA, Srivastava SK. Biomarkers and Surrogate Endpoints in Uveitis: The Impact of Quantitative Imaging. Invest Ophthalmol Vis Sci (2017) 58(6):BIO131–BIO40. doi: 10.1167/iovs.17-21788
49. Hornbeak DM, Payal A, Pistilli M, Biswas J, Ganesh SK, Gupta V, et al. Interobserver Agreement in Clinical Grading of Vitreous Haze Using Alternative Grading Scales. Ophthalmology (2014) 121(8):1643–8. doi: 10.1016/j.ophtha.2014.02.018
50. Davis JL, Madow B, Cornett J, Stratton R, Hess D, Porciatti V, et al. Scale for Photographic Grading of Vitreous Haze in Uveitis. Am J Ophthalmol (2010) 150(5):637–41. doi: 10.1016/j.ajo.2010.05.036
51. Passaglia CL, Arvaneh T, Greenberg E, Richards D, Madow B. Automated Method of Grading Vitreous Haze in Patients With Uveitis for Clinical Trials. Transl Vis Sci Technol (2018) 7(2):10. doi: 10.1167/tvst.7.2.10
52. Agarwal RK, Caspi RR. Rodent Models of Experimental Autoimmune Uveitis. Methods Mol Med (2004) 102:395–419. doi: 10.1385/1-59259-805-6:395
53. Agarwal RK, Silver PB, Caspi RR. Rodent Models of Experimental Autoimmune Uveitis. Methods Mol Biol (2012) 900:443–69. doi: 10.1007/978-1-60761-720-4_22
54. Copland DA, Liu J, Schewitz-Bowers LP, Brinkmann V, Anderson K, Nicholson LB, et al. Therapeutic Dosing of Fingolimod (FTY720) Prevents Cell Infiltration, Rapidly Suppresses Ocular Inflammation, and Maintains the Blood-Ocular Barrier. Am J Pathol (2012) 180:672–81. doi: 10.1016/j.ajpath.2011.10.008
55. Huang D, Swanson E, Lin C, Schuman J, Stinson W, Chang W, et al. Optical Coherence Tomography. Science (1991) 254(5035):1178–81. doi: 10.1126/science.1957169
56. Drexler W, Liu MY, Kumar A, Kamali T, Unterhuber A, Leitgeb RA. Optical Coherence Tomography Today: Speed, Contrast, and Multimodality. J Biomed Optics (2014) 19(7):1–34. doi: 10.1117/1.jbo.19.7.071412
57. Mrejen S, Spaide RF. Optical Coherence Tomography: Imaging of the Choroid and Beyond. Survey Ophthalmol (2013) 58(5):387–429. doi: 10.1016/j.survophthal.2012.12.001
58. Yu C-R, Kim S-H, Mahdi RM, Egwuagu CE. SOCS3 Deletion in T Lymphocytes Suppresses Development of Chronic Ocular Inflammation Via Upregulation of CTLA-4 and Expansion of Regulatory T Cells. J Immunol (2013) 191(10):5036–43. doi: 10.4049/jimmunol.1301132
59. Chen J, Qian H, Horai R, Chan CC, Caspi RR. Use of Optical Coherence Tomography and Electroretinography to Evaluate Retinal Pathology in a Mouse Model of Autoimmune Uveitis. PloS One (2013) 8(5):e63904. doi: 10.1371/journal.pone.0063904
60. Nussenblatt RB, Gery I, Wacker WB. Experimental Autoimmune Uveitis - Cellular Immune Responsiveness. Invest Ophthalmol Vis Sci (1980) 19(6):686–90.
61. Kozak YD, Sakai J, Thillaye B, Faure JP. S Antigen-Induced Experimental Autoimmune Uveo-Retinitis in Rats. Curr Eye Res (1981) 1(6):327–37. doi: 10.3109/02713688108998359
62. Mochizuki M, Kuwabara T, McAllister C, Nussenblatt RB, Gery I. Adoptive Transfer of Experimental Autoimmune Uveoretinitis in Rats. Immunopathogenic Mechanisms and Histologic Features. Invest Ophthalmol Vis Sci (1985) 26(1):1–9.
63. Thurau SR, Mempel TR, Flugel A, Edrichs-Mohring M, Krombach F, Kawakami N, et al. The Fate of Autoreactive, GFP+ T Cells in Rat Models of Uveitis Analyzed by Intravital Fluorescence Microscopy and FACS. Int Immunol (2004) 16(11):1573–82. doi: 10.1093/intimm/dxh158
64. Luger D, Silver PB, Tang J, Cua D, Chen Z, Iwakura Y, et al. Either a Th17 or a Th1 Effector Response can Drive Autoimmunity: Conditions of Disease Induction Affect Dominant Effector Category. J Exp Med (2008) 205(4):799–810. doi: 10.1084/jem.20071258
65. Silver PB, Horai R, Chen J, Jittayasothorn Y, Chan C-C, Villasmil R, et al. Retina-Specific T Regulatory Cells Bring About Resolution and Maintain Remission of Autoimmune Uveitis. J Immunol (2015) 194(7):3011–9. doi: 10.4049/jimmunol.1402650
66. Li J, Ren J, Yip YWY, Zhang X, Chu KO, Ng TK, et al. Quantitative Characterization of Autoimmune Uveoretinitis in an Experimental Mouse Model. Invest Ophthalmol Vis Sci (2017) 58(10):4193–200. doi: 10.1167/iovs.17-22436
67. Choi WJ, Pepple KL, Wang RK. Automated Three-Dimensional Cell Counting Method for Grading Uveitis of Rodent Eye In Vivo With Optical Coherence Tomography. J Biophotonics (2018) 11(9):e201800140. doi: 10.1002/jbio.201800140
68. Dysli C, Enzmann V, Sznitman R, Zinkernagel MS. Quantitative Analysis of Mouse Retinal Layers Using Automated Segmentation of Spectral Domain Optical Coherence Tomography Images. Trans Vision Sci Technol (2015) 4(4):9. doi: 10.1167/tvst.4.4.9
69. Holland GN. A Reconsideration of Anterior Chamber Flare and its Clinical Relevance for Children With Chronic Anterior Uveitis (An American Ophthalmological Society Thesis). Trans Am Ophthalmological Soc (2007) 105:344–64.
70. Agrawal R, Keane PA, Singh J, Saihan Z, Kontos A, Pavesio CE. Classification of Semi-Automated Flare Readings Using the Kowa FM 700 Laser Cell Flare Meter in Patients With Uveitis. Acta Ophthalmologica (2016) 94(2):e135–e41. doi: 10.1111/aos.12833
71. Ruggeri M, Wehbe H, Jiao S, Gregori G, Jockovich ME, Hackam A, et al. In Vivo Three-Dimensional High-Resolution Imaging of Rodent Retina With Spectral-Domain Optical Coherence Tomography. Invest Ophthalmol Vis Sci (2007) 48(4):1808–14. doi: 10.1167/iovs.06-0815
72. Zarranz-Ventura J, Keane PA, Sim DA, Llorens V, Tufail A, Sadda SR, et al. Evaluation of Objective Vitritis Grading Method Using Optical Coherence Tomography: Influence of Phakic Status and Previous Vitrectomy. Am J Ophthalmol (2016) 161:172–80.e1-4. doi: 10.1016/j.ajo.2015.10.009
73. Keane PA, Balaskas K, Sim DA, Aman K, Denniston AK, Aslam T, et al. Automated Analysis of Vitreous Inflammation Using Spectral-Domain Optical Coherence Tomography. Trans Vision Sci Technol (2015) 4(5):1–10. doi: 10.1167/tvst.4.5.4
74. Pepple KL, Choi WJ, Wilson L, Van Gelder RN, Wang RK. Quantitative Assessment of Anterior Segment Inflammation in a Rat Model of Uveitis Using Spectral-Domain Optical Coherence Tomography. Invest Ophthalmol Vis Sci (2016) 57(8):3567–75. doi: 10.1167/iovs.16-19276
75. Choi WJ, Pepple KL, Wang RK. Automated Three-Dimensional Cell Counting Method for Grading Uveitis of Rodent Eye. In: Vivo Optical Coherence Tomography. J Biophotonics (2018) 11(9):e201800140. doi: 10.1002/jbio.201800140
76. Smith RS, John SWM, Nishina PM, Sundberg JP. Systematic Evaluation of the Mouse Eye: Anatomy, Pathology, and Biomethods. Boca Raton, FL: CRC Press (2002).
77. Keane PA, Karampelas M, Sim DA, Sadda SR, Tufail A, Sen HN, et al. Objective Measurement of Vitreous Inflammation Using Optical Coherence Tomography. Ophthalmology (2014) 121(9):1706–14. doi: 10.1016/j.ophtha.2014.03.006
78. Gadjanski I, Williams SK, Hein K, Sattler MB, Bahr M, Diem R. Correlation of Optical Coherence Tomography With Clinical and Histopathological Findings in Experimental Autoimmune Uveoretinitis. Exp Eye Res (2011) 93(1):82–90. doi: 10.1016/j.exer.2011.04.012
79. Berger A, Cavallero S, Dominguez E, Barbe P, Simonutti M, Sahel JA, et al. Spectral-Domain Optical Coherence Tomography of the Rodent Eye: Highlighting Layers of the Outer Retina Using Signal Averaging and Comparison With Histology. PloS One (2014) 9(5):e96494. doi: 10.1371/journal.pone.0096494
80. Kajic V, Povazay B, Hermann B, Hofer B, Marshall D, Rosin PL, et al. Robust Segmentation of Intraretinal Layers in the Normal Human Fovea Using a Novel Statistical Model Based on Texture and Shape Analysis. Opt Express (2010) 18(14):14730–44. doi: 10.1364/OE.18.014730
81. Ishikawa H, Stein DM, Wollstein G, Beaton S, Fujimoto JG, Schuman JS. Macular Segmentation With Optical Coherence Tomography. Invest Ophthalmol Vis Sci (2005) 46(6):2012–7. doi: 10.1167/iovs.04-0335
82. Mishra A, Wong A, Bizheva K, Clausi DA. Intra-Retinal Layer Segmentation in Optical Coherence Tomography Images. Opt Express (2009) 17(26):23719–28. doi: 10.1364/OE.17.023719
83. Mujat M, Chan R, Cense B, Park B, Joo C, Akkin T, et al. Retinal Nerve Fiber Layer Thickness Map Determined From Optical Coherence Tomography Images. Opt Express (2005) 13(23):9480–91. doi: 10.1364/opex.13.009480
84. Gonzalez-Lopez A, de Moura J, Novo J, Ortega M, Penedo MG. Robust Segmentation of Retinal Layers in Optical Coherence Tomography Images Based on a Multistage Active Contour Model. Heliyon (2019) 5(2):e01271. doi: 10.1016/j.heliyon.2019.e01271
85. Venhuizen FG, van Ginneken B, Liefers B, van Grinsven M, Fauser S, Hoyng C, et al. Robust Total Retina Thickness Segmentation in Optical Coherence Tomography Images Using Convolutional Neural Networks. BioMed Opt Express (2017) 8(7):3292–316. doi: 10.1364/BOE.8.003292
86. Garvin MK, Abramoff MD, Wu X, Russell SR, Burns TL, Sonka M. Automated 3-D Intraretinal Layer Segmentation of Macular Spectral-Domain Optical Coherence Tomography Images. IEEE Trans Med Imaging (2009) 28(9):1436–47. doi: 10.1109/TMI.2009.2016958
87. Lang A, Carass A, Hauser M, Sotirchos ES, Calabresi PA, Ying HS, et al. Retinal Layer Segmentation of Macular OCT Images Using Boundary Classification. BioMed Opt Express (2013) 4(7):1133–52. doi: 10.1364/BOE.4.001133
88. Kajic V, Esmaeelpour M, Povazay B, Marshall D, Rosin PL, Drexler W. Automated Choroidal Segmentation of 1060 Nm OCT in Healthy and Pathologic Eyes Using a Statistical Model. BioMed Opt Express (2012) 3(1):86–103. doi: 10.1364/BOE.3.000086
89. Spaide RF, Curcio CA. Anatomical Correlates to the Bands Seen in the Outer Retina by Optical Coherence Tomography: Literature Review and Model. Retina (2011) 31(8):1609–19. doi: 10.1097/IAE.0b013e3182247535
90. Mattapallil MJ, Wawrousek EF, Chan C-C, Zhao H, Roychoudhury J, Ferguson TA, et al. The rd8 Mutation of the Crb1 Gene is Present in Vendor Lines of C57BL/6N Mice and Embryonic Stem Cells, and Confounds Ocular Induced Mutant Phenotypes. Invest Ophthalmol Vis Sci (2012) 53(6):2921–7. doi: 10.1167/iovs.12-9662
91. Fischer MD, Huber G, Beck SC, Tanimoto N, Muehlfriedel R, Fahl E, et al. Noninvasive, In Vivo Assessment of Mouse Retinal Structure Using Optical Coherence Tomography. PloS One (2009) 4(10):1–7. doi: 10.1371/journal.pone.0007507
92. Srinivasan VJ, Ko TH, Wojtkowski M, Carvalho M, Clermont A, Bursell SE, et al. Noninvasive Volumetric Imaging and Morphometry of the Rodent Retina With High-Speed, Ultrahigh-Resolution Optical Coherence Tomography. Invest Ophthalmol Vis Sci (2006) 47(12):5522–8. doi: 10.1167/iovs.06-0195
93. Dingerkus VLS, Munk MR, Brinkmann MP, Freiberg FJ, Heussen FMA, Kinzl S, et al. Optical Coherence Tomography Angiography (OCTA) as a New Diagnostic Tool in Uveitis. J Ophthalmic Inflammation Infect (2019) 9(1):10. doi: 10.1186/s12348-019-0176-9
94. Alnawaiseh M, Rosentreter A, Hillmann A, Alex AF, Niekamper D, Heiduschka P, et al. OCT Angiography in the Mouse: A Novel Evaluation Method for Vascular Pathologies of the Mouse Retina. Exp Eye Res (2016) 145:417–23. doi: 10.1016/j.exer.2016.02.012
95. Kim AY, Rodger DC, Shahidzadeh A, Chu Z, Koulisis N, Burkemper B, et al. Quantifying Retinal Microvascular Changes in Uveitis Using Spectral-Domain Optical Coherence Tomography Angiography. Am J Ophthalmol (2016) 171:101–12. doi: 10.1016/j.ajo.2016.08.035
96. Chu Z, Lin J, Gao C, Xin C, Zhang Q, Chen CL, et al. Quantitative Assessment of the Retinal Microvasculature Using Optical Coherence Tomography Angiography. J BioMed Opt (2016) 21(6):66008. doi: 10.1117/1.JBO.21.6.066008
97. Moccia S, De Momi E, El Hadji S, Mattos LS. Blood Vessel Segmentation Algorithms - Review of Methods, Datasets and Evaluation Metrics. Comput Methods Programs BioMed (2018) 158:71–91. doi: 10.1016/j.cmpb.2018.02.001
98. Hu Z, Niemeijer M, Abramoff MD, Garvin MK. Multimodal Retinal Vessel Segmentation From Spectral-Domain Optical Coherence Tomography and Fundus Photography. IEEE Trans Med Imaging (2012) 31(10):1900–11. doi: 10.1109/TMI.2012.2206822
99. Rodrigues P, Guimaraes P, Santos T, Simao S, Miranda T, Serranho P, et al. Two-Dimensional Segmentation of the Retinal Vascular Network From Optical Coherence Tomography. J BioMed Opt (2013) 18(12):126011. doi: 10.1117/1.JBO.18.12.126011
100. Zhu Q, Xing X, Zhu M, Xiao H, Ma L, Chen L, et al. A New Approach for the Segmentation of Three Distinct Retinal Capillary Plexuses Using Optical Coherence Tomography Angiography. Transl Vis Sci Technol (2019) 8(3):57. doi: 10.1167/tvst.8.3.57
101. Li A, You J, Du C, Pan Y. Automated Segmentation and Quantification of OCT Angiography for Tracking Angiogenesis Progression. BioMed Opt Express (2017) 8(12):5604–16. doi: 10.1364/BOE.8.005604
102. Ma Y, Hao H, Xie J, Fu H, Zhang J, Yang J, et al. Rose: A Retinal OCT-Angiography Vessel Segmentation Dataset and New Model. IEEE Trans Med Imaging (2021) 40(3):928–39. doi: 10.1109/TMI.2020.3042802
103. Chen J, Caspi RR. Clinical and Functional Evaluation of Ocular Inflammatory Disease Using the Model of Experimental Autoimmune Uveitis. Methods Mol Biol (2019) 1899:211–27. doi: 10.1007/978-1-4939-8938-6_15
104. Schneider CA, Rasband WS, Eliceiri KW. NIH Image to ImageJ: 25 Years of Image Analysis. Nat Methods (2012) 9(7):671–5. doi: 10.1038/nmeth.2089
105. Cingolani C, Rogers B, Lu L, Kachi S, Shen J, Campochiaro PA. Retinal Degeneration From Oxidative Damage. Free Radical Biol Med (2006) 40(4):660–9. doi: 10.1016/j.freeradbiomed.2005.09.032
106. Faes L, Liu X, Wagner SK, Fu DJ, Balaskas K, Sim DA, et al. A Clinician’s Guide to Artificial Intelligence: How to Critically Appraise Machine Learning Studies. Trans Vision Sci Technol (2020) 9(2):7–. doi: 10.1167/tvst.9.2.7
107. Liu XX, Faes L, Kale AU, Wagner SK, Fu DJ, Bruynseels A, et al. A Comparison of Deep Learning Performance Against Health-Care Professionals in Detecting Diseases From Medical Imaging: A Systematic Review and Meta-Analysis. Lancet Digital Health (2019) 1(6):E271–E97. doi: 10.1016/s2589-7500(19)30123-2
108. De Fauw J, Ledsam JR, Romera-Paredes B, Nikolov S, Tomasev N, Blackwell S, et al. Clinically Applicable Deep Learning for Diagnosis and Referral in Retinal Disease. Nat Med (2018) 24(9):1342–50. doi: 10.1038/s41591-018-0107-6
109. Dogra A, Goyal B, Agrawal S, Ahuja CK. Efficient Fusion of Osseous and Vascular Details in Wavelet Domain. Pattern Recognit Lett (2017) 94:189–93. doi: 10.1016/j.patrec.2017.03.002
110. Mitchell HB. Image Fusion: Theories, Techniques and Applications. Berlin Heidelberg: Springer (2010) p. 1–247 p.
111. Dick AD, Tundia N, Sorg R, Zhao C, Chao JD, Joshi A, et al. Risk of Ocular Complications in Patients With Noninfectious Intermediate Uveitis, Posterior Uveitis, or Panuveitis. Ophthalmology (2016) 123(3):655–62. doi: 10.1016/j.ophtha.2015.10.028
Keywords: uveitis, EAU, OCT, image processing, automated analysis
Citation: Bradley LJ, Ward A, Hsue MCY, Liu J, Copland DA, Dick AD and Nicholson LB (2021) Quantitative Assessment of Experimental Ocular Inflammatory Disease. Front. Immunol. 12:630022. doi: 10.3389/fimmu.2021.630022
Received: 17 November 2020; Accepted: 28 May 2021;
Published: 18 June 2021.
Edited by:
Manfred Karl Zierhut, University of Tübingen, GermanyReviewed by:
Jarmila Heissigerova, Charles University, CzechiaKazuichi Maruyama, Osaka University, Japan
Copyright © 2021 Bradley, Ward, Hsue, Liu, Copland, Dick and Nicholson. This is an open-access article distributed under the terms of the Creative Commons Attribution License (CC BY). The use, distribution or reproduction in other forums is permitted, provided the original author(s) and the copyright owner(s) are credited and that the original publication in this journal is cited, in accordance with accepted academic practice. No use, distribution or reproduction is permitted which does not comply with these terms.
*Correspondence: Lindsay B. Nicholson, bC5uaWNob2xzb25AYnJpc3RvbC5hYy51aw==