 Imtissal Krayem1
 Yahya Sohrabi1Eliška Javorková2,3Valeriya Volkova1Hynek Strnad4
 Helena Havelková1Jarmila Vojtíšková1
 Aigerim Aidarova1Vladimír Holáň2,3Peter Demant5
 Marie Lipoldová1*
- 1Laboratory of Molecular and Cellular Immunology, Institute of Molecular Genetics of the Czech Academy of Sciences, Prague, Czechia
- 2Department of Cell Biology, Faculty of Science, Charles University, Prague, Czechia
- 3Department of Nanotoxicology and Molecular Epidemiology, Institute of Experimental Medicine of the Czech Academy of Sciences, Prague, Czechia
- 4Department of Genomics and Bioinformatics, Institute of Molecular Genetics of the Czech Academy of Sciences, Prague, Czechia
- 5Department of Molecular and Cellular Biology, Roswell Park Comprehensive Cancer Center, Buffalo, NY, United States
Differences in frequencies of blood cell subpopulations were reported to influence the course of infections, atopic and autoimmune diseases, and cancer. We have discovered a unique mouse strain B10.O20 containing extremely high frequency of myeloid-derived cells (MDC) in spleen. B10.O20 carries 3.6% of genes of the strain O20 on the C57BL/10 genetic background. It contains much higher frequency of CD11b+Gr1+ cells in spleen than both its parents. B10.O20 carries O20-derived segments on chromosomes 1, 15, 17, and 18. Their linkage with frequencies of blood cell subpopulations in spleen was tested in F2 hybrids between B10.O20 and C57BL/10. We found 3 novel loci controlling MDC frequencies: Mydc1, 2, and 3 on chromosomes 1, 15, and 17, respectively, and a locus controlling relative spleen weight (Rsw1) that co-localizes with Mydc3 and also influences proportion of white and red pulp in spleen. Mydc1 controls numbers of CD11b+Gr1+ cells. Interaction of Mydc2 and Mydc3 regulates frequency of CD11b+Gr1+ cells and neutrophils (Gr1+Siglec-F- cells from CD11b+ cells). Interestingly, Mydc3/Rsw1 is orthologous with human segment 6q21 that was shown previously to determine counts of white blood cells. Bioinformatics analysis of genomic sequence of the chromosomal segments bearing these loci revealed polymorphisms between O20 and C57BL/10 that change RNA stability and genes’ functions, and we examined expression of relevant genes. This identified potential candidate genes Smap1, Vps52, Tnxb, and Rab44. Definition of genetic control of MDC can help to personalize therapy of diseases influenced by these cells.
Introduction
Disruption of the normal hematological phenotypes is directly related to multiple diseases (1). Hematological traits have been associated with an increased risk for a number of clinical disorders such as cancer, autoimmune diseases, and total mortality (2). White blood cell (WBC) numbers are partly under genetic control, with heritability approximately 40%–60% (3, 4). Peripheral WBC levels vary among ethnic groups, with neutrophil number levels higher in European Americans than in African Americans (2, 5) due to mutation in Duffy antigen/chemokine receptor (DARC) gene (6). Different strains of mice exhibited different numbers of WBC (7–9), indicating that the resting state WBC counts are under genetic control. Hence, it is essential to identify genes controlling the elements of homeostasis of normal human and animal immune systems, including the relative frequencies of WBC subsets (10).
Genome-wide association studies (GWAS) identified the quantitative trait loci (QTL) controlling the homeostasis of WBC classes in human (11, 12) and mice (8, 13) (Table 1). However, identifying the genes underlying these variations remains challenging, as most detected QTLs are either in non-coding regions or in linkage disequilibrium with many other variants (24).
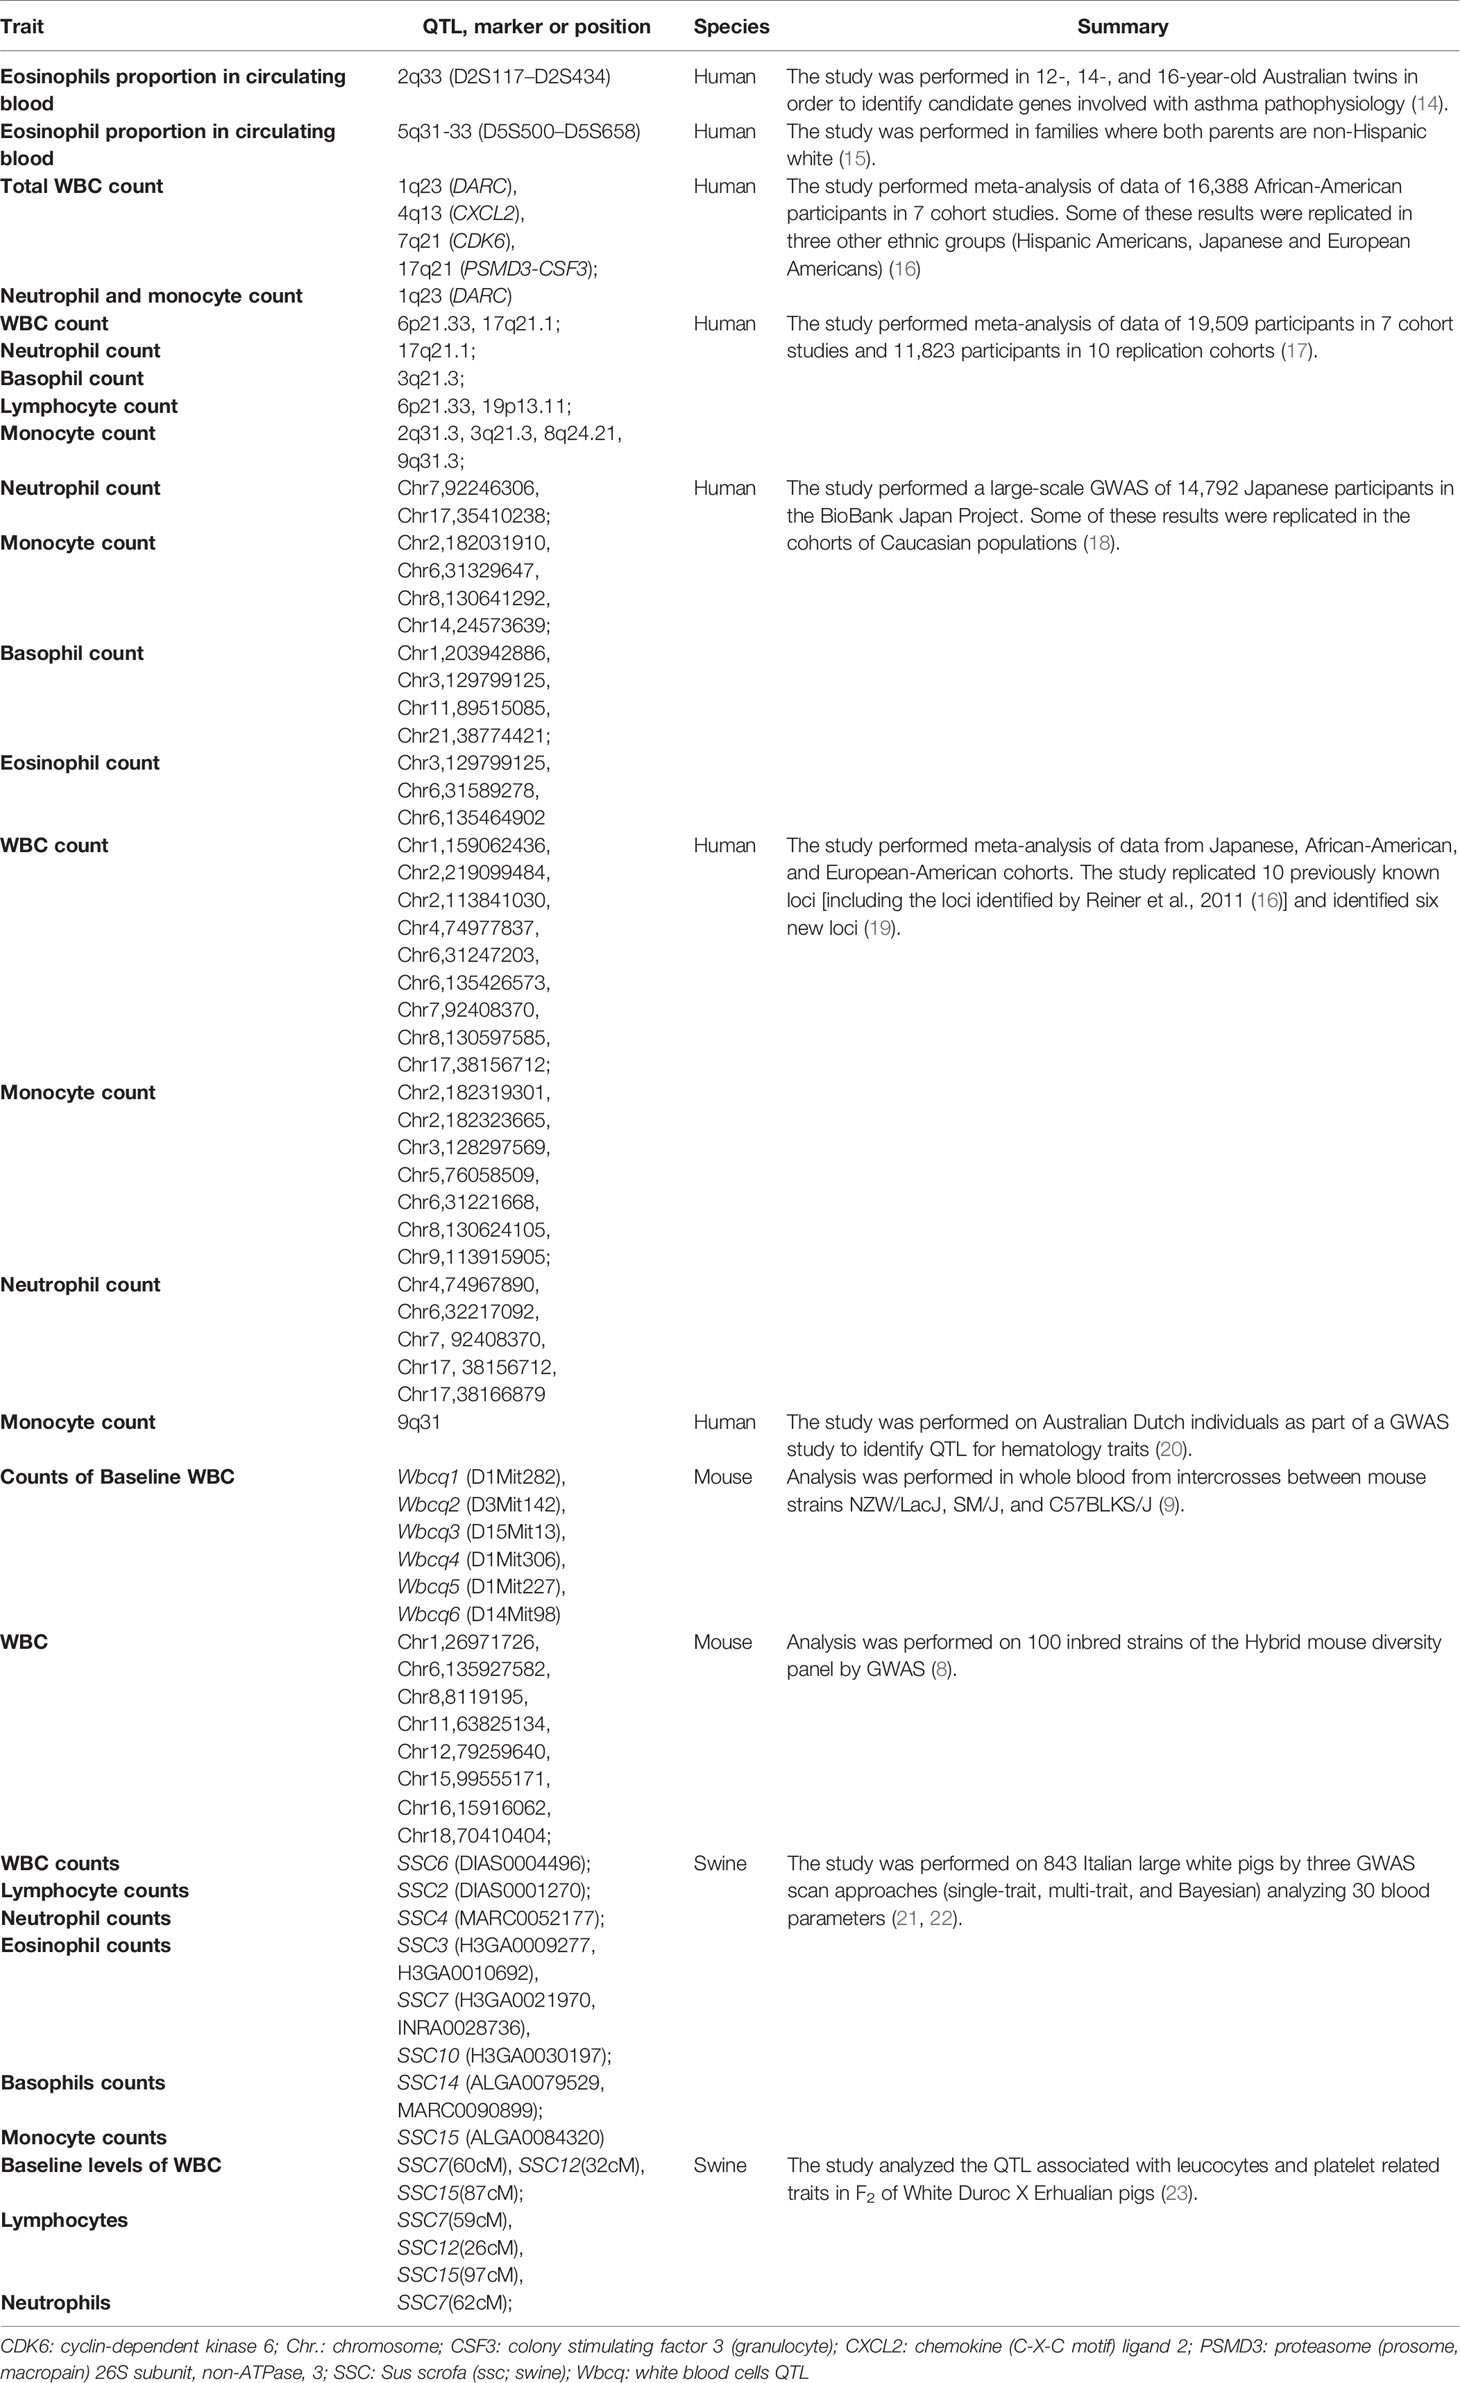
Table 1 QTLs controlling circulating WBC levels in human, mice and swine.
We examined the WBC subpopulations in spleens of the strain C57BL/10-H2pz (B10.O20), a H2 semi-congenic strain on the C57BL/10 (B10) background carrying the O20/A (O20)-derived H2pz haplotype (25). The strain B10.O20 inherited from O20 also an additional 3.6% of its genome. Surprisingly, the myeloid-derived cell (MDC) frequencies in spleens of B10.O20 exceeded those of its two parental strains. To map the genes controlling these differences, we analyzed F2 hybrids between strains B10.O20 and B10, identified three loci on chromosomes 1, 15, and 17 and a suggestive linkage on chromosome 18 controlling MDC frequencies and relative spleen weight, and described potential candidate genes.
Materials and Methods
Mice
Female mice of strains O20 (n = 10), B10.O20 (n = 11), and B10 (n = 9) and F2 hybrids between B10.O20 and B10 (B10xB10.O20 [n = 78] and B10.O20xB10 [n = 190]) in two independent experiments were tested. Unequal numbers of mice in different crosses were due to difficulties in breeding of the cross B10xB10.O20. Mice were produced and housed in SPF conditions at the animal facility of the Institute of Molecular Genetics of the Czech Academy of Sciences and were, on average, 12 weeks old (median 12 weeks, min 8 weeks, max 18 weeks). Mice were killed by cervical dislocation and spleens were divided into four equal quarters for further analysis. The first part was used for immunophenotyping, the second for morphological analysis, and the third for expression analysis. The fourth part was kept as a reserve. All experiments were approved by the Ethical Committee of the Institute of Molecular Genetics of the Czech Academy of Sciences.
Relative Spleen Weight
Spleen and total body weights were determined using the balance Adventurer-Pro (OHAUS Corporation, Pine Brook, NJ USA; Made in Switzerland), resolution d = 0.01 g. The relative spleen weight was calculated as spleen-to-body weight ratio × 1000.
Immunophenotyping
One spleen quarter was homogenized in phosphate-buffered saline (PBS) using disposable pestles. Single-cell suspensions were washed in PBS containing 0.5% bovine serum albumin and incubated for 30 min on ice with the anti-mouse mAb against CD11b, CD14, F4/80, CD40, Gr1, CD3, CD4, CD8, and CD19; for details, see Supplementary Table 1. All samples were incubated with Pacific Blue-labeled anti-TER-119 to exclude erythroid cells. Dead cells were stained with Hoechst 33258 (Invitrogen). Fifty thousand events were acquired on a LSRII cytometer (BD Biosciences) and analyzed using FlowJo 9.9.3 (BD Biosciences).
Genotyping of F2 Mice
DNA was isolated from tails using standard proteinase K procedure. B10.O20 strain differs from B10 at O20-derived regions on four chromosomes. These differential regions were typed using 5 microsatellite markers (D17Mit197, D17Mit21, D17Mit10, D17Mit66, and D18Mit24) and 2 SNP sites: chromosome 1, rs23555388 and chromosome 15, rs78065633 (Generi Biotech, Czech Republic). DNA was amplified by PCR as previously described (26). We detected the presence of allele-specific SNP sites on chromosomes 1 and 15 by digesting the amplicons with the restriction enzymes MwoI (New England BioLabs, Inc.) and AluI (Thermo Fisher Scientific, Inc.), respectively.
RNA Isolation and RT-PCR Analysis
RNA was prepared by lysing a quarter of spleen stored at −80°C in TRI reagent (Sigma Aldrich). One microgram of RNA was treated with DNase (Promega, M6101) and then reverse transcribed and amplified as previously described (27) in a total volume of 10 μl. In detail, 1 µg of RNA was treated with DNase (Promega, M6101) and then reverse transcribed using 100 units of M-MLV Reverse Transcriptase (Sigma, M1302) with 1xMLV reverse transcriptase buffer, 1.4 µM of random hexamers (Thermo Fisher, N8080127), 2.5 units of ribonuclease inhibitor (Thermo Fisher, 15518012), and 5 mM of each dNTP (Sigma, DNTP100) per sample to obtain cDNA. cDNA was then diluted five times and 3 µl was used for amplification by 45 cycles of PCR (3 min denaturation at 95°C, 15 s denaturation at 95°C and 60 s annealing/extension at 60°C with a single fluorescence acquisition point repeated 45 times, and a melt curve program of 55°C to 95°C with 0.5°C increment with continuous fluorescence acquisition) using primers for the genes of interest and iQ SYBR Green Supermix (Bio-RAD, 1708882) for quantification. Primers (Supplementary Table 2) were designed by Quantprime (28) and purchased from Generi Biotech, Czech Republic. GAPDH is used as an internal control. Reactions were performed in a 384-well plate in LC480II light cycler (Roche Molecular Systems, Inc.) The average Ct values (cycle threshold) were used for quantification, and the relative expression was calculated [ratio (reference/target) = 2^(Ct(reference) − Ct(target))].
Morphological Analysis of the Spleen
Another spleen quarter was processed for histology overnight using an automated vacuum tissue processor (Leica ASP200S) and embedded in paraffin using Leica EG1150H. Three-micrometer serial sections were prepared (Leica RM2255), stained with hematoxylin and eosin, and observed under light microscope Leica DM6000 at 10× magnification using the software LAS X, 64 bit. The brightness and contrast of the pictures were then adjusted using FIJI (29). The area of the white pulps was measured using the ellipse formula a*b*π where “a” is the major radius and “b” is the minor radius of the white pulp. The recorded area of one sample represents the average area of ten white pulps measured three times each. Selected samples were from mice 14 weeks old in average (median 14 weeks, min 13 weeks, max 16 weeks).
Detection of Polymorphisms That Change RNA Stability and Genes’ Functions
We have sequenced the genomes of strains C57BL/10 and O20 using next-generation sequencing (NGS) system HiSeq 2500 (Illumina) (12× coverage). Processing, alignment, sorting and indexing of NGS data, variants filtration, annotation, and effect prediction were performed as described elsewhere (30). In detail, NGS data were preprocessed using software Trimmomatic (31) and overlapping pair reads were joined by software Flash (32). Alignment-reference mouse sequence mm10 (build GRCm38) was performed using BWA (Burrows-Wheeler Aligner) program (33). Mapped reads were sorted and indexed, and duplicated reads were marked. Local realignment around indels, base recalibration, and variants filtration were performed using software GATK (the Genome Analysis Toolkit) (34). IGV (Integrated Genome Viewer) (35) was used for visualization of results. Variant annotation and effect prediction was performed by software SnpEff (36). Protein variation effect predictions were performed by software PROVEAN (Protein Variation Effect Analyzer) (37). Analysis of conservation scores was performed using ConSurf software (38–40).
Statistical Analysis
Differences between parental strains and between mice within parental strains were analyzed by Mann–Whitney test using the program Statistica for Windows 12.0 (StatSoft, Inc., Tulsa, Oklahoma, USA).
In F2 hybrids, variance components and mixed-model ANOVA of Statistica with genotype (marker) and grandparent-of-origin effect as fixed factors and age as a covariate were used to evaluate the role of genetic factors controlling the frequency of cell subpopulations and the relative spleen weight. When necessary for analysis by ANOVA, the original values of an analyzed parameter were transformed for normalization of the distribution as described in the legends to the tables. Markers and interactions with p < 0.05 were combined in a single comparison. All obtained nominal p-values were corrected for multiple testing by Bonferroni correction.
ANOVA or t-tests (as indicated) were used in GraphPad (version 5.04) to evaluate the effect of genetic factors controlling the expression level of potential candidate genes and size of the white pulp.
Results
Combination of Genomes of Two Parental Strains Gives Rise to a Strain Exceeding Hematological Parameters of Both of Them
We analyzed frequencies of the main myeloid and lymphoid subpopulations in spleens of mice of the parental strains B10 and O20, and of recombinant strain B10.O20. For characterization of myeloid cell population, we examined markers F4/80, CD11b, and CD14 to characterize macrophage lineage, co-expression of CD11b and Gr1 to characterize granulocytes, and CD40 as a marker leukocyte with antigen-presenting function. For the characterization of T-cell lineage, we used a marker CD3 and markers CD4 and CD8 to distinguish the main CD3 subpopulations. Since CD4 molecule can be also expressed by other small cell populations, we also examined the presence of CD3+CD4+ (helper T cells) and CD3+CD8+ (cytotoxic T cells) subpopulations. To characterize cells of the B-cell lineage, we used B-cell marker CD19, which distinguishes B-cell lineage from T cells (41). Representative dot plots of myeloid and lymphoid cell subpopulations are shown in Supplementary Figures 1, 2, respectively. Frequencies of CD11b+, CD11b+Gr1+, CD14+, and F4/80+ cells in B10.O20 mice were about double their frequency in the parental strains B10 and O20, while the frequencies of CD3+, CD4+, CD8+, and CD3+CD8+ were significantly lower. Also, frequency of CD11b+, CD14+, and CD19+ cells differed between the strains B10 and O20. Levels of CD3+CD4+ cells in the strain B10.O20 differed significantly from the strain O20. The frequency of CD19+ cells was similar in both B10.O20 and O20, but lower than in the strain B10. Levels of CD40+ cells were not significantly different in the three strains (Figure 1).
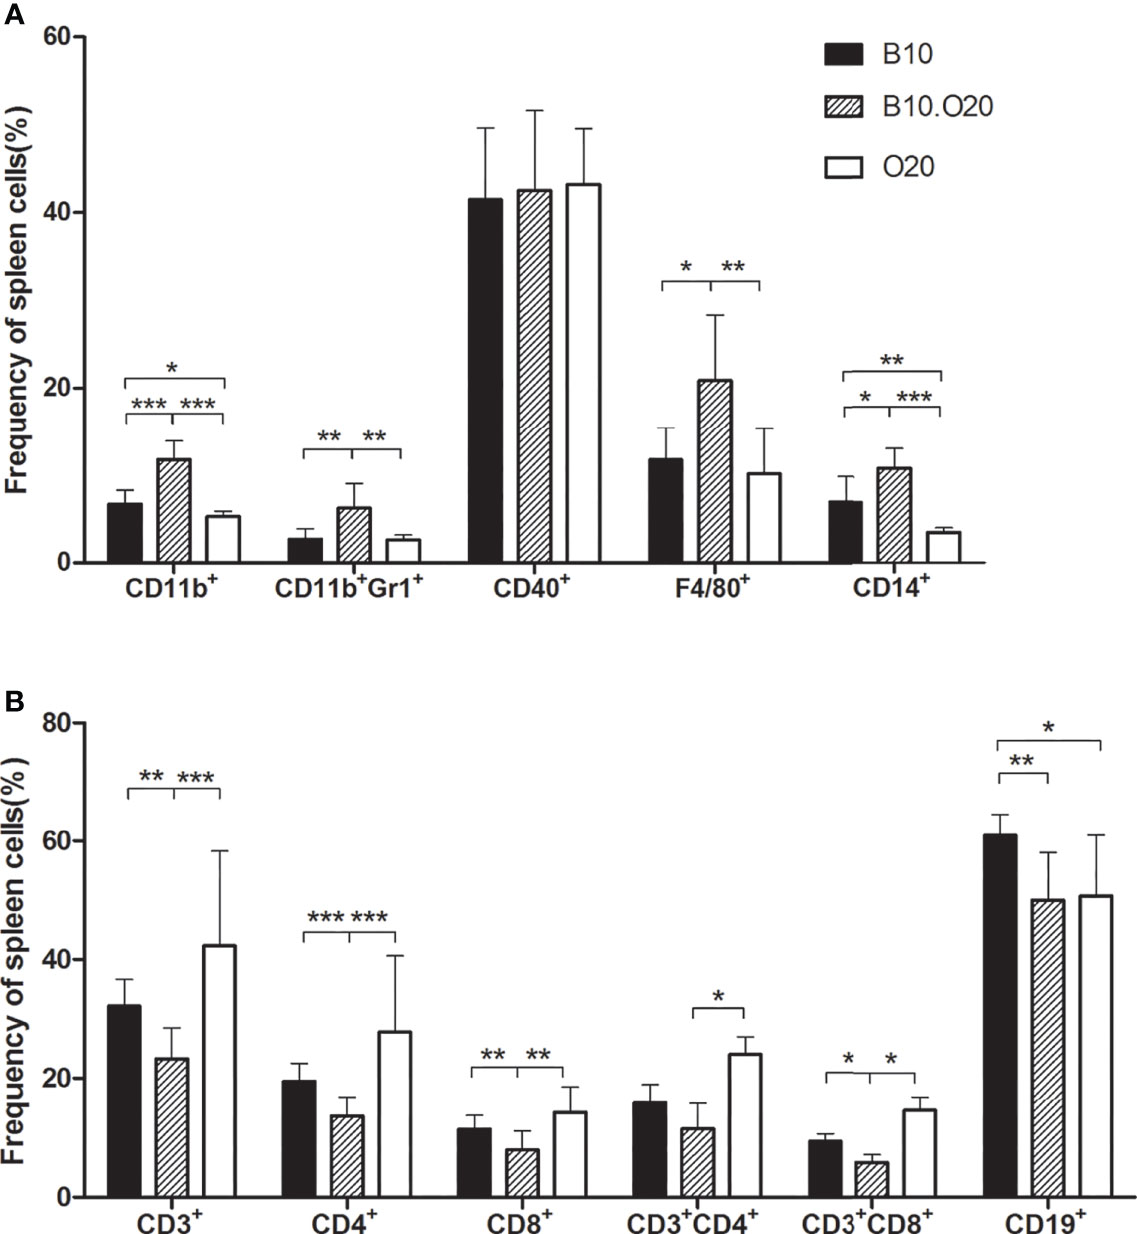
Figure 1 White blood cell subsets in spleens of strain B10.O20 and the parental strains C57BL/10 (B10) and O20. (A) The proportion of CD11b+, CD11b+Gr1+, CD40+, F4/80+, and CD14+ myeloid cell subsets. (B) The proportion of CD3+, CD4+, CD8+, CD3+CD4+, and CD3+CD8+ T-cell lineages, and CD19+ B-cell lineages. Values represent the average levels of samples tested in triplicates +SEM. Strains B10 (n = 9), B10.O20 (n = 11), and O20 (n = 10) are represented by black, striped, or white bars respectively. *p < 0.05; **p < 0.01; ***p < 0.001 (analyzed by Mann–Whitney test).
Loci Controlling Differences in MDC Frequencies
Subsequently we used F2 hybrids between B10 and B10.O20 in order to map the genes controlling the frequencies of immune cell subsets in the strain B10.O20 and the relative spleen weight. We measured the frequencies of CD11b+, CD11b+Gr1+, CD11b+Ly6C+, CD11b+Ly6G+, CD11b+Siglec-F+, CD19+, and CD40+ cells, and the levels of Gr1+Siglec-F- cells from CD11b+ cells (hereafter noted as neutrophils) and eosinophils (Gr1-Siglec-F+ cells from CD11b+ cells) by flow cytometry. We genotyped the O20-derived segments in F2 mice to detect the loci linked with cell subpopulation frequencies and analyzed the results by one-way ANOVA. Figure 2 and Table 2 summarize the loci controlling several phenotypes observed in the strain B10.O20.
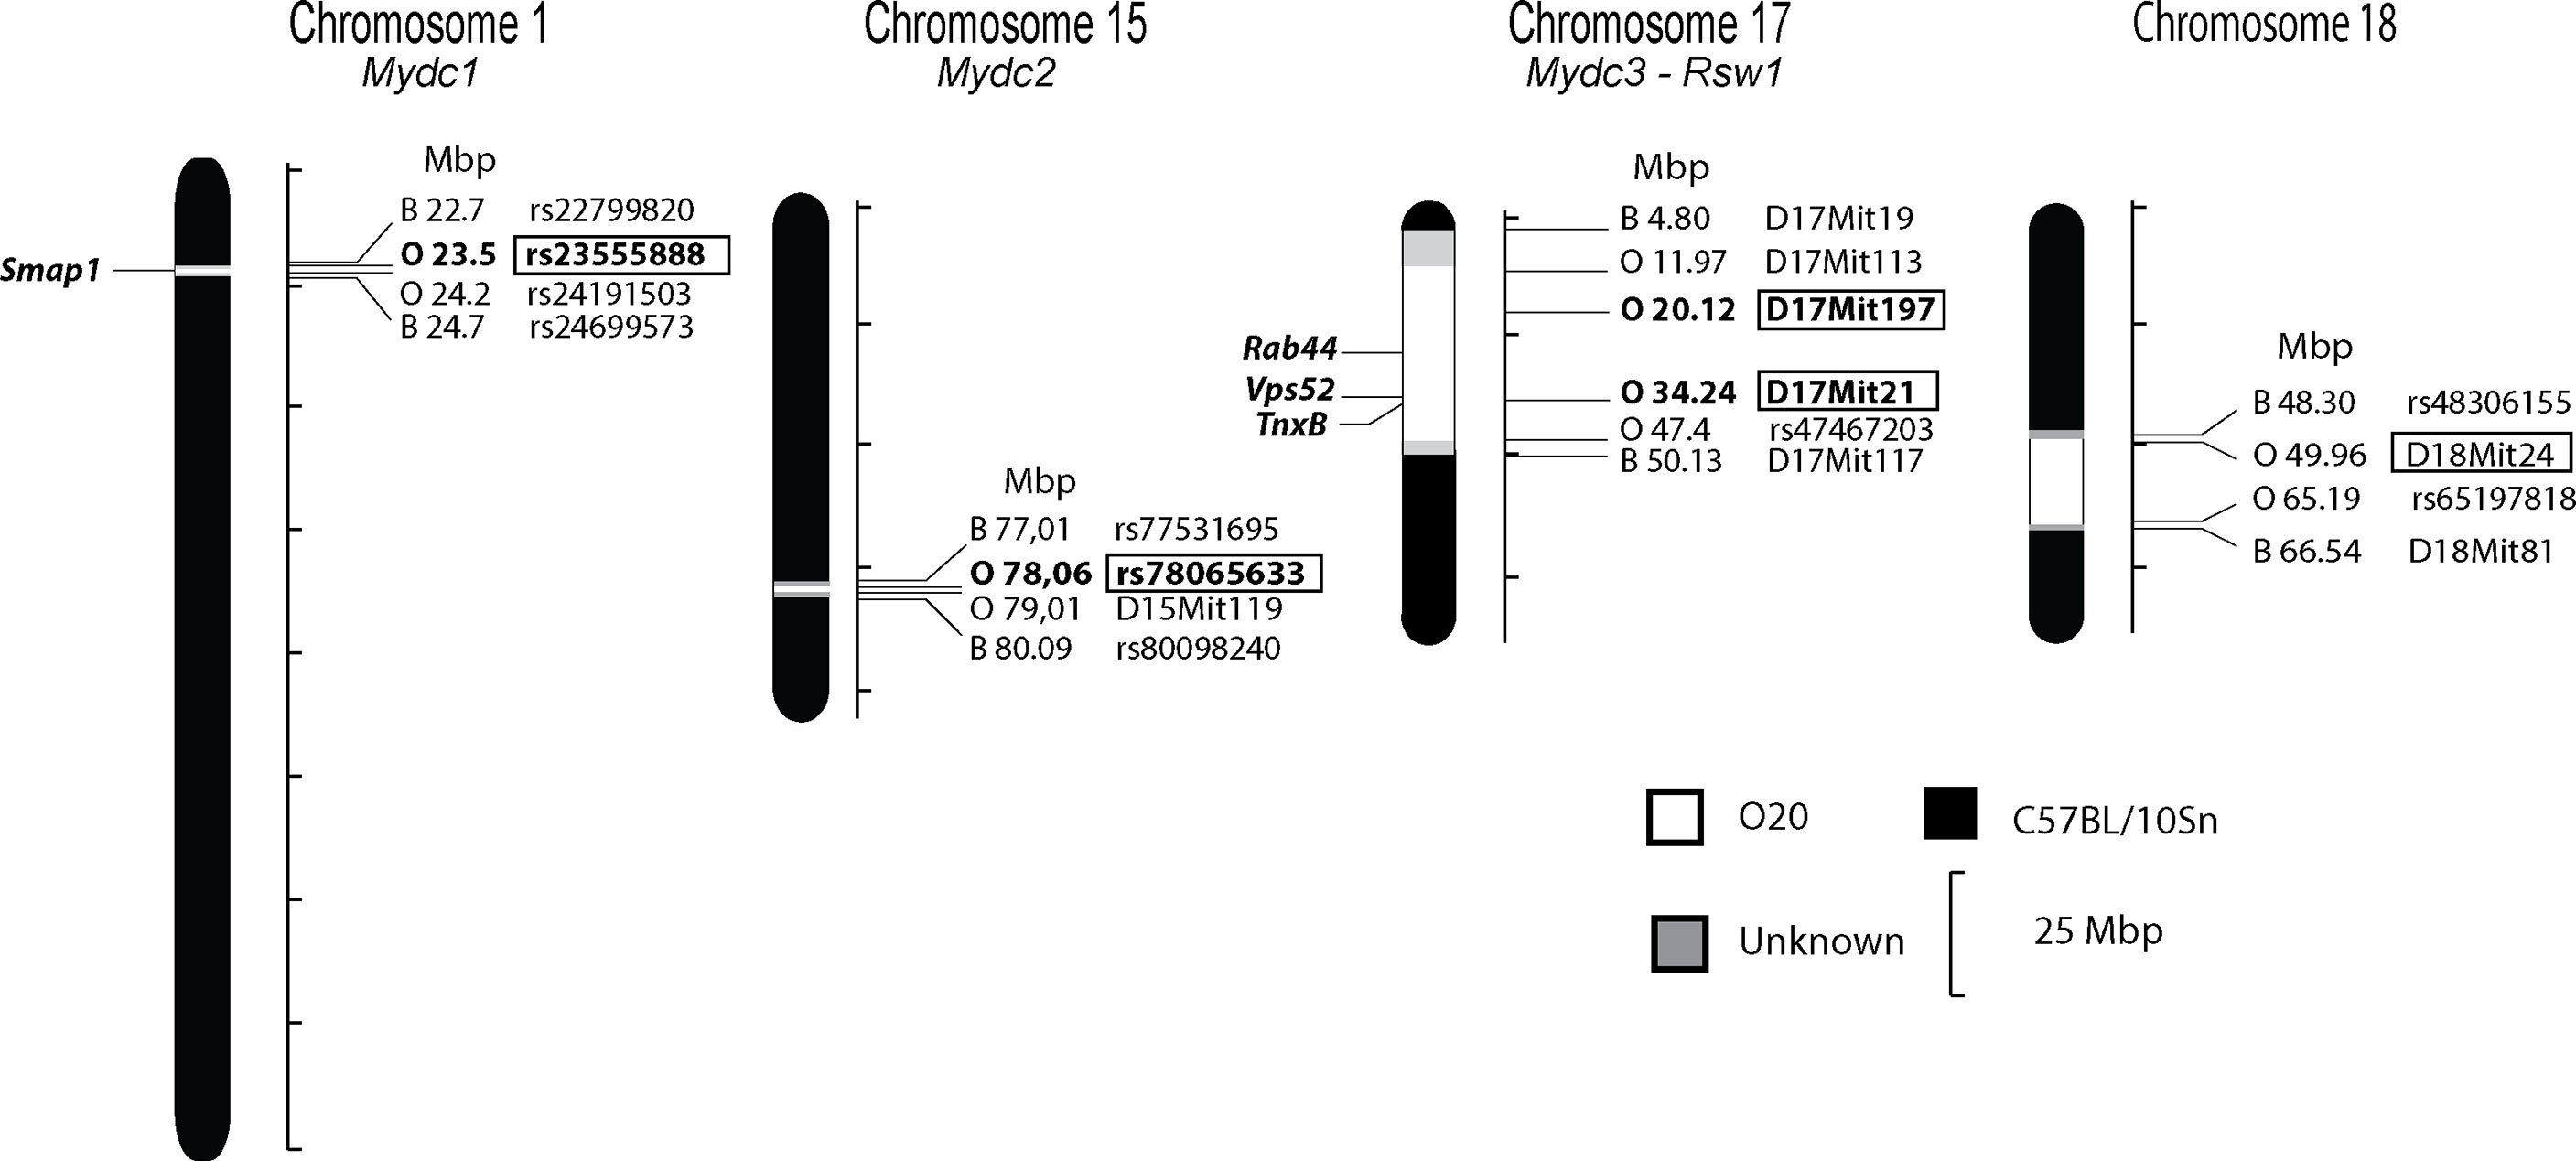
Figure 2 Positions of the loci that control relative spleen weight and frequencies of myeloid-derived subpopulations in spleen of the strain B10.O20. The regions of C57BL/10 and O20 are represented as black and white, respectively; the boundary regions of undetermined origins are shaded. The identified loci Mydc1-3 and Rsw1 and potential candidate genes are indicated. Only the markers or SNPs defining the boundaries of O20-derived segments and markers that were tested for linkage are shown (except syntenic D17Mit10). Bold in box—significant linkage, regular font in box—suggestive linkage.
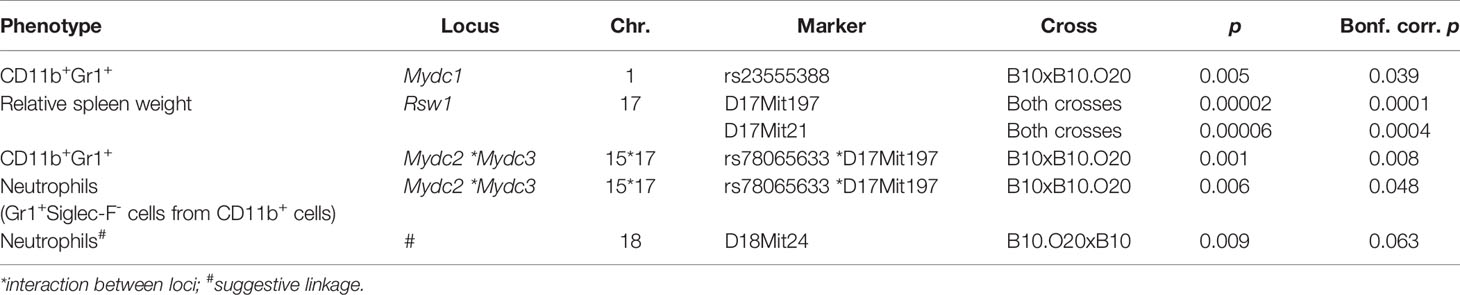
Table 2 Summary of loci controlling spleen cell subsets in B10.O20.
Loci Mydc1 (Myeloid-derived cells 1) on chromosome 1, Rsw1 (Relative spleen weight 1) on chromosome 17, and the suggestive locus on chromosome 18 exhibit a single gene effect (Table 3 and Figures 3, 4). Locus Mydc1 linked with rs23555388 influences the frequency of the CD11b+Gr1+ subpopulation (Bonferroni corr. p = 0.039). Homozygotes in O20 allele (OO) exhibit higher numbers of CD11b+Gr1+ cells in spleen. The effect of this locus was observed only in the cross between B10 females and B10.O20 males, but no significant interaction between cross and SNP marker was observed. Although linkage for the cross B10.O20xB10 was not significant, phenotypes were concordant with the B10xB10.O20 cross, with OO genotype being the highest and BB genotype being the lowest. Locus Rsw1 is linked to the markers D17Mit197 (Bonferroni corr. p = 0.0001) and D17Mit21 (Bonferroni corr. p = 0.0004). Mice homozygous in B10 (BB) allele of this locus show higher relative spleen weight. We have detected a suggestive linkage of neutrophil subpopulation with marker D18Mit24 (Bonferroni corr. p = 0.063). Heterozygotes in this locus had lower frequency of this subpopulation. The effect of this locus was observed only in the cross between B10.O20 females and B10 males, but no significant interaction between cross and genetic marker was observed.
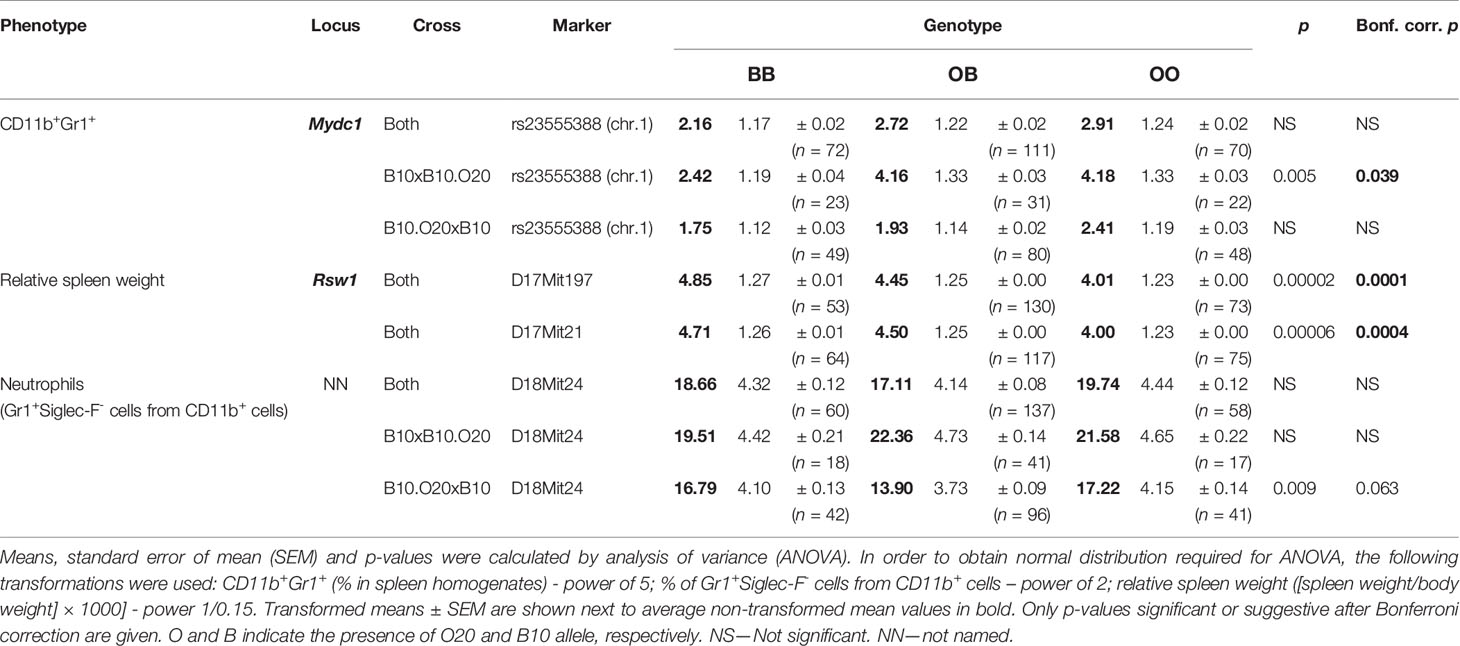
Table 3 Loci controlling frequencies of myeloid-derived spleen cells and relative spleen weight in F2 hybrids between B10.O20 and B10.
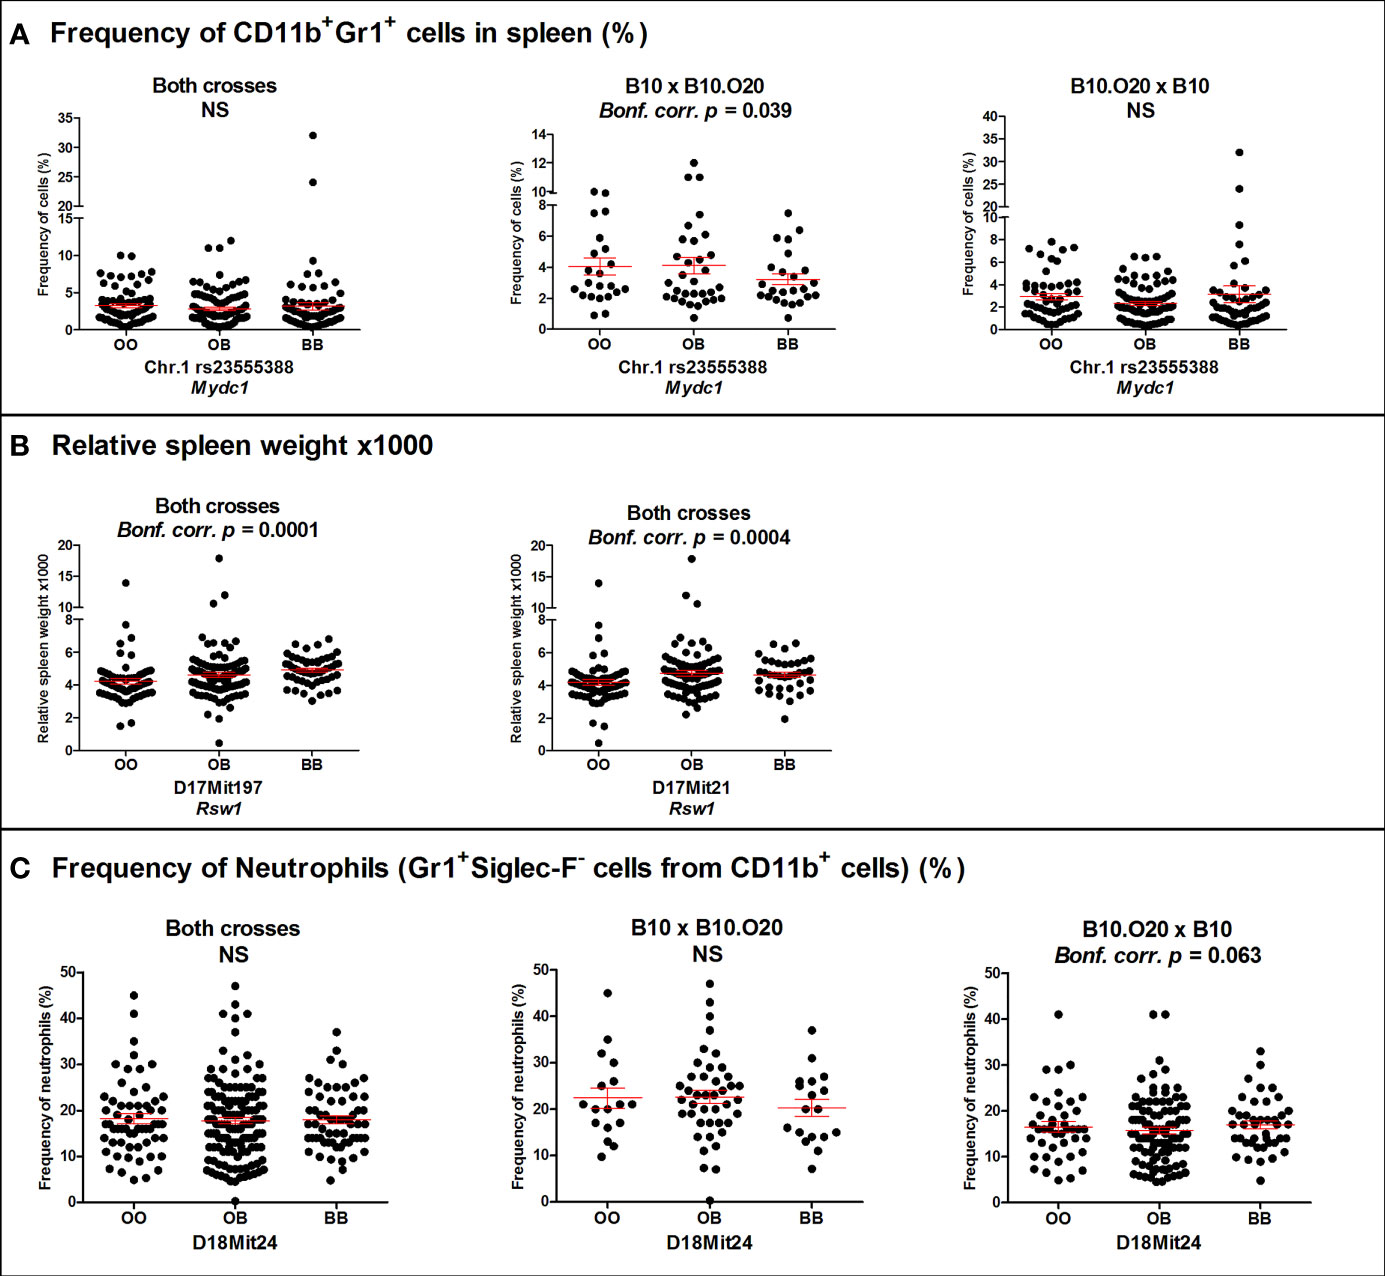
Figure 3 Genetic influence on frequency of (A) CD11b+Gr1+ cells, (B) relative spleen weight, and (C) neutrophils. Individual F2 hybrid mice between strain B10.O20 and B10 are shown. Means ± standard error mean (red lines) and p-values were calculated by analysis of variance (ANOVA). O and B indicate the presence of O20 and B10 allele, respectively. NS, Not significant.
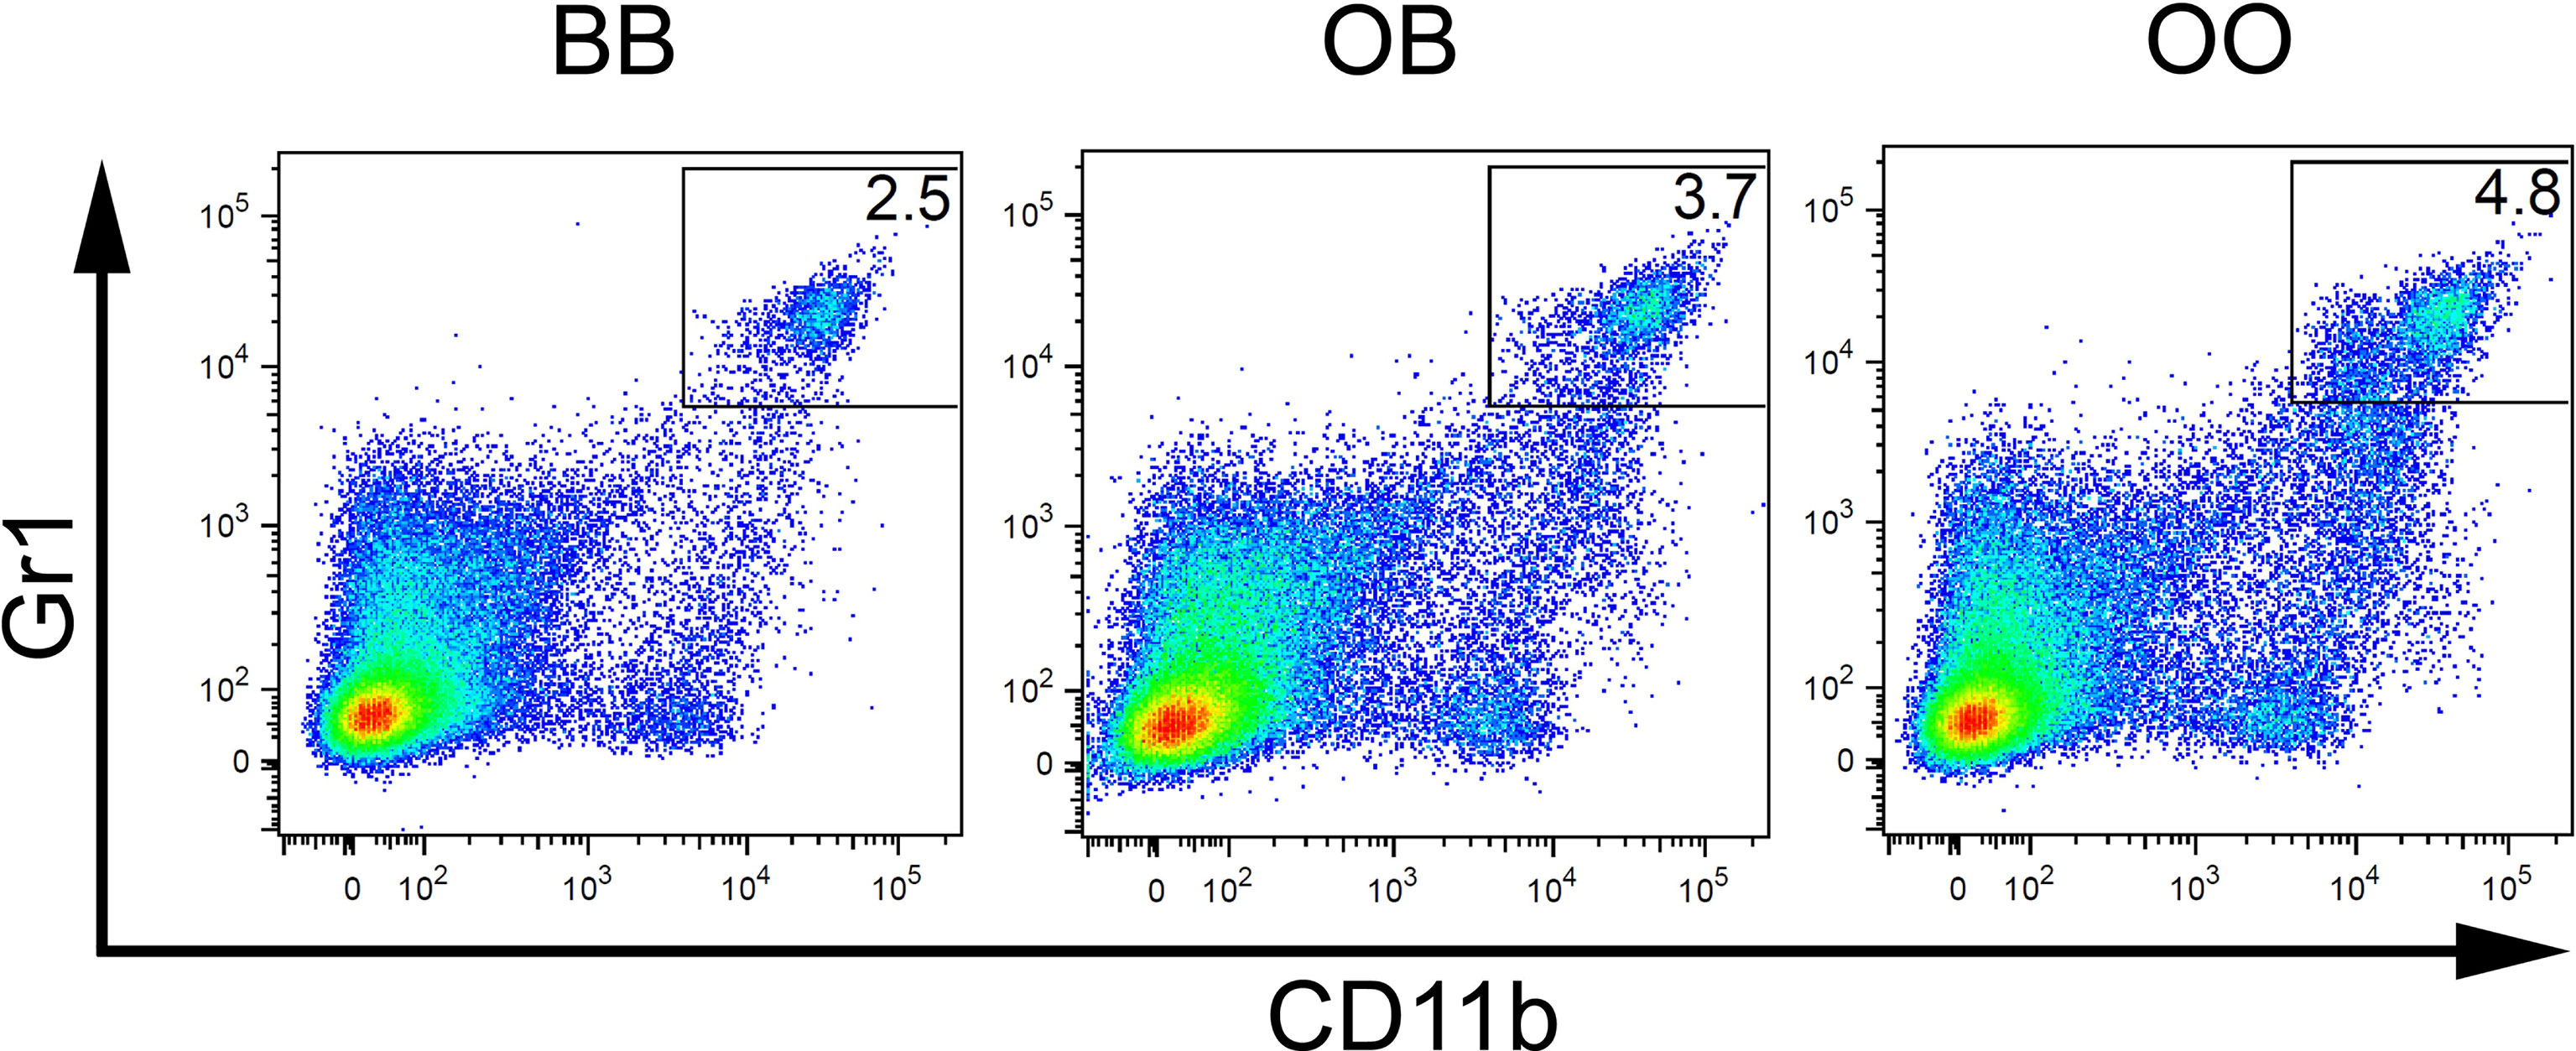
Figure 4 Genetic influence on frequency of CD11b+Gr1+ cells. Flow cytometry analysis of spleens of representative mice with BB, OB, and OO genotypes showing the Gr1/CD11b cell surface marker status of individual cells. O and B indicate the presence of O20 and B10 allele, respectively.
Interaction between locus Mydc2 linked to rs78065633 on chromosome 15 and locus Mydc3 linked to D17Mit197 on chromosome 17 controls both frequency of CD11b+Gr1+ cells (Table 4A and Figures 5A, 6A) and Gr1+Siglec-F- subpopulation from CD11b+ cells (Table 4B and Figures 5B and 6B) in spleen. In both interactions, higher levels of tested subpopulations were present in OO homozygotes in both Mydc2 and Mydc3. The linkages were detected only in the cross B10xB10.O20, but the interactions between cross and marker were not significant (nominal p-value = 0.15 and 0.11, respectively).
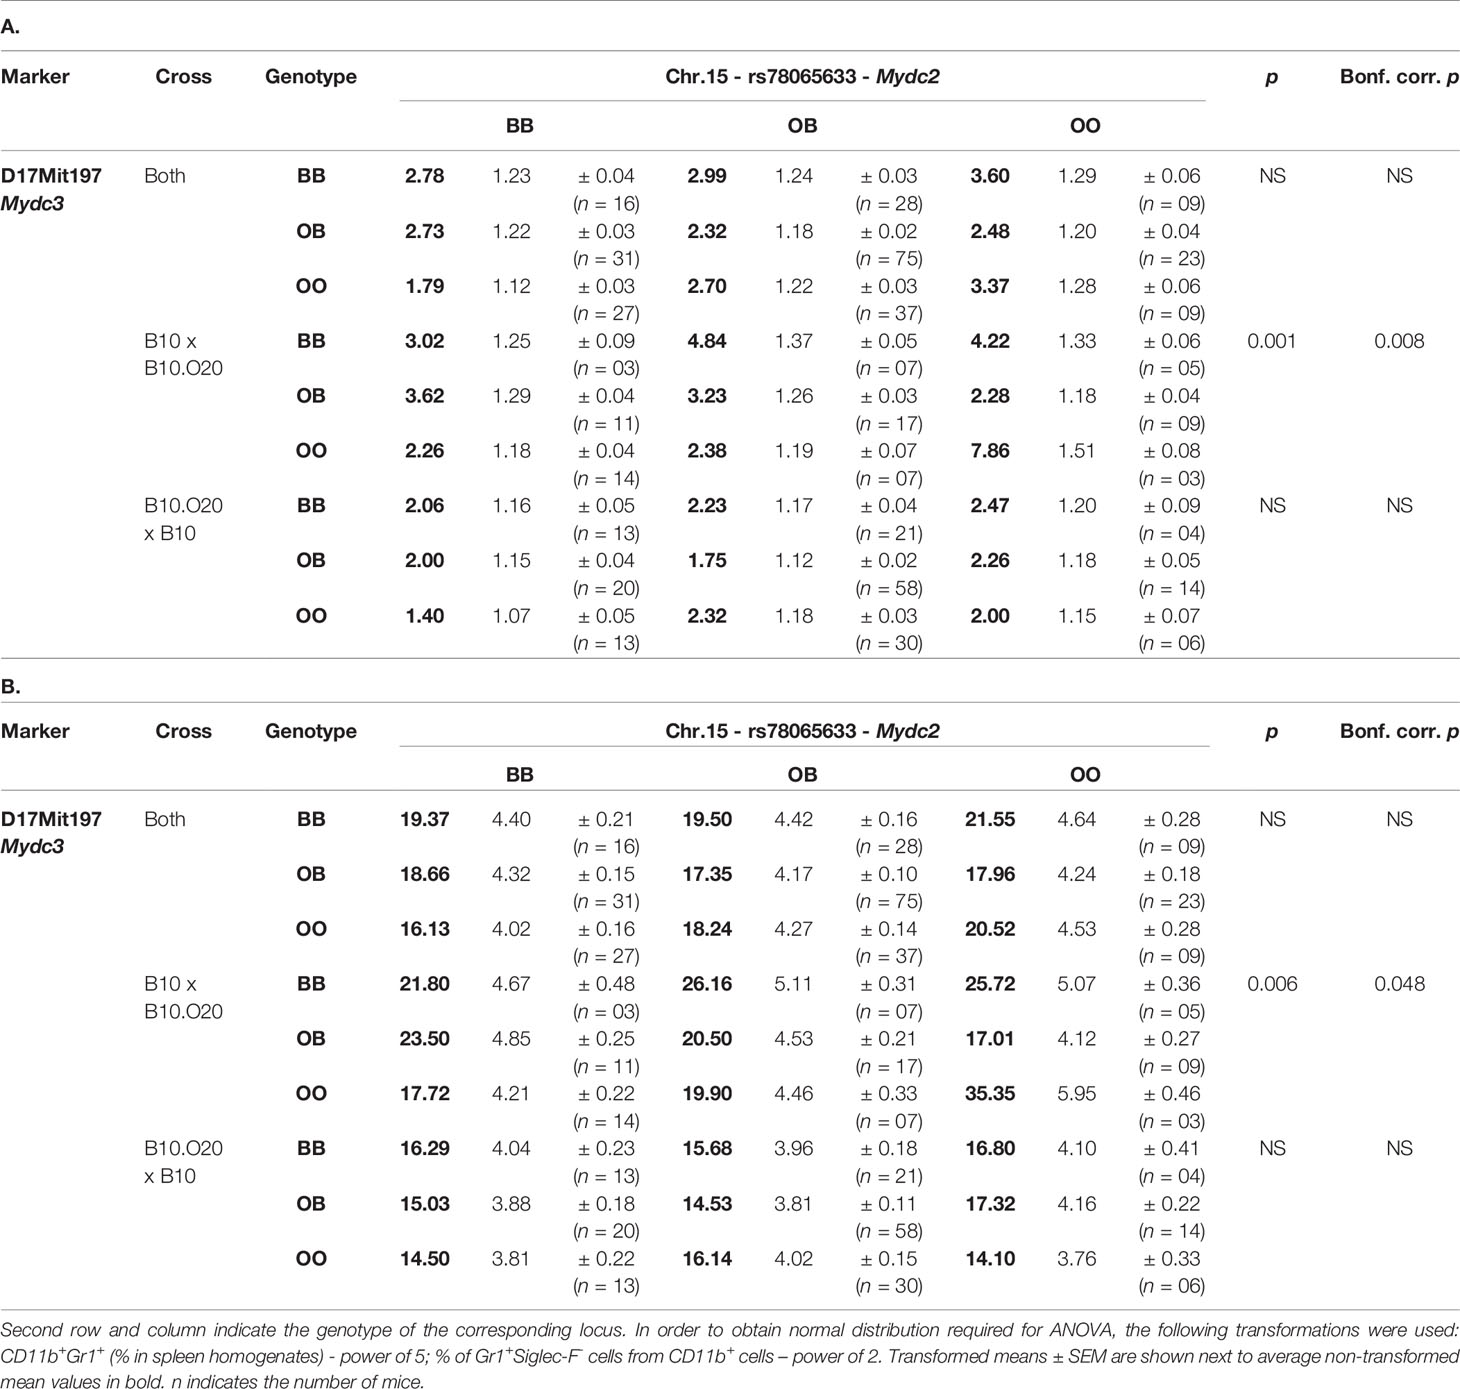
Table 4 Interaction between Mydc2 and Mydc3 controls the levels of CD11b+Gr1+ cells (A) and neutrophils (Gr1+Siglec-F- cells from CD11b+ cells) (B) in spleen.
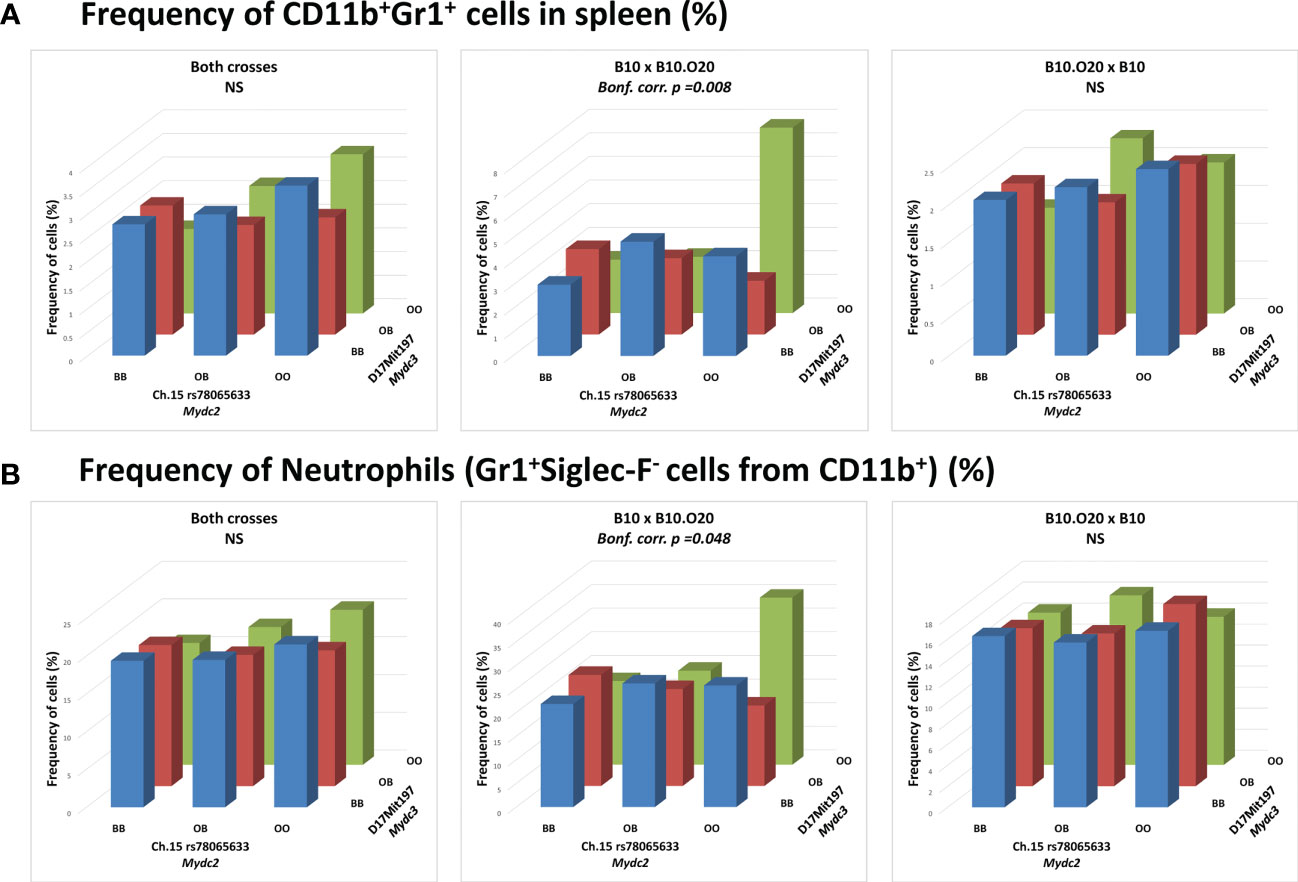
Figure 5 Interaction between loci Mydc2 and Mydc3 in control of myeloid-derived cells. Bars indicate the average frequency of (A) CD11b+Gr1+ cells or (B) neutrophils (Gr1+Siglec-F- cells from CD11b+ cells) for the indicated cross and genotype. p-values were calculated by analysis of variance (ANOVA). O and B indicate the presence of O20 and B10 allele, respectively. NS, Not significant.
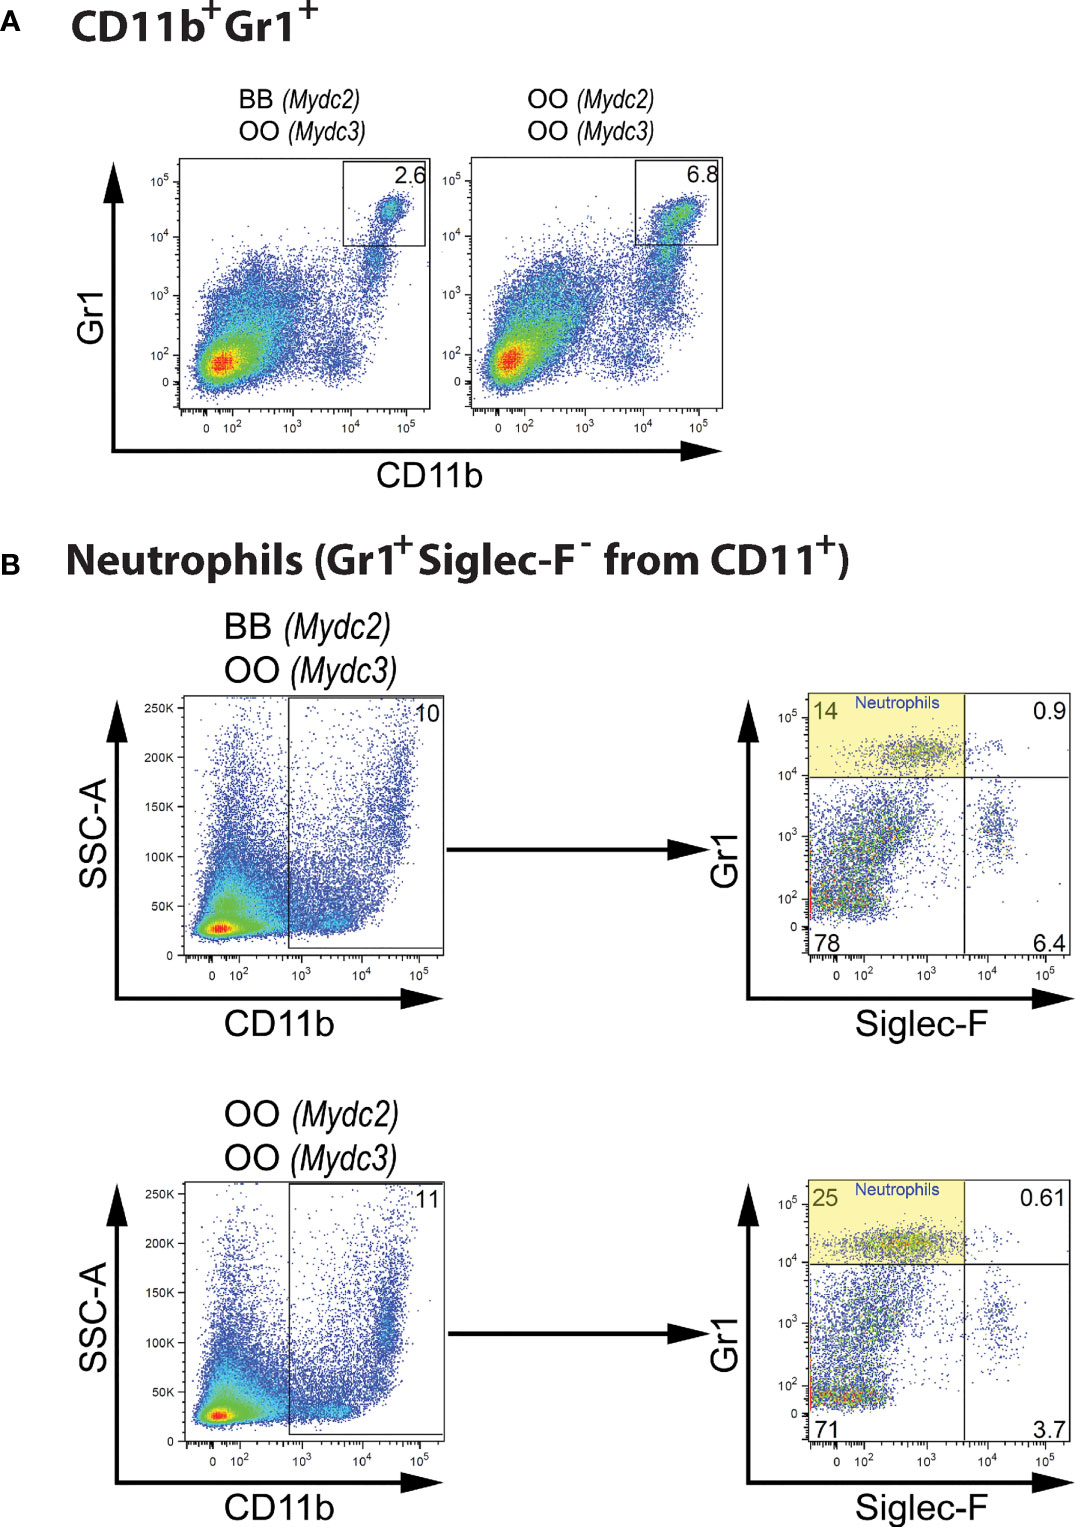
Figure 6 Genetic interactions influencing frequency of myeloid-derived cells. (A) Flow cytometry analysis of spleens of representative mice carrying combination of BB (Mydc2) and OO (Mydc3) genotypes, and OO homozygotes in both Mydc2 and Mydc3 showing the Gr1/CD11b cell surface marker status of individual cells. (B) Spleen cell gating strategy for analysis of genetic influence on neutrophil frequency. O and B indicate the presence of O20 and B10 allele, respectively.
Locus Rsw1 on Chromosome 17 Influences Relative Spleen Weight as Well as Spleen Architecture
To investigate the effect of Rsw1 locus on spleen architecture, we compared hematoxylin-eosin-stained spleen sections of F2 hybrids between B10 and B10.O20 with the different alleles on Rsw1 (Figure 7). Interestingly, B10 homozygotes had twice larger white pulps than mice homozygous for O20 alleles (Figure 8). This observation correlates with the results in Figure 1, where frequency of lymphocytes (white pulp residents) is lower and frequency of granulocyte subsets (red pulp residents) is higher in the strain B10.O20, carrying O20 allele in Rsw1.
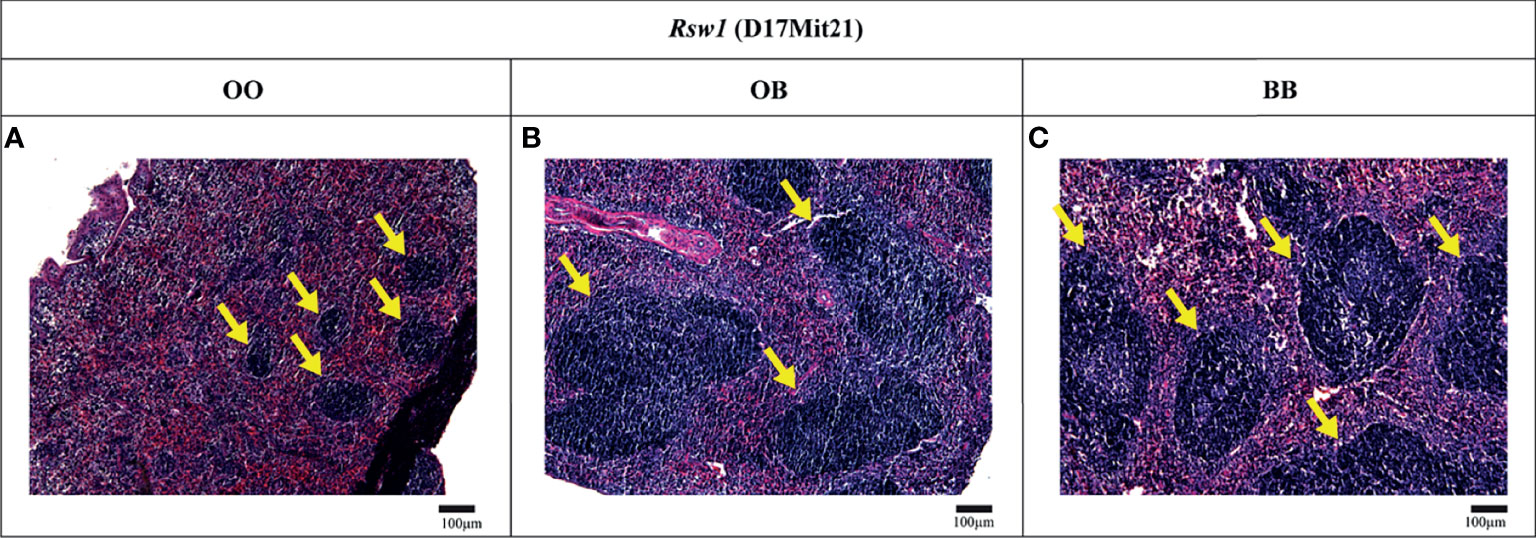
Figure 7 Spleen histology. Light micrographs of the hematoxylin and eosin-stained paraffin-embedded spleen sections of F2 hybrids between B10.O20 and B10. Indicated alleles in bold correspond to the genotype of Rsw1 (linked with D17Mit21). White pulps regions are indicated by yellow arrows. Bars represent 100 μm. Original magnification ×10.
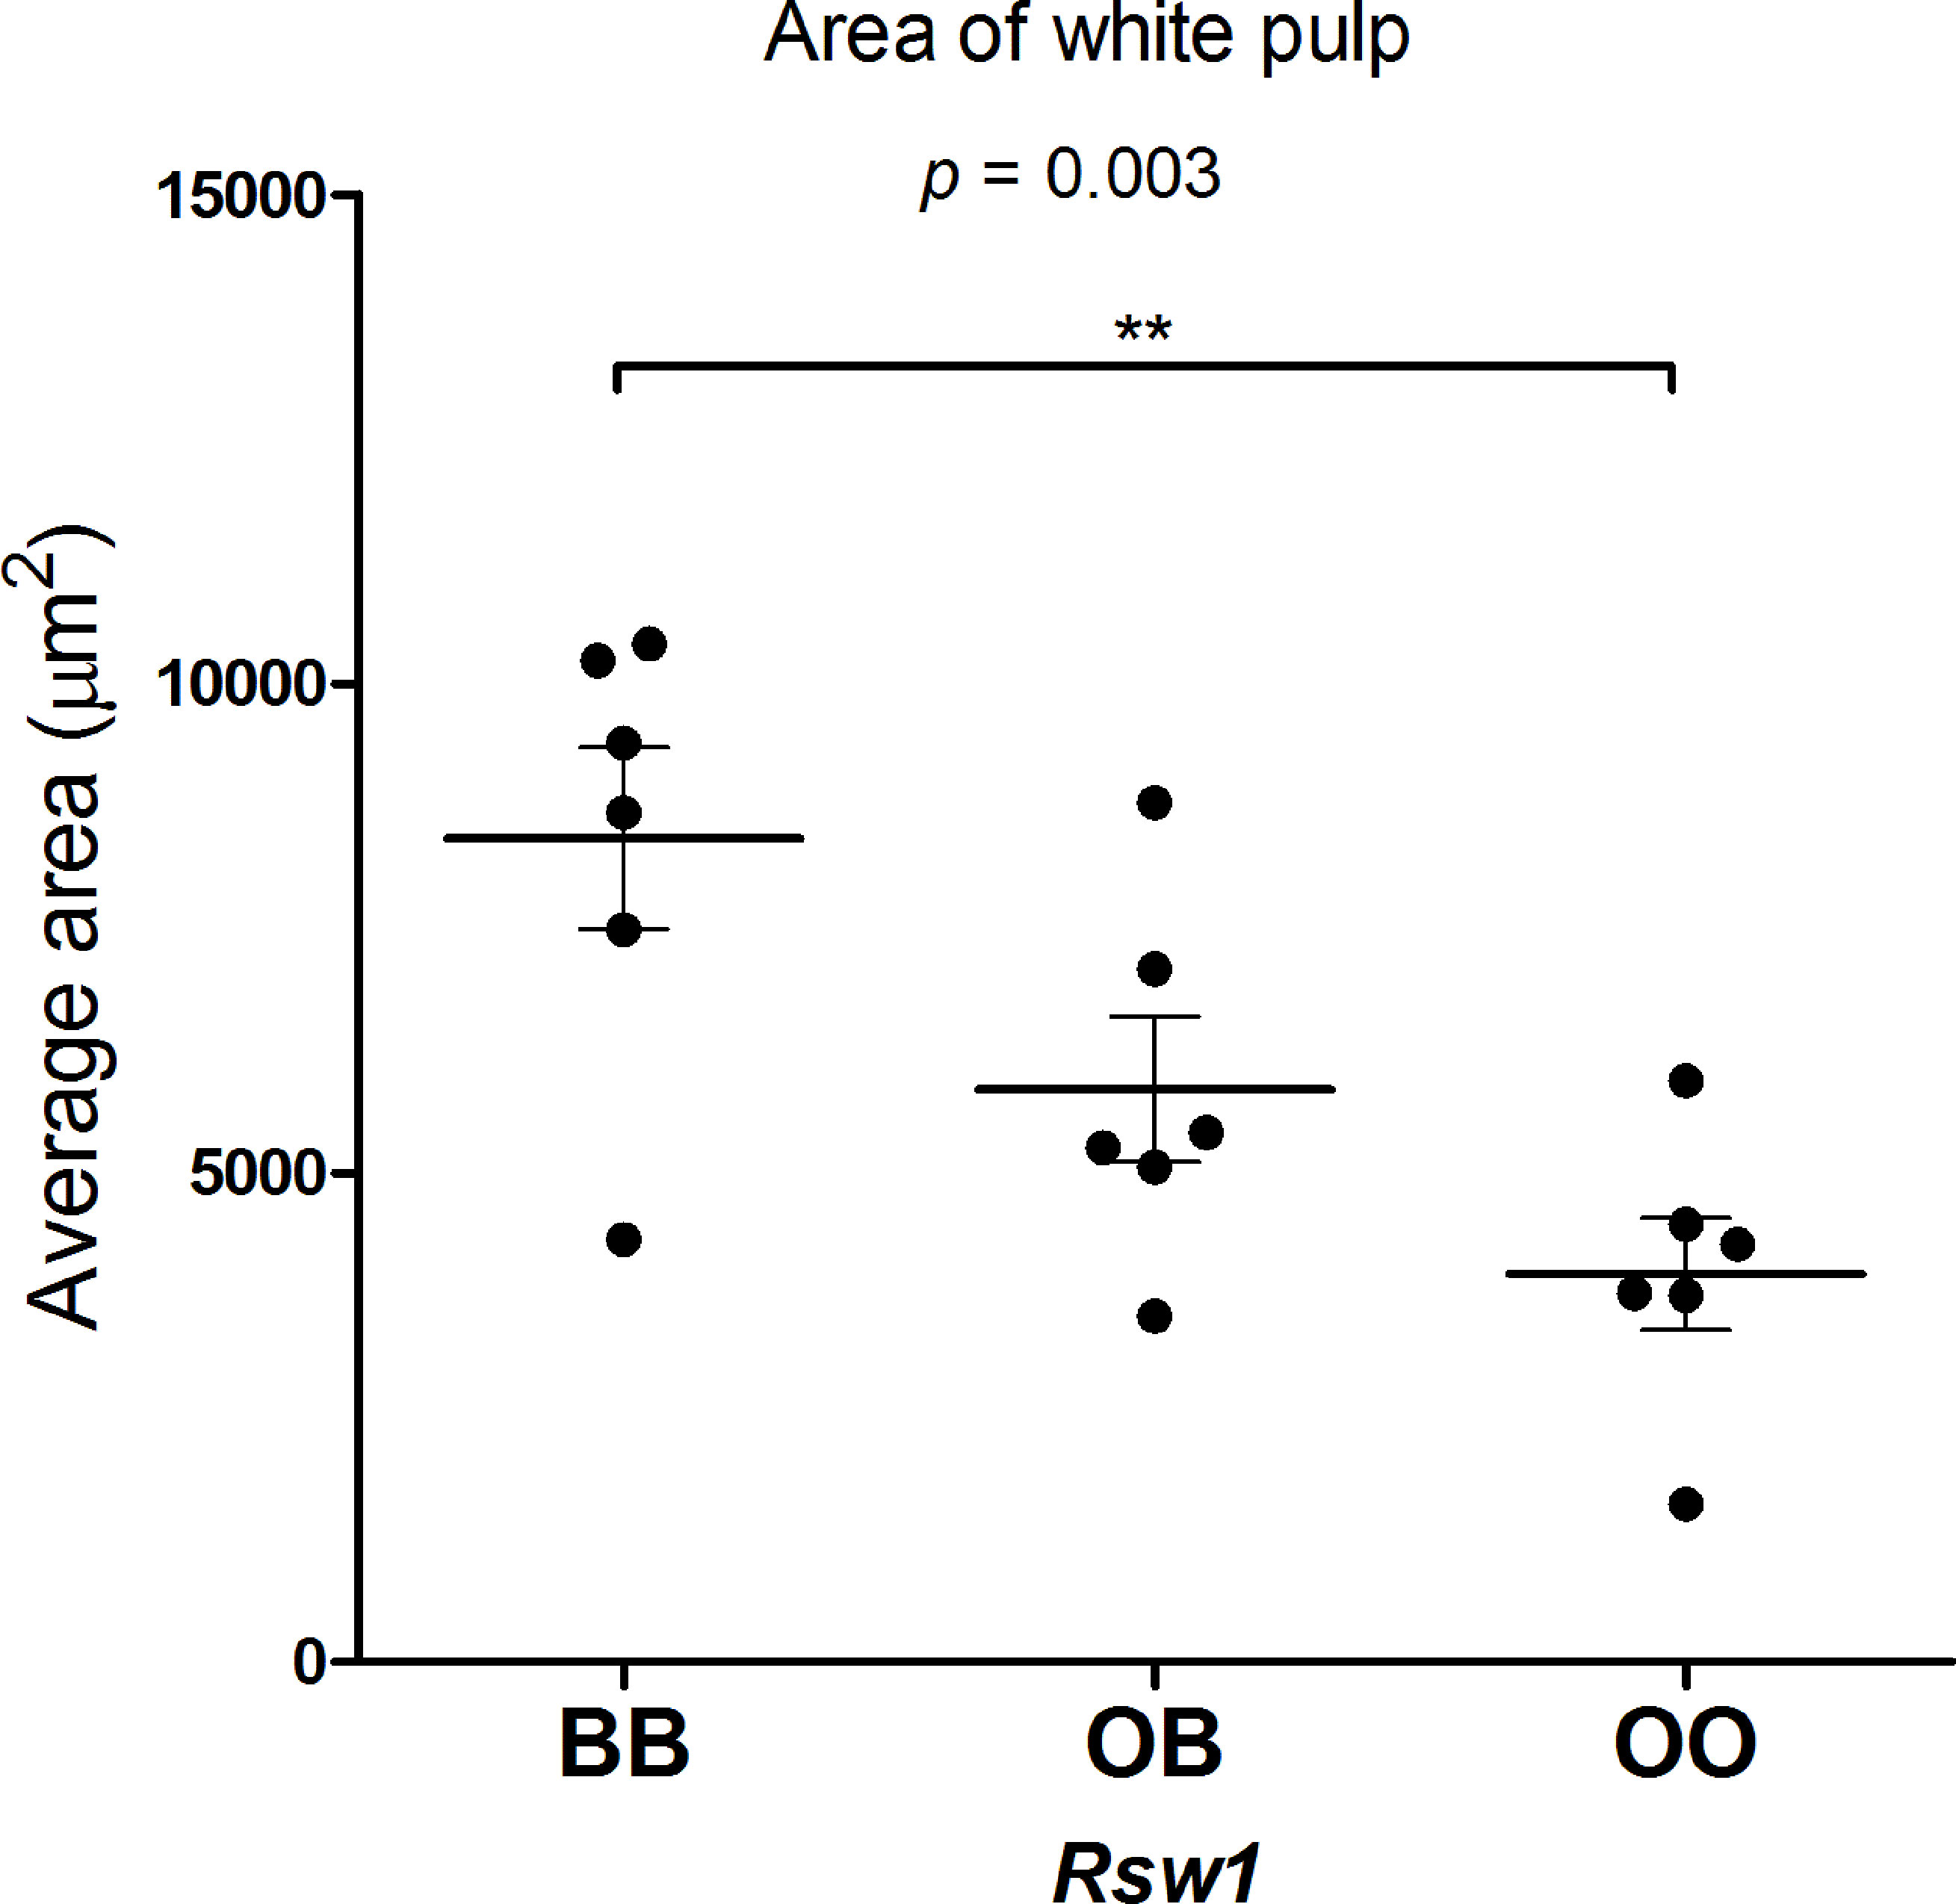
Figure 8 Area of white pulp in F2 hybrids between B10.O20 and B10. The area of the white pulp was measured using the ellipse formula a*b*π, where “a” is the major radius and “b” is the minor radius of the white pulp. Each dot represents the average area of 10 white pulps measured three times from each sample. Average age 14 weeks (median 14 weeks, min 13 weeks, max 16 weeks). Statistical analysis was performed by ANOVA, p = 0.0033. Bars represent the average ± SEM. **p < 0.01.
Potential Candidate Genes
In order to identify potential candidate genes controlling the phenotypes listed in Table 2, we sequenced the strains B10 and O20 using NGS and identified the genetic variants between B10 and O20 in the O20-derived region of B10.O20. Then, we used a range of Bioinformatics tools to predict the effects of the detected variants on the structure and function of proteins and on RNA stability (Table 5). All but one (in gene Gtpbp1) structural differences from the C57BL/6 standard strain were of O20 origin.
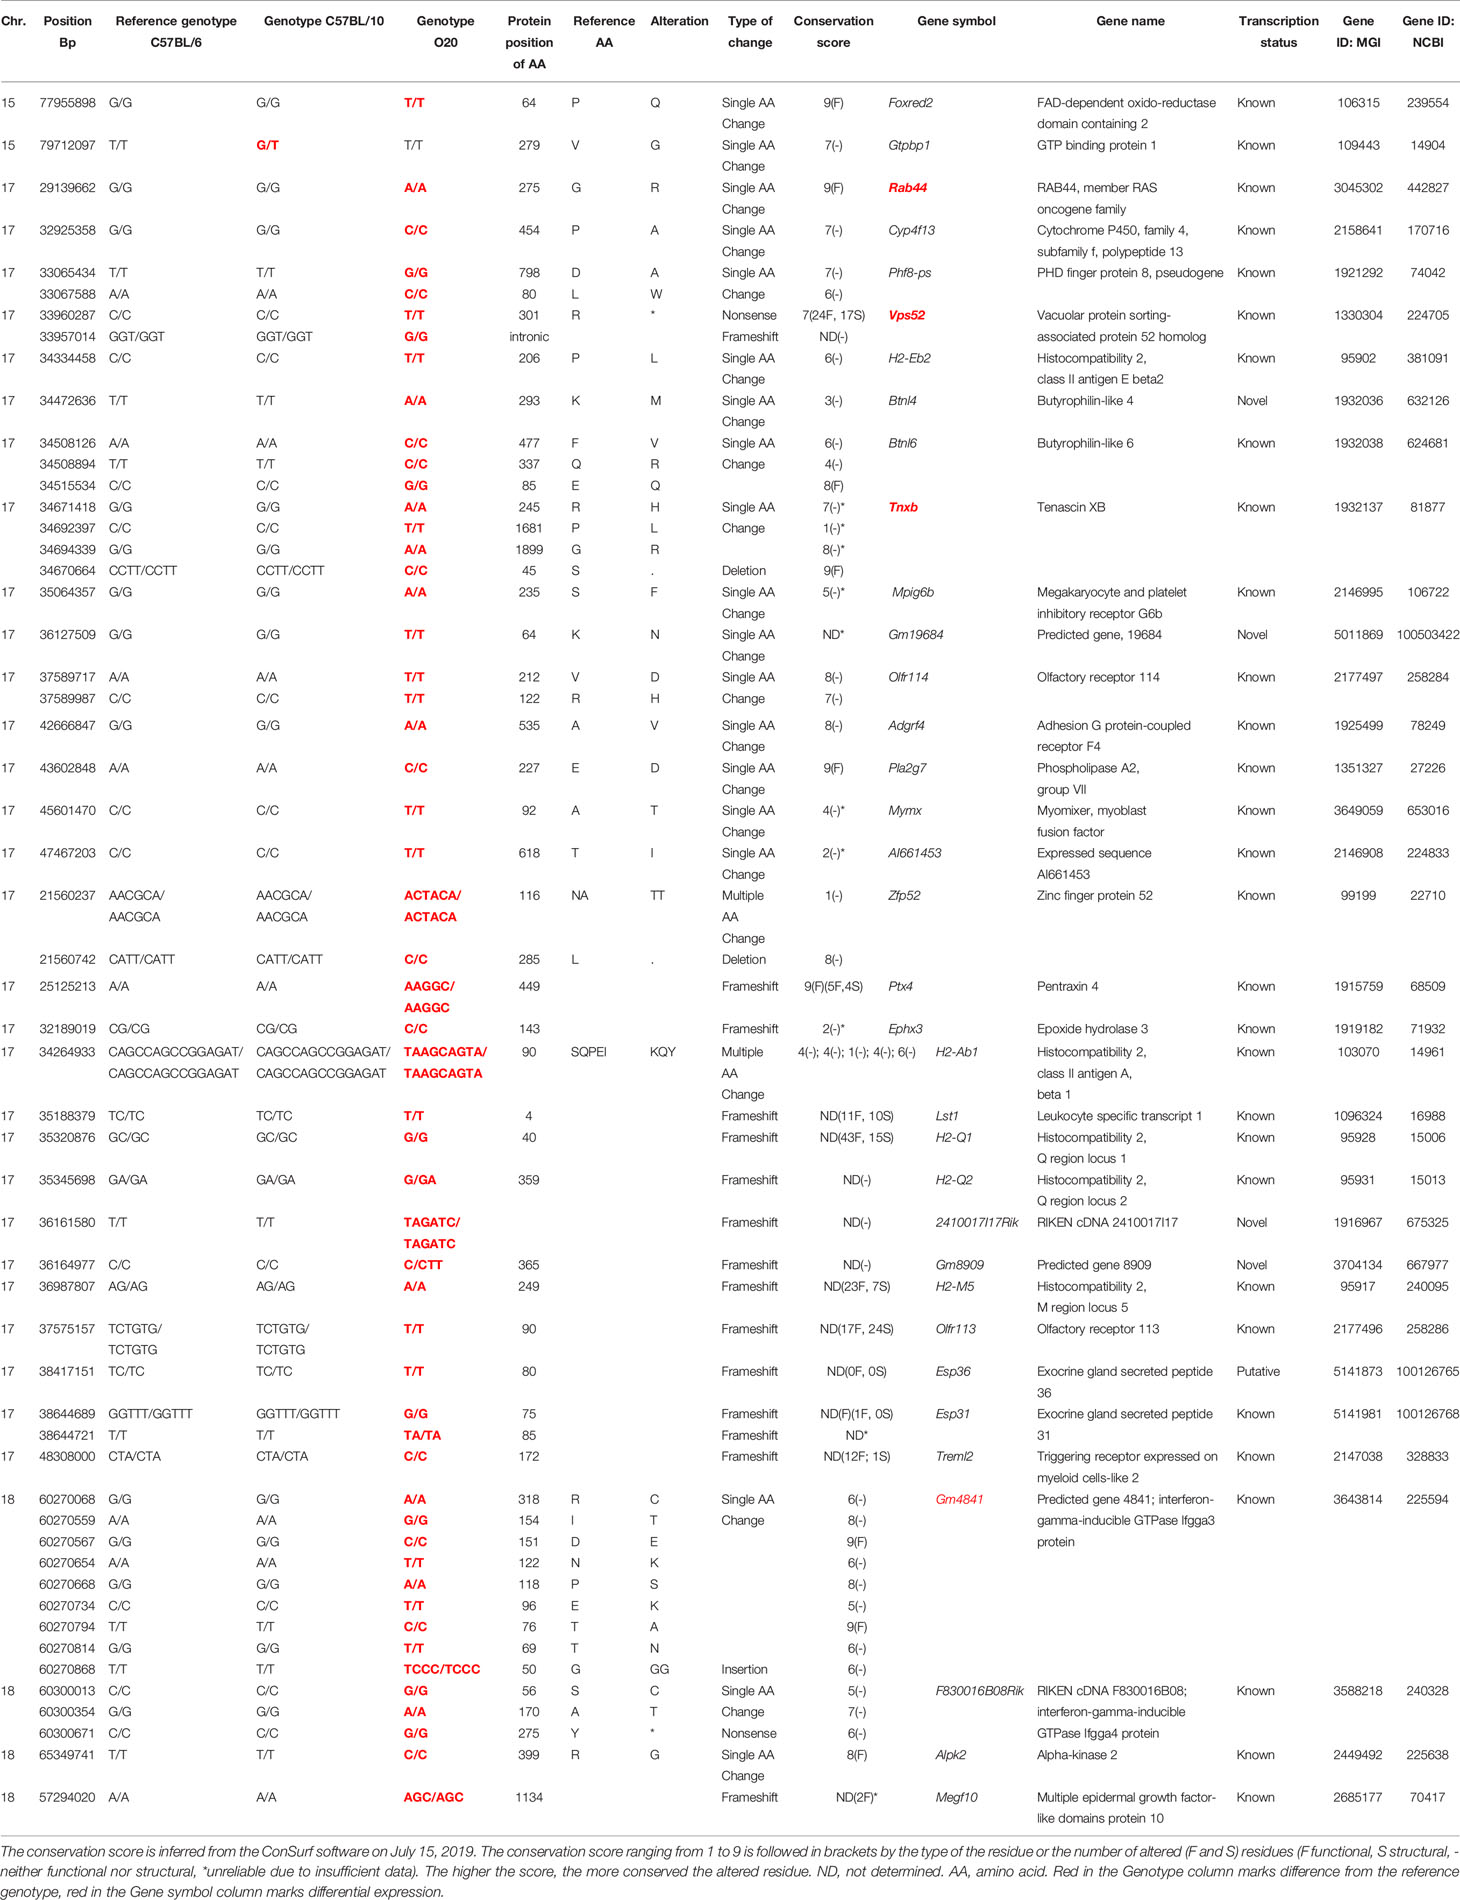
Table 5 List of candidate genes controlling cell subpopulation frequencies in strain B10.O20.
This analysis revealed two potential candidate genes on chromosome 15, 29 genes on chromosome 17, and four genes on chromosome 18 (Table 5); no polymorphisms affecting gene functions were found on chromosome 1. We chose Foxred2 in Mydc2 (chromosome 15); Rab44, Vps52, Tnxb, Pla2g7, Ptx4, Ephx3, Lst1, H2-M5, Olfr113, and Treml2 in Mydc3/Rsw1 (chromosome 17); and Gm4841, F830016B08Rik, Alpk2 and Megf10 on chromosome 18 for RNA expression studies. Selection of these genes for testing was based on the importance of the variation (we prioritized frameshift, nonsense mutation, and variants of highly conserved residues) in the corresponding loci. Samples of different genotypes were randomly selected based on their age. The differentially expressed genes (Vps52, Tnxb, Rab44, and Gm4841) are shown in Figure 9. The expression of the remaining genes was either undetectable (Ptx4, Ephx3, H2-M5, F830016B08Rik, and Megf10) or expressed without significant difference between the tested groups (Foxred2, Lst1, Pla2g7, Olfr113, Alpk2 and Treml2) (Supplementary Figure 3).
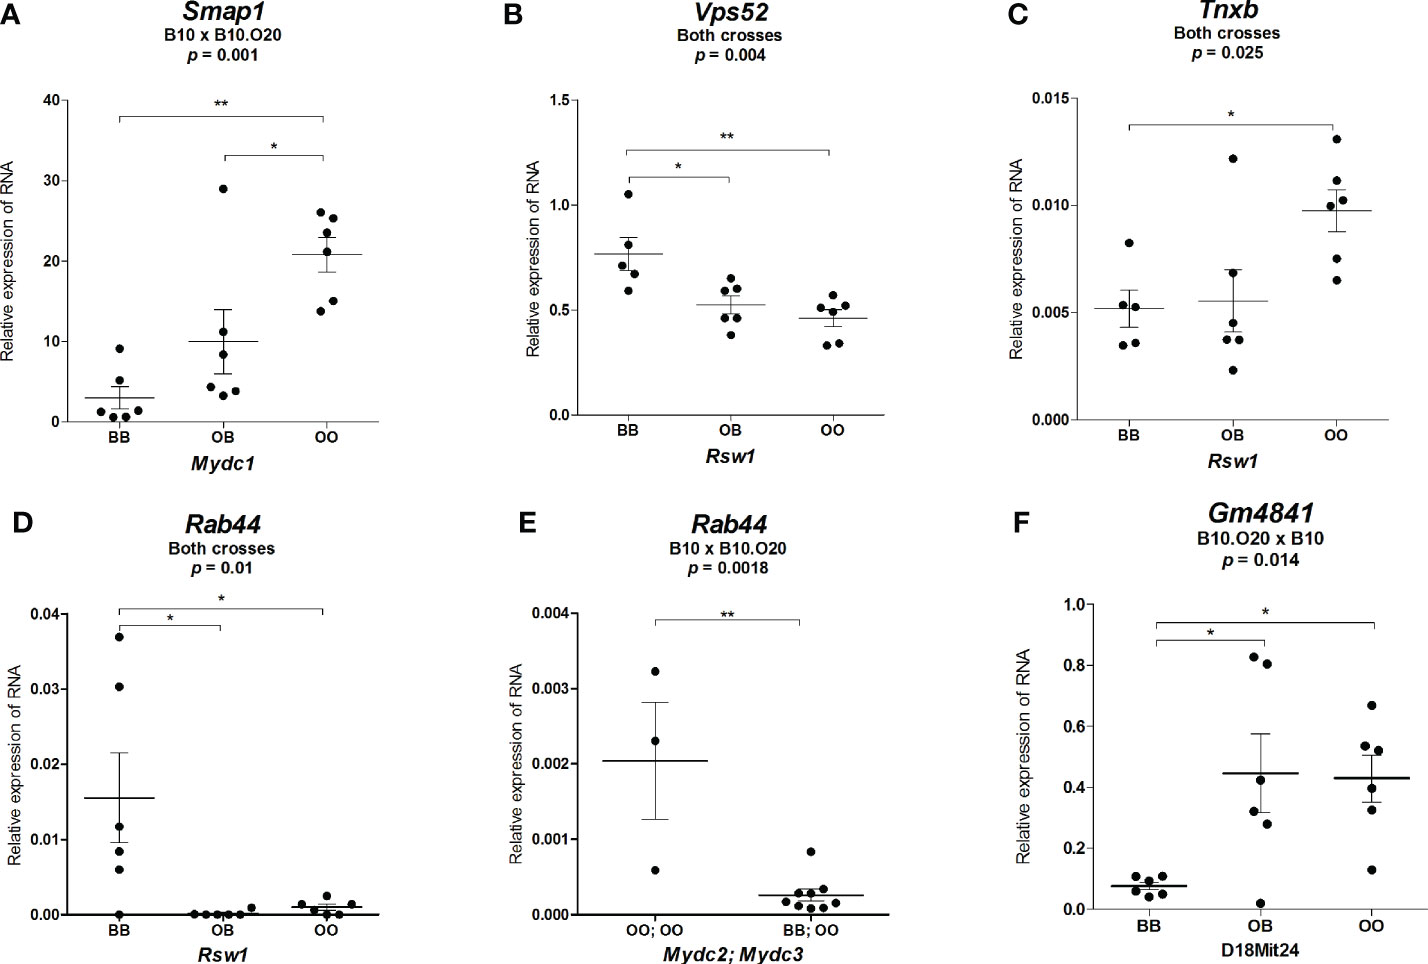
Figure 9 Expression of mRNA of potential candidate genes in spleens of F2 mice. Relative expression of a target gene versus a reference gene Gapdh is shown. Only genes with significant differential expression are presented. (A) Relative expression of Smap1 RNA in mice carrying different alleles of Mydc1 (chr.1). (B) Relative expression of Vps52, (C) Tnxb, and (D) Rab44 RNA in mice carrying different alleles of Rsw1. (E) Relative expression of Rab44 RNA in combined genotypes of Mydc2 (linked with rs78065633 – chr.15) and Mydc3 (linked with D17Mit197) corresponding to the lowest (BB; OO) and highest (OO; OO) frequency of CD11b+Gr1+ and neutrophils (Gr1+Siglec-F- cells from CD11b+ cells) in the cross B10xB10.O20. (F) Relative expression of Gm4841 RNA in mice carrying different alleles of D18Mit24. Statistical analysis was performed in (A–D, F) by ANOVA followed by Bonferroni multiple comparison test or in (E) by two-tailed unpaired t-test. p-values are as indicated. Bars represent the average ± SEM. *p < 0.05; **p < 0.01.
Smap1 Is a Potential Candidate Gene for Mydc1
Since the bioinformatics analysis of deleterious variants did not identify any candidate gene in the locus Mydc1, which is directly associated with the levels of CD11b+Gr1+ cells in spleen, we searched the Mouse Genome Informatics (42) for phenotypic function of the 8 genes (4933415F23Rik, Mir30a, Mir30c-2, Ogfrl1, B3gat2, Smap1, Sdhaf4, and Col9a1) located in Mydc1 (Supplementary Table 3). Smap1 (small ArfGAP [ADP-ribosylation factor GTPase activating protein]1) is the gene involved in both the hematopoietic and the immune systems (43, 44); other genes with potential influence on MDC frequencies are Mir30a (microRNA 30a) (45), Mir30c-2 (microRNA 30c-2) (46), Ogfrl1 (opioid growth factor receptor-like 1) (47), and Col9a1 (collagen, type IX, alpha 1) (48) (Supplementary Tables 3, 4). These five genes were tested for differential expression. Only Smap1 showed significant differences among mice with different genotypes. O20 (OO) homozygotes, which control higher frequency of CD11b+Gr1+, exhibited higher expression of Smap1 RNA than both B10 (BB) homozygotes and heterozygotes (Figure 9A). We observed a tendency toward differential expression in Ogfrl1 (Supplementary Figure 3A), but these differences were not significant, and no differential expression was found among genotypes of Mir30a, Mir30c-2i, and Col9a1 (Supplementary Figures 3B–D).
No Potential Candidate Gene Detected in Mydc2
In the linkage analysis, the effect of Mydc2 (chromosome 15) was observed only in interaction with Mydc3 (chromosome 17). Thus, we compared expression of Foxred2 (FAD-dependent oxido-reductase domain containing 2) in the combination of OO homozygotes in both Mydc2 and Mydc3 with BB homozygotes in Mydc2 and OO homozygotes in Mydc3. Although there was a tendency toward differential expression, these differences were not significant (Supplementary Figure 3E).
Vps52, Tnxb, and Rab44 Are Potential Candidate Genes for Mydc3/Rsw1
Locus on chromosome 17 is involved in control of relative spleen weight (Rsw1) and frequencies of CD11b+Gr1+ cells and neutrophils (Mydc3). Rsw1 exhibits the main (single) gene effect, whereas the influence of Mydc3 is observed only in interaction with Mydc2. Three genes—Vps52 (Vacuolar protein sorting-associated protein 52 homolog), Tnxb (tenascin XB), and Rab44 (RAB44, member RAS oncogene family)—exhibited differential expression characteristic for a single gene effect. The O20 allele of Vps52 carries a non-sense mutation that results in a loss of 24 functional and 17 structural residues (Table 5). O20 homozygotes (OO) as well as heterozygotes (OB) of Vps52 have approximately 1.6-fold lower expression than B10 (BB) homozygotes (Figure 9B). The O20 variant of TNXB includes a deletion of a highly conserved functional serine (S45del) with two single amino acid changes of three other residues (R245H, P1681L, and G1899R) (Table 5). O20 homozygotes exhibited higher Tnxb RNA expression than both heterozygotes and B10 homozygotes (Figure 9C). The O20 allele of Rab44 carries a deleterious variant of a highly conserved functional residue (G275R); glycine in B10 is in O20 replaced by arginine (Table 5). The relative expression level of Rab44 was partly similar to Vps52. Highest level of Rab44 mRNA was observed in B10 (BB) homozygotes, while O20 (OO) homozygotes and heterozygotes exhibited almost no expression (Figure 9D). Rab44 also exhibited differential expression in interaction between Mydc2 and Mydc3. OO homozygotes in both Mydc2 and Mydc3 had higher expression of Rab44 than the combination of BB homozygotes in Mydc2 with OO homozygotes in Mydc3 (Figure 9E). There were tendencies toward differential expression of genes Lst1, Vps52 (p = 0.073), and Tnxb in interaction between Mydc2 and Mydc3, but these differences were not significant (Supplementary Figures 3F–H).
Gm4841 Is a Potential Candidate Gene for a Suggestive Linkage of Neutrophil Frequency on Chromosome 18
A suggestive linkage on chromosome 18 might influence neutrophil frequency (Table 3). We analyzed the RNA expression of the potential candidate genes on chr.18; only Gm4841 (predicted gene 4841; interferon-gamma-inducible GTPase Ifgga3 protein) was differentially expressed, and B10 allele determined low RNA levels (Figure 9F). O20 allele of Gm4841 differs from B10 allele in 8 single amino acid variants, all intermediate to highly conserved residues including two functional residues, with an insertion of one residue (Table 5).
Discussion
Combination of Genomes of Two Parental Strains Gives Rise to a Strain Exceeding MDC Frequencies of Both of Them
Frequencies of several spleen cell subpopulations in B10.O20 differ from both B10 and O20 (Figure 1). Observations of progeny whose phenotype is beyond the range of that of its parents, are frequent in multigenic traits. They were seen in many tests of immune responses of recombinant congenic strains in vitro (49–51) and in vivo (27, 52–54), and in analysis of expression QTLs of chromosome substitution strains (55). These observations reflect multiple regulatory interactions, which, in new combinations of genes, can lead to new quantitative phenotypes that exceed their range in parental strains.
Novel Genes/Loci Controlling Differences in MDC Frequencies and in Relative Spleen Weight
Systems genetics allows identification of novel genes and mechanisms controlling complex diseases and phenotypes in a context similar to the natural population, which is also relevant to clinical traits (56). Here, we investigated the role of genetic variants in the control of frequencies of immune cell subpopulations in spleen of the strain B10.O20. This analysis revealed three loci Mydc1, Mydc2, and Mydc3 that control frequencies of CD11b+Gr1+ and/or neutrophil cell subpopulations, the Rsw1 locus influencing relative spleen weight, and a suggestive linkage to chromosome 18 influencing frequency of neutrophils (Table 2 and Figure 2). We have also detected potential candidate genes Smap1, Rab44, Vps52, Tnxb, and Gm4841. All alterations changing genes’ functions have been detected in genes of O20 origin (Table 5). It is not surprising as the strain B10 (C57BL/10) is more genetically related to the reference strain C57BL/6. O20 is an inbred mouse strain of unknown origin. Despite several potentially deleterious mutations described here and retinal degeneration (57), O20 mice are otherwise healthy and are highly resistant to leishmaniasis (27), resistant to breast (58) and small intestinal (59) cancer, and susceptible to lung cancer (60).
We were unable to test genes Ptx4, Ephx3, H2-M5, F830016B08Rik, and Megf10, because their expression was very low or undetectable. These results are in agreement with findings of others (Supplementary Table 5).
Experimental Data and Literature Support Role of Smap1 in Control of Frequency of CD11b+Gr1+ Cells by Mydc1
Mydc1 modifies the frequency of CD11b+Gr1+ cells. Because we did not detect any genetic variants influencing gene function(s) on the chromosomal segment on chromosome 1 comprising Mydc1, we tested the expression of Smap1, which influences the hematopoietic and immune systems (43, 44) (Table 6). It also influences differentiation and migration of polymorphonuclear neutrophils via activation of Arf6 (77). B10 homozygotes that exhibit lower frequency of CD11b+Gr1+ cells than O20 homozygotes (Figure 9A and Table 3) also show lower level of Smap1 expression. As we have detected neither functional polymorphism in Smap1 gene nor extrachromosomal segment interacting with Mydc1, differential expression of Smap1 is likely cis-regulated by genetic element localized outside this gene.
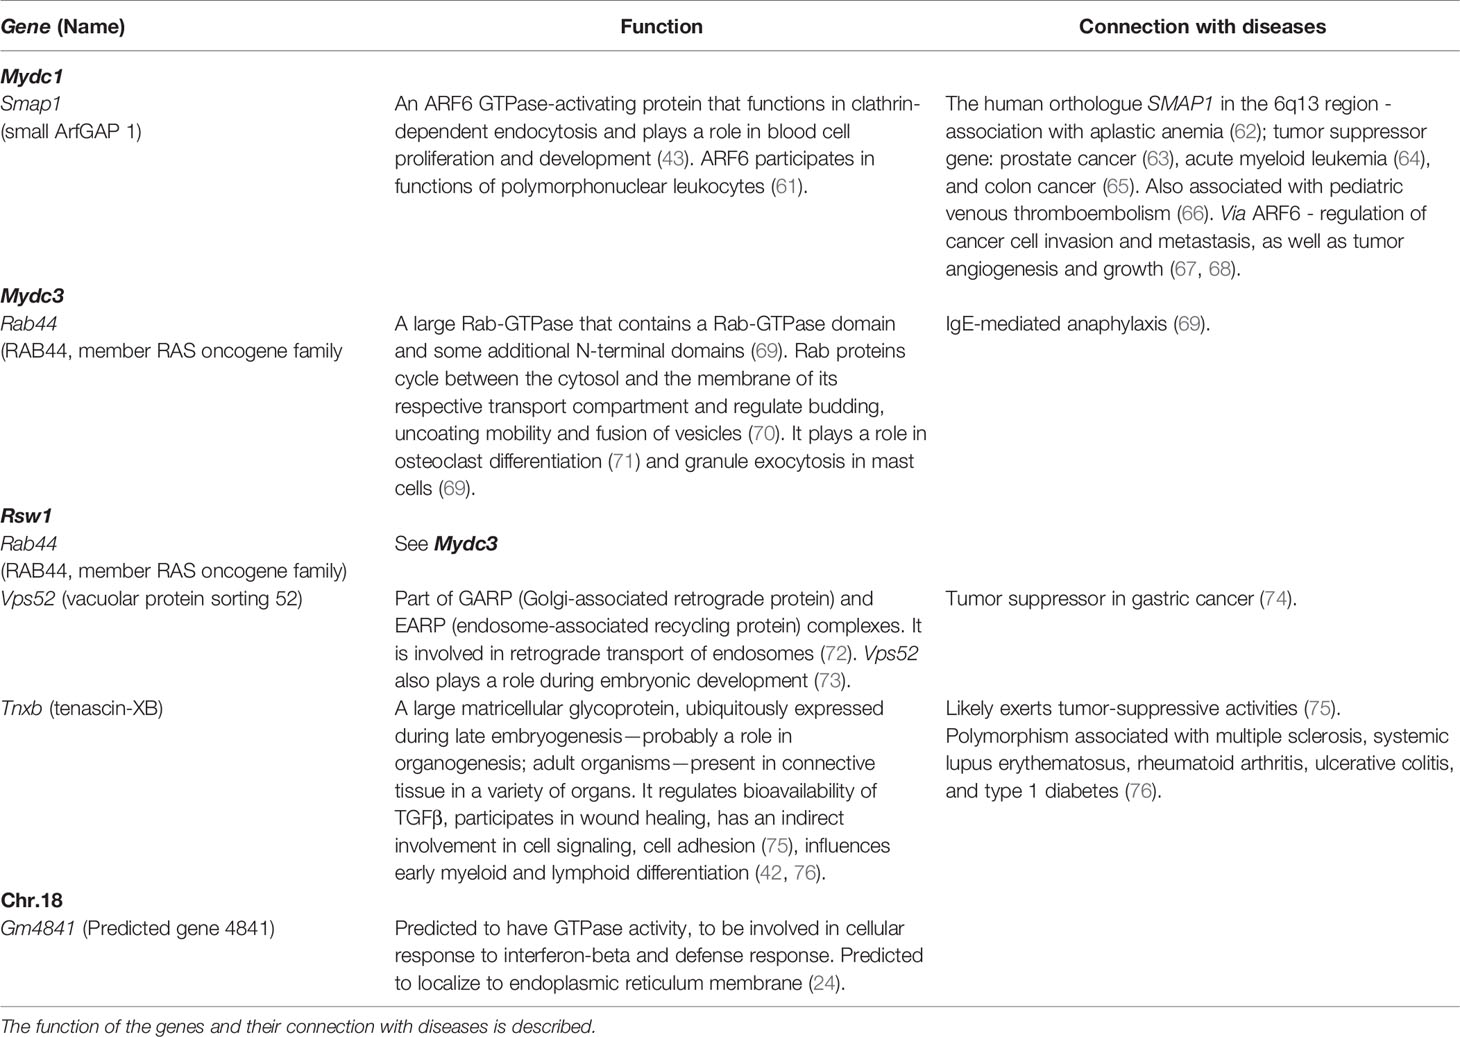
Table 6 List of differentially expressed candidate genes in the strain B10.O20.
Interaction Between Rab44/Mydc3 With an Unknown Partner in Locus Mydc2 Might Control Frequencies of CD11b+Gr1+ Cells and Neutrophils
The interaction between Mydc2 (chromosome 15) and Mydc3 (chromosome 17) controls frequencies of CD11b+Gr1+ cells and neutrophils (Table 4). Neutrophils are a subgroup of CD11b+Gr1+ cells, and the influence of genotypes on frequencies of both cell subpopulations is similar. Therefore, it is possible that the difference in frequencies of CD11b+Gr1+ cells regulated by interaction between Mydc2 and Mydc3 is due to the difference of its neutrophil subgroup.
In the linkage analysis, the effect of Mydc2 (chromosome 15) was observed only in interaction with Mydc3 (chromosome 17). Bioinformatics analysis pinpointed Foxred2 as a potential candidate gene. However, differences in expression of Foxred2 in mice carrying OO homozygotes in both Mydc2 and Mydc3, and BB homozygotes in Mydc2 and OO homozygotes in Mydc3 were not significant (Supplementary Figure 3E). Thus, Foxred2 is an unlikely candidate gene, although its protein activity might also be regulated by modifications or structural changes that need not alter expression.
We also tested in mice with the abovementioned combination of genotypes expression of other potential candidate genes on chromosome 17: Lst1, Vps52, Tnxb (Supplementary Figures 3F–H), and Rab44 (Figure 9E), but only expression of Rab44 exhibited epistatic control. Mouse Rab44 mRNA is highly expressed in bone marrow. It is present in bone marrow macrophages, neutrophils, and dendritic cells (78, 79) (Supplementary Table 6). In spleen, Rab44+ cells were detected in the splenic cord in the red spleen, but were hardly detectable in the white pulp (79). In bone marrow, Rab44 is extensively expressed in undifferentiated hematopoietic CD117+ (c-kit) cells and its expression decreases during differentiation of immune-related cells (79). Interestingly, Rab44 is localized in the locus SSC7 that controls WBC count in swine (80).
Rab44, Vps52, and Tnxb Are Potential Candidate Genes for Rsw1 Controlling Relative Spleen Weight and Spleen Architecture
Rsw1 (chromosome 17) controls relative spleen weight, and O20 homozygotes determined higher relative spleen weight (Table 3). Differences in this value were associated with differences in spleen architecture, and F2 mice carrying B10 homozygous Rsw1 allele showed about twice larger white pulp than O20 homozygotes (Figures 7, 8). This agrees with the differences among B10, O20, and B10.O20 mice shown in Figure 1, in which MDC residing in the red pulp are increased while lymphocytes residing in the white pulp are decreased in B10.O20 strain. Three genes, Rab44, Vsp52 and Tnxb (Table 6), had expression characteristics compatible with a single gene effect (Figure 9).
Rab44 Involvement of this gene in MDC cell development is discussed in the Interaction between Rab44/Mydc3 with an unknown partner in locus Mydc2 might control frequencies of CD11b+Gr1+ cells and neutrophils section. Our results suggest a possible role for Rab44 in influencing the splenic architecture of mice by modifying frequencies of MDC cells.
Vps52 is expressed in many cells of the immune system, with highest levels in mega-erythrocyte progenitor (Supplementary Table 6) (78). The role of Vps52 in control of spleen weight and architecture is not clear; it interacts with ARF6 (81) that participates in functions of polymorphonuclear leukocytes (61). This is compatible with our findings.
Tnxb effects include hematopoiesis, and immune and hematopoietic systems (42) (Table 6). Targeted mutation experiments noted an association of Tnxb and Btnl4 (among other 59 genes) with enlarged spleen in uninfected mice (82, 83), which supports our findings. Bntl4 RNA expression was not tested in our samples as the variant in this gene results in a single amino acid change of low conservation score (Table 5).
Exome array-based meta-analysis in a multi-ancestry samples from 25 human studies found that the rs185819 variant of TNXB was associated with WBC count (76). In dairy cattle, TNXB is associated with WBC counts and with the susceptibility to the bovine leukemia virus (84).
Gm4841 Is a Potential Candidate Gene for a Suggestive Linkage of Neutrophil Frequency on Chromosome 18
Heterozygotes on chromosome 18 have lower levels of neutrophils than B10 and O20 homozygotes in the (B10.O20xB10)F2 hybrids. Since the Bonferroni-corrected p-value is 0.063, it only suggests its possible linkage to neutrophil frequency. We analyzed the RNA expression of the candidate genes on chromosome 18; only Gm4841 exhibited differential expression (Figure 9F).
Newly Detected Genes/Loci Have Their Orthologs in Human, Swine, and Cattle
Mydc1 is localized on chromosome 1 on the segment between 22.7 and 24.7 Mbp. In the near vicinity were at the position 26.97, 26.29, and 25.75 Mbp detected loci controlling WBC, granulocytes, and monocytes, respectively, in mouse blood (8). It remains to be tested whether these loci are identical with or distinct from Mydc1.
Orthologous human segments of peak of linkage of Mydc1, Mydc2, and Mydc3/Rsw1 are localized on 6q13, 22q12-13, and 6p21, respectively (42, 85). Interestingly, human segment 6p21 orthologous to Mydc3/Rsw1 was found to control WBC (17, 19), monocyte (19), neutrophil (19), lymphocyte (17), and eosinophil (18) counts (Table 1); swine ortholog SSC7 determines WBC count (23, 80). Rab44 and TnxB—potential candidate genes for Mydc3/Rsw1—are involved in control of WBC count in swine (80) and cattle (84), respectively.
Conclusion
In summary, we identified three new loci on chromosomes 1, 15, and 17 (Mydc1, Mydc2, and Mydc3) controlling the frequencies of CD11b+Gr1+ and neutrophils (Gr1+Siglec-F- cells from CD11b+ cells), and we show how the interaction between the two loci Mydc2 and Mydc3 controls frequencies of these cells. We have also identified Rsw1, a novel locus controlling relative spleen weight and the histological architecture of spleen. Finally, we confirmed in Mydc1 and Mydc3 loci a differential expression of their potential candidate genes Smap1 and Rab44, respectively. Rsw1 contains the three potential candidate genes Vps52, Rab44, and Tnxb. We provide a comprehensive information about the hereditary differences in the frequencies of MDC and the size and the architecture of the spleen white and red pulps. The detected loci might play a role in cancer, autoimmune diseases, and resistance to pathogens.
CD11b+Gr1+ cells comprise several subpopulations of immune cells (86). Part of these cells, a heterogeneous group of myeloid-derived suppressor cells, plays a role in cancer, autoimmune and infectious diseases, traumatic stress, and graft-versus-host disease both in mice and in humans (87, 88). Understanding the genetic regulation of MDC might improve the personalized prevention and therapy of these diseases.
Locus Mydc3/Rsw1 is orthologous to the human segment 6q21 that controls WBC count (17–19). These results could be therefore useful for human studies. It would be interesting whether human segments orthologous to Mydc1 and Mydc2 are also controlling frequencies of MDC.
Thus, these genes can be the focus of future studies in both mice and humans.
Data Availability Statement
The original contributions presented in the study are publicly available. These data can be found at https://www.ncbi.nlm.nih.gov/genbank/ under the accession numbers OK040659-OK040678.
Ethics Statement
This research complies with all relevant European Union guidelines for work with animals and was approved by the Institutional Committee of the Institute of Molecular Genetics of the Czech Academy of Sciences and by Departmental Expert Committee for the Approval of Projects of Experiments on Animals of the Academy of Sciences of the Czech Republic (permission number 93/2015).
Author Contributions
IK, YS, VH, and ML designed the project. IK and ML wrote the manuscript. IK, YS, EJ, HH, JV, AA, and VH performed the experiments. IK, YS, EJ, VV, HS, VH, PD, and ML analyzed the data. All authors contributed to the article and approved the submitted version.
Funding
This work was supported by GACR 16-22346S, COST Action BM1404 Mye-EUNITER, and NV19-05-00457.
Conflict of Interest
The authors declare that the research was conducted in the absence of any commercial or financial relationships that could be construed as a potential conflict of interest.
Publisher’s Note
All claims expressed in this article are solely those of the authors and do not necessarily represent those of their affiliated organizations, or those of the publisher, the editors and the reviewers. Any product that may be evaluated in this article, or claim that may be made by its manufacturer, is not guaranteed or endorsed by the publisher.
Acknowledgments
IK is a Ph.D. candidate at Charles University. This work is submitted as a partial fulfillment of the requirement for the Ph.D.
Supplementary Material
The Supplementary Material for this article can be found online at: https://www.frontiersin.org/articles/10.3389/fimmu.2021.760881/full#supplementary-material
Abbreviations
B10.O20, C57BL/10-H2pz—mouse strain; B10.O20xB10 cross, the B10.O20 female crossed with the B10 male; B10, C57BL/10—mouse strain; B10xB10.O20 cross, the B10 female crossed with the B10.O20 male; DARC, Duffy antigen/chemokine receptor; Gm4841, predicted gene—Interferon-gamma-inducible GTPase Ifgga3 protein; GWAS, Genome-wide association studies; MDC, myeloid-derived cells; Mydc, myeloid-derived cells—genetic locus; PBS, phosphate-buffered saline; QTL, quantitative trait loci; Rab44, RAB44, member RAS oncogene family; Rsw, relative spleen weight—genetic locus; Smap1, small ArfGAP 1; Tnxb, tenascin XB; Vps52, VPS52 GARP complex subunit; WBC, white blood cells.
References
1. Verso M. The Evolution of Blood-Counting Techniques. Med Hist (1964) 8(2):149. doi: 10.1017/s0025727300029392
2. Nalls MA, Wilson JG, Patterson NJ, Tandon A, Zmuda JM, Huntsman S, et al. Admixture Mapping of White Cell Count: Genetic Locus Responsible for Lower White Blood Cell Count in the Health ABC and Jackson Heart Studies. Am J Hum Genet (2008) 82(1):81–7. doi: 10.1016/j.ajhg.2007.09.003
3. Pilia G, Chen W-M, Scuteri A, Orrú M, Albai G, Dei M, et al. Heritability of Cardiovascular and Personality Traits in 6,148 Sardinians. PloS Genet (2006) 2(8):e132. doi: 10.1371/journal.pgen.0020132
4. Evans DM, Frazer IH, Martin NG. Genetic and Environmental Causes of Variation in Basal Levels of Blood Cells. Twin Res (1999) 2(4):250–7. doi: 10.1375/136905299320565735
5. Haddy TB, Rana SR, Castro OJ. Benign Ethnic Neutropenia: What is a Normal Absolute Neutrophil Count? J Lab Clin Med (1999) 133(1):15–22. doi: 10.1053/lc.1999.v133.a94931
6. Reich D, Nalls MA, Kao WL, Akylbekova EL, Tandon A, Patterson N, et al. Reduced Neutrophil Count in People of African Descent is Due to a Regulatory Variant in the Duffy Antigen Receptor for Chemokines Gene. PloS Genet (2009) 5(1):e1000360. doi: 10.1371/journal.pgen.1000360
7. Telieps T, Köhler M, Treise I, Foertsch K, Adler T, Busch DH, et al. Longitudinal Frequencies of Blood Leukocyte Subpopulations Differ Between NOD and NOR Mice But do Not Predict Diabetes in NOD Mice. J Diabetes Res (2016) 2016:4208156. doi: 10.1155/2016/4208156
8. Davis RC, Van Nas A, Bennett B, Orozco L, Pan C, Rau CD, et al. Genome-Wide Association Mapping of Blood Cell Traits in Mice. Mamm Genome (2013) 24(3-4):105–18. doi: 10.1007/s00335-013-9448-0
9. Peters LL, Zhang W, Lambert AJ, Brugnara C, Churchill GA, Platt OS. Quantitative Trait Loci for Baseline White Blood Cell Count, Platelet Count, and Mean Platelet Volume. Mamm Genome (2005) 16(10):749–63. doi: 10.1007/s00335-005-0063-6
10. Roederer M, Quaye L, Mangino M, Beddall MH, Mahnke Y, Chattopadhyay P, et al. The Genetic Architecture of the Human Immune System: A Bioresource for Autoimmunity and Disease Pathogenesis. Cell (2015) 161(2):387–403. doi: 10.1016/j.cell.2015.02.046
11. Astle WJ, Elding H, Jiang T, Allen D, Ruklisa D, Mann AL, et al. The Allelic Landscape of Human Blood Cell Trait Variation and Links to Common Complex Disease. Cell (2016) 167(5):1415–1429.e1419. doi: 10.1016/j.cell.2016.10.042
12. Sankaran VG, Orkin SH. Genome-Wide Association Studies of Hematologic Phenotypes: A Window Into Human Hematopoiesis. Curr Opin Genet Dev (2013) 23(3):339–44. doi: 10.1016/j.gde.2013.02.006
13. Zhou X, Crow AL, Hartiala J, Spindler TJ, Ghazalpour A, Barsky LW, et al. The Genetic Landscape of Hematopoietic Stem Cell Frequency in Mice. Stem Cell Rep (2015) 5(1):125–38. doi: 10.1016/j.stemcr.2015.05.008
14. Evans DM, Zhu G, Duffy DL, Montgomery GW, Frazer IH, Martin NG. Major Quantitative Trait Locus for Eosinophil Count is Located on Chromosome 2q. J Allergy Clin Immunol (2004) 114(4):826–30. doi: 10.1016/j.jaci.2004.05.060
15. Martinez FD, Solomon S, Holberg CJ, Graves PE, Baldini M, Erickson RP. Linkage of Circulating Eosinophils to Markers on Chromosome 5q. Am J Respir Crit Care Med (1998) 158(6):1739–44. doi: 10.1164/ajrccm.158.6.9712040
16. Reiner AP, Lettre G, Nalls MA, Ganesh SK, Mathias R, Austin MA, et al. Genome-Wide Association Study of White Blood Cell Count in 16,388 African Americans: The Continental Origins and Genetic Epidemiology Network (COGENT). PloS Genet (2011) 7(6):e1002108. doi: 10.1371/journal.pgen.1002108
17. Nalls MA, Couper DJ, Tanaka T, Van Rooij FJ, Chen M-H, Smith AV, et al. Multiple Loci are Associated With White Blood Cell Phenotypes. PloS Genet (2011) 7(6):e1002113. doi: 10.1371/journal.pgen.1002113
18. Okada Y, Hirota T, Kamatani Y, Takahashi A, Ohmiya H, Kumasaka N, et al. Identification of Nine Novel Loci Associated With White Blood Cell Subtypes in a Japanese Population. PloS Genet (2011) 7(6):e1002067. doi: 10.1371/journal.pgen.1002067
19. Keller MF, Reiner AP, Okada Y, van Rooij FJ, Johnson AD, Chen M-H, et al. Trans-Ethnic Meta-Analysis of White Blood Cell Phenotypes. Hum Mol Genet (2014) 23(25):6944–60. doi: 10.1093/hmg/ddu401
20. Ferreira MA, Hottenga J-J, Warrington NM, Medland SE, Willemsen G, Lawrence RW, et al. Sequence Variants in Three Loci Influence Monocyte Counts and Erythrocyte Volume. Am J Hum Genet (2009) 85(5):745–9. doi: 10.1016/j.ajhg.2009.10.005
21. Bovo S, Mazzoni G, Bertolini F, Schiavo G, Galimberti G, Gallo M, et al. Genome-Wide Association Studies for 30 Haematological and Blood Clinical-Biochemical Traits in Large White Pigs Reveal Genomic Regions Affecting Intermediate Phenotypes. Sci Rep (2019) 9(1):1–17. doi: 10.1038/s41598-019-43297-1
22. Bovo S, Ballan M, Schiavo G, Gallo M, Dall’Olio S, Fontanesi L. Haplotype-Based Genome-Wide Association Studies Reveal New Loci for Haematological and Clinical–Biochemical Parameters in Large White Pigs. Anim Genet (2020) 51(4):601–6. doi: 10.1111/age.12959
23. Yang S, Ren J, Yan X, Huang X, Zou Z, Zhang Z, et al. Quantitative Trait Loci for Porcine White Blood Cells and Platelet-Related Traits in a White Duroc× Erhualian F2 Resource Population. Anim Genet (2009) 40(3):273–8. doi: 10.1111/j.1365-2052.2008.01830.x
24. Mousas A, Ntritsos G, Chen M-H, Song C, Huffman JE, Tzoulaki I, et al. Rare Coding Variants Pinpoint Genes That Control Human Hematological Traits. PloS Genet (2017) 13(8):e1006925. doi: 10.1371/journal.pgen.1006925
25. Stassen A, Groot P, Eppig J, Demant PJ. Genetic Composition of the Recombinant Congenic Strains. Mamm Genome (1996) 7(1):55–8. doi: 10.1007/s003359900013
26. Šíma M, Havelková H, Quan L, Svobodová M, Jarošíková T, Vojtíšková J, et al. Genetic Control of Resistance to Trypanosoma Brucei Brucei Infection in Mice. PloS Negl Trop Dis (2011) 5(6):e1173. doi: 10.1371/journal.pntd.0001173
27. Sohrabi Y, Volkova V, Kobets T, Havelková H, Krayem I, Slapničková M, et al. Genetic Regulation of Guanylate-Binding Proteins 2b and 5 During Leishmaniasis in Mice. Front Immunol (2018) 9:130. doi: 10.3389/fimmu.2018.00130
28. Arvidsson S, Kwasniewski M, Riaño-Pachón DM, Mueller-Roeber B. QuantPrime–a Flexible Tool for Reliable High-Throughput Primer Design for Quantitative PCR. BMC Bioinf (2008) 9(1):465. doi: 10.1186/1471-2105-9-465
29. Schneider CA, Rasband WS, Eliceiri KW. NIH Image to ImageJ: 25 Years of Image Analysis. Nat Methods (2012) 9(7):671–5. doi: 10.1038/nmeth.2089
30. Palus M, Sohrabi Y, Broman KW, Strnad H, Šíma M, Růžek D, et al. A Novel Locus on Mouse Chromosome 7 That Influences Survival After Infection With Tick-Borne Encephalitis Virus. BMC Neurosci (2018) 19(1):1–11. doi: 10.1186/s12868-018-0438-8
31. Bolger AM, Lohse M, Usadel B. Trimmomatic: A Flexible Trimmer for Illumina Sequence Data. Bioinformatics (2014) 30(15):2114–20. doi: 10.1093/bioinformatics/btu170
32. Magoč T, Salzberg SL. FLASH: Fast Length Adjustment of Short Reads to Improve Genome Assemblies. Bioinformatics (2011) 27(21):2957–63. doi: 10.1093/bioinformatics/btr507
33. Li H, Durbin R. Fast and Accurate Long-Read Alignment With Burrows-Wheeler Transform. Bioinformatics (2010) 26(5):589–95. doi: 10.1093/bioinformatics/btp698
34. McKenna A, Hanna M, Banks E, Sivachenko A, Cibulskis K, Kernytsky A, et al. The Genome Analysis Toolkit: A MapReduce Framework for Analyzing Next-Generation DNA Sequencing Data. Genome Res (2010) 20(9):1297–303. doi: 10.1101/gr.107524.110
35. Robinson JT, Thorvaldsdóttir H, Winckler W, Guttman M, Lander ES, Getz G, et al. Integrative Genomics Viewer. Nat Biotechnol (2011) 29(1):24–6. doi: 10.1038/nbt.1754
36. Cingolani P, Platts A, Wang le L, Coon M, Nguyen T, Wang L, et al. A Program for Annotating and Predicting the Effects of Single Nucleotide Polymorphisms, SnpEff: SNPs in the Genome of Drosophila Melanogaster Strain W1118; Iso-2; Iso-3. Fly (Austin) (2012) 6(2):80–92. doi: 10.4161/fly.19695
37. Choi Y, Chan AP. PROVEAN Web Server: A Tool to Predict the Functional Effect of Amino Acid Substitutions and Indels. Bioinformatics (2015) 31(16):2745–7. doi: 10.1093/bioinformatics/btv195
38. Ashkenazy H, Erez E, Martz E, Pupko T, Ben-Tal N. ConSurf 2010: Calculating Evolutionary Conservation in Sequence and Structure of Proteins and Nucleic Acids. Nucleic Acids Res (2010) 38(suppl 2):W529–33. doi: 10.1093/nar/gkq399
39. Celniker G, Nimrod G, Ashkenazy H, Glaser F, Martz E, Mayrose I, et al. ConSurf: Using Evolutionary Data to Raise Testable Hypotheses About Protein Function. Isr J Chem (2013) 53(3-4):199–206. doi: 10.1002/ijch.201200096
40. Ashkenazy H, Abadi S, Martz E, Chay O, Mayrose I, Pupko T, et al. ConSurf 2016: An Improved Methodology to Estimate and Visualize Evolutionary Conservation in Macromolecules. Nucleic Acids Res (2016) 44(W1):W344–50. doi: 10.1093/nar/gkw408
41. Cesta MF. Normal Structure, Function, and Histology of the Spleen. Toxicol Pathol (2006) 34(5):455–65. doi: 10.1080/01926230600867743
42. The Jackson Laboratory. MGI: Mouse Genome Informatics. Available at: http://www.informatics.jax.org (Accessed November 20, 2020).
43. Kon S, Minegishi N, Tanabe K, Watanabe T, Funaki T, Wong WF, et al. Smap1 Deficiency Perturbs Receptor Trafficking and Predisposes Mice to Myelodysplasia. J Clin Invest (2013) 123(3):1123–37. doi: 10.1172/JCI63711
44. Bult CJ, Blake JA, Smith CL, Kadin JA, Richardson JE. Mouse Genome Database (MGD) 2019. Nucleic Acids Res (2019) 47(D1):D801–6. doi: 10.1093/nar/gky1056
45. Zhou Y, Li Y, Lu J, Hong X, Xu L. MicroRNA30a Controls the Instability of Inducible CD4+ Tregs Through SOCS1. Mol Med Rep (2019) 20(5):4303–14. doi: 10.3892/mmr.2019.10666
46. Ceolotto G, Giannella A, Albiero M, Kuppusamy M, Radu C, Simioni P, et al. miR-30c-5p Regulates Macrophage-Mediated Inflammation and Pro-Atherosclerosis Pathways. Cardiovasc Res (2017) 113(13):1627–38. doi: 10.1093/cvr/cvx157
47. Yanagawa T, Sumiyoshi H, Higashi K, Nakao S, Higashiyama R, Fukumitsu H, et al. Identification of a Novel Bone Marrow Cell-Derived Accelerator of Fibrotic Liver Regeneration Through Mobilization of Hepatic Progenitor Cells in Mice. Stem Cells (2019) 37(1):89–101. doi: 10.1002/stem.2916
48. Probst K, Stermann J, von Bomhard I, Etich J, Pitzler L, Niehoff A, et al. Depletion of Collagen IX Alpha1 Impairs Myeloid Cell Function. Stem Cells (2018) 36(11):1752–63. doi: 10.1002/stem.2892
49. Lipoldová M, Kosařová M, Zajícová A, Holáň V, Hart AA, Krulová M, et al. Separation of Multiple Genes Controlling the T-Cell Proliferative Response to IL-2 and Anti-CD3 Using Recombinant Congenic Strains. Immunogenetics (1995) 41(5):301–11. doi: 10.1007/BF00172155
50. Lipoldová M, Havelková H, Badalová J, Demant P. Novel Loci Controlling Lymphocyte Proliferative Response to Cytokines and Their Clustering With Loci Controlling Autoimmune Reactions, Macrophage Function and Lung Tumor Susceptibility. Int J Cancer (2005) 114(3):394–9. doi: 10.1002/ijc.20731
51. Lipoldová M, Havelková H, Badalová J, Vojtíšková J, Quan L, Krulová M, et al. Loci Controlling Lymphocyte Production of Interferon γ After Alloantigen Stimulation In Vitro and Their Co-Localization With Genes Controlling Lymphocyte Infiltration of Tumors and Tumor Susceptibility. Cancer Immunol Immunother (2010) 59(2):203–13. doi: 10.1007/s00262-009-0739-y
52. Slapničková M, Volkova V, Čepičková M, Kobets T, Šíma M, Svobodová M, et al. Gene-Specific Sex Effects on Eosinophil Infiltration in Leishmaniasis. Biol Sex Differ (2016) 7(1):59. doi: 10.1186/s13293-016-0117-3
53. Lipoldová M, Svobodová M, Havelková H, Krulová M, Badalová J, Nohýnková E, et al. Mouse Genetic Model for Clinical and Immunological Heterogeneity of Leishmaniasis. Immunogenetics (2002) 54(3):174–83. doi: 10.1007/s00251-002-0439-7
54. Kobets T, Havelková H, Grekov I, Volkova V, Vojtíšková J, Slapničková M, et al. Genetics of Host Response to Leishmania Tropica in Mice–Different Control of Skin Pathology, Chemokine Reaction, and Invasion Into Spleen and Liver. PloS Negl Trop Dis (2012) 6(6):e1667. doi: 10.1371/journal.pntd.0001667
55. Shockley KR, Churchill GA. Gene Expression Analysis of Mouse Chromosome Substitution Strains. Mamm Genome (2006) 17(6):598–614. doi: 10.1007/s00335-005-0176-y
56. Civelek M, Lusis AJ. Systems Genetics Approaches to Understand Complex Traits. Nat Rev Genet (2014) 15(1):34. doi: 10.1038/nrg3575
57. Van Nie R, Ivanyi D, Demant PJ. A New H-2-Linked Mutation, Rds, Causing Retinal Degeneration in the Mouse. Tissue Antigens (1978) 12(2):106–8. doi: 10.1111/j.1399-0039.1978.tb01305.x
58. Van Gulik PJ, Korteweg R. The Anatomy of the Mammary Gland in Mice With Regard to the Degree of its Disposition for Cancer. Verhandelingen der Koninklijke Nederlandse Akademie van Wettenschappen (1940) 43:891–900.
59. Fijneman RJ, Demant P. A Gene for Susceptibility to Small Intestinal Cancer, Ssic1, Maps to the Distal Part of Mouse Chromosome 4. Cancer Res (1995) 55(14):3179–82.
60. Fijneman R, Ophoff RA, Hart A, Demant P. Kras-2 Alleles, Mutations, and Lung Tumor Susceptibility in the Mouse–an Evaluation. Oncogene (1994) 9(5):1417–21.
61. Gamara J, Chouinard F, Davis L, Aoudjit F, Bourgoin SG. Regulators and Effectors of Arf GTPases in Neutrophils. J Immunol Res (2015) 2015. doi: 10.1155/2015/235170
62. Hudson J, Chown S, Lawler M, Duggan C, Temperley I, Secker-Walker L. Severe Aplastic Anaemia in Association With a Unique Constitutional Translocation 46, XY, T (6; 10)(Q13; Q22) C. Br J Haematol (1997) 99(3):520–1. doi: 10.1046/j.1365-2141.1997.4433253.x
63. Kluth M, Jung S, Habib O, Eshagzaiy M, Heinl A, Amschler N, et al. Deletion Lengthening at Chromosomes 6q and 16q Targets Multiple Tumor Suppressor Genes and Is Associated With an Increasingly Poor Prognosis in Prostate Cancer. Oncotarget (2017) 8(65):108923. doi: 10.18632/oncotarget.22408
64. Meyer C, Schneider B, Reichel M, Angermueller S, Strehl S, Schnittger S, et al. Diagnostic Tool for the Identification of MLL Rearrangements Including Unknown Partner Genes. Proc Natl Acad Sci USA (2005) 102(2):449–54. doi: 10.1073/pnas.0406994102
65. Sangar F, Schreurs A, Umaña-Diaz C, Clapéron A, Desbois-Mouthon C, Calmel C, et al. Involvement of Small ArfGAP1 (SMAP1), a Novel Arf6-Specific GTPase-Activating Protein, in Microsatellite Instability Oncogenesis. Oncogene (2014) 33(21):2758–67. doi: 10.1038/onc.2013.211
66. Rühle F, Witten A, Barysenka A, Huge A, Arning A, Heller C, et al. Rare Genetic Variants in SMAP1, B3GAT2, and RIMS1 Contribute to Pediatric Venous Thromboembolism. Blood (2017) 129(6):783–90. doi: 10.1182/blood-2016-07-728840
67. Li R, Peng C, Zhang X, Wu Y, Pan S, Xiao Y. Roles of Arf6 in Cancer Cell Invasion, Metastasis and Proliferation. Life Sci (2017) 182:80–4. doi: 10.1016/j.lfs.2017.06.008
68. Casalou C, Ferreira A, Barral DC. The Role of ARF Family Proteins and Their Regulators and Effectors in Cancer Progression: A Therapeutic Perspective. Front Cell Dev Biol (2020) 8:217. doi: 10.3389/fcell.2020.00217
69. Kadowaki T, Yamaguchi Y, Kido MA, Abe T, Ogawa K, Tokuhisa M, et al. The Large GTPase Rab44 Regulates Granule Exocytosis in Mast Cells and IgE-Mediated Anaphylaxis. Cell Mol Immunol (2020) 17:12, 1287–1289. doi: 10.1038/s41423-020-0413-z
70. Srikanth S, Woo JS, Gwack Y. A Large Rab GTPase Family in a Small GTPase World. Small GTPases (2017) 8(1):43–8. doi: 10.1080/21541248.2016.1192921
71. Yamaguchi Y, Sakai E, Okamoto K, Kajiya H, Okabe K, Naito M, et al. Rab44, a Novel Large Rab GTPase, Negatively Regulates Osteoclast Differentiation by Modulating Intracellular Calcium Levels Followed by NFATc1 Activation. Cell Mol Life Sci (2018) 75(1):33–48. doi: 10.1007/s00018-017-2607-9
72. Schindler C, Chen Y, Pu J, Guo X, Bonifacino JS. EARP Is a Multisubunit Tethering Complex Involved in Endocytic Recycling. Nat Cell Biol (2015) 17(5):639–50. doi: 10.1038/ncb3129
73. Sugimoto M, Kondo M, Hirose M, Suzuki M, Mekada K, Abe T, et al. Molecular Identification of Tw5: Vps52 Promotes Pluripotential Cell Differentiation Through Cell–Cell Interactions. Cell Rep (2012) 2(5):1363–74. doi: 10.1016/j.celrep.2012.10.004
74. Zhang J, Lin Y, Hu X, Wu Z, Guo W. VPS52 Induces Apoptosis via Cathepsin D in Gastric Cancer. J Mol Med (Berl) (2017) 95(10):1107–16. doi: 10.1007/s00109-017-1572-y
75. Valcourt U, Alcaraz LB, Exposito J-Y, Lethias C, Bartholin L. Tenascin-X: Beyond the Architectural Function. Cell Adh Mig (2015) 9(1-2):154–65. doi: 10.4161/19336918.2014.994893
76. Tajuddin SM, Schick UM, Eicher JD, Chami N, Giri A, Brody JA, et al. Large-Scale Exome-Wide Association Analysis Identifies Loci for White Blood Cell Traits and Pleiotropy With Immune-Mediated Diseases. Am J Hum Genet (2016) 99(1):22–39. doi: 10.1016/j.ajhg.2016.05.003
77. Gamara J, Davis L, Rollet-Labelle E, Hongu T, Funakoshi Y, Kanaho Y, et al. Assessment of Arf6 Deletion in PLB-985 Differentiated in Neutrophil-Like Cells and in Mouse Neutrophils: Impact on Adhesion and Migration. Mediators Inflammation (2020) 2020:2713074. doi: 10.1155/2020/2713074
78. Wu C, Jin X, Tsueng G, Afrasiabi C, Su AI. BioGPS: Building Your Own Mash-Up of Gene Annotations and Expression Profiles. Nucleic Acids Res (2016) 44(D1):D313–6. doi: 10.1093/nar/gkv1104
79. Tokuhisa M, Kadowaki T, Ogawa K, Yamaguchi Y, Kido MA, Gao W, et al. Expression and Localisation of Rab44 in Immune-Related Cells Change During Cell Differentiation and Stimulation. Sci Rep (2020) 10(1):1–13. doi: 10.1038/s41598-020-67638-7
80. Zhang Z, Hong Y, Gao J, Xiao S, Ma J, Zhang W, et al. Genome-Wide Association Study Reveals Constant and Specific Loci for Hematological Traits at Three Time Stages in a White Duroc× Erhualian F2 Resource Population. PloS One (2013) 8(5):e63665. doi: 10.1371/journal.pone.0063665
81. Ibuchi K, Fukaya M, Shinohara T, Hara Y, Shiroshima T, Sugawara T, et al. The Vps52 Subunit of the GARP and EARP Complexes Is a Novel Arf6-Interacting Protein That Negatively Regulates Neurite Outgrowth of Hippocampal Neurons. Brain Res (2020) 1745:146905. doi: 10.1016/j.brainres.2020.146905
82. Dickinson ME, Flenniken AM, Ji X, Teboul L, Wong MD, White JK, et al. High-Throughput Discovery of Novel Developmental Phenotypes. Nature (2016) 537(7621):508–14. doi: 10.1038/nature19356
83. European Molecular Biology Laboratory - European Bioinformatics Institute EMBL-EBI. IMPC: International Mouse Phenotyping Consortium . Available at: http://www.mousephenotype.org (Accessed November 20, 2019).
84. Carignano HA, Roldan DL, Beribe MJ, Raschia MA, Amadio A, Nani JP, et al. Genome-Wide Scan for Commons SNPs Affecting Bovine Leukemia Virus Infection Level in Dairy Cattle. BMC Genomics (2018) 19(1):1–15. doi: 10.1186/s12864-018-4523-2
85. NCBI: National Center for Biotechnology Information. Available at: https://ncbi.nlm.nih.gov/gene (Accessed November 20, 2019).
86. Bruger AM, Dorhoi A, Esendagli G, Barczyk-Kahlert K, van der Bruggen P, Lipoldova M, et al. How to Measure the Immunosuppressive Activity of MDSC: Assays, Problems and Potential Solutions. Cancer Immunol Immunother (2019) 68(4):631–44. doi: 10.1007/s00262-018-2170-8
87. Bizymi N, Bjelica S, Kittang AO, Mojsilovic S, Velegraki M, Pontikoglou C, et al. Myeloid-Derived Suppressor Cells in Hematologic Diseases: Promising Biomarkers and Treatment Targets. Hemasphere (2019) 3(1):e168. doi: 10.1097/HS9.0000000000000168
Keywords: myeloid-derived cells, genetic control, CD11b+Gr1+ subpopulation, neutrophils, relative spleen weight, spleen architecture, candidate gene
Citation: Krayem I, Sohrabi Y, Javorková E, Volkova V, Strnad H, Havelková H, Vojtíšková J, Aidarova A, Holáň V, Demant P and Lipoldová M (2022) Genetic Influence on Frequencies of Myeloid-Derived Cell Subpopulations in Mouse. Front. Immunol. 12:760881. doi: 10.3389/fimmu.2021.760881
Received: 18 August 2021; Accepted: 06 December 2021;
Published: 26 January 2022.
Edited by:
Fabrizio Mattei, National Institute of Health (ISS), ItalyReviewed by:
Tao Zeng, Guangzhou Laboratory, ChinaMichael Poidinger, Royal Children’s Hospital, Australia
Copyright © 2022 Krayem, Sohrabi, Javorková, Volkova, Strnad, Havelková, Vojtíšková, Aidarova, Holáň, Demant and Lipoldová. This is an open-access article distributed under the terms of the Creative Commons Attribution License (CC BY). The use, distribution or reproduction in other forums is permitted, provided the original author(s) and the copyright owner(s) are credited and that the original publication in this journal is cited, in accordance with accepted academic practice. No use, distribution or reproduction is permitted which does not comply with these terms.
*Correspondence: Marie Lipoldová, bGlwb2xkb3ZhQGltZy5jYXMuY3o=