 Silke Lauren Sommen1,2*
 Lise Beier Havdal1Joel Selvakumar1,3Gunnar Einvik3,4Truls Michael Leegaard3,5
 Fridtjof Lund-Johansen6Annika E. Michelsen3,7
 Tom E. Mollnes6,8,9
 Tonje Stiansen-Sonerud1,10Trygve Tjade11Vegard Bruun Bratholm Wyller1,3
 Lise Lund Berven1
- 1Department of Pediatrics, Akershus University Hospital, Lørenskog, Norway
- 2University of Oslo, Oslo, Norway
- 3Institute of Clinical Medicine, Faculty of Medicine, University of Oslo, Oslo, Norway
- 4Department of Pulmonary Medicine, Akershus University Hospital, Lørenskog, Norway
- 5Department of Microbiology and Infection Control, Akershus University Hospital, Lørenskog, Norway
- 6Department of Immunology, Oslo University Hospital, Oslo, Norway
- 7Research Institute of Internal Medicine, Oslo University Hospital, Oslo, Norway
- 8Research Laboratory, Nordland Hospital, Bodø, Norway
- 9Centre of Molecular Inflammation Research, Faculty of Medicine and Health Sciences, Norwegian University of Science and Technology, Trondheim, Sør-Trøndelag, Norway
- 10Department of Clinical Molecular Biology (EpiGen), University of Oslo and Akershus University Hospital, Lørenskog, Norway
- 11Fürst Medical Laboratory, Oslo, Norway
Introduction: Both public and scientific attention have shifted from the acute COVID-19 illness to the chronic disability experienced by a proportion of COVID-19 convalescents. Post COVID-19 condition, a term used for long-lasting symptoms after COVID-19, can affect individuals across all disease severity and age groups. Data on post-COVID-19 symptomatology, epidemiology and pathophysiology in adolescents and young adults are scarce. To date, little is known on the immunological and pulmonary trends in these patients after COVID-19. This study investigated immunological markers and pulmonary function in non-hospitalized patients in this group at 6 months after initial mild COVID-19 infection.
Methods: Non-hospitalized SARS-CoV-2 positive (n = 405) and SARS-CoV-2 negative (n = 111) adolescents and young adults (aged 12-25 years) were followed prospectively for six months after SARS-CoV-2 PCR testing. At baseline and at six months follow-up, all participants underwent an assessment including clinical examination, questionnaires, spirometry, and blood sampling. Cross-sectional comparisons of blood biomarkers; including white blood cell counts, CRP, GDF-15, a 27-multiplex cytokine assay, complement activation products and SARS-CoV-2 antibodies; and spirometry measures were performed after classification of all participants according to their COVID-19 status and adherence to post-COVID-19 case criteria. Associations between biomarkers and COVID-19 symptoms were explored.
Results: No difference in pulmonary function was detected between the groups. COVID-19 convalescents had higher levels of chemokines eotaxin, MCP-1 and IP-10 than non-infected controls. The increase was modest and not associated with long-lasting COVID-19 symptoms.
Discussion: Elevated inflammatory mediators were found in adolescents and young adults six months after mild COVID-19, but there was no association with post-COVID-19 condition.
Introduction
The clinical outcome of COVID-19, a viral disease caused by SARS-CoV-2, is highly variable. While most affected individuals return to their baseline health status within weeks after the acute respiratory infection, a substantial proportion of convalescents suffers from persisting post-infective symptoms (1–3). Even children and young adults with predominantly mild COVID-19 infection suffer from prolonged symptoms (4). Commonly reported ailments include fatigue, post-exertional malaise, headache, dyspnea, chest tightness and memory problems (4–6). In the literature, these long-lasting sequelae are referred to as Long COVID, Post-Acute Sequelae of COVID-19 (PASC) or Post-COVID-19 condition (PCC), an umbrella term recently defined by the World Health Organization (WHO) as “the condition that occurs in individuals with a history of probable or confirmed SARS-CoV-2 infection, usually 3 months from the onset of COVID-19, with symptoms that last for at least 2 months and cannot be explained by an alternative diagnosis” (7).
The prevalence of long-lasting COVID-19 related symptoms in young people is disputed, with reports indicating fatigue in a range from 0.52% to 66.5% at 3 months post infection in community managed cases (4, 8–10). In addition to the uncertainty of the true prevalence of persistent post-infective symptoms, several questions regarding the pathophysiology and the natural course of the disease remain unanswered. Similarities may be found with other post-infective fatigue syndromes (PIFS) whose clinical presentations overlap greatly with PCC (11). Sustained low-grade inflammation and immune cell activation have been reported in post-infective fatigue after Epstein-Barr virus infection (12, 13). Similarly, investigations into post-COVID-19 immunology in adults find an immune signature with high plasma cytokine levels and altered immune cell populations in convalescent individuals with persistent symptoms compared to immune profiles in recovered convalescents and unexposed controls (14, 15). However, findings between studies vary due to differences in sample size, lack of appropriate control groups, heterogeneous disease definitions and a multitude of laboratory techniques (16). Evidence in young people is scarce, although pro-inflammatory changes with elevated levels of IL-6 and IL-1β have also been shown in PCC affected children (17). Additionally, considering SARS-CoV-2 primarily infects the respiratory tract, respiratory outcomes are relevant. Persisting dyspnea is common in elderly, while prospective data on lung function and respiratory symptoms after COVID-19 in adolescents and young adults are lacking.
Our aim was to investigate immunological blood markers and pulmonary function tests in a large prospective cohort of adolescents and young adults with mild COVID-19 as well as unexposed controls. Thus, we used cross-sectional data from the six-month follow-up appointment and compared markers for the four following groups: affected COVID-19 positive (COVID+ PCC+), recovered COVID-19 positive (COVID+ PCC-), affected COVID-19 negative (COVID- PCC+) and healthy controls (COVID- PCC-). We elucidated whether immunological aberrations compatible with chronic inflammation could be found in PCC affected participants. Furthermore, we investigated associations between inflammatory aberrations and clinical symptom severity.
Materials and methods
Study design
LoTECA (Long-term effects of COVID-19 in Adolescents) is a longitudinal, observational cohort study following SARS-CoV-2 positive and negative, non-hospitalized adolescents and young adults over a period of 12 months (ClinicalTrials ID: NCT04686734). Data collection was concluded in June 2022. Details on the study design and baseline findings have been reported elsewhere (18–20). This study reports results from the six months follow-up. The project has been approved by the Norwegian National Committee for Ethics in Medical research (ref. #203645).
Participants
Individuals aged 12-25 years were recruited consecutively after undergoing a SARS-CoV-2 reverse-transcription polymerase chain reaction (RT-PCR) test at one of two accredited microbiological laboratories (Fürst Medical Laboratory; Dept. of Microbiology and Infection Control, Akershus University Hospital, Oslo, Norway) between December 2020 and May 2021. Exclusion criteria were a) more than 28 days since symptom onset or positive PCR test b) hospitalization due to COVID-19 or c) pregnancy. A total of 405 SARS-CoV-2 positive and 111 SARS-CoV-2 negative individuals were enrolled in the study at baseline. All had undergone testing because of acute infectious symptoms or close contact with SARS-CoV-2-positive cases. Written informed consent was obtained from all participants and/or their legal guardians, in compliance with the Norwegian Health Research Act (ACT 2008-06-20 no. 44).
Investigational program
At baseline and at six months after recruitment, the study participants were invited for a standardized, one-day investigational program at our study center. All participants underwent a clinical examination and interview, functional testing, completion of questionnaires, and sampling of biological material.
Laboratory assays
Blood samples were collected through antecubital venipuncture. Routine blood analyses were carried out by the accredited laboratory at Akershus University Hospital. Blood collected in Vacuette® EDTA (Greiner Bio-One GmbH, Kremsmünster, Austria) tubes was placed in ice-water for 5-60 minutes, centrifuged (10 minutes at 2200 x g) and plasma was aliquoted for storage at -80°C. Blood collected in Vacuette® Serum Separator Clot Activator (Greiner Bio-One GmbH) tubes was left to clot for at least 30 minutes before centrifugation (10 minutes at 2200 x g) and serum aliquotation for storage at -80°C. Plasma samples were assayed on a Multiplex Analyzer (Bio-Rad Laboratories) using a multiplex cytokine assay (Bio-Plex Human Cytokine 27-Plex Panel; Bio-Rad Laboratories Inc., Hercules, CA) containing the following cytokines: IL-1β, IL-1 receptor antagonist, IL-2, IL-4, IL-5, IL-6, IL-7, IL-8, IL-9, IL-10, IL-12, IL-13, IL-15, IL-17A, eotaxin, basic fibroblast growth factor (bFGF), granulocyte colony stimulation factor, granulocyte macrophage colony stimulating factor, interferon-γ, interferon inducible protein (IP-10), monocyte chemotactic protein (MCP-1), macrophage inflammatory protein MIP-1α and MIP-1β, platelet derived growth factor-BB (PDGF-BB), regulated upon activation T cell expressed and secreted (RANTES), tumor necrosis factor (TNF) and vascular endothelial growth factor (VEGF). Plasma levels of growth/differentiation factor 15 (GDF-15) and C-reactive protein (using the high-sensitive technology, hs-CRP) were measured by enzyme immunoassays (EIA) using commercially available antibodies (R&D systems, Minneapolis, MN). Complement activation products, C3bc and the terminal complement complex (TCC) sC5b-9, were quantified in plasma using an in-house enzyme-linked immunosorbent assays (ELISA) based on monoclonal antibodies designed against neoepitopes of the products (21). Epstein-Barr virus (EBV) antibody titers were determined in serum using EBV VCA IgM and IgG and EBV EBNA IgG (LIAISON®, DiaSorin, Saluggia, Italy). Samples with inconclusive results from the tests were additionally screened with a rapid chromatographic immunoassay for the qualitative detection of Infectious Mononucleosis heterophile antibodies (Clearview® IM II, Abbott Laboratories, IL). An in-house multiplexed bead-based assay was used to measure SARS-CoV-2 antibodies, including antibodies to the full-length spike protein (Spike-FL), to the receptor-binding domain (RBD) and neutralizing antibodies (by assessment of the effect of sera on the ACE2-binding to RBD) (22).
Questionnaires
An extensive questionnaire was used to chart demographic variables, clinical symptoms, personality traits and social factors. The present paper reports results from the Chalder Fatigue Questionnaire (23), the DePaul Symptom Questionnaire (24), and a modified COVID-19 symptom inventory (25, 26). The Chalder Fatigue Questionnaire (CFQ) is a validated tool for the assessment of mental and physical fatigue (27). The 11 CFQ items are rated on a four-point Likert scale (score 0-3) and the CFQ sum score (range 0 to 33) is used here. Scores for the five items addressing post-exertional malaise in the DePaul Symptom Questionnaire were recorded on a five-point Likert scale (score 0 to 4), averaged and multiplied by 25 to generate a total score ranging from 0-100. All items in the COVID-19 symptom inventory were scored on a five-point Likert scale (score 1 to 5) representing symptom frequency (ranging from “never/rarely” to “present all the time”). The sum score for “fever”, “sore throat”, “headache”, “muscle ache” and “fatigue after exercise” represents “infectious symptoms” (total range 5 to 25); whereas “breathlessness”, “cough” and “runny nose” form “respiratory symptoms” (total range 5 to 15); and “memory difficulty”, “concentration difficulty”, “difficulty making decisions” and “confusion/disorientation” make up “cognitive symptoms” (total range 4 to 20).
Case assessment
Operationalized case definitions based on the WHO diagnostic definition of PCC (7) and the international criteria for the diagnosis of PIFS (28) were applied to classify all participants as cases or non-cases, regardless of COVID-19 exposure (20). Clinical findings, laboratory reports and questionnaire data from baseline and six months follow-up were scrutinized to identify PCC and PIFS cases. Participants were assigned to one of the four following groups: COVID-19 positive adhering to post-COVID-19 condition criteria (COVID+PCC+), COVID-19 positive not adhering to post-COVID-19 condition criteria (COVID+PCC-), COVID-19 negative adhering to post-COVID-19 condition criteria (COVID-PCC+), and COVID-19 negative not adhering to post-COVID-19 condition criteria (COVID-PCC-). An analogous classification was performed for adherence to PIFS criteria (PIFS+ or PIFS-).
Spirometry
Spirometry to measure the forced vital capacity (FVC) and the forced expiratory volume in one second (FEV1) was conducted using EasyOne® Air spirometer and EasyOne® Connect software (NDD Medizintechnik AG, Switzerland). Procedures were executed according to the American Thoracic Society and European Respiratory Society guidelines, and individual spirometry recordings that did not satisfy the technical quality requirements were excluded from the analysis (29). The ratio of FEV1/FVC was calculated and The Global Lung Function Initiative 2012 network reference values were used to determine the percentage of predicted values and the lower limit of normal (LLN) (30).
Statistical analysis
In the primary analyses, immunological biomarkers, Epstein-Barr virus and SARS-CoV-2 virus antibodies, and spirometry measures were compared between COVID+PCC+/PIFS+, COVID+PCC-/PIFS-, COVID-PCC+/PIFS+ and COVID-PCC-/PIFS- using Chi square, one-way ANOVA or Kruskal-Wallis tests as appropriate. Post-hoc analyses were carried out for comparisons with statistically significant differences between groups. Next, associations between immunological markers and COVID-19 associated symptoms were explored in COVID+PCC+/PIFS+ by the non-parametric Spearman’s rho test. Additionally, all tests were repeated for the COVID-19 positive and negative groups, regardless of PCC/PIFS caseness. A multiple linear regression model was constructed to account for potential confounders in the association between COVID-19 status and biomarker levels.
A total of 20 cytokines (IL-1β, IL-1 RA, IL-2, IL-4, IL-5, IL-6, IL-7, IL-8, IL-10, IL-12, IL-13, IL-15, IL-17A, MIP-1α, bFGF, G-CSF, GM-CSF, IFNγ, PDGF-BB, VEGF) had either a large amount of missing data (> 50%) or detectable but very low values and were removed from the analysis. For the remaining cytokines, values under the lower limit of detection (LDL) were replaced by random values between zero and the LDL for each respective cytokine. TNF had the highest degree of missing data with 32% of values under LDL. Otherwise, no missing data were imputed and per protocol/complete case analysis was carried out after exclusion of a) participants excluded at baseline (n = 7), b) COVID-19 negative individuals at baseline with reported COVID-19 infection in the observational period or SARS-CoV-2 antibodies (any type for unvaccinated, anti-nucleocapsid for vaccinated) detected at six months follow-up or increased anti-nucleocapsid antibody-titer at six months as compared to baseline (n = 16), c) individuals that did not complete the investigational program at six months follow-up (n = 26), d) individuals that had a serological pattern suggesting recently contracted EBV at enrolment or during the observational period (n = 11) and e) individuals that did not provide a blood sample (n = 8).
All variables are reported with mean and standard deviation or median and interquartile range, with corresponding confidence intervals, depending on the distribution. The level of significance was set at 0.05 for two-sided tests and correction for multiple testing was performed. All statistical analysis was carried out in STATA SE version 17.
Results
At baseline, 516 participants (405 SARS-CoV-2 positive, 111 SARS-CoV-2 negative) consented to participation. At six months follow-up, 448 participants (367 SARS-CoV-2 positive, 81 SARS-CoV-2 negative) met the eligibility criteria and were carried over for further analysis. The participants were evaluated at a median of 212 days (range 179 to 341) after acute COVID-19 symptom onset. An overview of the classification and participant demographics are provided in Table 1.
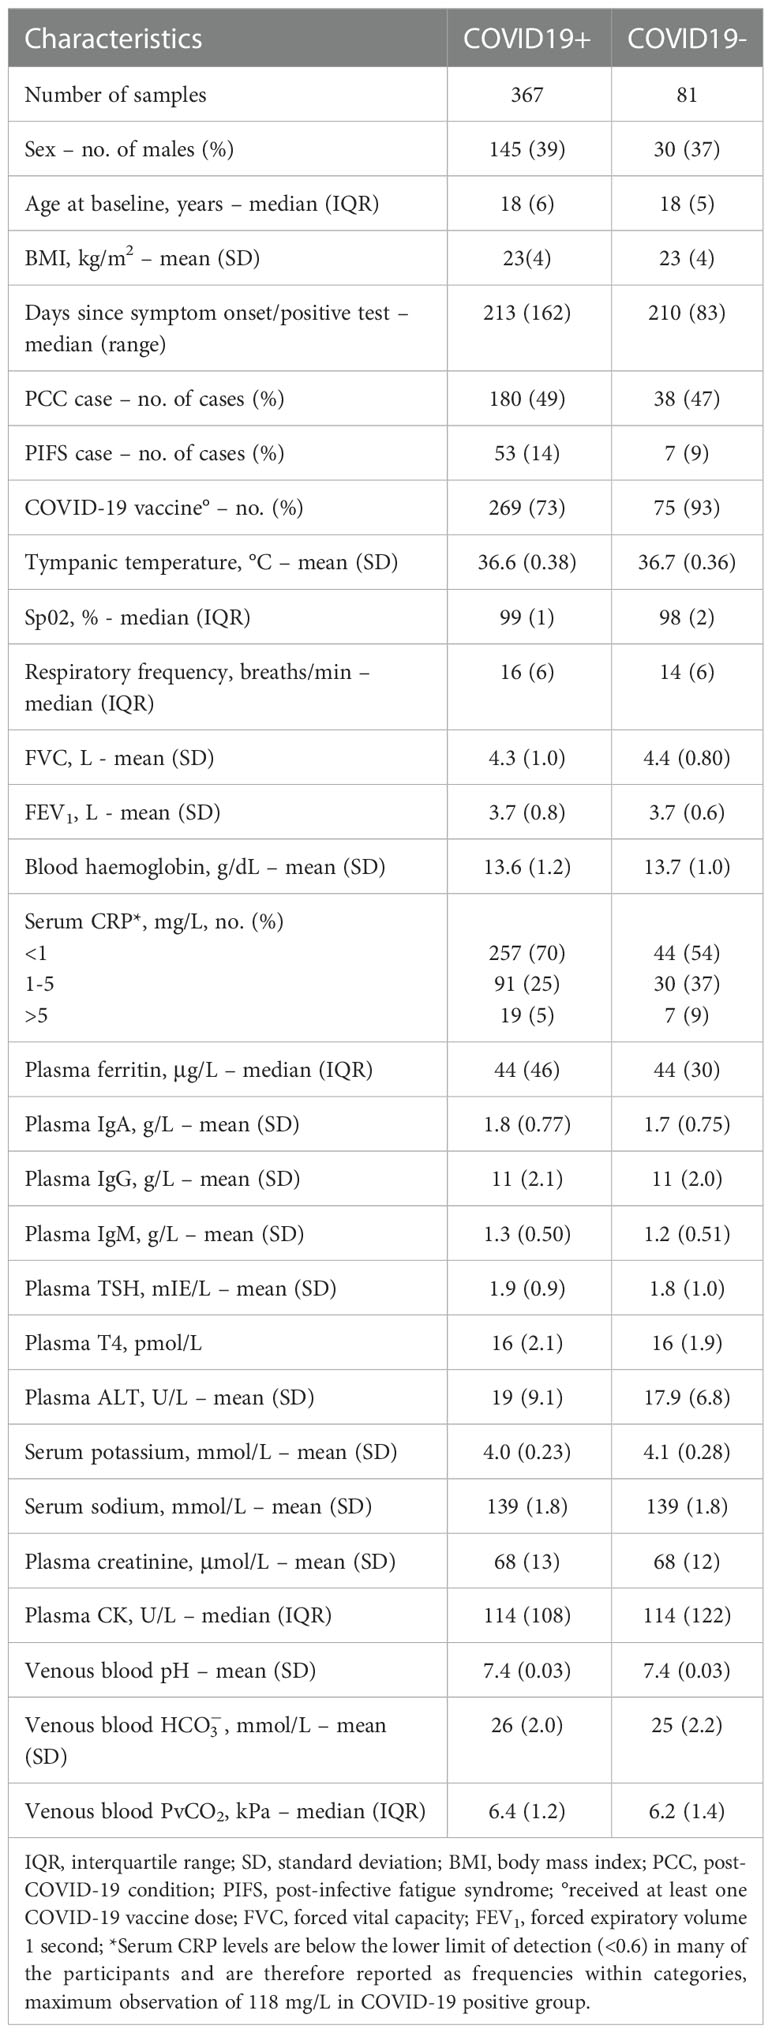
Table 1 Cohort characteristics.
Comparison of post-COVID-19 condition cases and non-cases
Background characteristics were similar across the two groups, including the adherence to WHO Post-COVID-19 condition criteria, with 49.0% in the COVID-19 positive and 46.9% in the COVID-19 negative group (Table 1). Only COVID vaccine uptake was significantly higher in the COVID-19 negative group compared to the COVID-19 positive group (Chi Square test χ2 = 13.86, p-value <0.001, Table 1). The COVID+PCC+ and COVID+PCC- participants had significantly higher plasma levels of eotaxin and MCP-1 compared to COVID- PCC- (Table 2; Figure 1). Fold increases were 2.9 for MCP-1 and 1.3 for eotaxin respectively, when comparing COVID+PCC+ to COVID-PCC-. Additionally, COVID+PCC+ participants showed elevated levels of MCP-1 compared to COVID-PCC+, who in turn had significantly higher levels than COVID-PCC- (Table 2; Figure 1). There were no statistically significant differences in other immunological biomarkers, nor in the differential white blood cell counts across the four groups (Table 2). The comparison of spirometry measures did not show any differences (Table 3). The COVID vaccine uptake in the COVID-19 positive group was similar for those who developed PCC compared to those who did not (Table 4). Among participants with prior infection, there were no differences in SARS-CoV-2 antibody titers between unvaccinated PCC+ and PCC-, nor were there any differences between vaccinated PCC+ and vaccinated PCC- (Table 5). SARS-CoV-2 nucleocapsid antibody levels declined between the baseline visit and the 6 months follow-up in both the COVID+PCC+ and COVID+PCC- groups (Supplementary Figure 1; Supplementary Table 1). Furthermore, there was no difference in overall Epstein-Barr virus seroprevalence in the four PCC groups (Supplementary Table 2).
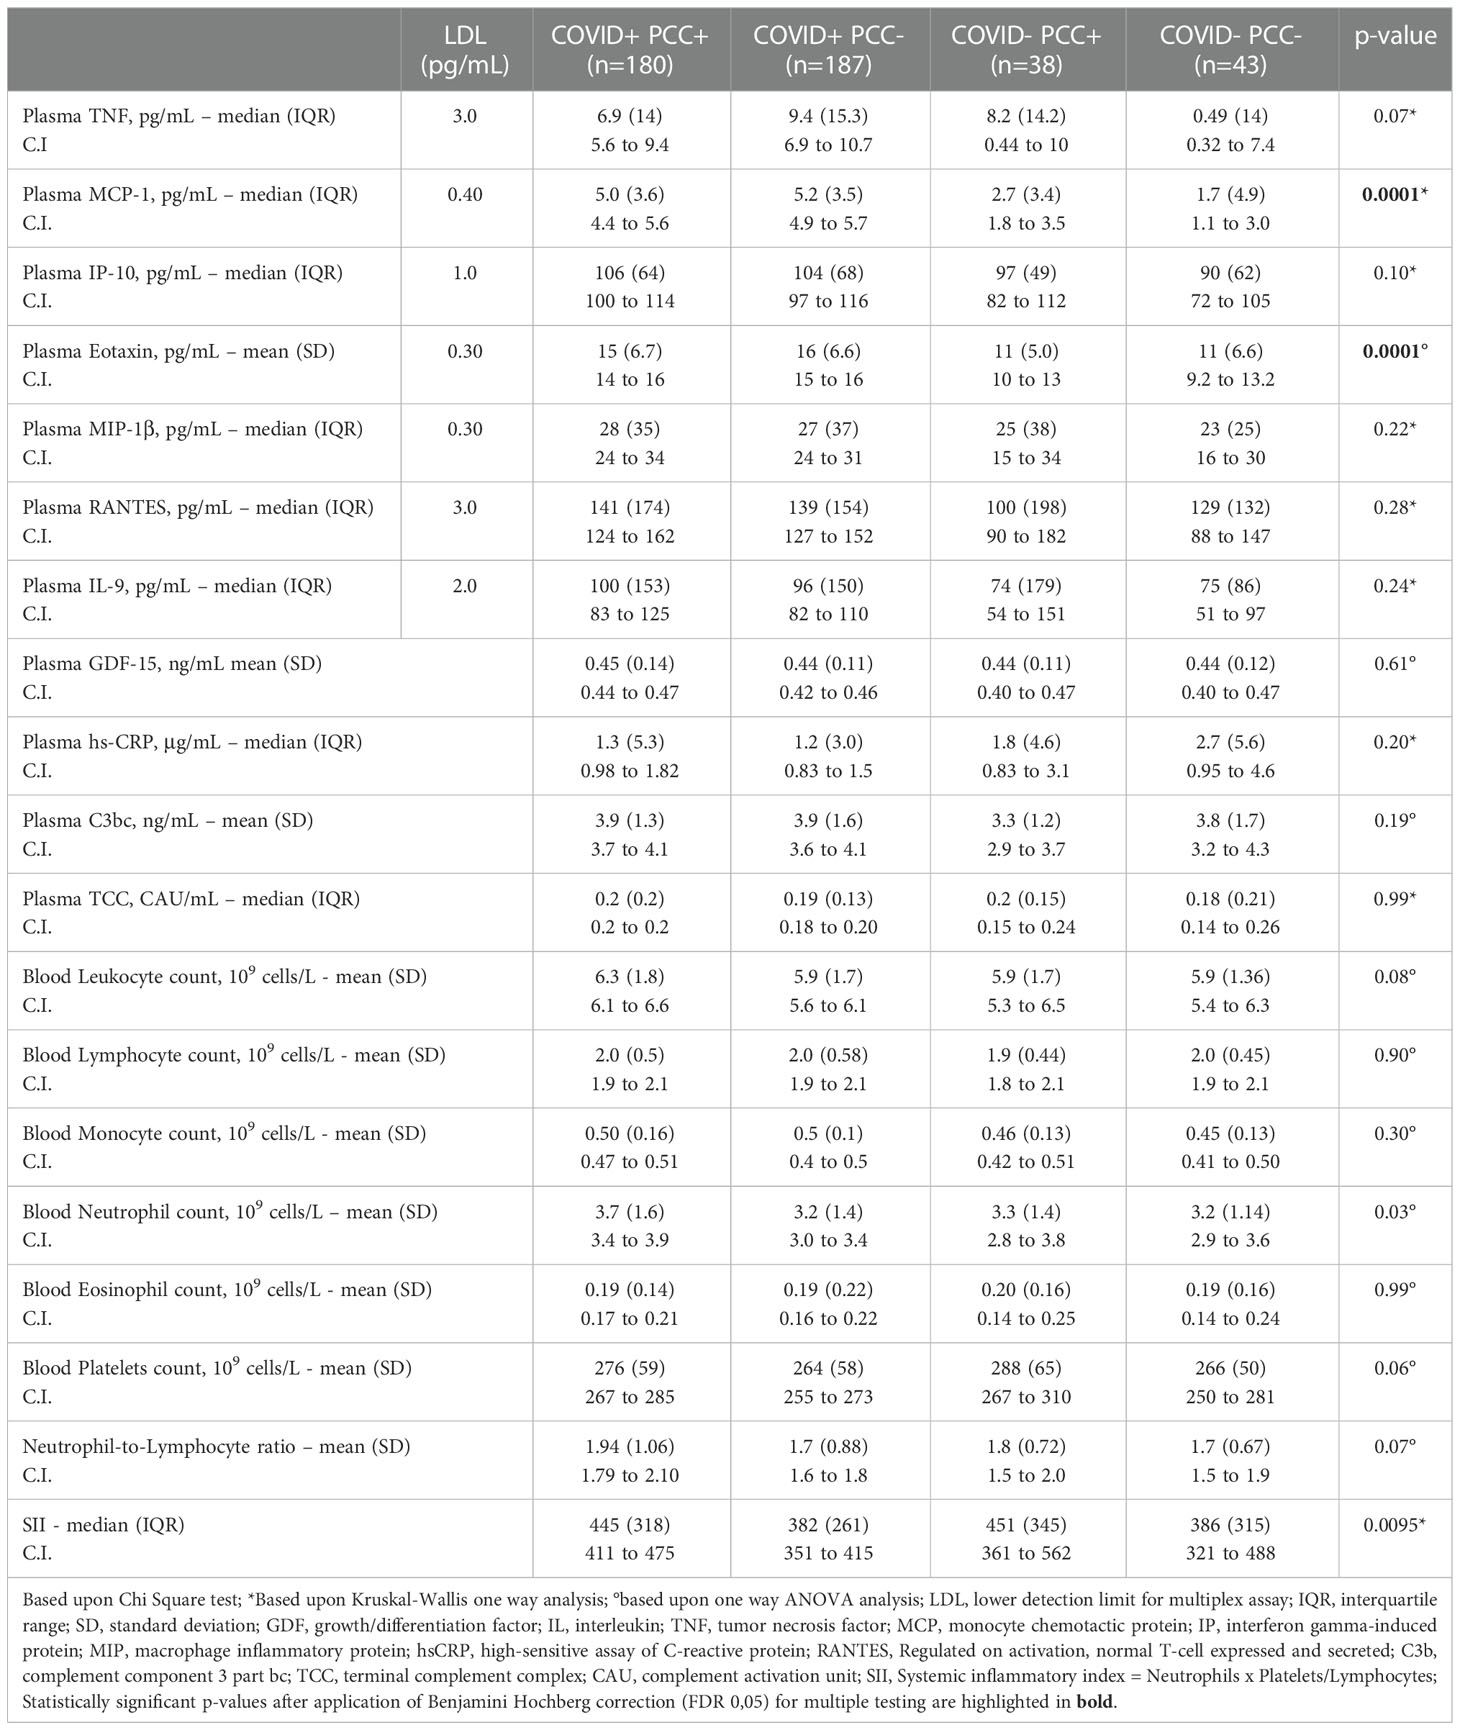
Table 2 Cross-sectional analysis of white blood cell counts, cytokines and complement activation markers between post COVID-19 (PCC) groups.
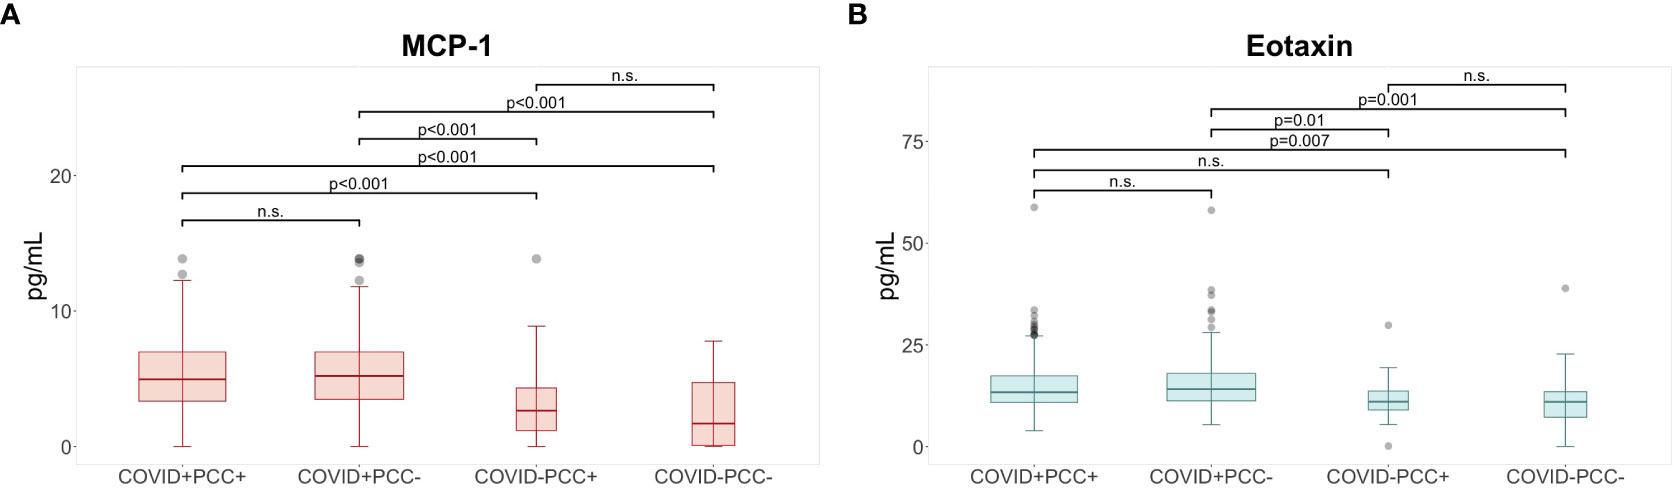
Figure 1 Elevated levels of cytokines at six months following COVID-19. Post hoc analysis for cytokines with significant differences between post COVID-19 condition (PCC) groups shows (A) higher levels of MCP-1° and (B) higher levels of eotaxin* in the COVID+ PCC+ and COVID+ PCC- groups compared to participants in the COVID- PCC+ and COVID- PCC- groups at 6 months. °Based upon pairwise comparison of means with Bonferroni adjustment for test multiplicity; *based on Dunn’s test for pairwise comparisons with Benjamini-Hochberg adjustment for test multiplicity; p-values indicate comparisons rejected by these methods at the alpha level (two sided tests); MCP, monocyte chemotactic protein; n.s., non-significant.
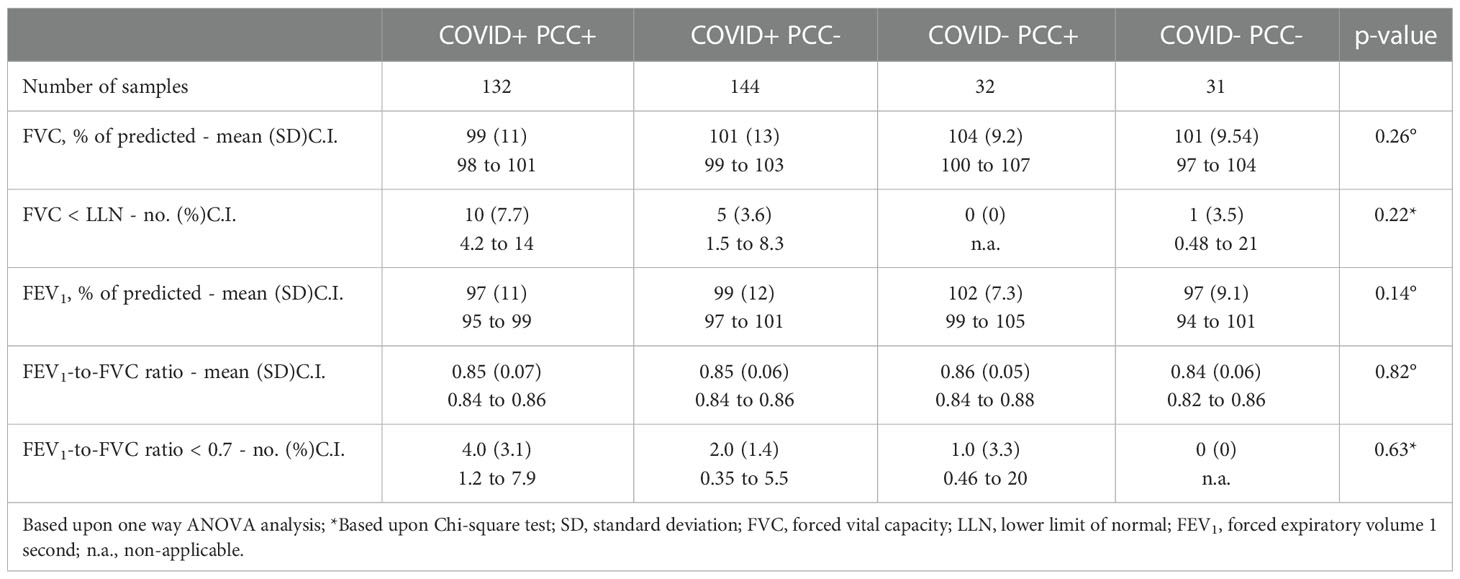
Table 3 Cross-sectional comparison of spirometry results between post COVID-19 (PCC) groups.
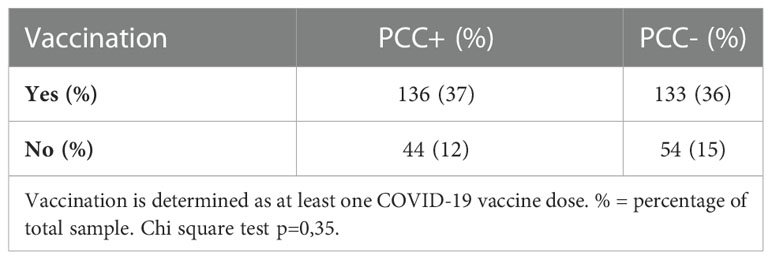
Table 4 Vaccination and PCC status in COVID-19 positive.
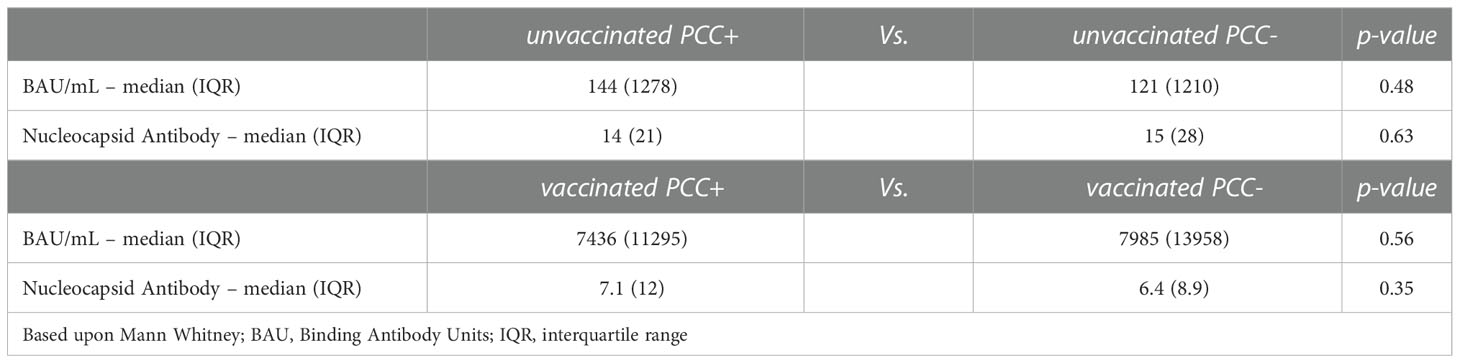
Table 5 Cross-sectional comparison of SARS-CoV-2 antibodies between COVID-19 positive PCC groups.
Analogously, when classified according to PIFS criteria, levels of MCP-1 and eotaxin were elevated in the COVID+PIFS+ and COVID+PIFS- versus COVID-PIFS- (Supplementary Table 3; Figure 2). Fold changes were 2.4 for MCP-1 and 1.36 for eotaxin respectively when comparing COVID+PIFS+ participants to COVID-PIFS-. Comparison of peripheral white blood cell counts, spirometry measures and SARS-CoV-2 antibodies did not reveal any significant differences between the four groups (Supplementary Tables 3–5).
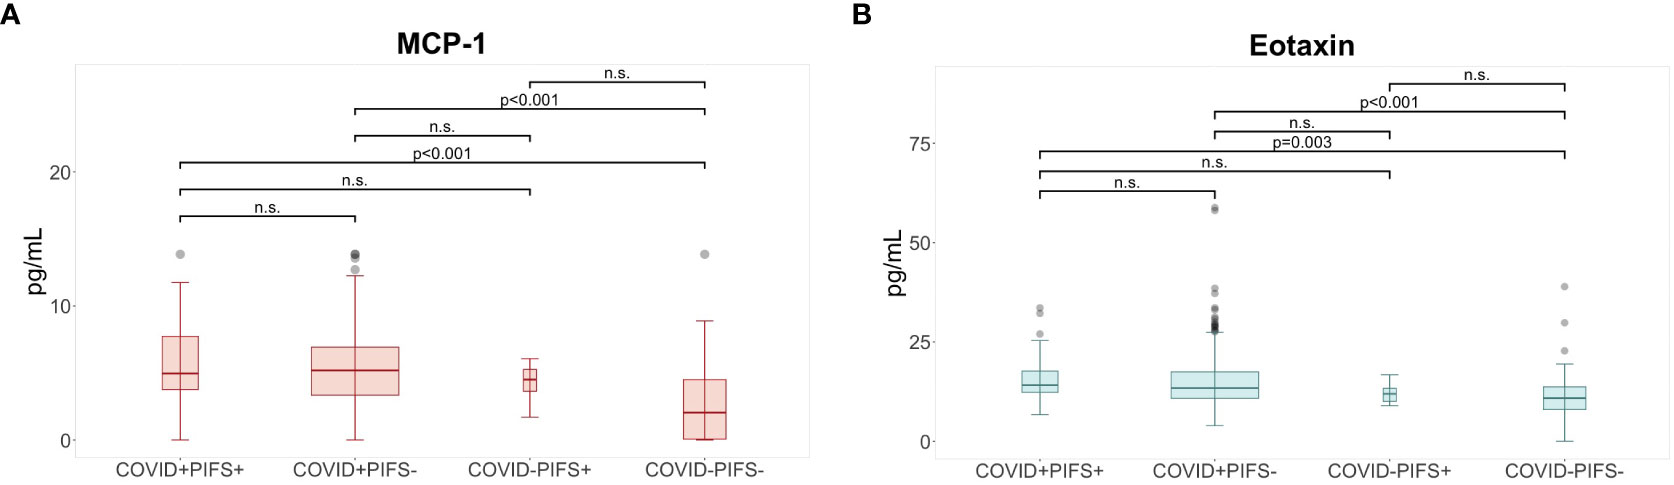
Figure 2 Elevated levels of cytokines at six months following COVID-19. Post hoc analysis for cytokines with significant differences between post-infective fatigue syndrome (PIFS) groups shows (A) higher levels of MCP-1° and (B) higher levels of eotaxin* in the COVID+ PIFS+ and COVID+ PIFS- groups compared to participants in the COVID- PIFS+ and COVID- PIFS- groups at 6 months. ° Based upon pairwise comparison of means with Bonferroni adjustment for test multiplicity; * based on Dunn’s test for pairwise comparisons with Benjamini-Hochberg adjustment for test multiplicity; p-values indicate comparisons rejected by these methods at the alpha level (two sided tests); MCP, monocyte chemotactic protein; n.s., non-significant.
Associations within the post COVID-19 condition cases
Within the COVID+PCC+ group, there was no correlation between COVID-19 associated symptoms and MCP-1 or eotaxin levels (Table 6). Analogously, there were no significant associations between these markers and COVID-19 associated symptoms in the affected COVID-19 positive if classified according to PIFS criteria (COVID+PIFS+) (Supplementary Table 6). When looking at PCC caseness regardless of COVID-19 status, all correlations were non-significant (Supplementary Table 7).
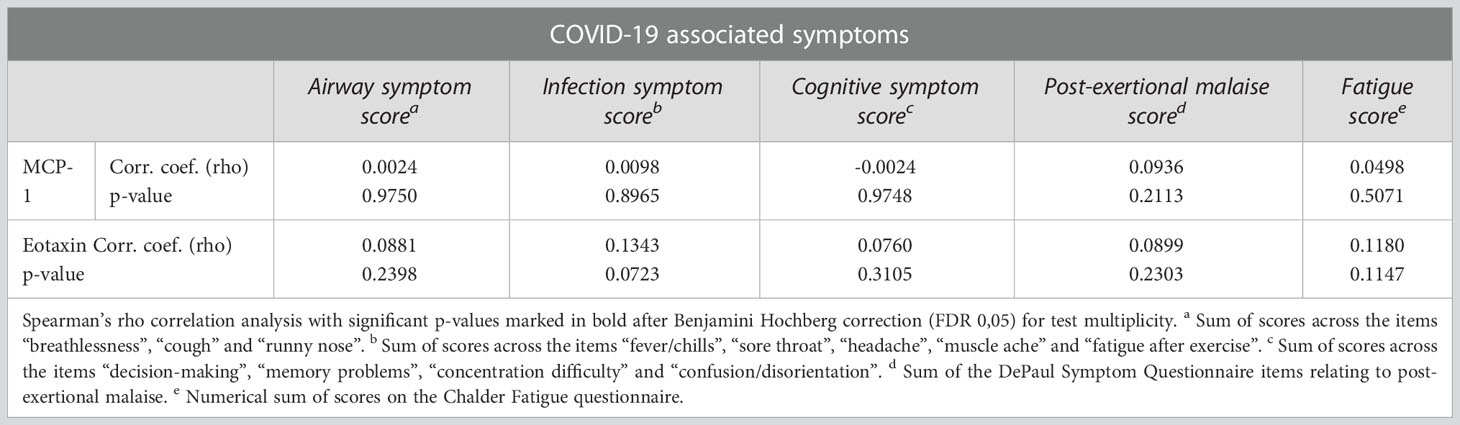
Table 6 Correlation between immunological markers and symptoms within the COVID+ PCC+ group.
Comparison of COVID-19 positive and COVID-19 negative participants
The COVID-19 positive group had significantly higher levels of plasma MCP-1, eotaxin and IP-10 compared to the COVID-19 negative group (Supplementary Table 8; Figure 3). Fold changes were 2.47, 1.31 and 1.16 for MCP-1, eotaxin and IP-10 respectively. To confirm whether COVID-19 status was significantly associated with these plasma levels after accounting for demographic differences, a multiple linear regression was performed incorporating age, sex, body-mass-index, and COVID-19 vaccination status (Supplementary Table 9). In addition, the frequency of asthmatics was similar in both COVID-19 groups (Chi square test, p-value = 0,63). No significant differences between COVID-19 groups were detected when comparing the differential white blood cell count and spirometry measures (Supplementary Tables 8, 10). Within the COVID-19 positive group, none of the immunological markers were correlated with COVID-19 associated symptoms (Supplementary Table 11).
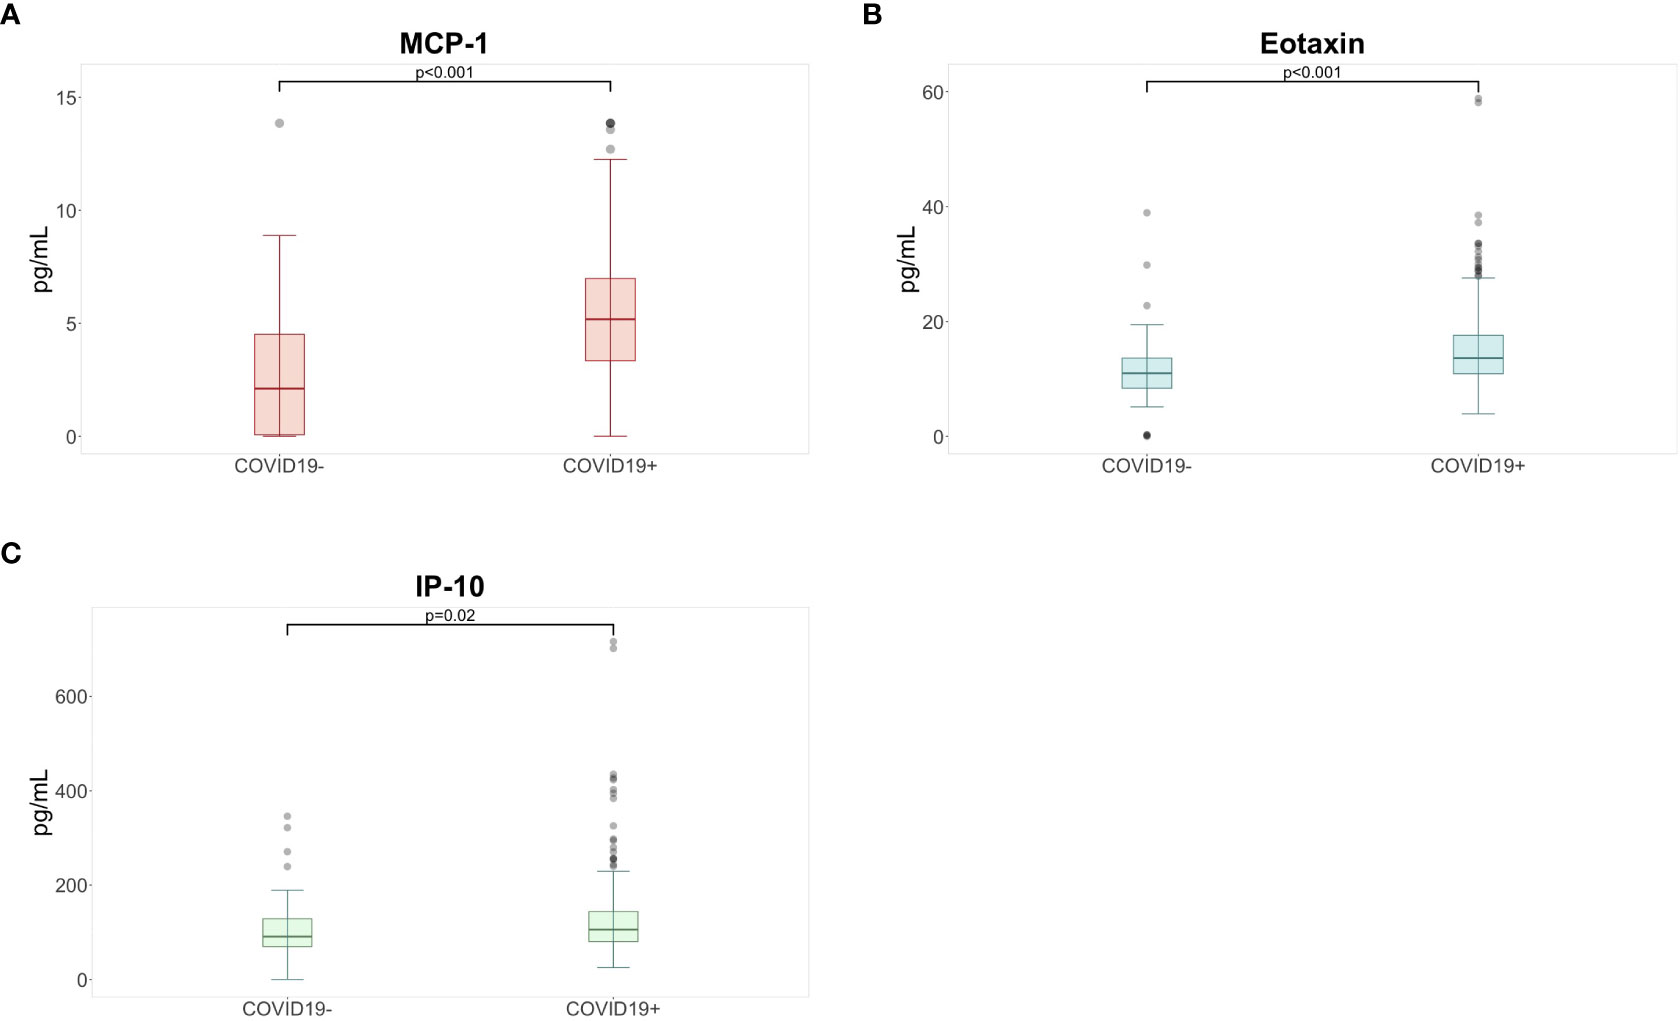
Figure 3 Higher levels of (A) MCP-1°, (B) eotaxin*, and (C) IP-10° were detected in the COVID-19 positive group compared to participants in the COVID-19 negative group at six months following COVID-19 infection. ° based upon Mann Whitney U with Benjamini Hochberg correction for multiple testing; * based upon Student T test with Benjamini Hochberg correction for multiple testing; p-values indicate comparisons rejected by these methods at the alpha level (two sided tests); IP, interferon gamma induced protein; MCP, monocyte chemotactic protein.
Discussion
This study of a large group of young, non-hospitalized COVID-19 convalescents shows that a biomarker signature remains at six months after mild COVID-19 infection. Elevated levels of eotaxin, MCP-1 and IP-10 were detected in COVID-19 convalescents compared to COVID-19 negative participants. However, these changes in immunological markers did not associate with persistent symptoms or disability experienced by a subset of study participants after mild COVID-19 infection. No alterations in immunological markers were exclusively detected in post-COVID-19 affected participants, regardless of the applied post-COVID-19 definition. This resonates well with the baseline report from our cohort where clinical symptoms were independent of inflammatory markers (18). Additionally, no differences were detected in spirometry measures between COVID-19 positive and negative participants, regardless of post-COVID-19 symptomatology. Thus, complaints of dyspnea in post-COVID-19 affected individuals could not be explained by deterioration of pulmonary function, nor by an inability to repair tissue damage. This is in line with previously reported findings from the sub-acute infection stage of our cohort (18). To the best of our knowledge, this is the largest prospective study assessing post-COVID-19 immune alterations and pulmonary function in adolescents and young adults.
Different hypotheses have been proposed for PCC pathogenesis, including antigen persistence (31), latent virus reactivation (32), chronic inflammation and auto-immunity (33). Our data suggest an immune signature specific to COVID-19 but unrelated to post-COVID-19 symptomatology. Multiplex plasma cytokine analysis revealed elevated levels of three chemokines (monocyte chemoattractant protein 1 (MCP-1), eotaxin, and interferon-γ induced protein (IP-10)) in COVID-19 positive participants. IP-10 and eotaxin were also elevated in the COVID-19 group during the sub-acute infection stage (18). Chemokines are a superfamily of proteins that mediate a range of pro-inflammatory effects on leukocytes, such as chemotaxis, degranulation, and integrin activation. Eotaxin, an eosinophil-specific chemoattractant belonging to the CC family of chemokines, is implicated in the accumulation and activation of eosinophils at sites of allergic inflammation (34). MCP-1 is structurally closely related to eotaxin, also belonging to the CC family, but principally attracts monocytes, activated T cells and basophils (35). MCP-1, together with IP-10, a CXC family member, has been brought forward as part of the “cytokine storm” in COVID-19, a type of hyperinflammatory state associated with worse outcome in acute SARS-CoV-2 infection (6). Upon viral infection, IP-10 is upregulated by locally produced IFN-γ and becomes available for the recruitment of monocytes, T lymphocytes and NK cells as part of the anti-viral response (35). Taken together, while chemokines are essential in the initial phases of antiviral response, sustained elevated levels can produce hyperinflammation and tissue damage.
One hypothesized explanation for the persistent elevation of these chemokines is viral persistence in COVID-19 convalescents, where the pathogen chronically stimulates the innate and adaptive immune system (31). In our cohort, SARS-CoV-2 anti-nucleocapsid titers declined over time and anti-SARS-CoV-2 specific antibodies were similar between unvaccinated convalescents with or without persistent post-infectious symptoms, decreasing the likelihood of antigen persistence as a trigger of PCC. This contrasts with findings by Klein et al. showing enhanced anti-Spike immune response among PCC+ participants (36). However, conventional antibody screening in peripheral blood might not be sufficient to detect viral persistence in “anatomical sanctuaries”. Previously, SARS-CoV-2 nucleocapsid protein and viral RNA have been detected in gut tissue after COVID-19 recovery (37).
Recent studies have found immunological markers and immune cell populations that remain altered following COVID-19 infection, some changes being specific to PCC. Bergamaschi et al. identified persistent abnormal levels of IL-6 and TNF after clinical recovery from COVID-19 infection (38). Phetsouphanh et al. identified six cytokines (IFN-β, IFN-λ1, IFN-γ, CXCl9, CXCL10, IL-8, sTIM-3) that were elevated in the COVID19+ PCC+ and PCC- versus controls at four months after COVID-19 infection, pointing to an immune signature specific to COVID-19 (14). Interestingly, at eight months IFN-β and IFN-λ levels were significantly elevated in PCC+ compared to all other groups, indicating that PCC related immune alterations might become more apparent with time. These findings align with a recent study assessing PCC immune profiles at one year after infection: marked alterations in immune cell population frequencies are accompanied by higher intracellular IL-4 and IL-6 production in peripheral blood mononuclear cells (PBMC) from PCC+ patients, together with elevated IL-8 and CCL4 plasma levels (36). While the exact immunological markers differ between studies, all indicate an ongoing inflammatory response and immune dysregulation in COVID-19 convalescents weeks-to-months after the initial SARS-CoV-2 infection. Variations in the immune markers on the cellular and transcriptional levels are attributed to persistent symptoms in PCC+ convalescent individuals (33, 36, 39).
In contrast, our data did not reveal immunological aberrations specific to PCC, nor did we find any relationship between immunological markers and symptom severity. Our study is based on a prospective cohort of non-hospitalized adolescents who have been rigorously assessed with operationalized PCC and PIFS criteria. Given the high prevalence of PCC-associated symptoms in the general population (40), our study might have captured PCC cases too liberally and therefore lacked power to detect differences in immune markers in true PCC cases. The broad PCC case definition by the WHO can make it difficult to distinguish between affected individuals due to the impact of the pandemic-associated stress or due to the impact of the infection itself. However, the analysis has been repeated with case assessment based on post-infective fatigue syndrome (PIFS) criteria and the classification was done blinded to COVID-19 status, increasing the validity of our findings. Phetsouphanh et al. have based their PCC classification on the presence of few hallmark symptoms (cough, fatigue, dyspnea) (14), while Klein et al. have recruited their PCC participants from Long COVID clinics (36), increasing the risk that observed differences between PCC, convalescents and controls are due to unrecognized factors (age, co-morbidities, initial disease severity) rather than actual differences in immunological markers. Self-selection, for instance, can lead to inclusion of PCC patients representing the extremes of the symptom spectrum related to post-COVID-19 symptomatology and produce biased findings. All findings, including our own, should be validated in a comparable cohort.
There are several limitations to our study. Our analysis is based on a small number of COVID-19 negative participants, many of which were recruited after SARS-CoV-2 testing for infectious symptoms. They might have contracted a different viral disease and therefore may not be true controls. However, it is assumed that common colds do not provoke post-infectious fatigue states (41) and participants with recent Epstein-Barr virus infection, a known precipitator of post-infective fatigue (42), were excluded from the analysis. In addition, there is a constantly evolving SARS-CoV-2 variant landscape, and B1.1.7. (alpha) was the dominant SARS-CoV-2 virus variant throughout the recruitment period for this study. The impact of the delta and omicron variants cannot be assessed here as the disease burden and pathophysiology might be variant-dependent. Finally, only seven out of 27 cytokines assessed by the multiplexed analysis yielded levels sufficient for conclusive analysis, and only three showed statistically significant differences between the groups. This is not surprising as peripheral blood cytokine levels are often undetectable with standard assays in healthy individuals (43). Reservations should be made regarding (over)interpretation of these results as the differences in cytokine levels were modest and fell within the physiological range for healthy individuals (44). Most participants received a COVID-19 vaccine during the follow-up period, potentially influencing the peripheral immune markers to a greater extent than the mild COVID-19 infection itself. Hence, the biological and clinical relevance of our findings is not clear, especially given the lack of association with post-COVID-19 symptomatology. Cytokine levels in plasma might not reliably reflect those in inflamed tissues and therefore, fail to show an association between tissue damage, inflammation, and Post-COVID-19 symptomatology. Other techniques, ultra-sensitive cytokine assays and single cell transcriptomics might still shed light on immune cell populations or biomarkers associated with PCC.
In the future, more prospective studies are needed to investigate the drivers of immune activation in both SARS-CoV-2 convalescence and Post-COVID-19 condition. The focus should lie on both high-resolution immune profiling and appropriate study design, including comparisons with normative data on post-COVID-19 symptomatology and adequate post-COVID-19 condition case ascertainment.
Conclusion
SARS-CoV-2 virus exerted a modest, prolonged effect on the expression of chemokines eotaxin, MCP-1 and IP-10 at 6 months after convalescence. These elevated immunological markers were, however, unrelated to post-COVID-19 symptomatology.
Data availability statement
The raw data supporting the conclusions of this article will be made available by the authors, without undue reservation.
Ethics statement
The studies involving human participants were reviewed and approved by Regionale Komiteer for Medisinsk og Helsefaglig Forskningsetikk (REK). Written informed consent to participate in this study was provided by the participants’ legal guardian/next of kin.
Author contributions
The authors confirm contribution to the paper as follows: Study conception and design: VW. Data collection: SS, LB, JS, LH, TS-S. Analysis and interpretation of results: SS, LB, VW, LH, JS, FL-J, TM, AM, GE, TL, TT. Draft manuscript preparation: SS, LB, VW. All authors contributed to the article and approved the submitted version.
Funding
This study received funding from Norges Forskningsråd (302079).
Acknowledgments
We thank Andrew Lloyd for discussions on the manuscript; Andrine Risøy, Linnéa Erlingsson, Helene Mathisen, Jeanette Dulsrud, Ann Cathrin Pettersen for practical assistance; Judith Anita Ludviksen for laboratory analyses.
Conflict of interest
Author TT was employed by company Fürst Medical Laboratory.
The remaining authors declare that the research was conducted in the absence of any commercial or financial relationships that could be construed as a potential conflict of interest.
Publisher’s note
All claims expressed in this article are solely those of the authors and do not necessarily represent those of their affiliated organizations, or those of the publisher, the editors and the reviewers. Any product that may be evaluated in this article, or claim that may be made by its manufacturer, is not guaranteed or endorsed by the publisher.
Supplementary material
The Supplementary Material for this article can be found online at: https://www.frontiersin.org/articles/10.3389/fimmu.2022.1081718/full#supplementary-material
References
1. Huang C, Huang L, Wang Y, Li X, Ren L, Gu X, et al. 6-month consequences of COVID-19 in patients discharged from hospital: A cohort study. Lancet (2021) 397(10270):220–32. doi: 10.1016/S0140-6736(20)32656-8
2. Blomberg B, Mohn KG, Brokstad KA, Zhou F, Linchausen DW, Hansen BA, et al. Long COVID in a prospective cohort of home-isolated patients. Nat Med (2021) 27(9):1607–13. doi: 10.1038/s41591-021-01433-3
3. Al-Aly Z, Xie Y, Bowe B. High-dimensional characterization of post-acute sequelae of COVID-19. Nature (2021) 594(7862):259–64. doi: 10.1038/s41586-021-03553-9
4. Molteni E, Sudre CH, Canas LS, Bhopal SS, Hughes RC, Antonelli M, et al. Illness duration and symptom profile in symptomatic UK school-aged children tested for SARS-CoV-2. Lancet Child Adolesc Health (2021) 5(10):708–18. doi: 10.1016/S2352-4642(21)00198-X
5. Caspersen IH, Magnus P, Trogstad L. Excess risk and clusters of symptoms after COVID-19 in a large Norwegian cohort. Eur J Epidemiol (2022) 37(5):539–48. doi: 10.1007/s10654-022-00847-8
6. Chen C, Haupert SR, Zimmermann L, Shi X, Fritsche LG, Mukherjee B. Global prevalence of post COVID-19 condition or long COVID: A meta-analysis and systematic review. J Infect Dis (2022) 6:jiac136. doi: 10.1093/infdis/jiac136
7. Soriano JB, Murthy S, Marshall JC, Relan P, Diaz JV. A clinical case definition of post-COVID-19 condition by a Delphi consensus. Lancet Infect Dis (2022) 22(4):e102–e7. doi: 10.1016/S1473-3099(21)00703-9
8. Stephenson T, Pinto Pereira SM, Shafran R, de Stavola BL, Rojas N, McOwat K, et al. Physical and mental health 3 months after SARS-CoV-2 infection (long COVID) among adolescents in England (CLoCk): A national matched cohort study. Lancet Child Adolesc Health (2022) 6(4):230–9. doi: 10.1016/S2352-4642(22)00022-0
9. UK Office for National Statistics (ONS). All data related to prevalence of ongoing symptoms following coronavirus (COVID-19) infection in the UK . Available at: https://www.ons.gov.uk/peoplepopulationandcommunity/healthandsocialcare/conditionsanddiseases/bulletins/ (Accessed 1 September 2022).
10. Behnood SA, Shafran R, Bennett SD, Zhang AXD, O'Mahoney LL, Stephenson TJ, et al. Persistent symptoms following SARS-CoV-2 infection amongst children and young people: A meta-analysis of controlled and uncontrolled studies. J Infect (2022) 84(2):158–70. doi: 10.1016/j.jinf.2021.11.011
11. Wong TL, Weitzer DJ. Long COVID and myalgic Encephalomyelitis/Chronic fatigue syndrome (ME/CFS)-a systemic review and comparison of clinical presentation and symptomatology. Med (Kaunas) (2021) 57(5):418. doi: 10.3390/medicina57050418
12. Kristiansen MS, Stabursvik J, O'Leary EC, Pedersen M, Asprusten TT, Leegaard T, et al. Clinical symptoms and markers of disease mechanisms in adolescent chronic fatigue following Epstein-Barr virus infection: An exploratory cross-sectional study. Brain Behav Immun (2019) 80:551–63. doi: 10.1016/j.bbi.2019.04.040
13. Fevang B, Wyller VBB, Mollnes TE, Pedersen M, Asprusten TT, Michelsen A, et al. Lasting immunological imprint of primary Epstein-Barr virus infection with associations to chronic low-grade inflammation and fatigue. Front Immunol (2021) 12:715102. doi: 10.3389/fimmu.2021.715102
14. Phetsouphanh C, Darley DR, Wilson DB, Howe A, Munier CML, Patel SK, et al. Immunological dysfunction persists for 8 months following initial mild-to-moderate SARS-CoV-2 infection. Nat Immunol (2022) 23(2):210–6. doi: 10.1038/s41590-021-01113-x
15. Peluso MJ, Lu S, Tang AF, Durstenfeld MS, Ho HE, Goldberg SA, et al. Markers of immune activation and inflammation in individuals with postacute sequelae of severe acute respiratory syndrome coronavirus 2 infection. J Infect Dis (2021) 224(11):1839–48. doi: 10.1093/infdis/jiab490
16. Ceban F, Ling S, Lui LMW, Lee Y, Gill H, Teopiz KM, et al. Fatigue and cognitive impairment in post-COVID-19 syndrome: A systematic review and meta-analysis. Brain Behav Immun (2022) 101:93–135. doi: 10.1016/j.bbi.2021.12.020
17. Sante GD, Buonsenso D, De Rose C, Valentini P, Ria F, Sanguinetti M, et al. Immune profile of children with post-acute sequelae of SARS-CoV-2 infection (Long covid). medRxiv (2021). doi: 10.1101/2021.05.07.21256539
18. Lund Berven L, Selvakumar J, Havdal L, Stiansen-Sonerud T, Einvik G, Leegaard TM, et al. Inflammatory markers, pulmonary function, and clinical symptoms in acute COVID-19 among non-hospitalized adolescents and young adults. Front Immunol (2022) 13:837288. doi: 10.3389/fimmu.2022.837288
19. Havdal LB, Berven LL, Selvakumar J, Stiansen-Sonerud T, Leegaard TM, Tjade T, et al. Neurological involvement in COVID-19 among non-hospitalized adolescents and young adults. Front Neurol (2022) 13:915712. doi: 10.3389/fneur.2022.915712
20. Selvakumar J, Havdal L, Drevvatne M, Brodwall E, Berven L, Stiansen-Sonerud T, et al. Prevalence and predictors of long COVID among non-hospitalised adolescents and young adults: A prospective controlled cohort study. Research Square (2022). doi: 10.21203/rs.3.rs-2021203/v1
21. Bergseth G, Ludviksen JK, Kirschfink M, Giclas PC, Nilsson B, Mollnes TE. An international serum standard for application in assays to detect human complement activation products. Mol Immunol (2013) 56(3):232–9. doi: 10.1016/j.molimm.2013.05.221
22. Tran TT, Vaage EB, Mehta A, Chopra A, Kolderup A, Anthi A, et al. Titers of antibodies the receptor-binding domain (RBD) of ancestral SARS-CoV-2 are predictive for levels of neutralizing antibodies to multiple variants. bioRxiv (2022). doi: 10.1101/2022.03.26.484261
23. Chalder T, Berelowitz G, Pawlikowska T, Watts L, Wessely S, Wright D, et al. Development of a fatigue scale. J Psychosom. Res (1993) 37:147–53. doi: 10.1016/0022-3999(93)90081-P
24. Bedree H, Sunnquist M, Jason LA. The DePaul symptom questionnaire-2: A validation study. Fatigue (2019) 7(3):166–79. doi: 10.1080/21641846.2019.1653471
25. Elliott J, Whitaker M, Bodinier B, Eales O, Riley S, Ward H, et al. Predictive symptoms for COVID-19 in the community: REACT-1 study of over 1 million people. PloS Med (2021) 18(9):e1003777. doi: 10.1371/journal.pmed.1003777
26. Pedersen M, Asprusten TT, Godang K, Leegaard TM, Osnes LT, Skovlund E, et al. Predictors of chronic fatigue in adolescents six months after acute Epstein-Barr virus infection: A prospective cohort study. Brain Behav Immun (2019) 75:94–100. doi: 10.1016/j.bbi.2018.09.023
27. Morriss RK, Wearden AJ, Mullis R. Exploring the validity of the chalder fatigue scale in chronic fatigue syndrome. J Psychosom. Res (1998) 45(5):411–7. doi: 10.1016/S0022-3999(98)00022-1
28. Fukuda K SS, Hickie I, Sharpe MC, Dobbins JG, Komaroff A. The chronic fatigue syndrome: A comprehensive approach to its definition and study. international chronic fatigue syndrome study group. Ann Intern Med (1994) 121(12):953–9. doi: 10.7326/0003-4819-121-12-199412150-00009
29. Graham BL, Steenbruggen I, Miller MR, Barjaktarevic IZ, Cooper BG, Hall GL, et al. Standardization of spirometry 2019 update. an official American thoracic society and European respiratory society technical statement. Am J Respir Crit Care Med (2019) 200(8):e70–88. doi: 10.1164/rccm.201908-1590ST
30. Quanjer PH, Stanojevic S, Cole TJ, Baur X, Hall GL, Culver BH, et al. Multi-ethnic reference values for spirometry for the 3-95-yr age range: the global lung function 2012 equations. Eur Respir J (2012) 40(6):1324–43. doi: 10.1183/09031936.00080312
31. Gaebler C, Wang Z, Lorenzi JCC, Muecksch F, Finkin S, Tokuyama M, et al. Evolution of antibody immunity to SARS-CoV-2. Nature (2021) 591(7851):639–44. doi: 10.1038/s41586-021-03207-w
32. Gold JE, Okyay RA, Licht WE, Hurley DJ. Investigation of long COVID prevalence and its relationship to Epstein-Barr virus reactivation. Pathogens (2021) 10(6):763. doi: 10.3390/pathogens10060763
33. Su Y, Yuan D, Chen DG, Ng RH, Wang K, Choi J, et al. Multiple early factors anticipate post-acute COVID-19 sequelae. Cell (2022) 185(5):881–95.e20. doi: 10.1016/j.cell.2022.01.014
34. Rankin SM, Conroy DM, Williams TJ. Eotaxin and eosinophil recruitment: Implications for human disease. Mol Med Today (2000) 6(1):20–7. doi: 10.1016/S1357-4310(99)01635-4
35. Baggiolini M, Dewals B, Moser B. Human chemokines: An update. Annu Rev Immunol (1997) 15(1):675–705. doi: 10.1146/annurev.immunol.15.1.675
36. Klein J, Wood J, Jaycox J, Lu P, Dhodapkar RM, Gehlhausen JR, et al. Distinguishing features of long COVID identified through immune profiling. medRxiv (2022) 2022:08. doi: 10.1101/2022.08.09.22278592
37. Cheung CCL, Goh D, Lim X, Tien TZ, Lim JCT, Lee JN, et al. Residual SARS-CoV-2 viral antigens detected in GI and hepatic tissues from five recovered patients with COVID-19. Gut (2022) 71(1):226–9. doi: 10.1136/gutjnl-2021-324280
38. Bergamaschi L, Mescia F, Turner L, Hanson AL, Kotagiri P, Dunmore BJ, et al. Longitudinal analysis reveals that delayed bystander CD8+ T cell activation and early immune pathology distinguish severe COVID-19 from mild disease. Immunity (2021) 54(6):1257–75.e8. doi: 10.1016/j.immuni.2021.05.010
39. Ryan FJ, Hope CM, Masavuli MG, Lynn MA, Mekonnen ZA, Yeow AEL, et al. Long-term perturbation of the peripheral immune system months after SARS-CoV-2 infection. BMC Med (2022) 20(1):26. doi: 10.1186/s12916-021-02228-6
40. Krogstad H, Loge JH, Grotmol KS, Kaasa S, Kiserud CE, Salvesen O, et al. Symptoms in the general Norwegian adult population - prevalence and associated factors. BMC Public Health (2020) 20(1):988. doi: 10.1186/s12889-020-09109-2
41. White PD, Thomas JM, Amess J, Crawford DH, Grover SA, Kangro HO, et al. Incidence, risk and prognosis of acute and chronic fatigue syndromes and psychiatric disorders after glandular fever. Br J Psychiatry (1998) 173:475–81. doi: 10.1192/bjp.173.6.475
42. Hickie I, Davenport T, Wakefield D, Vollmer-Conna U, Cameron B, Vernon SD, et al. Post-infective and chronic fatigue syndromes precipitated by viral and non-viral pathogens: Prospective cohort study. BMJ (2006) 333(7568):575. doi: 10.1136/bmj.38933.585764.AE
43. Stenken JA, Poschenrieder AJ. Bioanalytical chemistry of cytokines–a review. Anal Chim Acta (2015) 853:95–115. doi: 10.1016/j.aca.2014.10.009
44. Henno LT, Storjord E, Christiansen D, Bergseth G, Ludviksen JK, Fure H, et al. Effect of the anticoagulant, storage time and temperature of blood samples on the concentrations of 27 multiplex assayed cytokines - consequences for defining reference values in healthy humans. Cytokine (2017) 97:86–95. doi: 10.1016/j.cyto.2017.05.014
Keywords: COVID-19, Post-COVID-19, Long Covid, adolescent, immunology, biomarker, cytokine, pulmonary function
Citation: Sommen SL, Havdal LB, Selvakumar J, Einvik G, Leegaard TM, Lund-Johansen F, Michelsen AE, Mollnes TE, Stiansen-Sonerud T, Tjade T, Wyller VBB and Berven LL (2023) Inflammatory markers and pulmonary function in adolescents and young adults 6 months after mild COVID-19. Front. Immunol. 13:1081718. doi: 10.3389/fimmu.2022.1081718
Received: 27 October 2022; Accepted: 05 December 2022;
Published: 06 January 2023.
Edited by:
Svetlana Khaiboullina, University of Nevada, United StatesReviewed by:
Ryan Thwaites, Imperial College London, United KingdomYali Zheng, Xiamen University, China
Copyright © 2023 Sommen, Havdal, Selvakumar, Einvik, Leegaard, Lund-Johansen, Michelsen, Mollnes, Stiansen-Sonerud, Tjade, Wyller and Berven. This is an open-access article distributed under the terms of the Creative Commons Attribution License (CC BY). The use, distribution or reproduction in other forums is permitted, provided the original author(s) and the copyright owner(s) are credited and that the original publication in this journal is cited, in accordance with accepted academic practice. No use, distribution or reproduction is permitted which does not comply with these terms.
*Correspondence: Silke Lauren Sommen, cy5sLnNvbW1lbkBzdHVkbWVkLnVpby5ubw==