In the published article, there was an error. The TNFSF4 gene is reverse, in which the wild-type allele of rs1234314 is C rather than G and the wild-type allele of rs45454293 is C rather than G. Originally, the direction of the primer was wrong, so the allele on the sequence we read was followed by the error. Because the complementary base of C is G and rs45454293 is exactly C to G mutation, we didn’t find this error at that time. This mistake will cause the opposite result, leading to a misunderstanding about risk allele for SLE. Thus, there are 5 errors in the original manuscript needed to be corrected.
1. A correction has been made to the Abstract.
This sentence previously stated: “GG vs. CC: p=0.004; GG+ CG vs. CC: p=0.001”
The corrected sentence appears below: “CC vs. GG: p=0.004; CC+ CG vs. GG: p=0.001”.
2. A correction has been made to Results, The analysis of genotype frequencies.
This sentence previously stated: “Compared to the GG genotype, the subjects with the CC genotype would have a 4.4 times risk of SLE (95% CI =1.577-12.275, p = 0.004), which also had significance based on the dominant model (GG+CG vs. CC: OR = 4.362, 95% CI = 1.727-11.015, p = 0.001)”.
The corrected sentence appears below: “Compared to the CC genotype, the subjects with the GG genotype would have a 4.4 times risk of SLE (95% CI =1.577-12.275, p = 0.004), which also had significance based on the dominant model (CC+CG vs. GG: OR = 4.362, 95% CI = 1.727-11.015, p = 0.001)”.
3. A correction has been made to Discussion, paragraph 3. This sentence previously stated:
“It was shown that the CC genotype of rs1234314 provided a protective effect against allergic rhinitis (50), which was contrary to our result”.
The corrected sentence appears below:
“It was shown that the CC genotype of rs1234314 provided a protective effect against allergic rhinitis (50), which was the same as our result”.
4. In the published article, there was an error in Table 2 as published. The “SNP” and “Allele” columns of the TNFSF4 gene section previously contained the values “rs1234314 C/G and rs45454293 A/G” when they should contain the values “rs1234314 G/C and rs45454293 C/T”. The corrected Table 2 and its caption appears below.
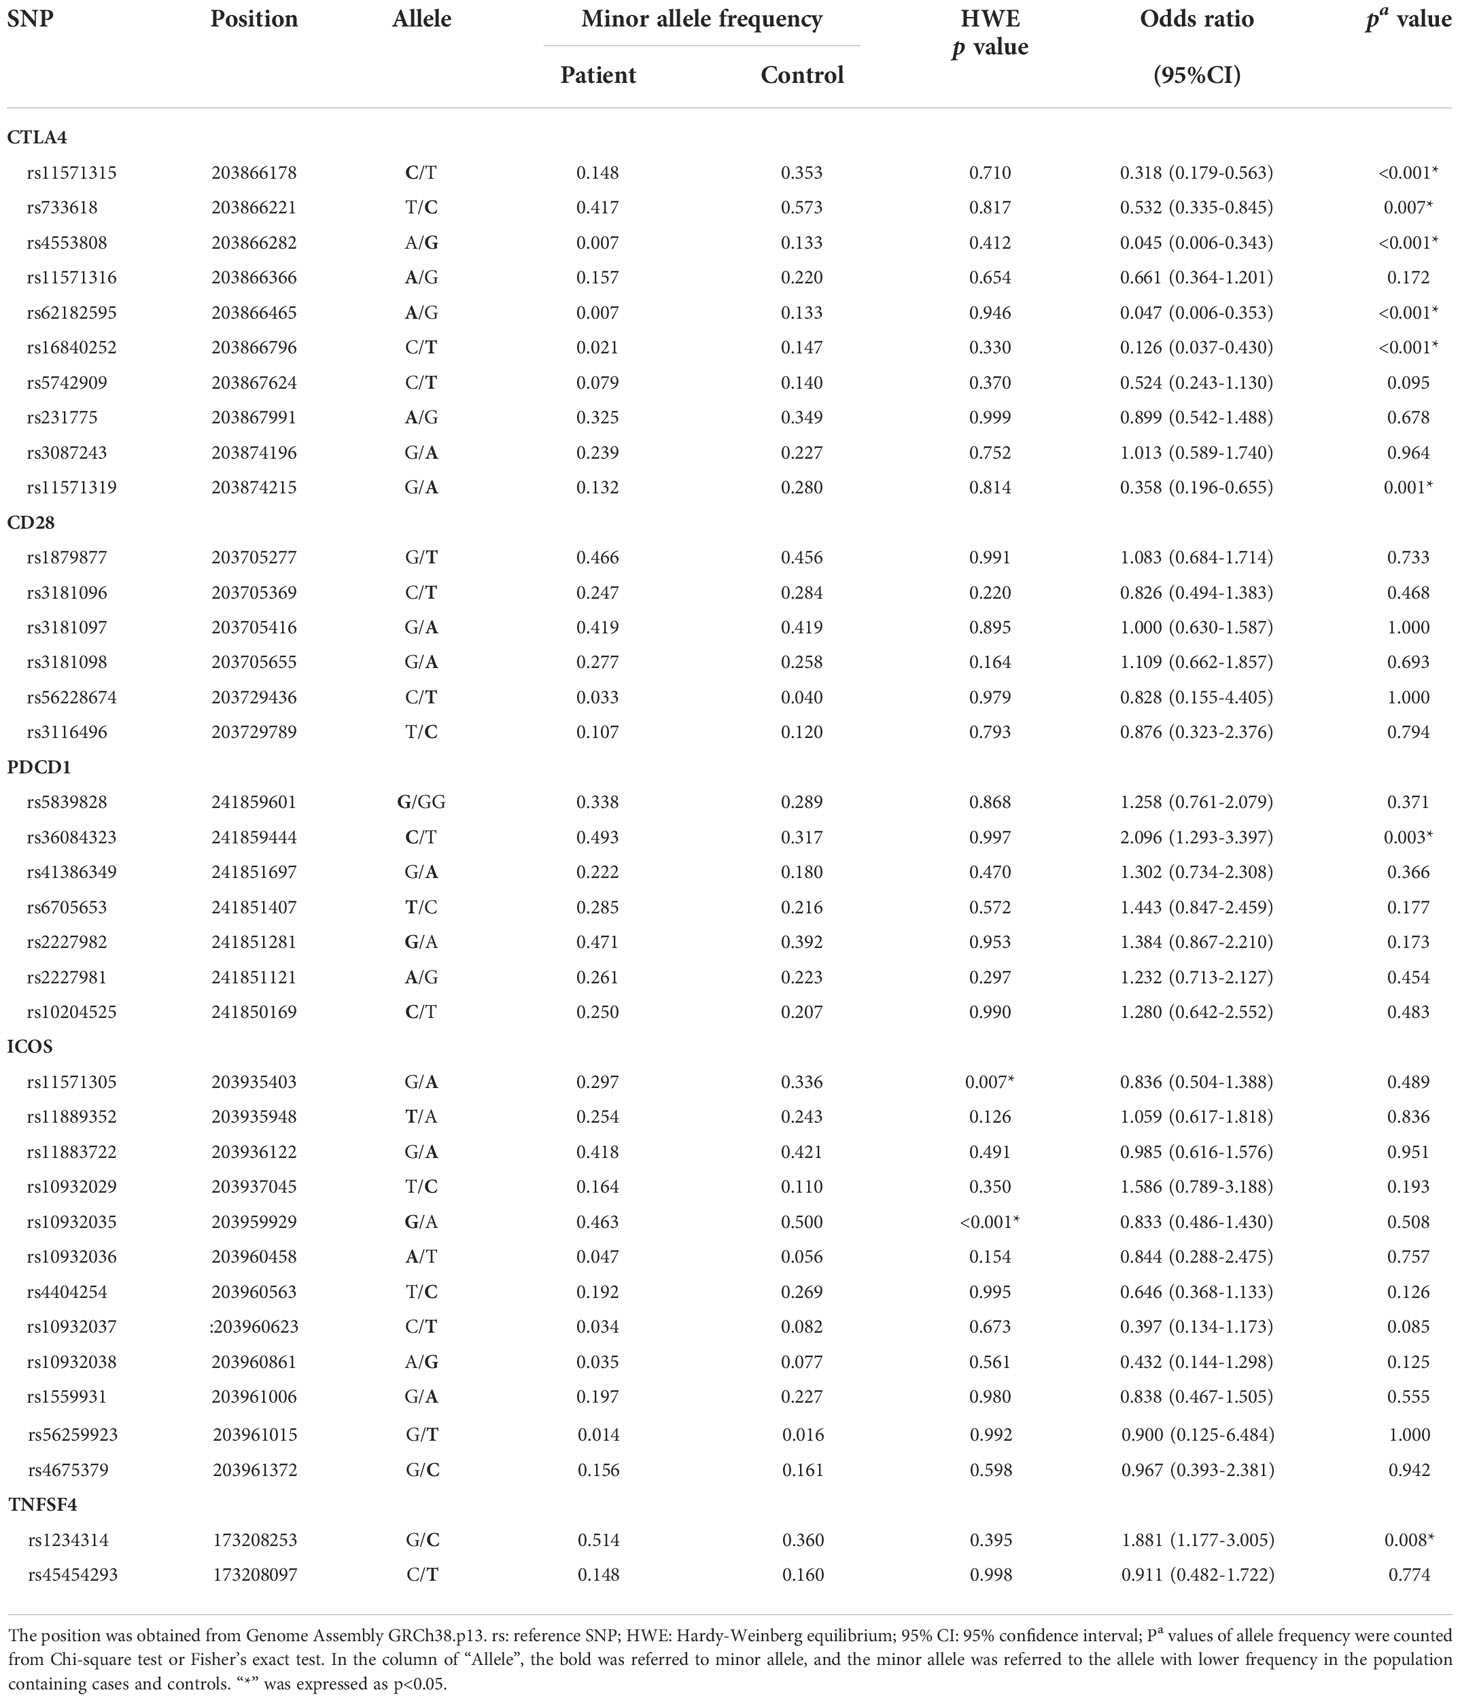
Table 2
| SNP | Position | Allele | Minor allele frequency | HWE p value | Odds ratio | pa value | |
|---|---|---|---|---|---|---|---|
| Patient | Control | (95%CI) | |||||
| CTLA4 | |||||||
| rs11571315 | 203866178 | C/T | 0.148 | 0.353 | 0.710 | 0.318 (0.179-0.563) | <0.001* |
| rs733618 | 203866221 | T/C | 0.417 | 0.573 | 0.817 | 0.532 (0.335-0.845) | 0.007* |
| rs4553808 | 203866282 | A/G | 0.007 | 0.133 | 0.412 | 0.045 (0.006-0.343) | <0.001* |
| rs11571316 | 203866366 | A/G | 0.157 | 0.220 | 0.654 | 0.661 (0.364-1.201) | 0.172 |
| rs62182595 | 203866465 | A/G | 0.007 | 0.133 | 0.946 | 0.047 (0.006-0.353) | <0.001* |
| rs16840252 | 203866796 | C/T | 0.021 | 0.147 | 0.330 | 0.126 (0.037-0.430) | <0.001* |
| rs5742909 | 203867624 | C/T | 0.079 | 0.140 | 0.370 | 0.524 (0.243-1.130) | 0.095 |
| rs231775 | 203867991 | A/G | 0.325 | 0.349 | 0.999 | 0.899 (0.542-1.488) | 0.678 |
| rs3087243 | 203874196 | G/A | 0.239 | 0.227 | 0.752 | 1.013 (0.589-1.740) | 0.964 |
| rs11571319 | 203874215 | G/A | 0.132 | 0.280 | 0.814 | 0.358 (0.196-0.655) | 0.001* |
| CD28 | |||||||
| rs1879877 | 203705277 | G/T | 0.466 | 0.456 | 0.991 | 1.083 (0.684-1.714) | 0.733 |
| rs3181096 | 203705369 | C/T | 0.247 | 0.284 | 0.220 | 0.826 (0.494-1.383) | 0.468 |
| rs3181097 | 203705416 | G/A | 0.419 | 0.419 | 0.895 | 1.000 (0.630-1.587) | 1.000 |
| rs3181098 | 203705655 | G/A | 0.277 | 0.258 | 0.164 | 1.109 (0.662-1.857) | 0.693 |
| rs56228674 | 203729436 | C/T | 0.033 | 0.040 | 0.979 | 0.828 (0.155-4.405) | 1.000 |
| rs3116496 | 203729789 | T/C | 0.107 | 0.120 | 0.793 | 0.876 (0.323-2.376) | 0.794 |
| PDCD1 | |||||||
| rs5839828 | 241859601 | G/GG | 0.338 | 0.289 | 0.868 | 1.258 (0.761-2.079) | 0.371 |
| rs36084323 | 241859444 | C/T | 0.493 | 0.317 | 0.997 | 2.096 (1.293-3.397) | 0.003* |
| rs41386349 | 241851697 | G/A | 0.222 | 0.180 | 0.470 | 1.302 (0.734-2.308) | 0.366 |
| rs6705653 | 241851407 | T/C | 0.285 | 0.216 | 0.572 | 1.443 (0.847-2.459) | 0.177 |
| rs2227982 | 241851281 | G/A | 0.471 | 0.392 | 0.953 | 1.384 (0.867-2.210) | 0.173 |
| rs2227981 | 241851121 | A/G | 0.261 | 0.223 | 0.297 | 1.232 (0.713-2.127) | 0.454 |
| rs10204525 | 241850169 | C/T | 0.250 | 0.207 | 0.990 | 1.280 (0.642-2.552) | 0.483 |
| ICOS | |||||||
| rs11571305 | 203935403 | G/A | 0.297 | 0.336 | 0.007* | 0.836 (0.504-1.388) | 0.489 |
| rs11889352 | 203935948 | T/A | 0.254 | 0.243 | 0.126 | 1.059 (0.617-1.818) | 0.836 |
| rs11883722 | 203936122 | G/A | 0.418 | 0.421 | 0.491 | 0.985 (0.616-1.576) | 0.951 |
| rs10932029 | 203937045 | T/C | 0.164 | 0.110 | 0.350 | 1.586 (0.789-3.188) | 0.193 |
| rs10932035 | 203959929 | G/A | 0.463 | 0.500 | <0.001* | 0.833 (0.486-1.430) | 0.508 |
| rs10932036 | 203960458 | A/T | 0.047 | 0.056 | 0.154 | 0.844 (0.288-2.475) | 0.757 |
| rs4404254 | 203960563 | T/C | 0.192 | 0.269 | 0.995 | 0.646 (0.368-1.133) | 0.126 |
| rs10932037 | :203960623 | C/T | 0.034 | 0.082 | 0.673 | 0.397 (0.134-1.173) | 0.085 |
| rs10932038 | 203960861 | A/G | 0.035 | 0.077 | 0.561 | 0.432 (0.144-1.298) | 0.125 |
| rs1559931 | 203961006 | G/A | 0.197 | 0.227 | 0.980 | 0.838 (0.467-1.505) | 0.555 |
| rs56259923 | 203961015 | G/T | 0.014 | 0.016 | 0.992 | 0.900 (0.125-6.484) | 1.000 |
| rs4675379 | 203961372 | G/C | 0.156 | 0.161 | 0.598 | 0.967 (0.393-2.381) | 0.942 |
| TNFSF4 | |||||||
| rs1234314 | 173208253 | G/C | 0.514 | 0.360 | 0.395 | 1.881 (1.177-3.005) | 0.008* |
| rs45454293 | 173208097 | C/T | 0.148 | 0.160 | 0.998 | 0.911 (0.482-1.722) | 0.774 |
The HWE analysis in control group and the allele frequencies in cases and controls.
The position was obtained from Genome Assembly GRCh38.p13. rs: reference SNP; HWE: Hardy-Weinberg equilibrium; 95% CI: 95% confidence interval; Pa values of allele frequency were counted from Chi-square test or Fisher’s exact test. In the column of “Allele”, the bold was referred to minor allele, and the minor allele was referred to the allele with lower frequency in the population containing cases and controls. “*” was expressed as p<0.05.
5. In the published article, there was an error in Table 3 as published. The “Genotype” column of the TNFSF4 gene section had “GG” and “CC” in the wrong positions. The corrected Table 3 and its caption appears below.
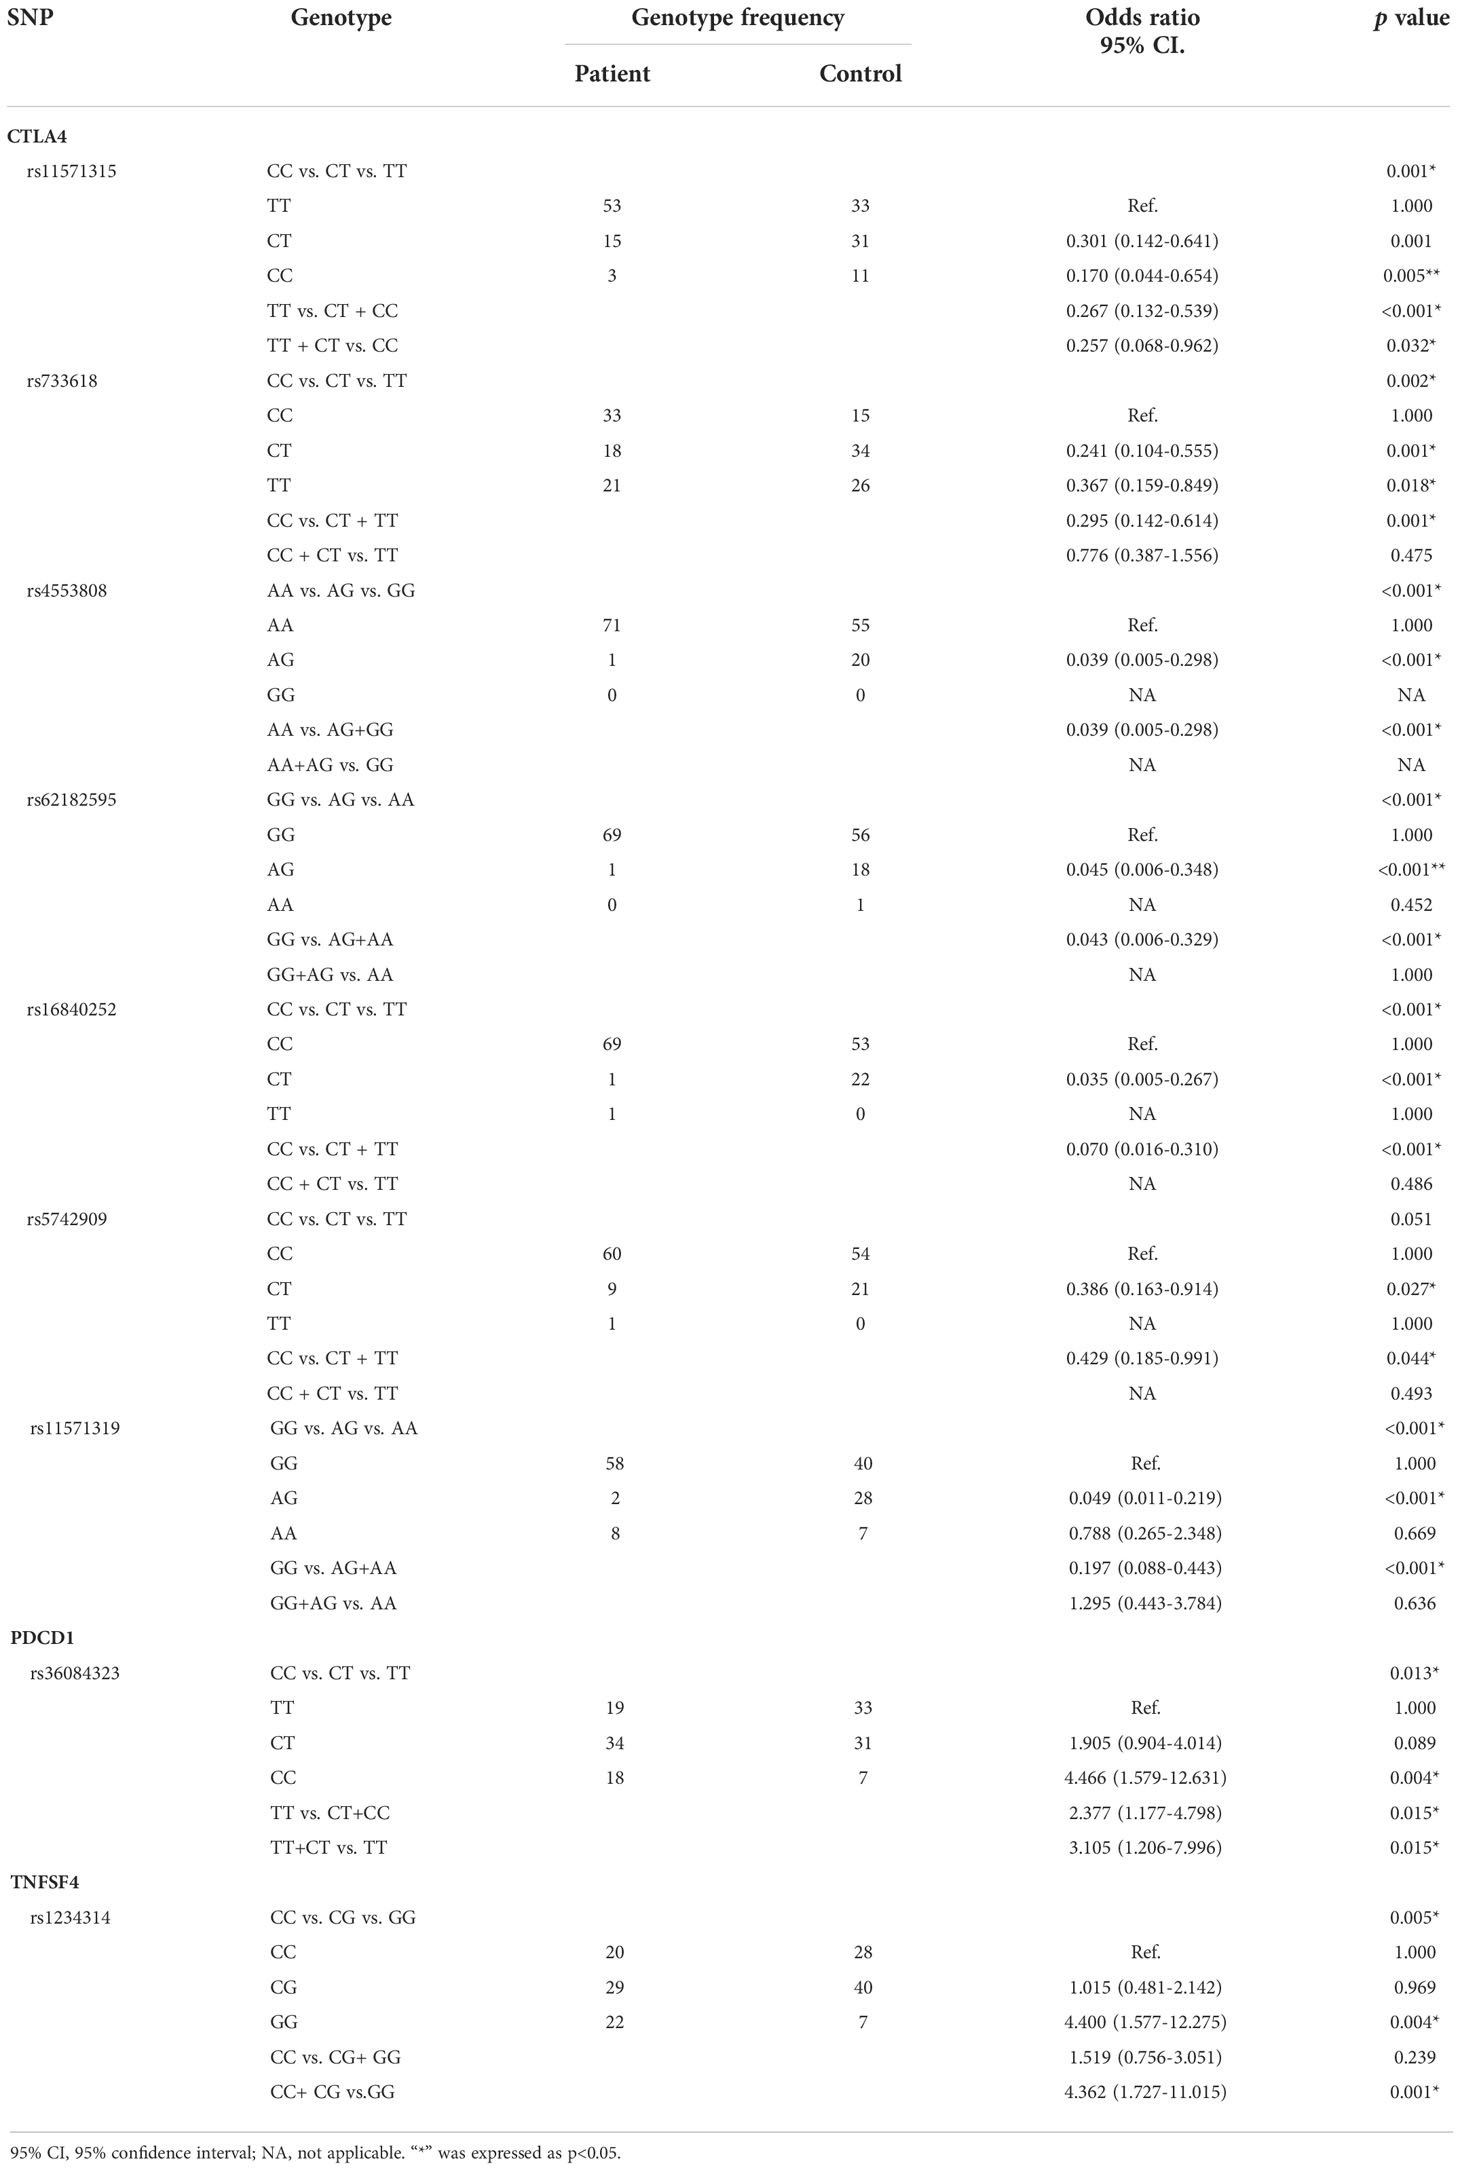
Table 3
| SNP | Genotype | Genotype frequency | Odds ratio 95% CI. | p value | |
|---|---|---|---|---|---|
| Patient | Control | ||||
| CTLA4 | |||||
| rs11571315 | CC vs. CT vs. TT | 0.001* | |||
| TT | 53 | 33 | Ref. | 1.000 | |
| CT | 15 | 31 | 0.301 (0.142-0.641) | 0.001 | |
| CC | 3 | 11 | 0.170 (0.044-0.654) | 0.005** | |
| TT vs. CT + CC | 0.267 (0.132-0.539) | <0.001* | |||
| TT + CT vs. CC | 0.257 (0.068-0.962) | 0.032* | |||
| rs733618 | CC vs. CT vs. TT | 0.002* | |||
| CC | 33 | 15 | Ref. | 1.000 | |
| CT | 18 | 34 | 0.241 (0.104-0.555) | 0.001* | |
| TT | 21 | 26 | 0.367 (0.159-0.849) | 0.018* | |
| CC vs. CT + TT | 0.295 (0.142-0.614) | 0.001* | |||
| CC + CT vs. TT | 0.776 (0.387-1.556) | 0.475 | |||
| rs4553808 | AA vs. AG vs. GG | <0.001* | |||
| AA | 71 | 55 | Ref. | 1.000 | |
| AG | 1 | 20 | 0.039 (0.005-0.298) | <0.001* | |
| GG | 0 | 0 | NA | NA | |
| AA vs. AG+GG | 0.039 (0.005-0.298) | <0.001* | |||
| AA+AG vs. GG | NA | NA | |||
| rs62182595 | GG vs. AG vs. AA | <0.001* | |||
| GG | 69 | 56 | Ref. | 1.000 | |
| AG | 1 | 18 | 0.045 (0.006-0.348) | <0.001** | |
| AA | 0 | 1 | NA | 0.452 | |
| GG vs. AG+AA | 0.043 (0.006-0.329) | <0.001* | |||
| GG+AG vs. AA | NA | 1.000 | |||
| rs16840252 | CC vs. CT vs. TT | <0.001* | |||
| CC | 69 | 53 | Ref. | 1.000 | |
| CT | 1 | 22 | 0.035 (0.005-0.267) | <0.001* | |
| TT | 1 | 0 | NA | 1.000 | |
| CC vs. CT + TT | 0.070 (0.016-0.310) | <0.001* | |||
| CC + CT vs. TT | NA | 0.486 | |||
| rs5742909 | CC vs. CT vs. TT | 0.051 | |||
| CC | 60 | 54 | Ref. | 1.000 | |
| CT | 9 | 21 | 0.386 (0.163-0.914) | 0.027* | |
| TT | 1 | 0 | NA | 1.000 | |
| CC vs. CT + TT | 0.429 (0.185-0.991) | 0.044* | |||
| CC + CT vs. TT | NA | 0.493 | |||
| rs11571319 | GG vs. AG vs. AA | <0.001* | |||
| GG | 58 | 40 | Ref. | 1.000 | |
| AG | 2 | 28 | 0.049 (0.011-0.219) | <0.001* | |
| AA | 8 | 7 | 0.788 (0.265-2.348) | 0.669 | |
| GG vs. AG+AA | 0.197 (0.088-0.443) | <0.001* | |||
| GG+AG vs. AA | 1.295 (0.443-3.784) | 0.636 | |||
| PDCD1 | |||||
| rs36084323 | CC vs. CT vs. TT | 0.013* | |||
| TT | 19 | 33 | Ref. | 1.000 | |
| CT | 34 | 31 | 1.905 (0.904-4.014) | 0.089 | |
| CC | 18 | 7 | 4.466 (1.579-12.631) | 0.004* | |
| TT vs. CT+CC | 2.377 (1.177-4.798) | 0.015* | |||
| TT+CT vs. TT | 3.105 (1.206-7.996) | 0.015* | |||
| TNFSF4 | |||||
| rs1234314 | CC vs. CG vs. GG | 0.005* | |||
| CC | 20 | 28 | Ref. | 1.000 | |
| CG | 29 | 40 | 1.015 (0.481-2.142) | 0.969 | |
| GG | 22 | 7 | 4.400 (1.577-12.275) | 0.004* | |
| CC vs. CG+ GG | 1.519 (0.756-3.051) | 0.239 | |||
| CC+ CG vs.GG | 4.362 (1.727-11.015) | 0.001* | |||
Genotype frequencies of the significant SNPs in SLE cases and healthy controls.
95% CI, 95% confidence interval; NA, not applicable. “*” was expressed as p<0.05.
6. In the published article, there was an error in Table 4 as published. The last row of the “Haplotypes” column previously contained “G”s instead of “C”s.

Table 4
| Haplotypes | Freq. Cases | Freq. Controls | OR | 95% CI. | p value |
|---|---|---|---|---|---|
| Ars62182595Trs16840252 | 0.014 | 0.253 | 0.042 | 0.005-0.324 | <0.001 |
| Ars62182595Crs16840252 | 0.014 | 0.253 | 0.042 | 0.005-0.324 | <0.001 |
| Grs62182595Trs16840252 | 0.014 | 0.280 | 0.037 | 0.005-0.286 | <0.001 |
| Crs1234314Crs45454293 | 0.690 | 0.907 | 0.229 | 0.091-0.579 | 0.001 |
Genotype frequencies of the significant SNPs in SLE cases and healthy controls.
Freq., frequency; OR, odds ratio; CI, confidence interval.
The corrected Table 4 and its caption appears below.
The authors apologize for this error and state that this does not change the scientific conclusions of the article in any way. The original article has been updated.
Statements
Publisher’s note
All claims expressed in this article are solely those of the authors and do not necessarily represent those of their affiliated organizations, or those of the publisher, the editors and the reviewers. Any product that may be evaluated in this article, or claim that may be made by its manufacturer, is not guaranteed or endorsed by the publisher.
Summary
Keywords
systemic lupus erythematosus (SLE), co-stimulatory/co-inhibitory molecules, single nucleotide polymorphism (SNP), autoimmune disease (AD), association
Citation
Chen D-P, Lin W-T and Yu K-H (2023) Corrigendum: Investigation of the association between the genetic polymorphisms of co-stimulatory system and systemic lupus erythematosus. Front. Immunol. 13:1113152. doi: 10.3389/fimmu.2022.1113152
Received
01 December 2022
Accepted
07 December 2022
Published
16 January 2023
Volume
13 - 2022
Edited and reviewed by
Zhiwei Xu, The University of Queensland, Australia
Updates
Copyright
© 2023 Chen, Lin and Yu.
This is an open-access article distributed under the terms of the Creative Commons Attribution License (CC BY). The use, distribution or reproduction in other forums is permitted, provided the original author(s) and the copyright owner(s) are credited and that the original publication in this journal is cited, in accordance with accepted academic practice. No use, distribution or reproduction is permitted which does not comply with these terms.
*Correspondence: Kuang-Hui Yu, gout@adm.cgmh.org.tw
This article was submitted to Autoimmune and Autoinflammatory Disorders: Autoimmune Disorders, a section of the journal Frontiers in Immunology
Disclaimer
All claims expressed in this article are solely those of the authors and do not necessarily represent those of their affiliated organizations, or those of the publisher, the editors and the reviewers. Any product that may be evaluated in this article or claim that may be made by its manufacturer is not guaranteed or endorsed by the publisher.