 Zhishang Meng1†
 Yanzhu Chen2†
 Wenyi Wu3
 Bin Yan1
 Lusi Zhang1
 Huihui Chen1
 Yongan Meng1
 Youling Liang1Xiaoxi Yao4
 Jing Luo1*
- 1Department of Ophthalmology, The Second Xiangya Hospital, Central South University, Changsha, China
- 2Department of Radiation Oncology, Hunan Cancer Hospital and The Affiliated Cancer Hospital of Xiangya School of Medicine, Central South University, Changsha, China
- 3Department of Ophthalmology, Xiangya Hospital, Central South University, Changsha, China
- 4Shenzhen College of International Education, Shenzhen, China
Uveal melanoma (UM) is the most common primary intraocular malignancy in adults. UM develops and is sustained by inflammation and immunosuppression from the tumor microenvironment (TME). This study sought to identify a reliable TME-related biomarker that could provide survival prediction and new insight into therapy for UM patients. Based on clinical characteristics and the RNA-seq transcriptome data of 80 samples from The Cancer Genome Atlas (TCGA) database, PRRX1 as a TME- and prognosis-related gene was identified using the ESTIMATE algorithm and the LASSO–Cox regression model. A prognostic model based on PRRX1 was constructed and validated with a Gene Expression Omnibus (GEO) dataset of 63 samples. High PRRX1 expression was associated with poorer overall survival (OS) and metastasis-free survival (MFS) in UM patients. Comprehensive results of the prognostic analysis showed that PRRX1 was an independent and reliable predictor of UM. Then the results of immunological characteristics demonstrated that higher expression of PRRX1 was accompanied by higher expression of immune checkpoint genes, lower tumor mutation burden (TMB), and greater tumor cell infiltration into the TME. Gene set enrichment analysis (GSEA) showed that high PRRX1 expression correlated with angiogenesis, epithelial–mesenchymal transition (EMT), and inflammation. Furthermore, downregulation of PRRX1 weakened the process of EMT, reduced cell invasion and migration of human UM cell line MuM-2B in vitro. Taken together, these findings indicated that increased PRRX1 expression is independently a prognostic factor of poorer OS and MFS in patients with UM, and that PRRX1 promotes malignant progression of UM by facilitating EMT, suggesting that PRRX1 may be a potential target for UM therapy.
Introduction
Uveal melanoma (UM) is the most common primary intraocular malignancy in adults, with no effective treatments currently available for metastatic UM (1). UM arises from the uveal tract of the eye, which contains the ciliary body, choroid, and iris. The clinical and biologic features of UM differ from cutaneous melanoma (2). The central mechanisms of UM progression and metastasis include aberrant gene expression, chromosomal abnormalities, cytokine imbalance, and dysregulation of signaling pathway (3–6). Primary UM can be treated with either radiation or surgery and has a low local recurrence rate. However, up to 50% of UM are aggressive malignancies, giving rise to liver metastases, with liver metastasis being a frequent cause of morbidity and mortality in patients with UM. The average overall survival (OS) time of untreated patients has been reported to be approximately 2 months (7, 8), whereas the median OS time with aggressive treatment ranged from 6 to 12 months (8–10).
UM develops from and is sustained by inflammation and immunosuppression in the tumor microenvironment (TME) (11, 12). In contrast to other solid tumors, increasing evidence indicates that high levels of tumor-infiltrating lymphocytes (TILs) in UM correlate with poor prognosis (13, 14). Vascularization, an essential feature of metastasis, is greater in UMs with moderate or intense immune infiltrates than those with a lower degree of immune infiltration (15). In addition, the stroma facilitates the proliferation and survival of tumor cells and promotes epithelial–mesenchymal transition (EMT), EMT of tumor cells can be induced by stimuli from the TME, resulting in metastasis and death (16, 17). Several EMT-inducing transcription factors (EMT-TFs) are identified to play central roles in the execution of EMT, even in non-epithelial tumors (melanoma, glioblastoma and leukemia) (18). Furthermore, the eye has been regarded as an immune-privileged area and UM has one of the lowest mutation burdens and leukocyte fractions among adult tumors, specific immune phenotypes that can rationally explain the poor efficiency of immune responses in these patients (2, 15). Current treatments of UM include surgery and radiotherapy (19, 20), although various immunotherapeutic agents have undergone clinical trials in patients with UM (8, 9, 21). UM is genetically and clinically distinct from cutaneous melanoma, it is largely unresponsive to immune checkpoint inhibitors (ICIs) (7, 22), with no effective immunotherapy or targeted therapy currently available for the treatment of UM (23).
The present study sought to identify a reliable biomarker for UM that can predict patient prognosis and responses to treatment. Transcriptome data were investigated and potential key genes of UM screened in the TCGA database. TME- and prognosis-related genes were evaluated using bioinformatics tools and algorithms. Further validation in another independent dataset and analysis of immunologic characteristics, as well as in vitro studies indicated that PRRX1 is a novel prognostic biomarker and a promising therapeutic target in UM.
Materials and Methods
Patients and Datasets
Transcriptome RNA-sequencing and clinical data were from the TCGA-UVM dataset (https://portal.gdc.cancer.gov/) (24). Additionally, gene expression and clinical information files of GSE22138 were downloaded from the Gene Expression Omnibus (GEO) database (https://www.ncbi.nlm.nih.gov/geo/) (5).
Identification of TME and Prognosis Related Hub Genes
Based on the RNA-seq data of 80 samples from the TCGA-UVM dataset, the “ESTIMATE” R package v1.0.13 was used to calculate ESTIMATE, immune, and stromal scores in the TME for all samples (25). The samples were divided into two groups based on the medians of these three scores. Thereafter, Kaplan–Meier analysis and the log-rank test (significance level: p < 0.05) were used to compare overall survival (OS) in two groups of patients using the R packages “survminer” v0.4.9 and “survival” v3.2-13.
Afterward, the “limma” package v3.48.3 in R was used to assess differential gene expression in the high and low immune/stromal score groups. The criteria for selecting differentially expressed genes (DEGs) included |log2(fold change)| >1 and a false discovery rate (FDR)-adjusted p <0.05. Results from these analyses were plotted as volcano plots using the “ggplot2” package v3.3.5 in R. Co-upregulated and co-downregulated DEGs in the high and low immune/stromal score groups were regarded as TME- and prognosis-related genes. These genes were subjected to the Gene Ontology (GO) functional enrichment and the Kyoto Encyclopedia of Genes and Genomes (KEGG) pathway analysis, with the results visualized using the R packages “clusterProfiler” v4.0.5 and “enrichplot” v1.12.2 (p <0.05, q <0.05).
Univariate Cox regression analyses (significance level: p <0.05) were performed to assess the relationships between the levels of expression of these potential candidate genes and OS in patients with UM, followed by least absolute shrinkage and selection operator (LASSO) regression analysis using the “glmnet” package v4.1-2 in R to avoid overfitting. This was followed by multivariate Cox regression analysis (significance level: p <0.05) to determine whether there was any independent prognostic effect of these candidate genes on OS.
Survival Analysis and Assessment of PRRX1 for Prognostic Prediction
Patients in the TCGA and GEO cohorts were divided into those with high and low levels of expression of PRRX1 based on the median levels of PRRX1 in each dataset. OS in the TCGA cohort and metastasis-free survival (MFS) in the GEO cohort were analyzed by the Kaplan–Meier method and compared in each pair of groups by the log-rank test (significance level: p <0.05), using the “survival” package v3.2-13 in R. The predictive power of the model was evaluated using receiver operating characteristic (ROC) and Cox regression (significance level: p <0.05) analyses, as calculated using the R packages “survival” v3.2-13, “survminer” v0.4.9 and “timeROC” v0.4. The prognostic impact of PRRX1 expression in several types of cancer was investigated by pan-cancer analysis. RNA-seq data and clinical information come from patients with 33 types of tumors were downloaded from the TCGA database (https://portal.gdc.cancer.gov/). Univariate Cox regression (significance level: p <0.05) analysis was used to assess the relationship between OS and PRRX1 expression, with the results displayed as forest plots using the “forestplot” package v2.0.1 in R. In addition, because cytogenetic studies have found that the loss of chromosome 3 (monosomy 3) and a gain of chromosome 8q are associated with UM metastasis (26) and the status of chromosomes 3 and 8q has been determined in every patient in the TCGA-UVM project (Table S1) (24), Spearman rank correlation analysis (significance level: p <0.05) was performed to assess the correlation between the number of copies of these chromosomes and PRRX1 expression.
Enrichment Analysis of PRRX1 in UM
To determine the biological states and processes that correlate with PRRX1 expression in UM, RNA-seq data from the TCGA-UVM dataset were analyzed by gene set enrichment analysis (GSEA) v4.1.0 software using the Hallmark gene sets (http://www.broadinstitute.org/gsea), with significance set at FDR <0.25 and p <0.05.
Correlation Between PRRX1 and Immunological Characteristics
The level of expression of immune checkpoint genes may correlate with responses to treatment with immune checkpoint inhibitor therapies (27). The immune checkpoint genes expressed in UM include CTLA4, PD1 (PDCD1), PDL1 (CD274), TIGIT, and LAG3 (2, 11, 24). Therefore, the correlation between PRRX1 expression and the expression of these critical immune checkpoint molecules was subsequently explored using the “ggplot2” v3.3.5 and “reshape2” v1.4.4 packages in R. In addition, the correlation between PRRX1 expression and tumor mutation burden (TMB) was analyzed by Spearman’s correlation analysis (significance level: p <0.05). To quantify the composition of TME in UM, the abundance of TME-related cell populations was estimated from gene expression data using the “MCPcounter” package v1.2.0 in R.
Cell Line
The human UM cell line MuM-2B purchased from iCell Bioscience Inc. (iCELL-h148;Shanghai, China) was chosen for its highly aggressive phenotype (28, 29). Cells were cultured in RPMI-1640 medium with 10% FBS and 1% penicillin–streptomycin (Gibco, USA) at 37°C with 5% CO2 condition. Experiments were performed with cells in the logarithmic growth period.
siRNA Knockdown of PRRX1 In Vitro
PRRX1 small interfering (si) RNA (si-PRRX1) and negative control (si-NC) oligonucleotide were purchased from RiboBio (Ribobio, Guangzhou, China) with the sequences GGAATAGGACAACCTTCAA (Si1), ACACTATCCTGATGCTTTT (Si2), and GTTCCGCAGGAATGAGAGA (Si3). Transient transfection with siRNA at a final concentration of 100 nM was performed with Lipofectamine 2000 (Invitrogen, USA) according to manufacturer’s protocol.
Western Blotting
Total protein from cells was harvested using radio immunoprecipitation assay buffer (RIPA; Beyotime, China), and was quantified by BCA Assay (Beyotime, China). In brief, protein samples were separated by SDS–polyacrylamide gel electrophoresis and transferred onto polyvinylidene fluoride (PVDF) membranes, which was then incubated with primary antibodies and HRP-conjugated secondary antibodies (Table S2). Band intensity was quantified by Quantity One software (Bio-Rad) and defined as the ratio of target protein to β-actin. The assay was repeated three times.
Cell Migration and Invasion Assays
The migration of UM cells was evaluated with a wound healing scratch assay. Cells were seeded in 6-well plates (5 × 10⁵/well) until reached full confluence. Cells were serum-starved overnight and an artificial scratch wound was created at the center of the well and photographed, the scratch areas were photographed at 0, 24 and 48 h. Migration index was calculated as the follows: [(original scratch width-scratch width at 24/48 h)/(original scratch width)] × 100%. The assay was repeated three times.
Transwell invasion assays were performed to assess cell invasion. 24-well Millicell hanging cell culture inserts (8.0 µm, Millipore, USA) and Matrigel (BD Biosciences, USA) were used as per manufacturer’s protocol. Approximately 2 × 10⁵ cells in serum-free medium (100 ul, 2 × 10⁶ cells/ml) were added per well to the upper chamber, 500 ul complete medium with 10% FBS in the lower chamber served as a chemoattractant. After 48 h of incubation, cells that had invaded through the matrigel were fixed in 4% paraformaldehyde and stained with 0.1% crystal violet for counting. Three separate fields were counted for each filter with microscope (UOP-DSZ2000X; Chongqing, China). The assay was also repeated three times.
Results
Process of Analyzing Patients and Datasets
A brief flowchart of our study is shown in Figure 1. Clinical data and transcriptome expression profiles of 80 patients were downloaded from the TCGA-UVM cohort. Similarly, information about the 63 patients in the validation cohort (GEO-GSE22138) was obtained from the GEO database. The clinical characteristics of these 143 patients are displayed in Table 1.
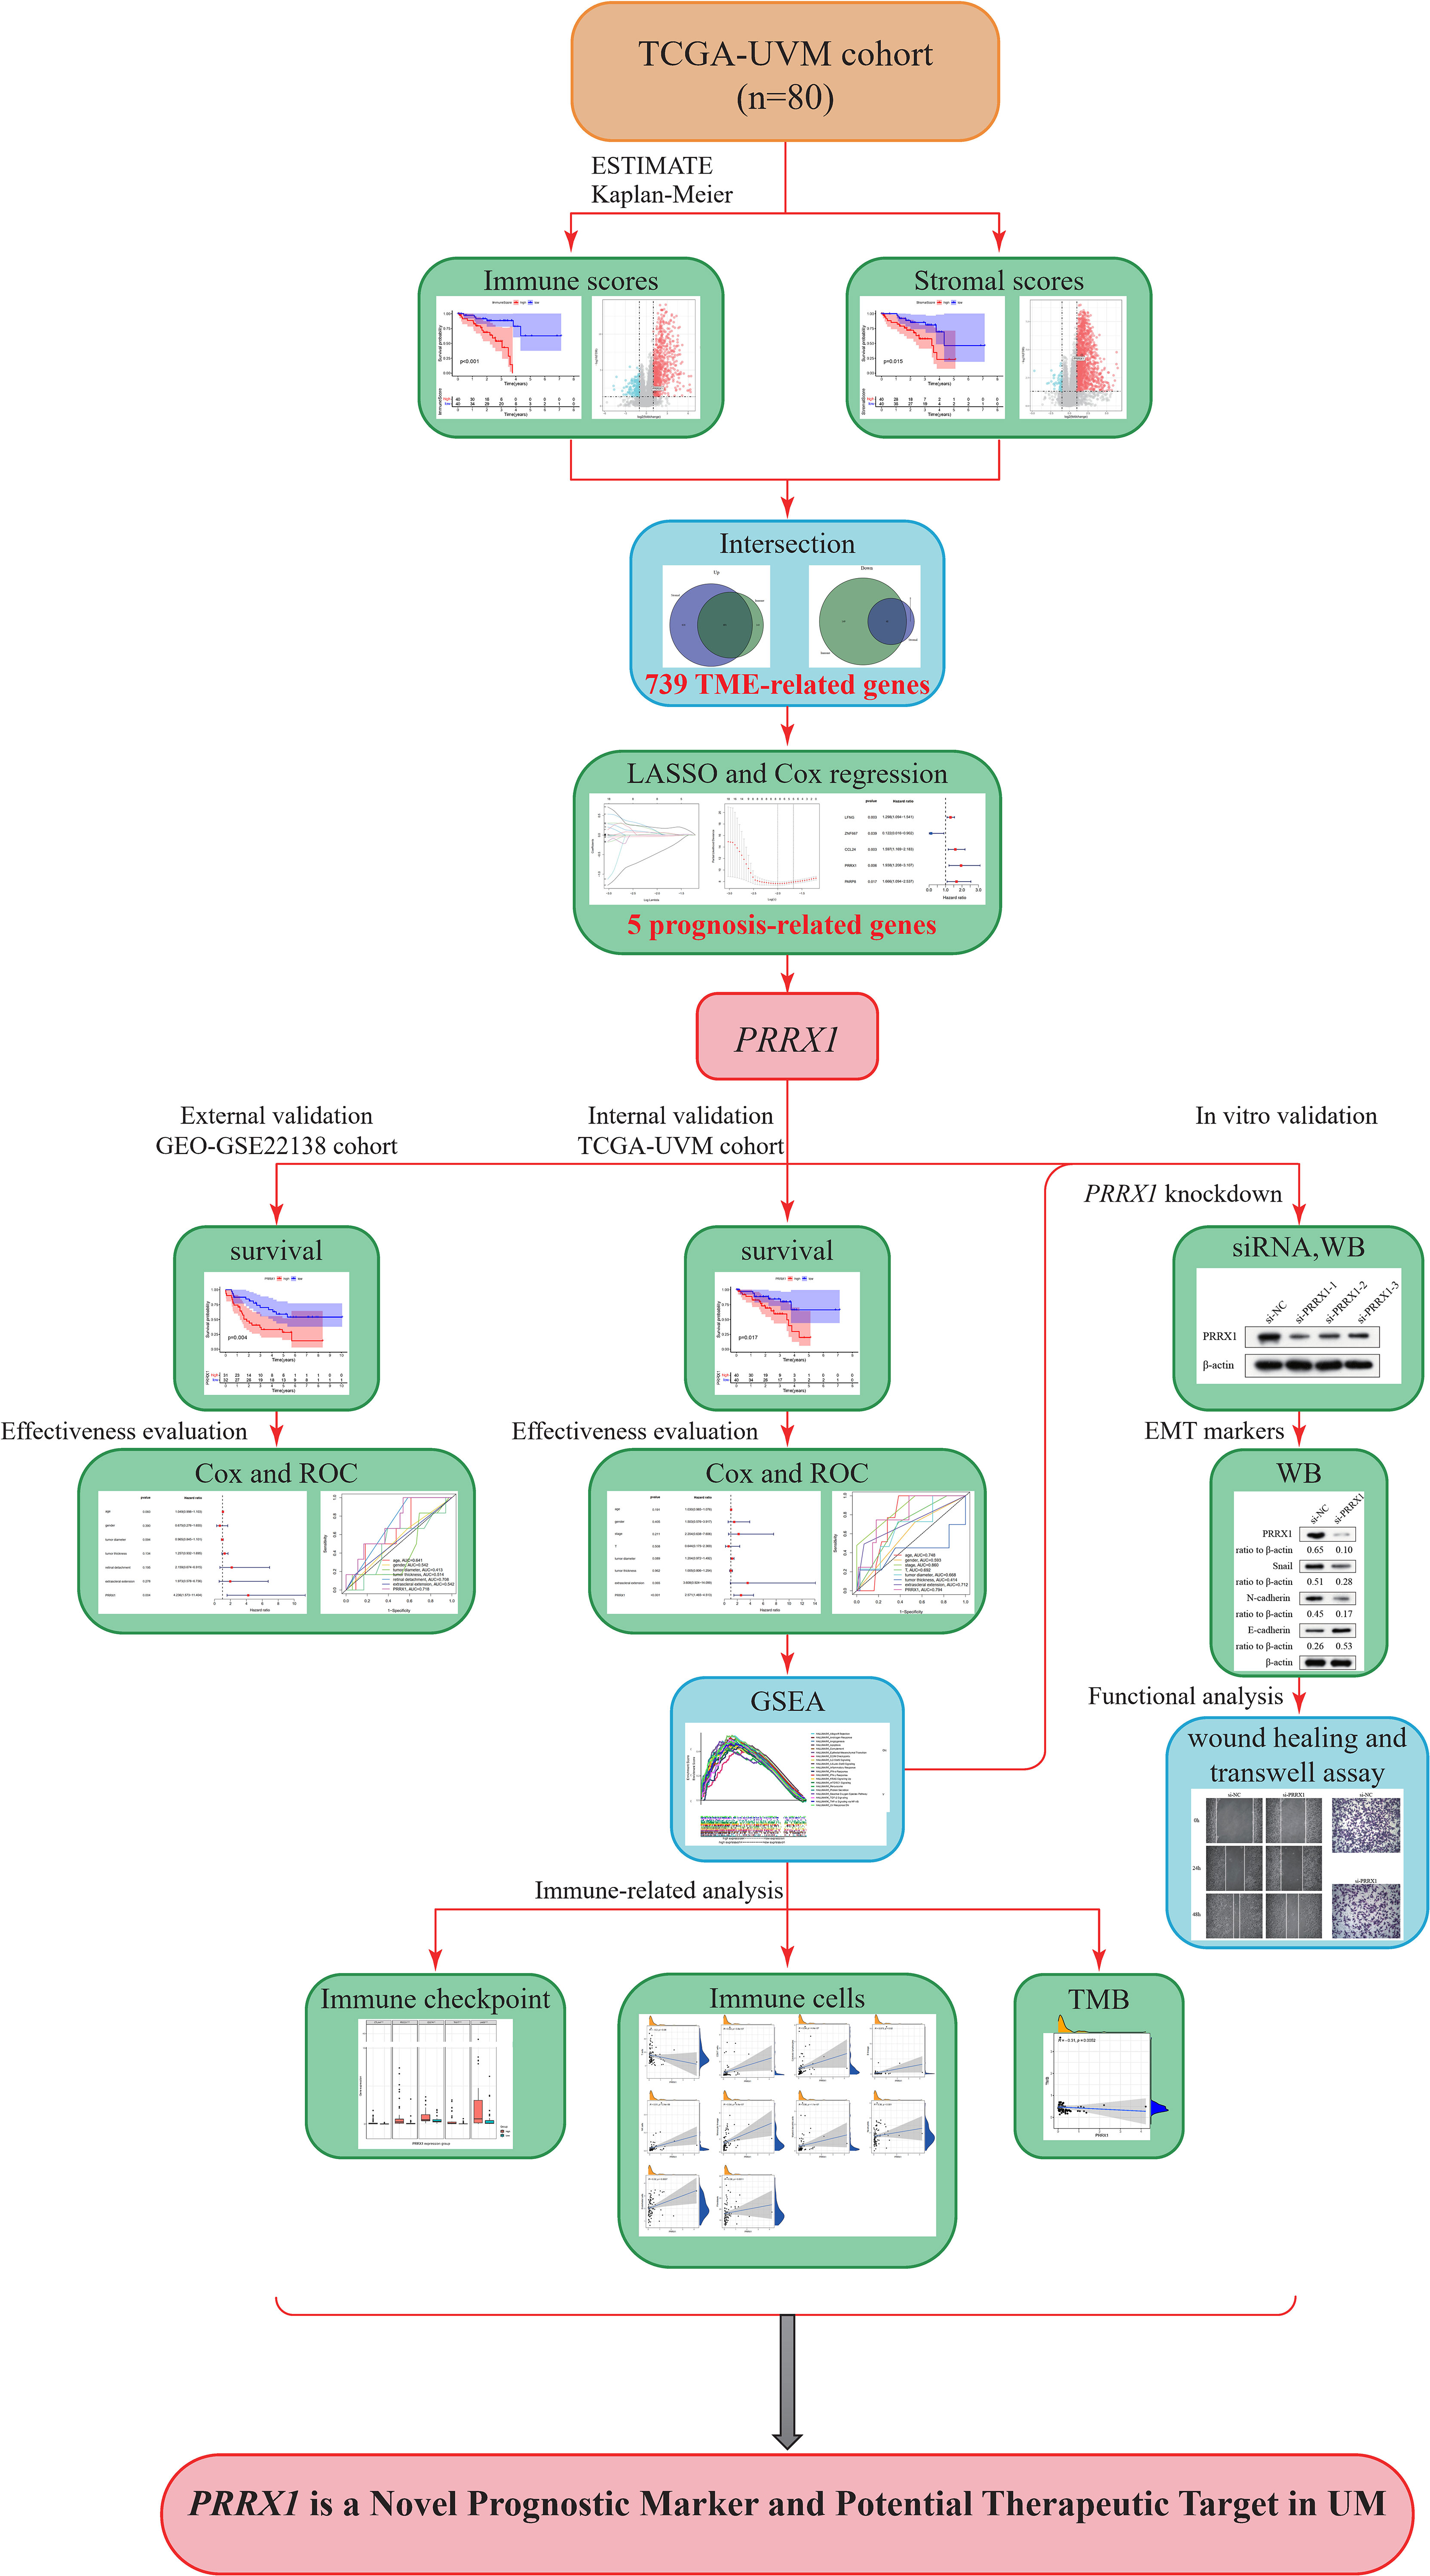
Figure 1 Study flow diagram. UVM/UM, uveal melanoma; TCGA, The Cancer Genome Atlas; TME, tumor microenvironment; LASSO, least absolute shrinkage and selection operator; PRRX1, paired related homoeobox 1; ROC, receiver operating characteristic; WB, Western blot; siRNA, small interfering RNA; GSEA, Gene Set Enrichment Analysis; GEO, Gene Expression Omnibus; TMB, tumor mutation burden.
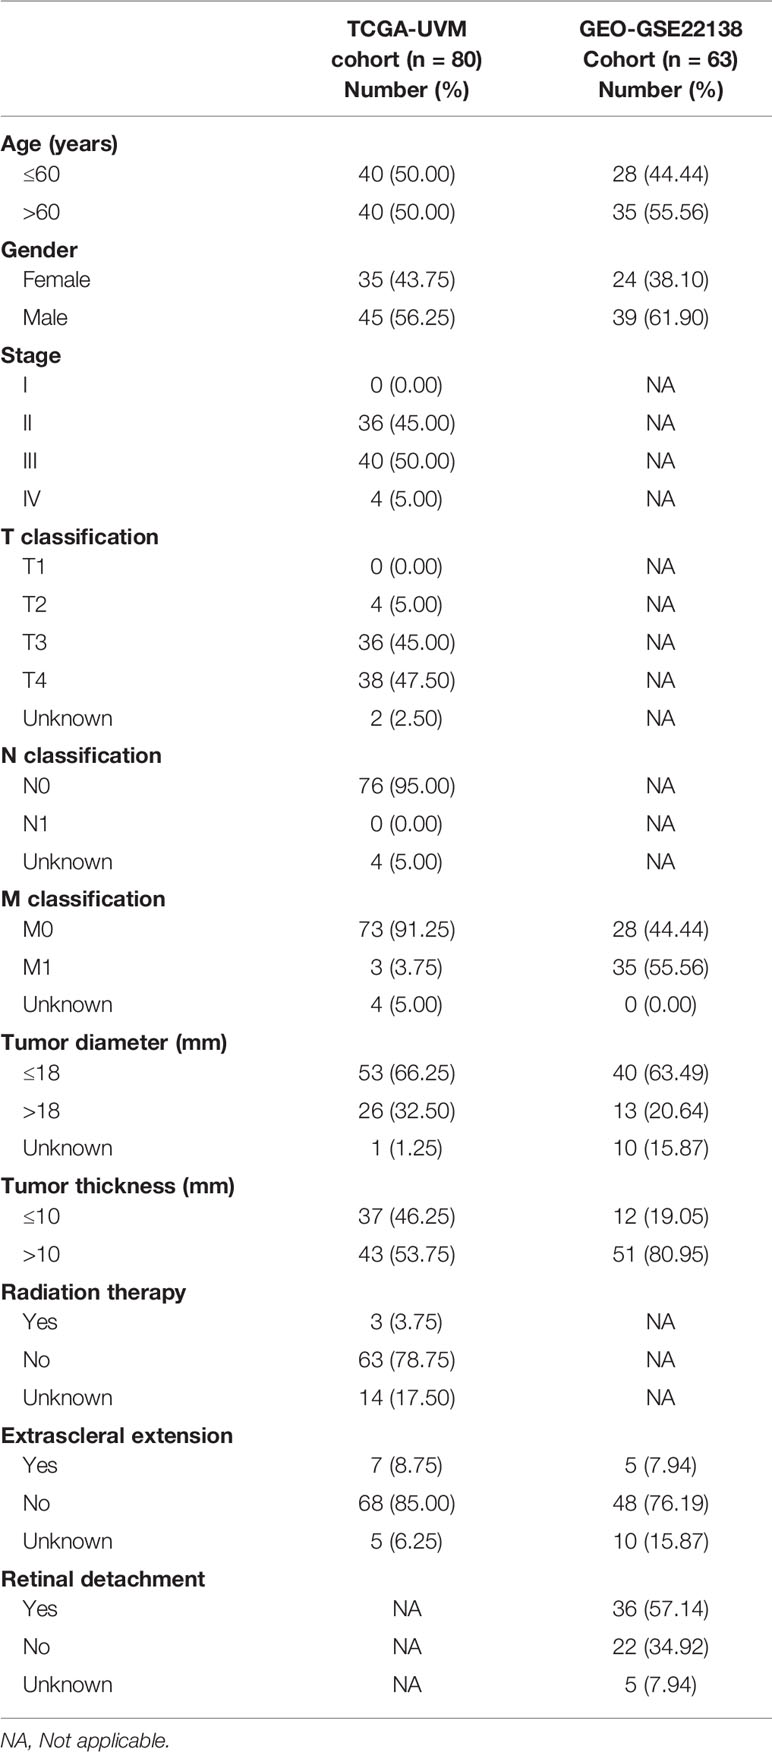
Table 1 Baseline characteristics of UM patients included in this study.
TME- and Prognosis-Related Hub Genes
After assessment using an algorithm, the immune scores, stromal scores, and ESTIMATE scores for 80 samples in the TCGA-UVM cohort were calculated. For each scoring system, 40 samples each were classified into the high and low score groups based on the median scores, and OS was compared in each pair of samples. OS was found to be significantly lower in patients with higher immune scores (p <0.001, log-rank test; Figure 2A), stromal score (p = 0.015, log-rank test; Figure 2B) and ESTIMATE scores (p = 0.001, log-rank test; Figure 2C), indicating that immune and stromal components in the TME are associated with poor prognosis in patients with UM.
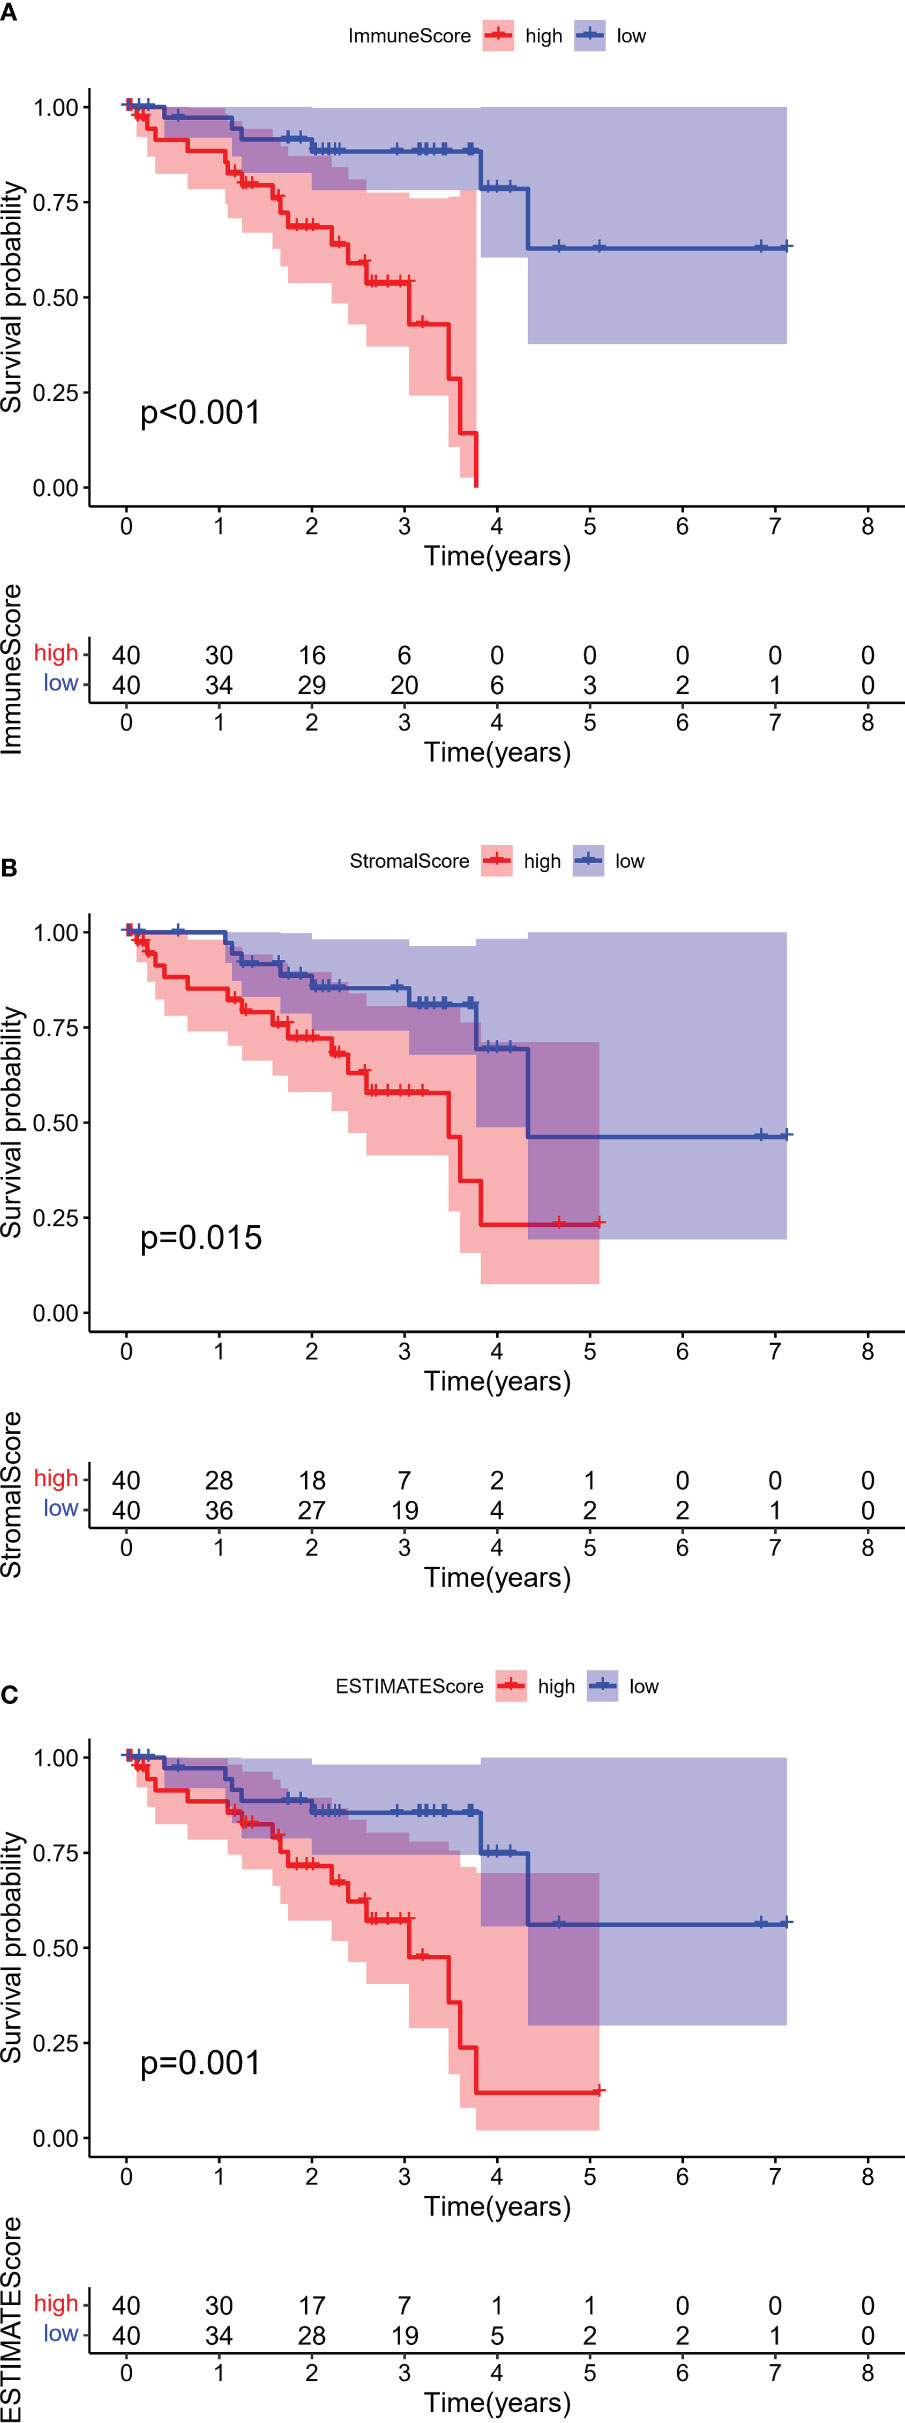
Figure 2 Kaplan–Meier survival analyses of overall survival in UM with high (red line) and low (blue line). (A) Immune scores, (B) Stromal scores, and (C) ESTIMATE scores. The numbers shown below the survival curves are the number of patients at risk at the specified year. The shaded red or blue represent 95% confidence intervals.
To identify genes that might be responsible for these differences in OS, gene expression data were analyzed in 80 patients from the TCGA-UVM dataset. These analyses identified 1,031 DEGs (834 upregulated and 197 downregulated) between the high and low immune score groups (Figure 3A) and 1,367 DEGs (1,311 upregulated and 56 downregulated) between the high and low stromal score groups (Figure 3B). Comparison of these DEGs found that 739 overlapped, comprised of 48 co-down regulated genes and 691 co-upregulated genes (Figure 3C). These findings suggested that these 739 genes were likely to be key factors that affect both the prognosis and TME of UM. Furthermore, GO enrichment analysis of these 739 genes found that several GO terms were enriched in immune activity. The ten most significant terms in biological processes (BP), molecular functions (MF), and cellular components (CC) are shown in Figure 3D. KEGG analysis also showed that these DEGs mainly involved immune-related pathways (Figure 3E), further indicating that the immune composition within the TME is significantly prognostic of survival in patients with UM.
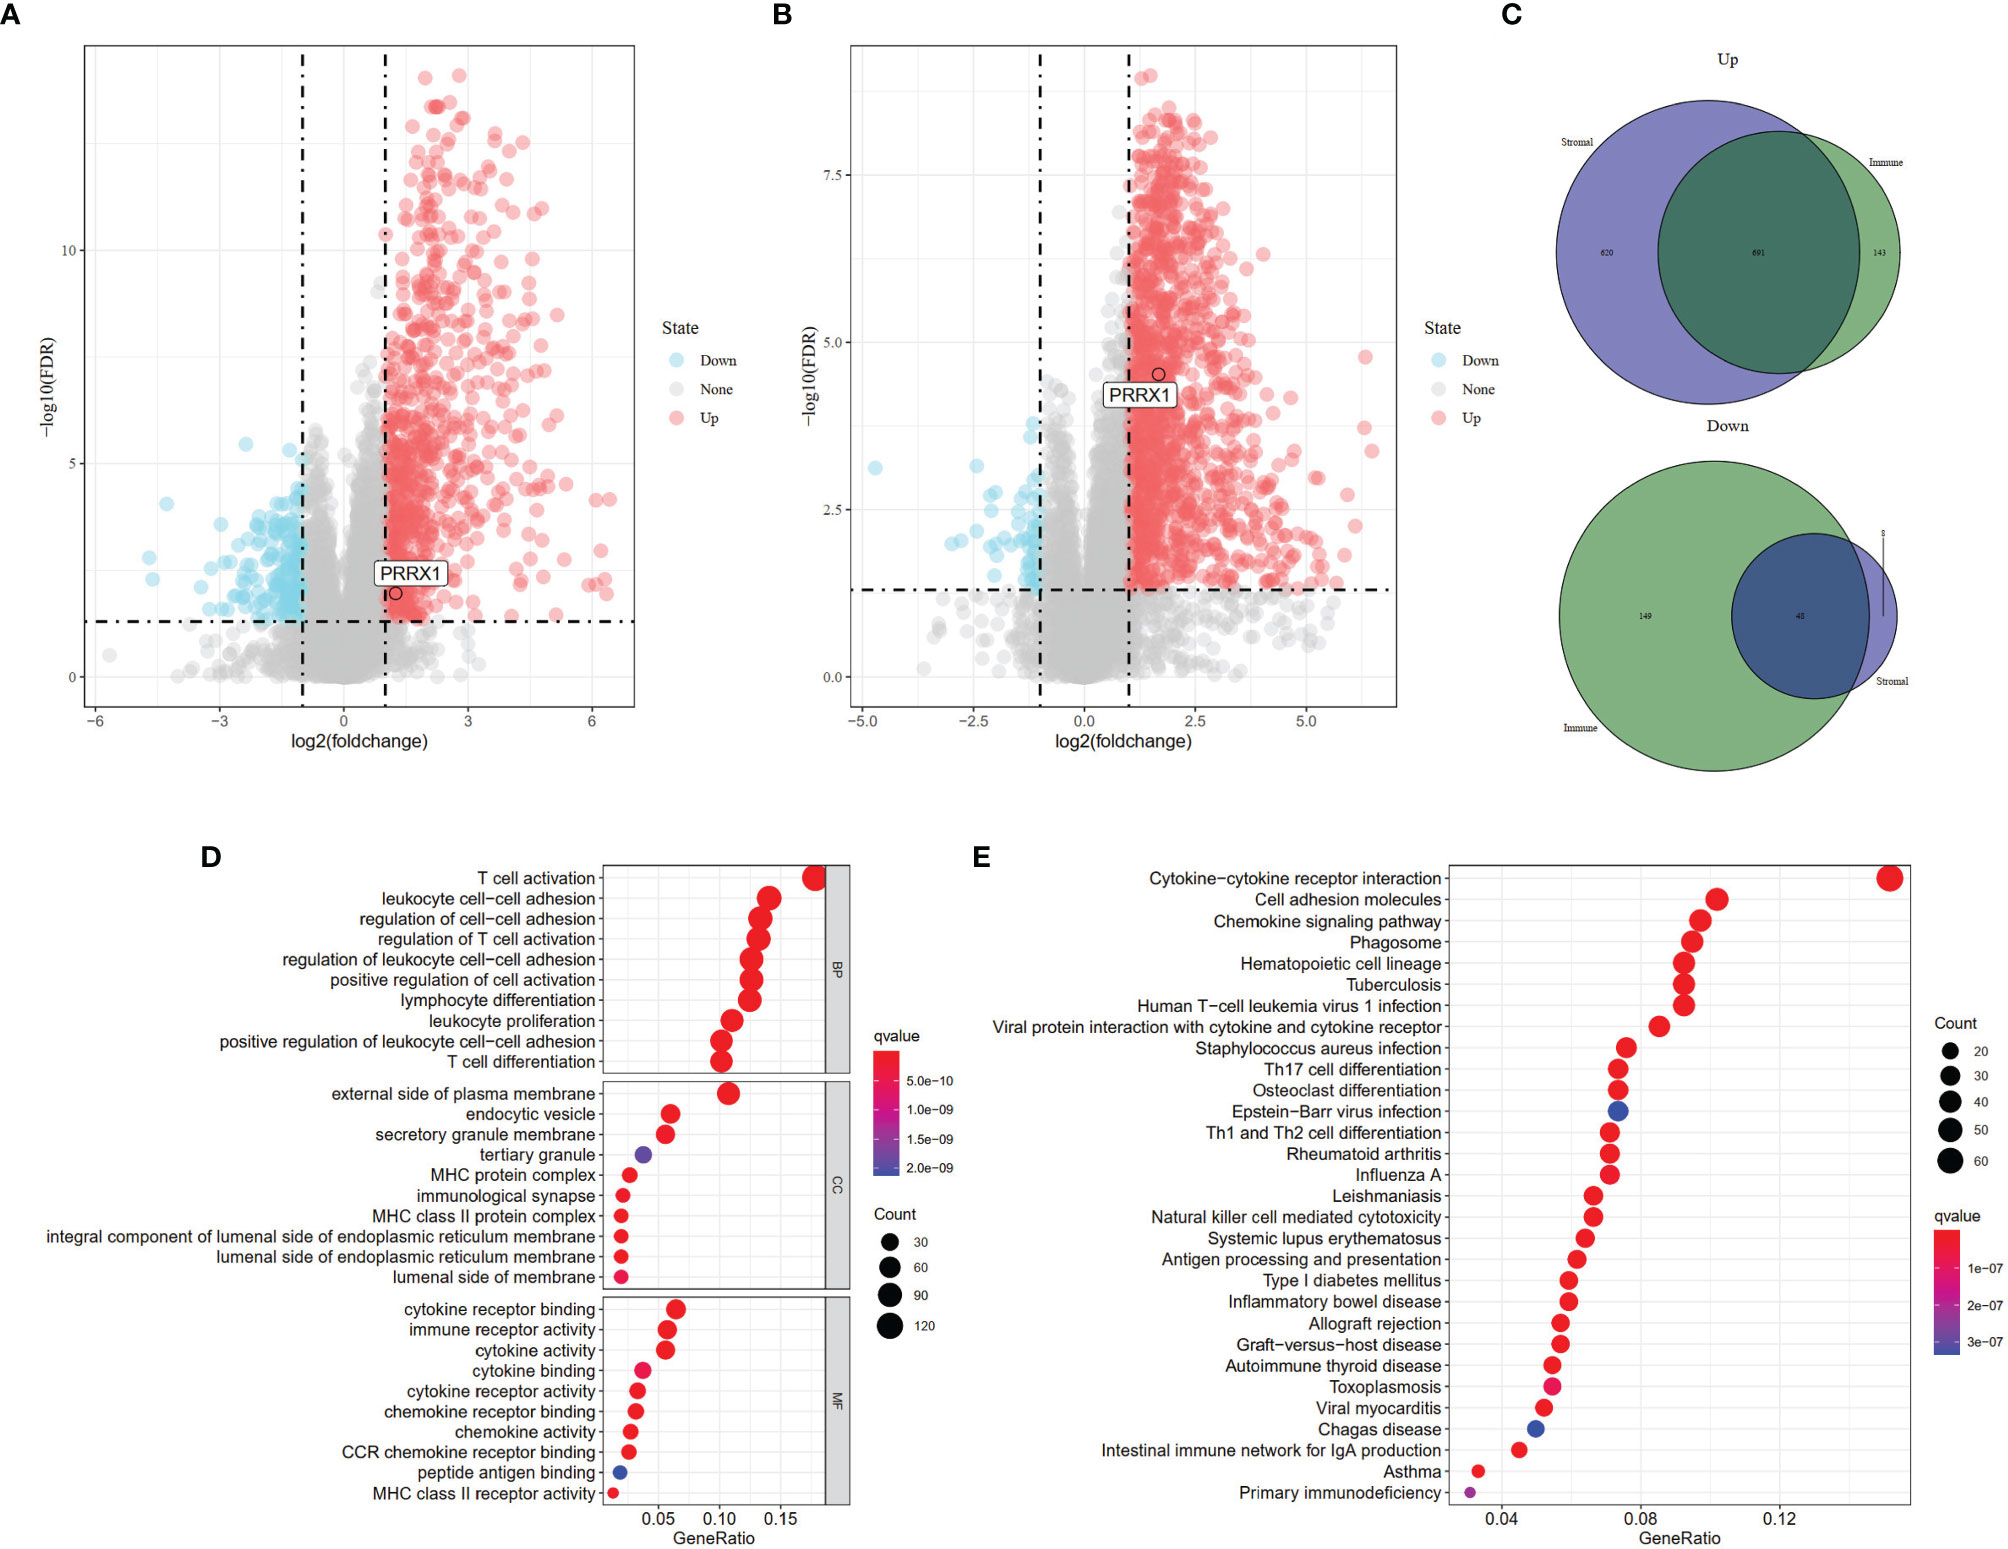
Figure 3 Identification of DEGs based on different scoring systems and related functional annotations. Analysis of DEGs based on (A) Immune scores (FDR <0.05, |log2(fold change)| >1 and (B) Stromal scores (FDR <0.05, |log2(fold change)| >1). Red or blue dots represent genes that were significantly upregulated or downregulated in each comparison (high vs. low). (C) Identification of the 739 overlapping genes commonly upregulated or downregulated in the two scoring systems. (D) GO enrichment analysis (p <0.05, q <0.05) and (E) KEGG pathway enrichment analysis (p <0.05, q <0.05) of the 739 overlapping genes. Dots size represented the number of enriched genes, the color represented q-value; the redder the color, the smaller the q-value.
Univariate Cox regression analysis showed 450 genes potentially prognostic of survival in patients with UM (Table S3). These genes were input into the LASSO Cox regression model (Figure 4A), with optimal performance attained by a combination of eight genes (CTF1, LFNG, ZNF667, ARC, CCL24, PRRX1, PARP8, and ISG20) (Figure 4B). Multivariate Cox analysis further showed that five of these genes (LFNG, ZNF667, CCL24, PRRX1, and PARP8) were independently prognostic of survival in patients with UM (Figure 4C). Previous studies have demonstrated that PRRX1, serve as a EMT-TF, is involved in the EMT process and tumor progression in several cancers (30–32), however, the role of PRRX1 in UM was not reported. We therefore chose to focus our analysis on PRRX1.
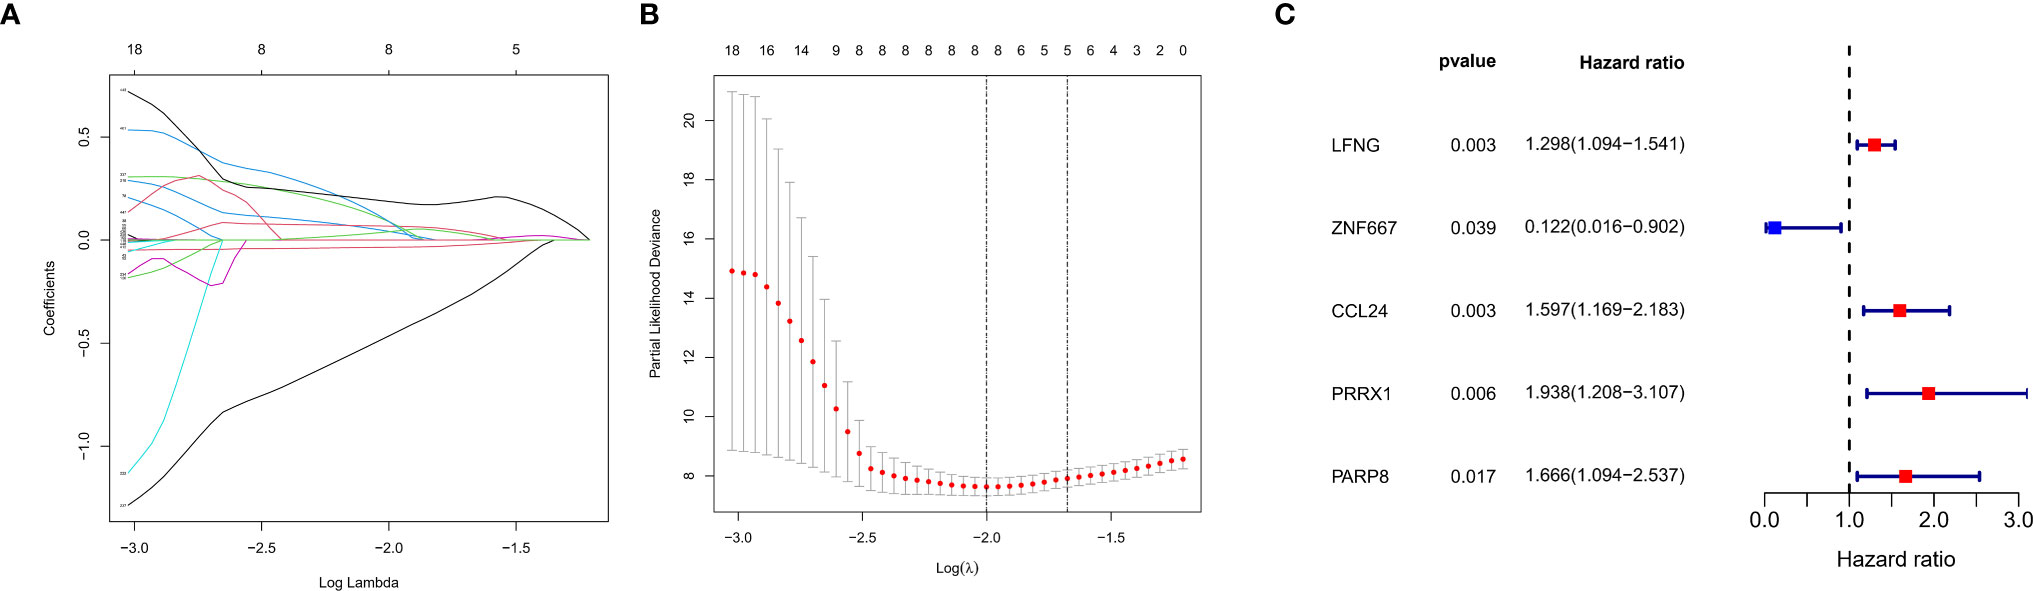
Figure 4 Construction of a prognostic gene signature using a LASSO–Cox regression model. (A) Trend graph of LASSO coefficients for 450 genes from univariate Cox regression analysis. the abscissa represents the log value of the optimal parameter (lambda), the ordinate represents the coefficient of the variable. (B) Attainment of lambda by a minimum combination of eight genes. Dotted vertical lines were drawn at the optimal values by using the minimum criteria and the 1 standard error (SE) of the minimum criteria (the 1−SE criteria). (C) Multivariate Cox analysis of previously screened genes, red dots represent the possible risk factors while blue represents potential protective factors.
Association Between PRRX1 Expression and Unfavorable Prognosis in Patients With UM
Based on median PRRX1 expression as the cut-off value, OS was found to be poorer in patients with high than low PRRX1 expression (Figure 5A). The negative prognostic impact of higher PRRX1 expression was validated in an independent GEO cohort, with MFS being significantly poorer with high than low PRRX1 expression (Figure 5B). The distribution of PRRX1 expression profiles is shown in Figures 5C, D. Figures 5E, F show the variations in patient survival and metastasis as a function of PRRX1 expression. The percentages of deceased patients (Figure 5E) and patients with metastasis (Figure 5F) were greater and the survival time shorter in the high than in the low PRRX1 expression group.
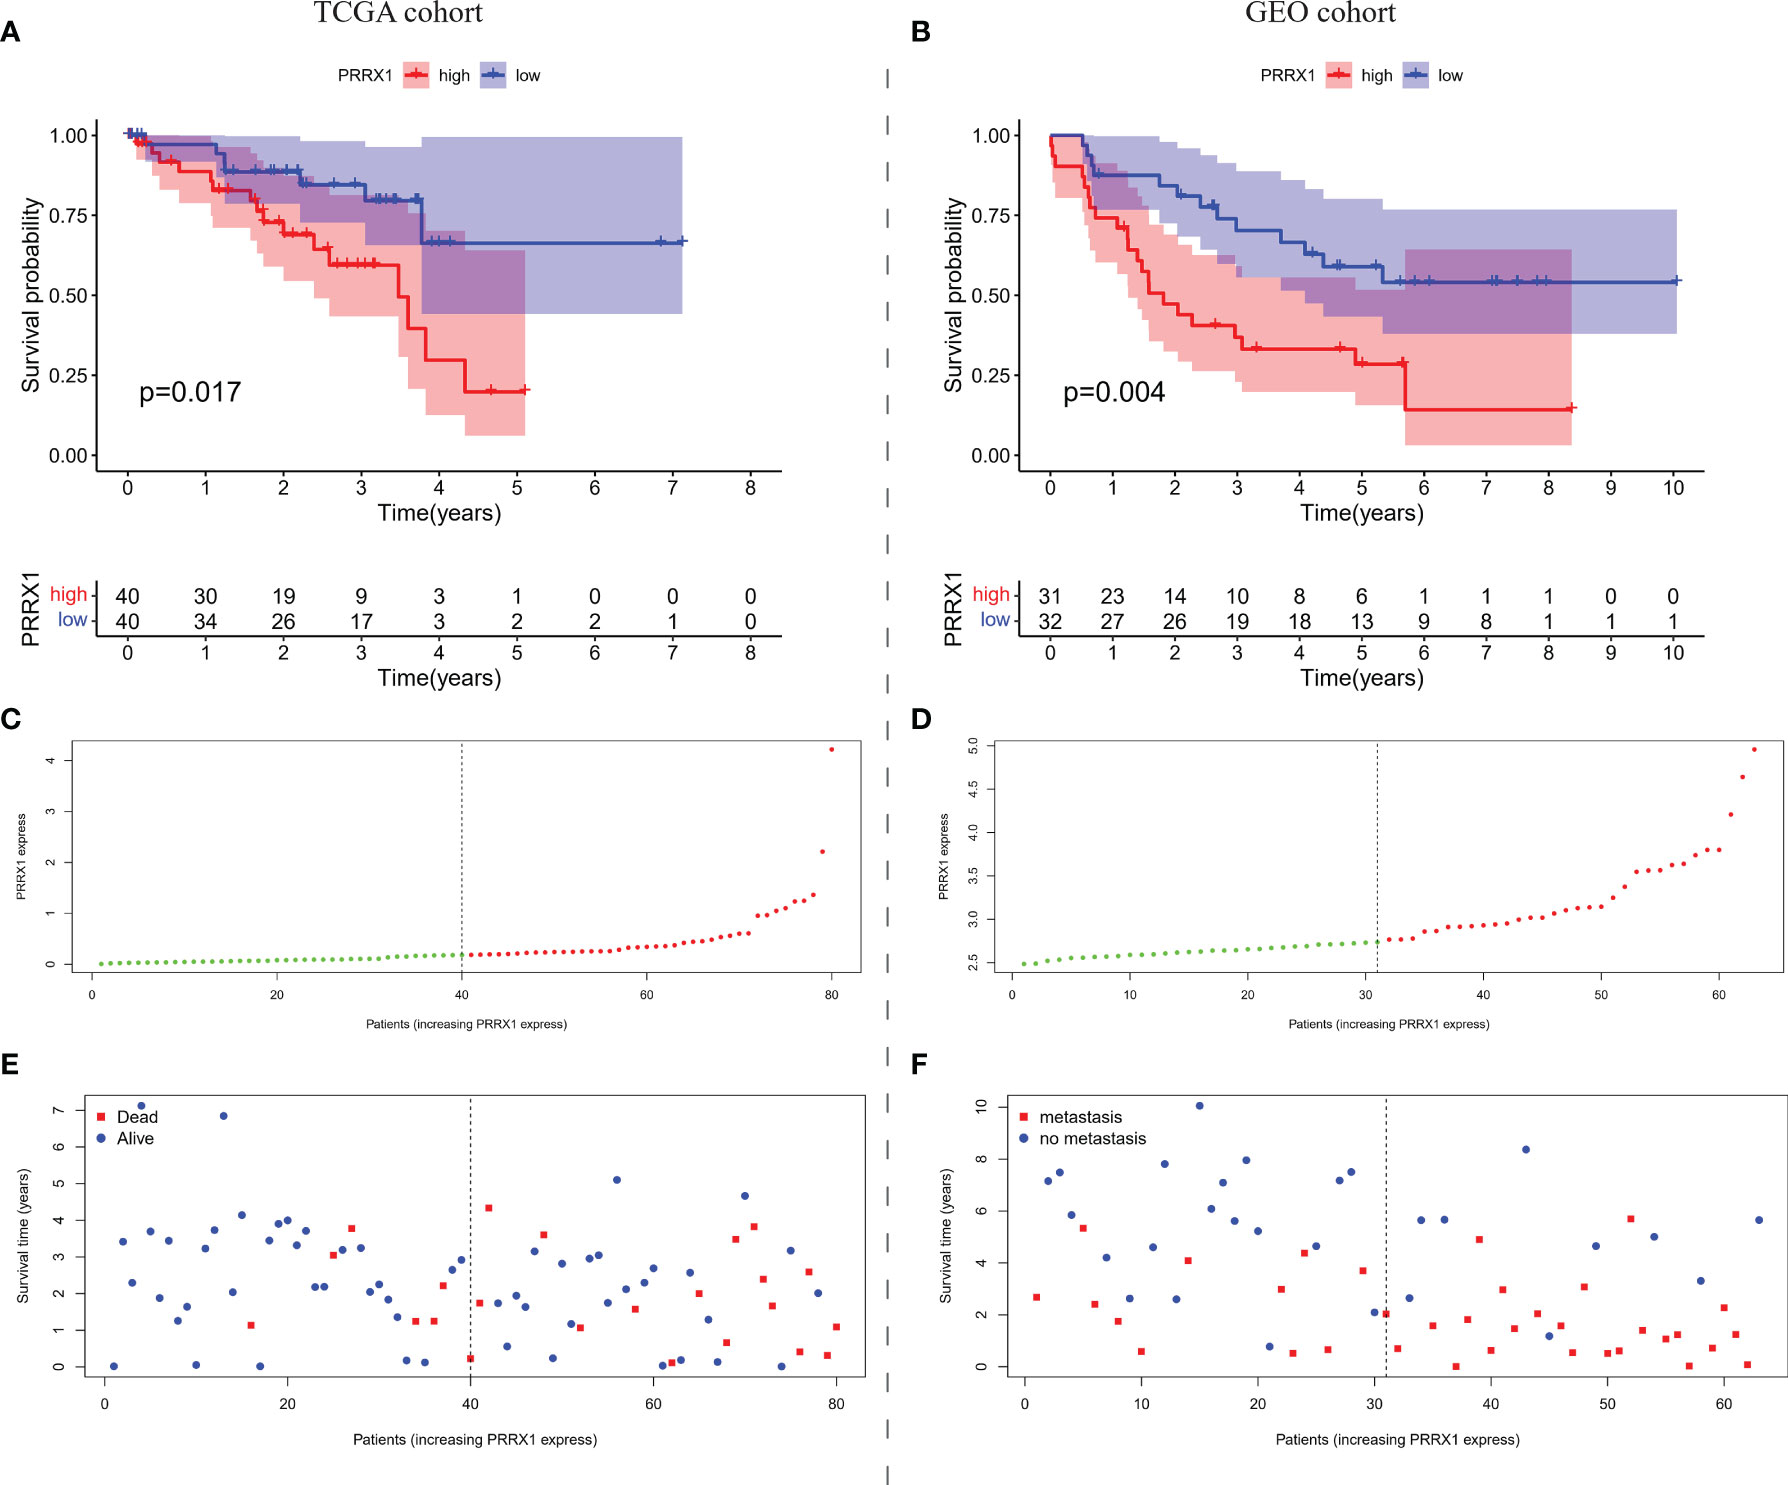
Figure 5 The overall prognostic performance of PRRX1 expression in two UM cohorts. Kaplan–Meier analyses of (A) OS in TCGA cohort and (B) MFS in the GEO cohort, the numbers shown below the survival curves are the number of patients at risk at the specified year. Distribution of PRRX1 expression levels in the (C) TCGA and (D) GEO cohorts, the dotted line represented the median PRRX1 expression and divided the patients into low-expression (green dots) and high-expression groups (red dots). Percentages of (E) deceased patients (red dots) in the TCGA cohort and (F) patients with metastasis (red dots) in the GEO cohort as a function of PRRX1 expression level.
To evaluate the prognostic predictive power of PRRX1 expression, univariate and multivariate Cox analyses were performed to assess the ability of PRRX1 expression to predict OS in the TCGA-UVM cohort and to predict MFS in the GEO-GSE22138 cohort. Both univariate (hazard ratio [HR]: 2.324, 95% confidence interval [CI]: 1.514–3.566, p <0.001) and multivariate (HR: 2.571 95% CI: 1.465–4.513, p <0.001) analyses of 75 patients in the TCGA-UVM cohort with complete information on age, gender, stage, T classification, tumor diameter, tumor thickness, and extra scleral extension showed that high PRRX1 expression was a powerful and independent prognostic predictor of reduced OS (Figure 6A). The areas under the time-dependent ROC curves for 1-, 2-, and 3-year OS were 0.830, 0.738, and 0.870, respectively (Figure 6B). The area under the ROC curve (AUC) of PRRX1 expression for predicting OS was 0.794 (Figure 6C), which was less than that for the stage but ranked second among evaluation metrics. Similarly, both univariate and multivariate analyses of the 42 patients in the GEO cohort with complete information, including, age, gender, tumor diameter, tumor thickness, retinal detachment, and extra scleral extension, showed that high expression of PRRX1 was significantly predictive of reduced MFS (Figure 6D). The AUCs of the time-dependent ROC curves for 1-, 2-, and 3-year MFS were 0.677, 0.748, and 0.696, respectively (Figure 6E), and the AUC of PRRX1 expression for predicting MFS was 0.718 (Figure 6F), greater than that for all other factors. These results indicate that PRRX1 expression was an independent prognostic factor that could effectively predict the prognosis of UM patients.
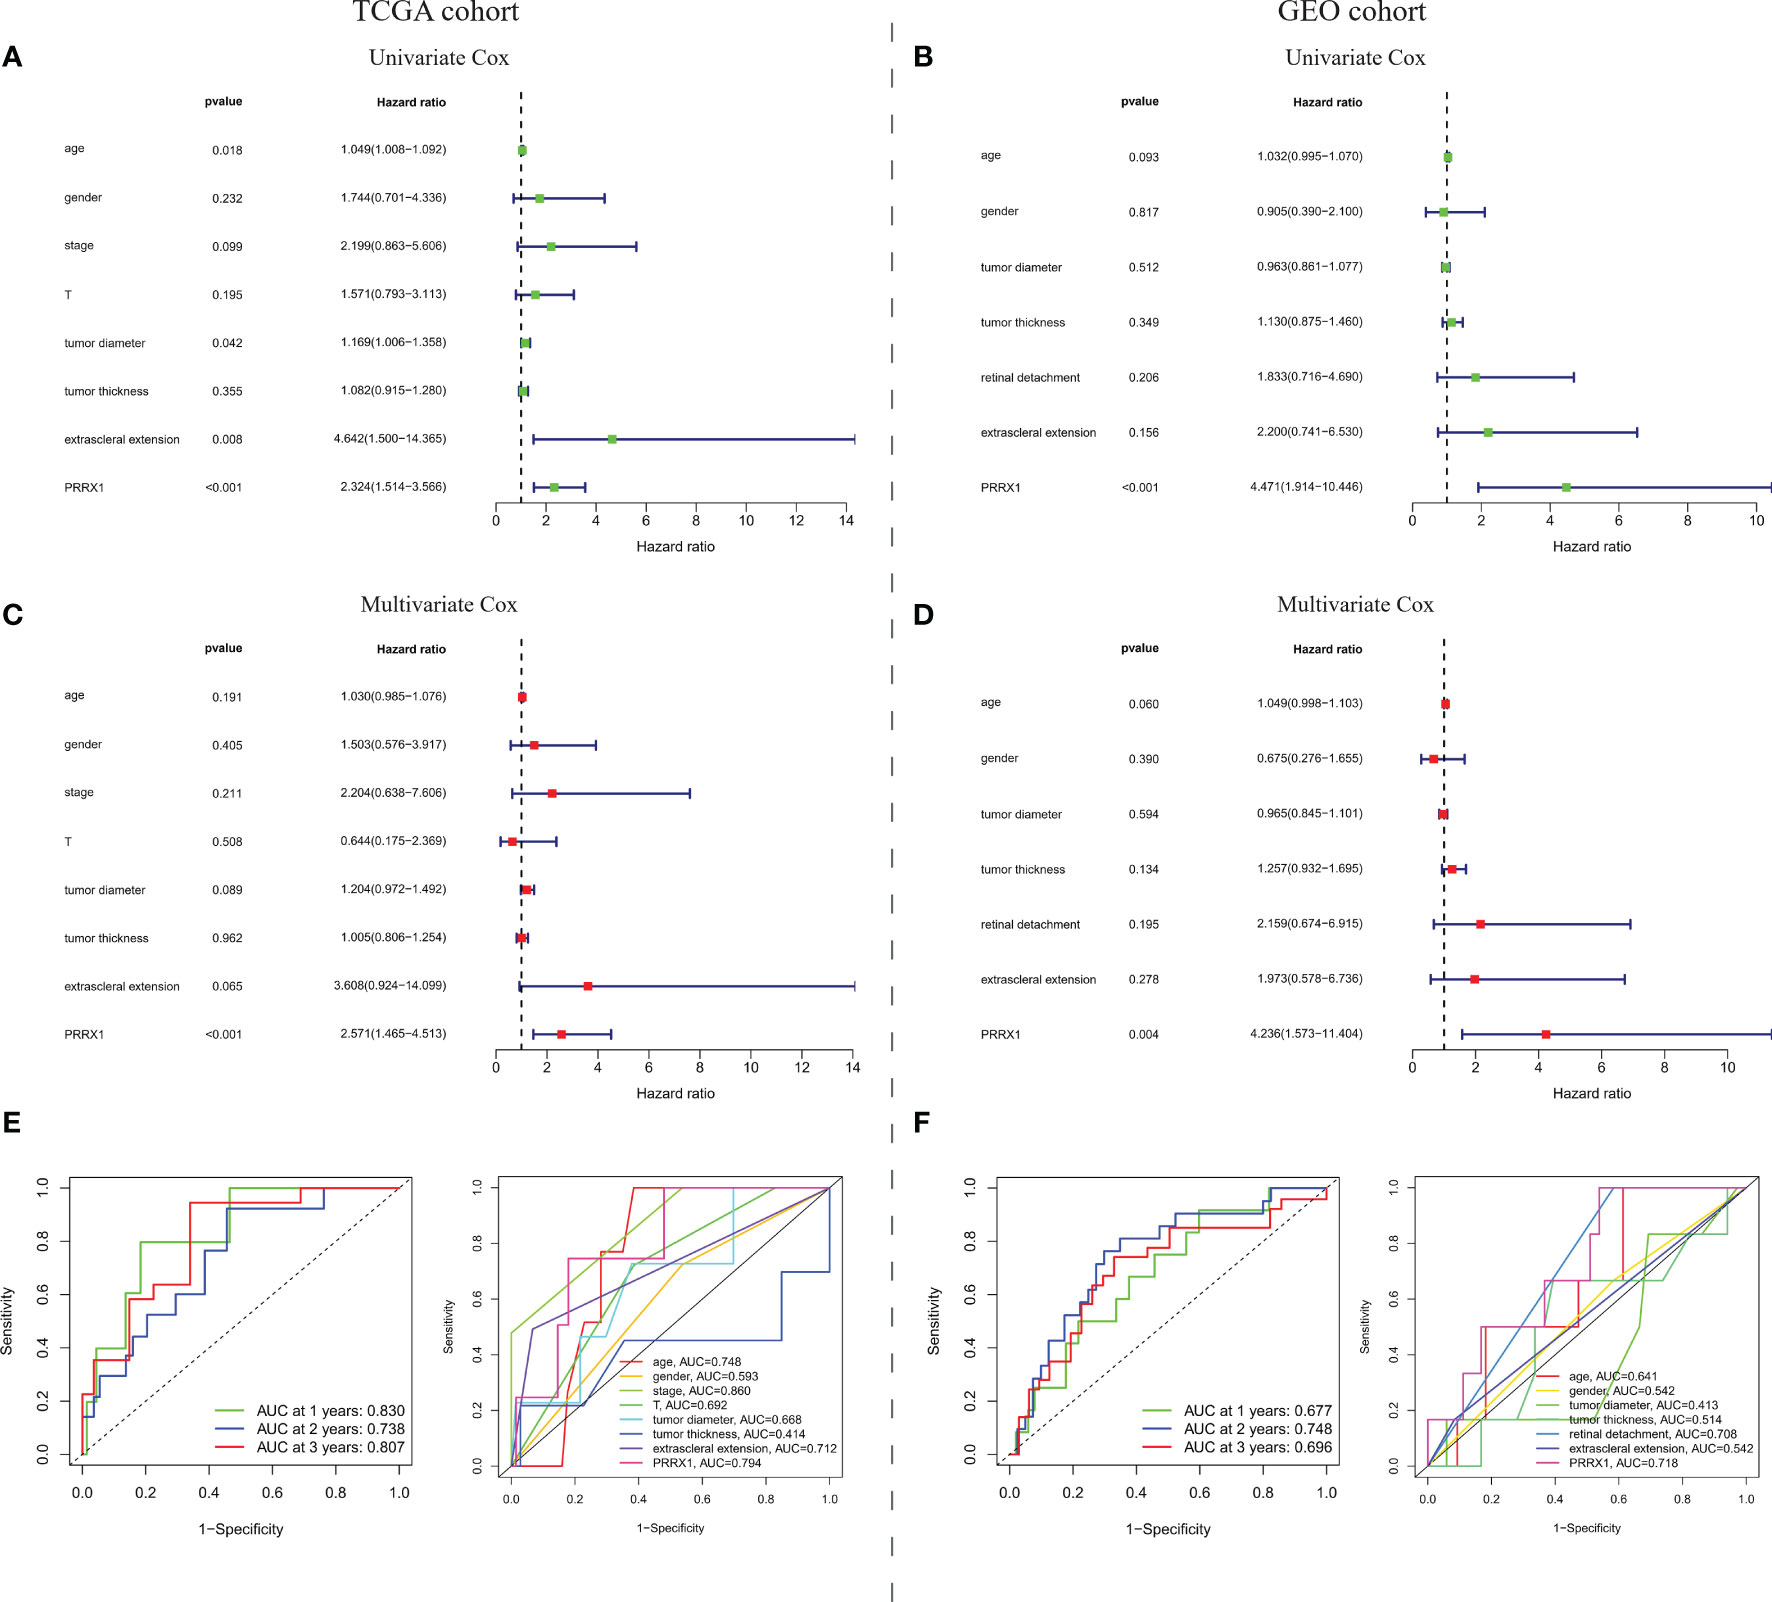
Figure 6 Prognostic predictive ability of PRRX1 expression. (A) Univariate and multivariate Cox analyses of PRRX1 expression and seven other clinicopathological parameters in the TCGA cohort. (B) Time-dependent ROC analysis for prediction of OS in the TCGA cohort. (C) ROC analyses of PRRX1 expression and other seven clinicopathological parameters for predicting OS in the TCGA cohort. (D) Univariate and multivariate Cox analyses of PRRX1 expression and six other clinicopathological parameters in the GEO cohort. (E) Time-dependent ROC analysis for prediction of MFS in the GEO cohort. (F) ROC analyses of PRRX1 expression and other six clinicopathological parameters for predicting MFS in the GEO cohort. Corresponding AUC of each curve is displayed in the lower right corner of each figure, the higher the AUC value, the better the predictive power of the parameter.
Univariable Cox regression analysis was performed to assess the association of PRRX1 expression levels with OS in patients with various types of cancer in 33 TCGA cohorts. These pan-cancer survival analyses indicated that PRRX1 expression was an adverse prognostic factor in patients with seven types of cancer (Figure 7A): adrenocortical carcinoma (ACC), kidney renal clear cell carcinoma (KIRC), kidney renal papillary cell carcinoma (KIRP), lung adenocarcinoma (LUAD), stomach adenocarcinoma (STAD), thyroid carcinoma (THCA), and uveal melanoma (UVM). Assessment of the correlation between PRRX1 expression and chromosome copy number using Spearman correlation analysis showed that PRRX1 expression correlated negatively with chromosome 3 copy number but positively with chromosome 8q copy number (Figure 7B).
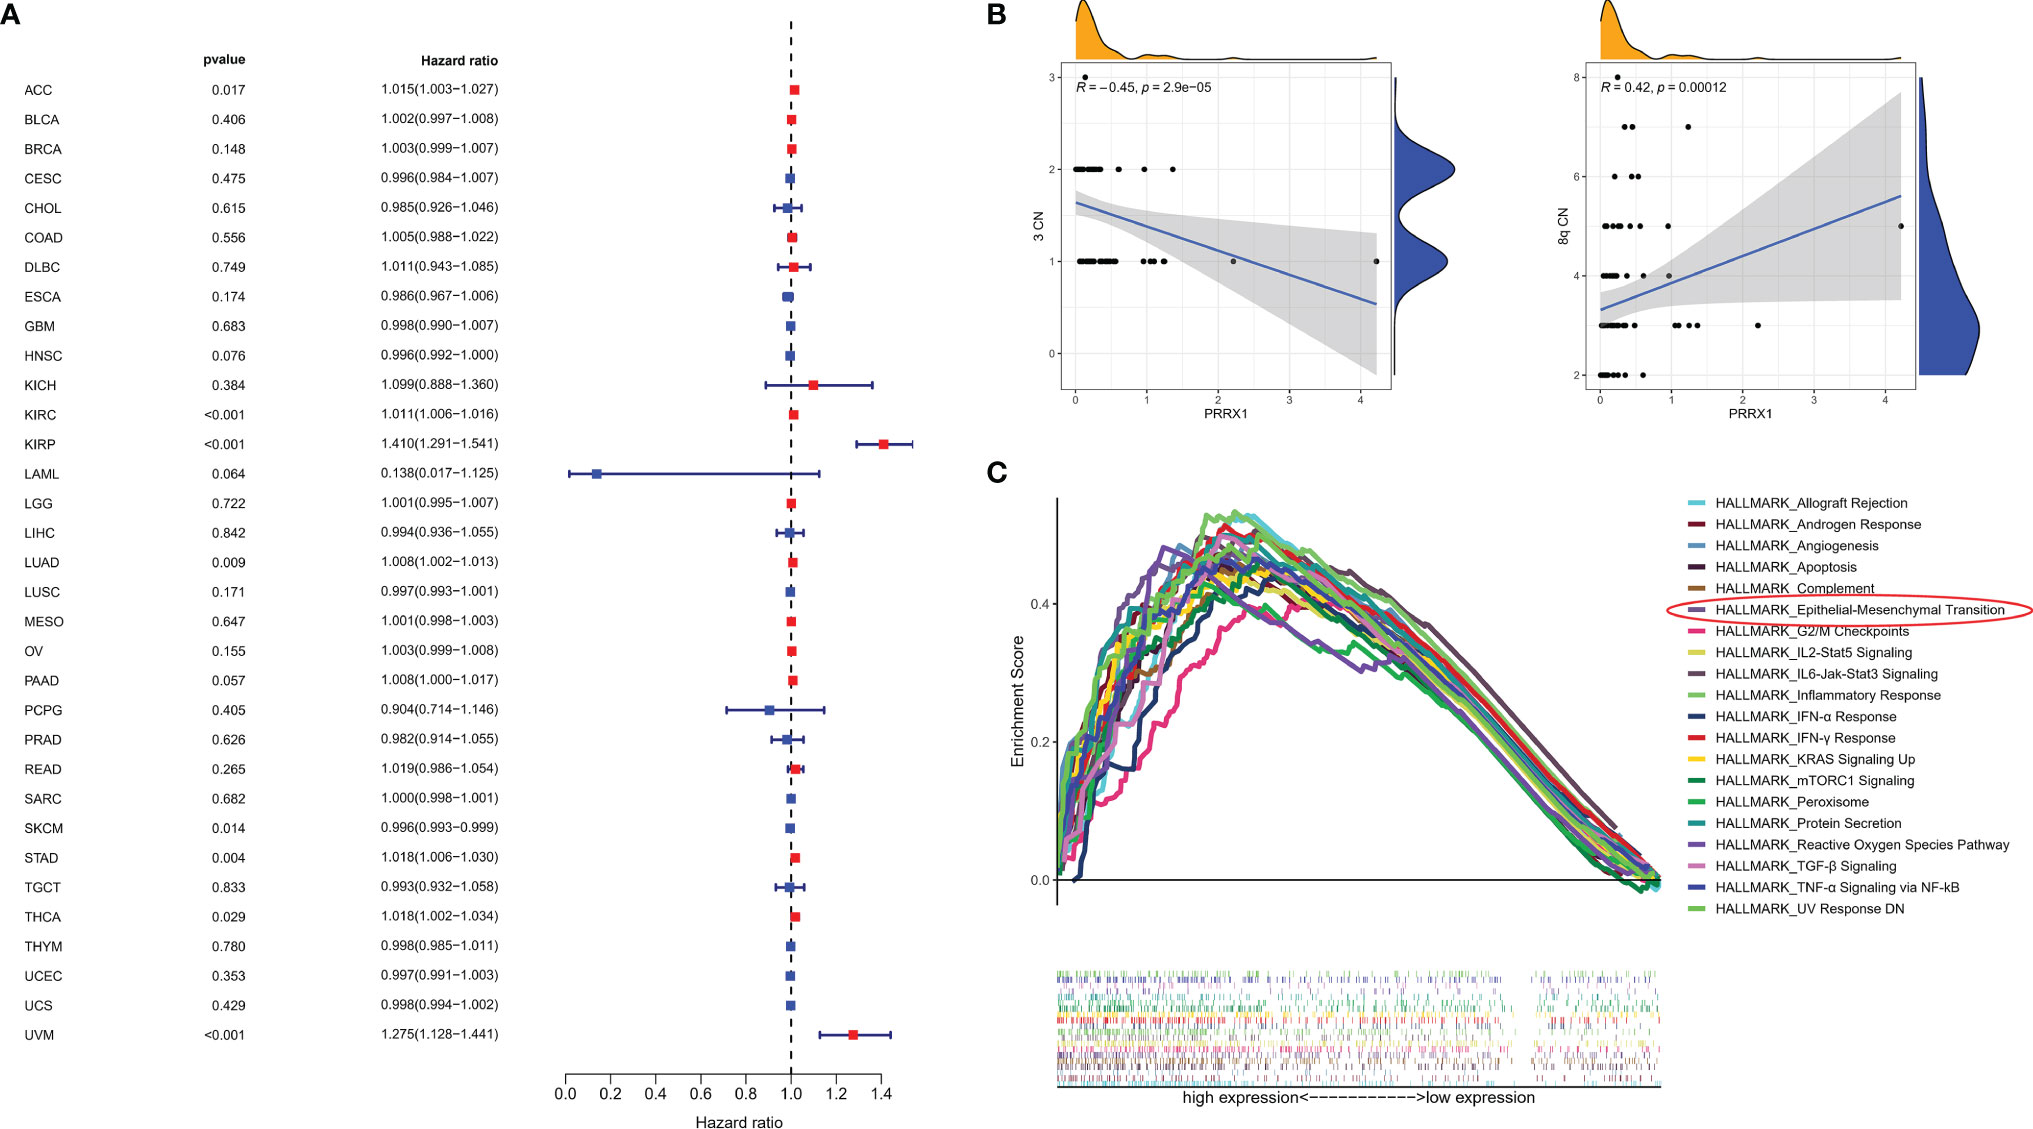
Figure 7 (A) Association between PRRX1 expression level and OS in patients with 33 types of cancer from the TCGA database, red dots represent the possible risk factors while blue represents potential protective factors, abbreviations for all cancer types are in Table S4. (B) Correlations between PRRX1 expression and chromosome 3/8q copy number, the density curve on the x and y-axes represents the distribution trend of themselves. The blue line indicates the best fitted linear models and the shaded area indicates the 95% confidence interval. (C) GSEA plot of the top 20 ranked Hallmark sets of genes associated with high PRRX1 expression, as determined by comparing high and low PRRX1 expression groups (FDR < 0.25, p < 0.05).
GSEA of PRRX1 in the TCGA-UVM Dataset
GSEA revealed that 26 Hallmark pathways were significantly enriched in patients with high PRRX1 expression (Table S5). The top 20 ranked Hallmark pathways included the angiogenesis (p = 0.010, FDR = 0.005), epithelial–mesenchymal transition (p <0.001, FDR = 0.002), and TGF-β signaling (p <0.001, FDR = 0.002) pathways, and also various immune- and inflammation-related sets of genes, namely, inflammatory response, IFN-γ response, IL6-Jak-Stat3 signaling, IL2-Stat5 signaling, TNF-α signaling via NF-kB, and IFN-α response (Figure 7C). These results provide evidence for the possible phenotypes that may involve PRRX1 expression.
Immunological Characteristics of Different PRRX1 Subgroups
The differences in expression of five immune checkpoint genes in the high and low PRRX1 groups are shown in Figure 8A. The expression levels of all five genes in the high PRRX1 expression group were significantly higher than that of the low expression group. TMB was found to decrease with increasing PRRX1 expression (R = −0.31, p = 0.0052) (Figure 8B). Subsequent evaluation of the association between PRRX1 expression and 10 TME-related cell populations from TCGA transcriptomic data using the Microenvironment Cell Populations-counter (MCPcounter) method (33, 34) showed that PRRX1 expression was positively associated with eight types of cells: CD8 T cells, cytotoxic lymphocytes, NK cells, cells of the monocytic lineage, myeloid dendritic cells, neutrophils, endothelial cells, and fibroblasts (Figure 8C).
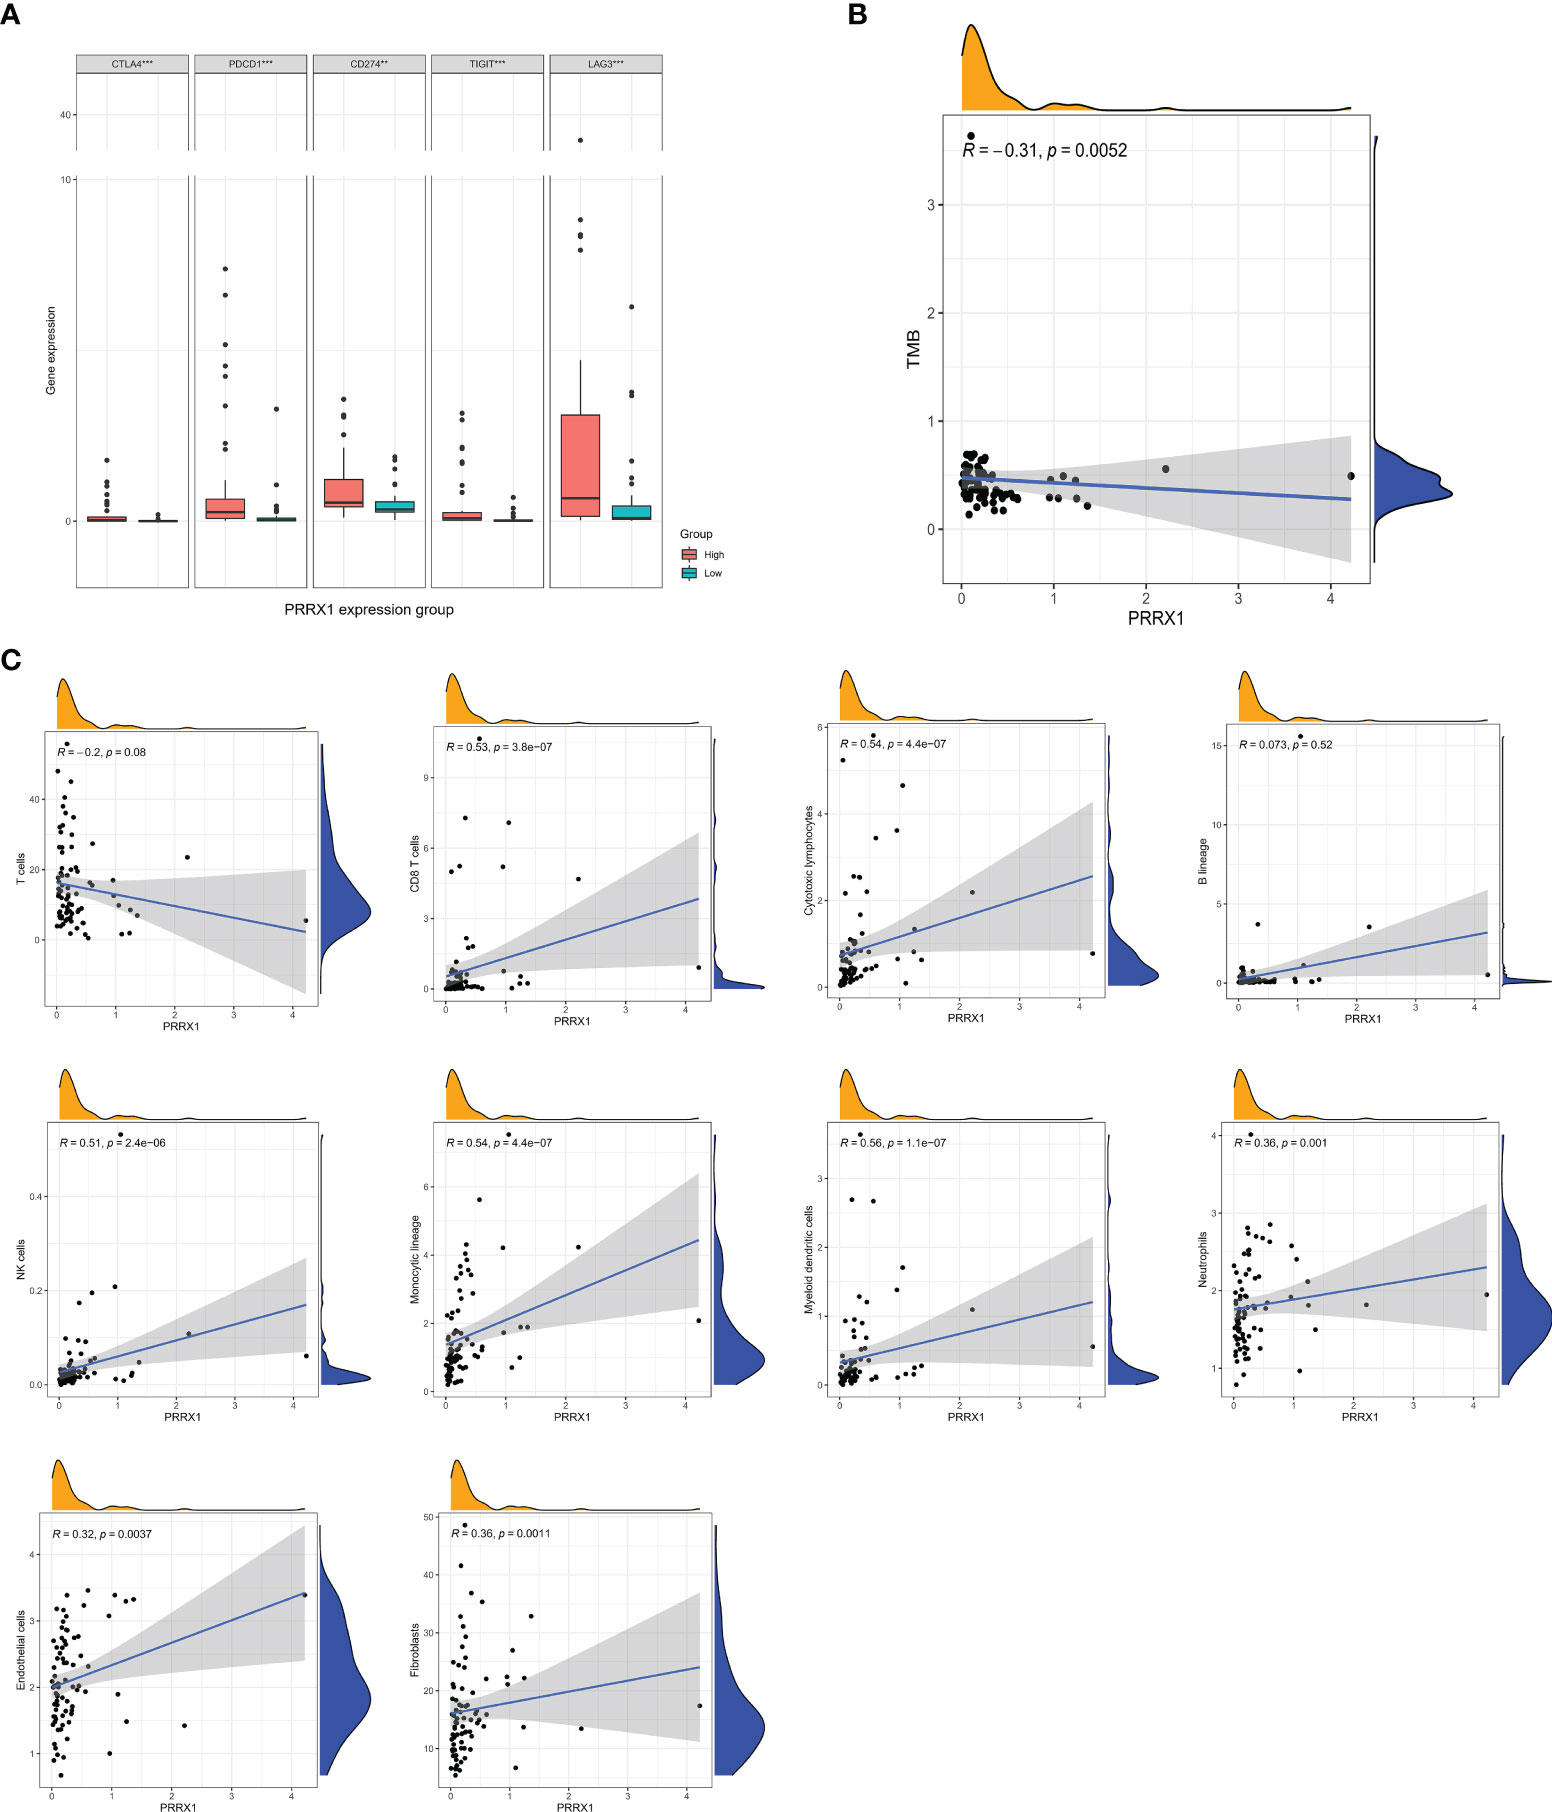
Figure 8 Analysis of immunologic characteristics associated with PRRX1 expression levels. (A) Comparisons of the levels of expression of immune checkpoint genes in the high and low PRRX1 groups (**p < 0.01; ***p < 0.001). (B) Correlation between PRRX1 expression level and TMB. (C) Correlation between PRRX1 expression and tumor immune/stromal cell populations in the UM microenvironment: T cells, CD8 T cells, cytotoxic lymphocytes, B lineage cells, NK cells, cells of the monocytic lineage, myeloid dendritic cells, neutrophils, endothelial cells, and fibroblasts, the x-axis represents the expression levels of PRRX1, and the y axis is the abundance of TME cells. The density curve on the x and y-axes represents the distribution trend of themselves. The blue line indicates the best fitted linear models and the shaded area indicates the 95% confidence interval.
Knockdown of PRRX1 Inhibits UM Cell Invasion, Migration and EMT Progression
The previously stated GSEA results revealed that PRRX1 expression significantly and positively correlated with the EMT signatures (Figure 9A). To investigate the biological function of PRRX1 in UM progression, we then performed loss-of-function experiments that silence PRRX1 in human UM cell line MuM-2B. The efficiency of the siRNA knockdown was confirmed by WB (Figure 9B), si-PRRX1-1 was chosen for subsequent experiments, which showed the most significant gene silencing efficiency. Compared to the control, downregulation of PRRX1 upregulates E-cadherin expression and downregulates Snail and N-cadherin expression in UM cells (Figure 9C). Furthermore, results of transwell invasion and scratch assays also demonstrated that the knockdown of PRRX1 significantly reduced UM cell migration and invasion (Figures 9D, E). Together, we initially confirmed PRRX1 promotes UM progression through affecting the EMT process.
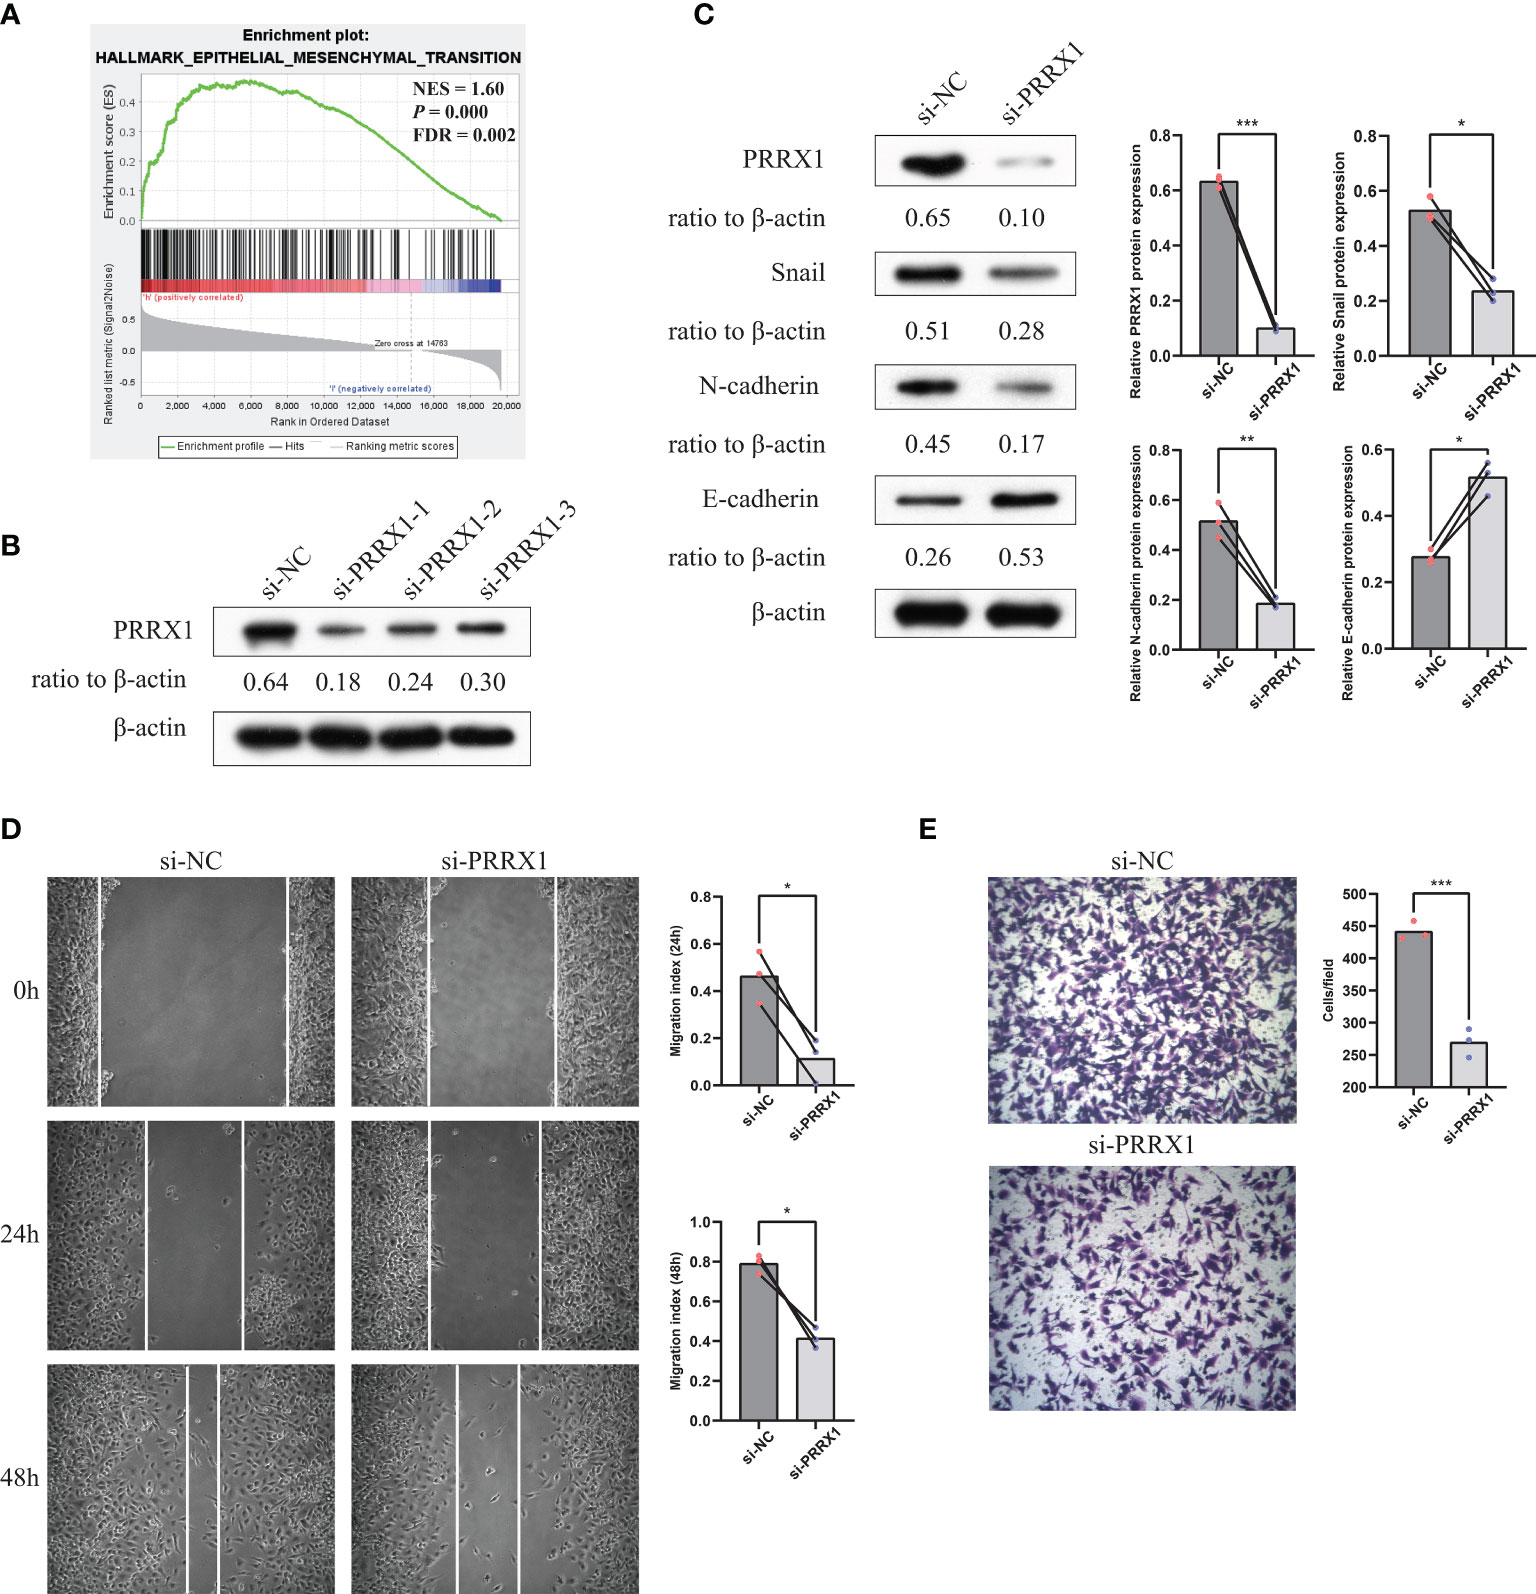
Figure 9 Knockdown of PRRX1 in UM cell suppresses EMT, migration and invasion in vitro. (A) GSEA results revealed that PRRX1 expression significantly positively correlated with the EMT signatures (NES = 1.6, p < 0.001, FDR = 0.002). (B) WB showed PRRX1 protein level with three different PRRX1–siRNA treatment, relative expression levels of proteins were normalized based on the β-actin levels. (C) The influence of PRRX1 knockdown on the expression level of EMT-related factors (Snail, N-cadherin and E-cadherin) were analyzed using WB, relative expression levels of proteins were normalized based on the β-actin levels (left: representative images of three independent experiments; right: quantitative analyses, n = 3, *p < 0.05; **p < 0.01; ***p < 0.001, paired Student’s t-test). (D) Wound-healing assay was used to detect cell migration ability in si-NC and si-PRRX1 UM cells (left: representative images of three independent experiments; right: quantitative analyses, n = 3, *p < 0.05, paired Student’s t-test). (E) Transwell assays showed the effect of PRRX1 knockdown on UM cell invasion (left: representative images of three independent experiments; right: quantitative analyses, n = 3, ***p < 0.001, unpaired Student’s t-test).
Discussion
This study has provided new insights into PRRX1 that could be a potential prognostic marker of survival in UM patients and therefore may be therapeutic targets. High immune scores, stromal scores, and ESTIMATE scores were associated with reduced OS, suggesting that a TME-related element was potentially able to evaluate prognosis in agreement with previous studies (30, 35, 36). GO and KEGG analyses suggest that the majority of TME and prognosis-related DEGs were involved in immune-related processes. PRRX1 as a TME- and prognosis-related gene was identified using the ESTIMATE algorithm and the LASSO-Cox regression model. The subsequent focus on PRRX1 showed that higher expression of this gene was associated with reduced OS and MFS in two independent datasets. Univariate and multivariate Cox analyses demonstrated that PRRX1 was an independent biomarker of prognosis in UM, with ROC curve analysis showing that PRRX1 can be classified as a robust predictor of UM. Furthermore, downregulation of PRRX1 weakened the process of EMT, reduced cell invasion and migration of UM cells in vitro.
PRRX1 protein is a member of the family of paired-type homeobox transcription factors, which have important functions in the regulation of developmental morphogenetic processes, such as vasculogenesis and organogenesis (37). PRRX1 is expressed in all known fibroblast subtypes. This protein modulates cutaneous fibrosis for the treatment of scarring and other pathologic fibrosis (38). Furthermore, PRRX1 was shown to enhance the malignant properties of a wide variety of tumors. For example, PRRX1-mediated cancer-associated fibroblast (CAF) plasticity was found to have a significant impact on the biology and resistance to therapy of pancreatic ductal adenocarcinoma (31, 39). Overexpression of PRRX1 was found to promote migration, invasion, and tumorigenesis and induce EMT in skin melanoma (40). To our knowledge, no previous study has assessed the relationships between PRRX1 expression and UM. The present study showed that high PRRX1 expression was associated with poor prognosis, high expression of immune checkpoint related gene and low TMB in UM patients. Clinical trials have reported that immune-based therapies are ineffective in the treatment of UM (41, 42). Our findings indicated that PRRX1 is involved in the TME of UM, providing insight into the lack of efficacy of existing therapy for UM.
Several studies suggested the role of PRRX1 in the regulation of tumor progression and metastasis through the regulation of the EMT, and acting as a ETM-TF that regulates stemness activity and EMT plasticity in TME (17, 43). The PRRX1 isoform PRRX1A was found to play important roles in regulating the metastatic potential and stemness of lung cancer (44), a finding supported by the results of our pan-cancer analysis. For instance, PRRX1 isoforms were shown to be important in pancreatic ductal adenocarcinomas (PDAC), especially in the regulation of the EMT and the mesenchymal-to-epithelial transition (MET) in liver metastases of PDAC (31, 39). Although PRRX1 was found to mediate carcinoma cell invasion and metastasis by inducing the EMT (37, 45, 46), other studies found that the loss of PRRX1 results in the reversion of the EMT and the induction of the MET, favoring metastatic colonization (32, 47, 48). In this study, we found that knockdown of PRRX1 reduces EMT-related proteins and inhibited UM cell migration and invasion. Further investigations of the deeper mechanisms by which PRRX1 induces the EMT or MET in patients with primary and metastatic UM may provide a fuller understanding of the molecular mechanism associated with distant metastases, and also suggesting novel treatment strategies.
The present study also found that PRRX1 expression was negatively correlated with chromosome 3 copy number, but positively correlated with chromosome 8q copy number. Several recent multi-omic studies have identified new molecular UM subsets, with types C and D being highly lethal. These subsets are characterized by the deletion of chromosome 3; the inactivation of BRCA1-associated protein 1 (BAP1), which is located on chromosome 3; and the gain of chromosome 8q (24, 49, 50). Our results support these findings, providing insights into the involvement of the PRRX1 gene in the chromosomal abnormalities of UM. Type D UM is characterized by an inflammatory phenotype (51). Our PRRX1-related GSEA and TILs analyses showed that high expression of PRRX1 was associated with inflammation, indicating that PRRX1 affects the TME in patients with UM. Additional studies are needed to evaluate the relationships among aberrant expression of PRRX1, chromosomal abnormalities, and inflammation-related activities during UM progression and metastasis. Further characteristics of EMT process induced by PRRX1 in the context of the changing TME of UM merit more attention in future studies.
An analysis of the relationship between PRRX1 expression and 10 immune cell types in UM samples showed that the level of PRRX1 expression was positively associated with invasion by eight immune cell types: CD8 T cells, cytotoxic lymphocytes, NK cells, cells of the monocytic lineage, myeloid dendritic cells, neutrophils, endothelial cells, and fibroblasts). These findings confirmed that PRRX1 plays a significant role in the TME of UM. Previous studies have demonstrated that UM-infiltrating leukocytes mainly included macrophages and CD8+ T cells (13). T cell infiltrates with immunosuppressive activity have been associated with loss of BAP1 and monosomy 3 (52, 53). We found that the levels of macrophages in UM tissue were positively correlated with PRRX1 gene expression. M2-like macrophages, which constitute a large proportion of monocytes in UM (54, 55), are tightly associated with angiogenesis and vasculogenic mimicry (56, 57), suggesting that high PRRX1 expression in UM was also associated with angiogenesis and vasculogenic mimicry. Moreover, PRRX1 was shown to promote angiogenesis in gliomas by upregulating the expression of proangiogenic factors such as VEGF (58). Further investigation is required to assess the relationship between PRRX1 expression and angiogenesis in patients with UM.
Conclusion
In conclusion, this study showed that PRRX1 expression affects UM progression and metastasis. PRRX1 may therefore be a promising biomarker for UM that can predict patient prognosis and the efficacy of anticancer therapies. These findings may provide an individualized therapeutic approach for patients carrying the PRRX1 variant.
Data Availability Statement
The datasets analyzed during this study are available in TCGA database (https://portal.gdc.cancer.gov) and the Gene Expression Omnibus (GEO) database (https://www.ncbi.nlm.nih.gov/geo/).
Author Contributions
Conceptualization: JL, ZM, and YC. Methodology and software: ZM, YC, and WW. Visualization: ZM, YC and XY. Formal analysis and data curation: BY, YM, YL, and XY. Writing: ZM and YC. Review and editing: WW, LZ, HC and JL. Supervision and acquisition of funding: JL. All authors listed have made a substantial, direct, and intellectual contribution to the work and approved it for publication.
Funding
This work was supported by grants from the National Natural Science Foundation of China (81570847) and the Hunan Provincial Natural Science Foundation of China (2020JJ4800).
Conflict of Interest
The authors declare that the research was conducted in the absence of any commercial or financial relationships that could be construed as a potential conflict of interest.
Publisher’s Note
All claims expressed in this article are solely those of the authors and do not necessarily represent those of their affiliated organizations, or those of the publisher, the editors and the reviewers. Any product that may be evaluated in this article, or claim that may be made by its manufacturer, is not guaranteed or endorsed by the publisher.
Acknowledgments
The authors thank the TCGA working groups for generously sharing their data and Cécile Laurent and colleagues for uploading their data to GEO. The authors also thank the patients and their families who generously donated tissue samples to TCGA and GEO, and also the R development team and the R community for contributing statistical packages.
Supplementary Material
The Supplementary Material for this article can be found online at: https://www.frontiersin.org/articles/10.3389/fimmu.2022.754645/full#supplementary-material
References
1. Amaro A, Gangemi R, Piaggio F, Angelini G, Barisione G, Ferrini S, et al. The Biology of Uveal Melanoma. Cancer Metastasis Rev (2017) 36(1):109–40. doi: 10.1007/s10555-017-9663-3
2. Jager MJ, Shields CL, Cebulla CM, Abdel-Rahman MH, Grossniklaus HE, Stern MH, et al. Uveal Melanoma. Nat Rev Dis Primers (2020) 6(1):24. doi: 10.1038/s41572-020-0158-0
3. Carvajal RD, Schwartz GK, Tezel T, Marr B, Francis JH, Nathan PD. Metastatic Disease From Uveal Melanoma: Treatment Options and Future Prospects. Br J Ophthalmol (2016) 101(1):38–44. doi: 10.1136/bjophthalmol-2016-309034
4. Karlsson J, Nilsson LM, Mitra S, Alsén S, Shelke GV, Sah VR, et al. Molecular Profiling of Driver Events in Metastatic Uveal Melanoma. Nat Commun (2020) 11(1):1894. doi: 10.1038/s41467-020-15606-0
5. Laurent C, Valet F, Planque N, Silveri L, Maacha S, Anezo O, et al. High PTP4A3 Phosphatase Expression Correlates With Metastatic Risk in Uveal Melanoma Patients. Cancer Res (2011) 71(3):666–74. doi: 10.1158/0008-5472.CAN-10-0605
6. Szalai E, Wells JR, Ward L, Grossniklaus HE. Uveal Melanoma Nuclear BRCA1-Associated Protein-1 Immunoreactivity Is an Indicator of Metastasis. Ophthalmology (2018) 125(2):203–9. doi: 10.1016/j.ophtha.2017.07.018
7. Chua V, Mattei J, Han A, Johnston L, LiPira K, Selig SM, et al. The Latest on Uveal Melanoma Research and Clinical Trials: Updates From the Cure Ocular Melanoma (CURE OM) Science Meeting, (2019). Clin Cancer Res (2021) 27(1):28–33. doi: 10.1158/1078-0432.CCR-20-2536
8. Pelster MS, Gruschkus SK, Bassett R, Gombos DS, Shephard M, Posada L, et al. Nivolumab and Ipilimumab in Metastatic Uveal Melanoma: Results From a Single-Arm Phase II Study. J Clin Oncol (2021) 39(6):599–607. doi: 10.1200/JCO.20.00605
9. Piulats JM, Espinosa E, de la Cruz ML, Varela M, Alonso CL, Martin-Algarra S, et al. Nivolumab Plus Ipilimumab for Treatment-Naive Metastatic Uveal Melanoma: An Open-Label, Multicenter, Phase II Trial by the Spanish Multidisciplinary Melanoma Group (GEM-1402). J Clin Oncol (2021) 39(6):586–98. doi: 10.1200/JCO.20.00550
10. Qin Y, Bollin K, de Macedo MP, Carapeto F, Kim KB, Roszik J, et al. Immune Profiling of Uveal Melanoma Identifies a Potential Signature Associated With Response to Immunotherapy. J Immunother Cancer (2020) 8(2):e960. doi: 10.1136/jitc-2020-000960
11. Durante MA, Rodriguez DA, Kurtenbach S, Kuznetsov JN, Sanchez MI, Decatur CL, et al. Single-Cell Analysis Reveals New Evolutionary Complexity in Uveal Melanoma. Nat Commun (2020) 11(1):496. doi: 10.1038/s41467-019-14256-1
12. Triozzi PL, Schoenfield L, Plesec T, Saunthararajah Y, Tubbs RR, Singh AD. Molecular Profiling of Primary Uveal Melanomas With Tumor-Infiltrating Lymphocytes. Oncoimmunology (2019) 8(10):e947169. doi: 10.4161/21624011.2014.947169
13. Bronkhorst IH, Jager MJ. Uveal Melanoma: The Inflammatory Microenvironment. J Innate Immun (2012) 4(5-6):454–62. doi: 10.1159/000334576
14. Gezgin G, Dogrusoz M, van Essen TH, Kroes W, Luyten G, van der Velden PA, et al. Genetic Evolution of Uveal Melanoma Guides the Development of an Inflammatory Microenvironment. Cancer Immunol Immunother (2017) 66(7):903–12. doi: 10.1007/s00262-017-1991-1
15. Jager MJ, Ly LV, El Filali M, Madigan MC. Macrophages in Uveal Melanoma and in Experimental Ocular Tumor Models: Friends or Foes? Prog Retin Eye Res (2011) 30(2):129–46. doi: 10.1016/j.preteyeres.2010.11.004
16. Dong L, You S, Zhang Q, Osuka S, Devi NS, Kaluz S, et al. Arylsulfonamide 64B Inhibits Hypoxia/HIF-Induced Expression of C-Met and CXCR4 and Reduces Primary Tumor Growth and Metastasis of Uveal Melanoma. Clin Cancer Res (2019) 25(7):2206–18. doi: 10.1158/1078-0432.CCR-18-1368
17. Marcucci F, Stassi G, De Maria R. Epithelial-Mesenchymal Transition: A New Target in Anticancer Drug Discovery. Nat Rev Drug Discov (2016) 15(5):311–25. doi: 10.1038/nrd.2015.13
18. Yang J, Antin P, Berx G, Blanpain C, Brabletz T, Bronner M, et al. Guidelines and Definitions for Research on Epithelial-Mesenchymal Transition. Nat Rev Mol Cell Biol (2020) 21(6):341–52. doi: 10.1038/s41580-020-0237-9
19. Parker T, Rigney G, Kallos J, Stefko ST, Kano H, Niranjan A, et al. Gamma Knife Radiosurgery for Uveal Melanomas and Metastases: A Systematic Review and Meta-Analysis. Lancet Oncol (2020) 21(11):1526–36. doi: 10.1016/S1470-2045(20)30459-9
20. Shields JA, Shields CL. Management of Posterior Uveal Melanoma: Past, Present, and Future: The 2014 Charles L. Schepens Lecture. Ophthalmology (2015) 122(2):414–28. doi: 10.1016/j.ophtha.2014.08.046
21. Carvajal RD, Piperno-Neumann S, Kapiteijn E, Chapman PB, Frank S, Joshua AM, et al. Selumetinib in Combination With Dacarbazine in Patients With Metastatic Uveal Melanoma: A Phase III, Multicenter, Randomized Trial (SUMIT). J Clin Oncol (2018) 36(12):1232–9. doi: 10.1200/JCO.2017.74.1090
22. Komatsubara KM, Carvajal RD. Adopting a New Stance on Immunotherapy for Uveal Melanoma. Lancet Oncol (2017) 18(6):702–4. doi: 10.1016/S1470-2045(17)30254-1
23. Carvajal RD, Sosman JA, Quevedo JF, Milhem MM, Joshua AM, Kudchadkar RR, et al. Effect of Selumetinib vs Chemotherapy on Progression-Free Survival in Uveal Melanoma: A Randomized Clinical Trial. JAMA (2014) 311(23):2397–405. doi: 10.1001/jama.2014.6096
24. Robertson AG, Shih J, Yau C, Gibb EA, Oba J, Mungall KL, et al. Integrative Analysis Identifies Four Molecular and Clinical Subsets in Uveal Melanoma. Cancer Cell (2017) 32(2):204–20. doi: 10.1016/j.ccell.2017.07.003
25. Yoshihara K, Shahmoradgoli M, Martinez E, Vegesna R, Kim H, Torres-Garcia W, et al. Inferring Tumour Purity and Stromal and Immune Cell Admixture From Expression Data. Nat Commun (2013) 4(1):2612. doi: 10.1038/ncomms3612
26. Rao PK, Barker C, Coit DG, Joseph RW, Materin M, Rengan R, et al. NCCN Guidelines Insights: Uveal Melanoma, Version 1.2019. J Natl Compr Canc Netw (2020) 18(2):120–31. doi: 10.6004/jnccn.2020.0007
27. Goodman A, Patel SP, Kurzrock R. PD-1-PD-L1 Immune-Checkpoint Blockade in B-Cell Lymphomas. Nat Rev Clin Oncol (2017) 14(4):203–20. doi: 10.1038/nrclinonc.2016.168
28. Folberg R, Kadkol SS, Frenkel S, Valyi-Nagy K, Lager MJ, Pe'er J, et al. Authenticating Cell Lines in Ophthalmic Research Laboratories. Invest Ophthalmol Vis Sci (2008) 49(11):4697–701. doi: 10.1167/iovs.08-2324
29. Wang Y, Bao X, Zhang Z, Sun Y, Zhou X. FGF2 Promotes Metastasis of Uveal Melanoma Cells via Store-Operated Calcium Entry. Onco Targets Ther (2017) 10:5317–28. doi: 10.2147/OTT.S136677
30. Chen Y, Meng Z, Zhang L, Liu F. CD2 Is a Novel Immune-Related Prognostic Biomarker of Invasive Breast Carcinoma That Modulates the Tumor Microenvironment. Front Immunol (2021) 12:664845. doi: 10.3389/fimmu.2021.664845
31. Feldmann K, Maurer C, Peschke K, Teller S, Schuck K, Steiger K, et al. Mesenchymal Plasticity Regulated by Prrx1 Drives Aggressive Pancreatic Cancer Biology. Gastroenterology (2021) 160(1):346–61. doi: 10.1053/j.gastro.2020.09.010
32. Ocana OH, Corcoles R, Fabra A, Moreno-Bueno G, Acloque H, Vega S, et al. Metastatic Colonization Requires the Repression of the Epithelial-Mesenchymal Transition Inducer Prrx1. Cancer Cell (2012) 22(6):709–24. doi: 10.1016/j.ccr.2012.10.012
33. Becht E, Giraldo NA, Lacroix L, Buttard B, Elarouci N, Petitprez F, et al. Estimating the Population Abundance of Tissue-Infiltrating Immune and Stromal Cell Populations Using Gene Expression. Genome Biol (2016) 17(1):218. doi: 10.1186/s13059-016-1070-5
34. Dienstmann R, Villacampa G, Sveen A, Mason MJ, Niedzwiecki D, Nesbakken A, et al. Relative Contribution of Clinicopathological Variables, Genomic Markers, Transcriptomic Subtyping and Microenvironment Features for Outcome Prediction in Stage II/III Colorectal Cancer. Ann Oncol (2019) 30(10):1622–9. doi: 10.1093/annonc/mdz287
35. Fox NS, Haider S, Harris AL, Boutros PC. Landscape of Transcriptomic Interactions Between Breast Cancer and Its Microenvironment. Nat Commun (2019) 10(1):3116. doi: 10.1038/s41467-019-10929-z
36. Pages F, Mlecnik B, Marliot F, Bindea G, Ou FS, Bifulco C, et al. International Validation of the Consensus Immunoscore for the Classification of Colon Cancer: A Prognostic and Accuracy Study. Lancet (2018) 391(10135):2128–39. doi: 10.1016/S0140-6736(18)30789-X
37. Joko R, Yamada D, Nakamura M, Yoshida A, Takihira S, Takao T, et al. PRRX1 Promotes Malignant Properties in Human Osteosarcoma. Trans Oncol (2021) 14(1):100960. doi: 10.1016/j.tranon.2020.100960
38. Leavitt T, Hu MS, Borrelli MR, Januszyk M, Garcia JT, Ransom RC, et al. Prrx1 Fibroblasts Represent a Pro-Fibrotic Lineage in the Mouse Ventral Dermis. Cell Rep (2020) 33(6):108356. doi: 10.1016/j.celrep.2020.108356
39. Marchand B, Pitarresi JR, Reichert M, Suzuki K, Laczkó D, Rustgi AK. PRRX1 Isoforms Cooperate With FOXM1 to Regulate the DNA Damage Response in Pancreatic Cancer Cells. Oncogene (2019) 38(22):4325–39. doi: 10.1038/s41388-019-0725-6
40. Wu X, Bao H. Tumor Suppressive microRNA-485-5p Targets PRRX1 in Human Skin Melanoma Cells, Regulating Epithelial–Mesenchymal Transition and Apoptosis. Cell Biol Int (2021) 45(7):1404–14. doi: 10.1002/cbin.11575
41. Afzal MZ, Mabaera R, Shirai K. Metastatic Uveal Melanoma Showing Durable Response to Anti-CTLA-4 and Anti-PD-1 Combination Therapy After Experiencing Progression on Anti-PD-1 Therapy Alone. J Immunother Cancer (2018) 6(1):13. doi: 10.1186/s40425-018-0322-1
42. Schank TE, Hassel JC. Immunotherapies for the Treatment of Uveal Melanoma-History and Future. Cancers (2019) 11(8):1048. doi: 10.3390/cancers11081048
43. Du W, Liu X, Yang M, Wang W, Sun J. The Regulatory Role of PRRX1 in Cancer Epithelial-Mesenchymal Transition. Onco Targets Ther (2021) 14:4223–9. doi: 10.2147/OTT.S316102
44. Sun L, Han T, Zhang X, Liu X, Li P, Shao M, et al. PRRX1 Isoform PRRX1A Regulates the Stemness Phenotype and Epithelial-Mesenchymal Transition (EMT) of Cancer Stem-Like Cells (CSCs) Derived From Non-Small Cell Lung Cancer (NSCLC). Transl Lung Cancer Res (2020) 9(3):731–44. doi: 10.21037/tlcr-20-633
45. Hardin H, Guo Z, Shan W, Montemayor-Garcia C, Asioli S, Yu X, et al. The Roles of the Epithelial-Mesenchymal Transition Marker PRRX1 and miR-146b-5p in Papillary Thyroid Carcinoma Progression. Am J Pathol (2014) 184(8):2342–54. doi: 10.1016/j.ajpath.2014.04.011
46. Rustgi AK, Stanger BZ, Rhim AD, Schneider G, Heeg S, Hahn C, et al. The Prrx1 Homeodomain Transcription Factor Plays a Central Role in and Carcinogenesis. Genes Dev (2013) 27(3):288–300. doi: 10.1101/gad.204453.112
47. Hirata H, Sugimachi K, Takahashi Y, Ueda M, Sakimura S, Uchi R, et al. Downregulation of PRRX1 Confers Cancer Stem Cell-Like Properties and Predicts Poor Prognosis in Hepatocellular Carcinoma. Ann Surg Oncol (2015) 22(S3):1402–9. doi: 10.1245/s10434-014-4242-0
48. Takano S, Reichert M, Bakir B, Das KK, Nishida T, Miyazaki M, et al. Prrx1 Isoform Switching Regulates Pancreatic Cancer Invasion and Metastatic Colonization. Genes Dev (2016) 30(2):233–47. doi: 10.1101/gad.263327.115
49. Li Y, Shi J, Yang J, Ge S, Zhang J, Jia R, et al. Uveal Melanoma: Progress in Molecular Biology and Therapeutics. Ther Adv Med Oncol (2020) 12:386358089. doi: 10.1177/1758835920965852
50. Smit KN, Jager MJ, de Klein A, Kili E. Uveal Melanoma: Towards a Molecular Understanding. Prog Retin Eye Res (2020) 75:100800. doi: 10.1016/j.preteyeres.2019.100800
51. Jager MJ, Brouwer NJ, Esmaeli B. The Cancer Genome Atlas Project: An Integrated Molecular View of Uveal Melanoma. Ophthalmology (2018) 125(8):1139–42. doi: 10.1016/j.ophtha.2018.03.011
52. Figueiredo CR, Kalirai H, Sacco JJ, Azevedo RA, Duckworth A, Slupsky JR, et al. Loss Ofbap1 Expression Is Associated With an Immunosuppressive Microenvironment in Uveal Melanoma, With Implications for Immunotherapy Development. J Pathol (2020) 250(4):420–39. doi: 10.1002/path.5384
53. Harbour JW, Chao DL. A Molecular Revolution in Uveal Melanoma. Ophthalmology (2014) 121(6):1281–8. doi: 10.1016/j.ophtha.2013.12.014
54. Jehs T, Faber C, Juel HB, Bronkhorst IHG, Jager MJ, Nissen MH. Inflammation-Induced Chemokine Expression in Uveal Melanoma Cell Lines Stimulates Monocyte Chemotaxis. Invest Ophthalmol Vis Sci (2014) 55(8):5169–75. doi: 10.1167/iovs.14-14394
55. Ly LV, Bronkhorst IHG, van Beelen E, Vrolijk J, Taylor AW, Versluis M, et al. Inflammatory Cytokines in Eyes With Uveal Melanoma and Relation With Macrophage Infiltration. Invest Ophthalmol Vis Sci (2010) 51(11):5445–51. doi: 10.1167/iovs.10-5526
56. Castet F, Garcia-Mulero S, Sanz-Pamplona R, Cuellar A, Casanovas O, Caminal JM, et al. Uveal Melanoma, Angiogenesis and Immunotherapy, Is There Any Hope? Cancers (2019) 11(6):834. doi: 10.3390/cancers11060834
57. de Lange MJ, Nell RJ, Lalai RN, Versluis M, Jordanova ES, Luyten GPM, et al. Digital PCR-Based T-Cell Quantification-Assisted Deconvolution of the Microenvironment Reveals That Activated Macrophages Drive Tumor Inflammation in Uveal Melanoma. Mol Cancer Res (2018) 16(12):1902–11. doi: 10.1158/1541-7786.MCR-18-0114
Keywords: uveal melanoma, PRRX1, tumor microenvironment, epithelial–mesenchymal transition, biomarker
Citation: Meng Z, Chen Y, Wu W, Yan B, Zhang L, Chen H, Meng Y, Liang Y, Yao X and Luo J (2022) PRRX1 Is a Novel Prognostic Biomarker and Facilitates Tumor Progression Through Epithelial–Mesenchymal Transition in Uveal Melanoma. Front. Immunol. 13:754645. doi: 10.3389/fimmu.2022.754645
Received: 06 August 2021; Accepted: 31 January 2022;
Published: 25 February 2022.
Edited by:
Tao Liu, University of New South Wales, AustraliaReviewed by:
Petar Ozretić, Rudjer Boskovic Institute, CroatiaCao Jinlong, Lanzhou University Second Hospital, China
Guang Zhang, Nanjing Drum Tower Hospital, China
Copyright © 2022 Meng, Chen, Wu, Yan, Zhang, Chen, Meng, Liang, Yao and Luo. This is an open-access article distributed under the terms of the Creative Commons Attribution License (CC BY). The use, distribution or reproduction in other forums is permitted, provided the original author(s) and the copyright owner(s) are credited and that the original publication in this journal is cited, in accordance with accepted academic practice. No use, distribution or reproduction is permitted which does not comply with these terms.
*Correspondence: Jing Luo, bHVvamluZzAwMUBjc3UuZWR1LmNu
†These authors have contributed equally to this work and share first authorship