 Yasuo Nagafuchi
 Haruyuki Yanaoka
 Keishi Fujio
- 1Department of Allergy and Rheumatology, Graduate School of Medicine, The University of Tokyo, Tokyo, Japan
- 2Department of Functional Genomics and Immunological Diseases, Graduate School of Medicine, The University of Tokyo, Tokyo, Japan
- 3Immuno-Rheumatology Center, St. Luke’s International Hospital, St. Luke’s International University, Tokyo, Japan
Various immune cell types, including monocytes, macrophages, and adaptive immune T and B cells, play major roles in inflammation in systemic autoimmune diseases. However, the precise contribution of these cells to autoimmunity remains elusive. Transcriptome analysis has added a new dimension to biology and medicine. It enables us to observe the dynamics of gene expression in different cell types in patients with diverse diseases as well as in healthy individuals, which cannot be achieved with genomic information alone. In this review, we summarize how transcriptome analysis has improved our understanding of the pathological roles of immune cells in autoimmune diseases with a focus on the ImmuNexUT database we reported. We will also discuss the common experimental and analytical design of transcriptome analyses. Recently, single-cell RNA-seq analysis has provided atlases of infiltrating immune cells, such as pro-inflammatory monocytes and macrophages, peripheral helper T cells, and age or autoimmune-associated B cells in various autoimmune disease lesions. With the integration of genomic data, expression quantitative trait locus (eQTL) analysis can help identify candidate causal genes and immune cells. Finally, we also mention how the information obtained from these analyses can be used practically to predict patient prognosis.
Introduction
Autoimmune reactions and chronic inflammation are hallmarks of systemic autoimmune diseases or rheumatic diseases. The presence of autoantibodies and autoreactive T and B cells in these diseases indicates that the adaptive immune system is critical for their pathogenesis. The innate immune response also plays an indispensable role. The infiltration of monocytes and macrophages is always observed in the affected tissues of patients with autoimmune diseases (1). These cells stimulate and recruit other immune cells to diseased tissues by secreting pro-inflammatory cytokines and chemokines. Macrophages are important phagocytes acting against pathogens and serve as antigen-presenting cells that activate adaptive immune responses (2). Monocytes, macrophages, and adaptive T and B cells cooperatively contribute to chronic inflammation in autoimmune diseases.
The majority of systemic autoimmune diseases are multifactorial or polygenic; i.e., no single variant or gene can fully explain disease development. Genetic studies have revealed cumulative polygenic effects of numerous risk (or protective) variants with weak effect sizes on the susceptibility to developing autoimmune diseases. In the example of systemic lupus erythematosus (SLE), a prototypic autoimmune disease characterized by a broad spectrum of clinical symptoms and autoantibodies (3), patients in the highest polygenic risk score decile had a higher disease risk (odds ratio 30.3) compared with those in the lowest decile (4). In addition to polygenic risk factors, environmental factors are also critical in the development of autoimmune diseases. Concordance rates of 20–30% in monozygotic twins emphasize the importance of environmental factors in the development of autoimmune diseases (5). Transcriptome analysis of autoimmune diseases can capture dynamic genome-wide gene expression changes in immune cells reflecting both genetic and environmental stimulations.
In this review, we summarize how transcriptome analyses have improved our understanding of pathological immune cells, pathways, and genes in autoimmune diseases. We will introduce our peripheral blood transcriptome analyses on autoimmune diseases by the ImmuNexUT (Immune Cell Gene Expression Atlas from the University of Tokyo) consortium (6). We will also discuss the common experimental and analytical designs of transcriptome analyses and how transcriptome analysis can contribute to clinical decision-making for patient care.
Blood Transcriptome and Identification of Interferon Signatures
Microarray studies, the pioneer transcriptome analyses conducted in autoimmune diseases, involve the hybridization of fluorescently labeled cDNA samples to probes on microarrays. Identification of the prominent interferon (IFN) genes involved in SLE by microarray analysis of blood mononuclear cells in patients and healthy controls in 2003 was an early hallmark discovery (7, 8) (Table 1). Using this differential gene expression approach, we compared the transcriptomes of diseased patients and a control group and statistically created a list of disease signature genes. Physiologically, plasmacytoid dendritic cells sense viral nucleic acids via TLR7 and TLR9 and produce type I IFN. Type I IFN increases the expression of major histocompatibility complex genes, induces chemokines and cytokines to recruit immune cells, and activates both innate and adaptive immune cells into an antiviral state (16). A recent genome-wide association study found that genetic variants in type I IFN gene clusters are associated with SLE risk (4). Elevation of the serum IFN-α concentration in blood cells is diagnostic of SLE (17). Several clinical trials and identification of the IFN signature led to the approval of anifrolumab, a human monoclonal antibody against IFNAR1 that significantly decreases the expression of type I IFN-induced genes, for the treatment of SLE in 2021 (18, 19). Enhanced expression of type I IFN signature genes in SLE is thus pivotal in the pathophysiology of SLE.
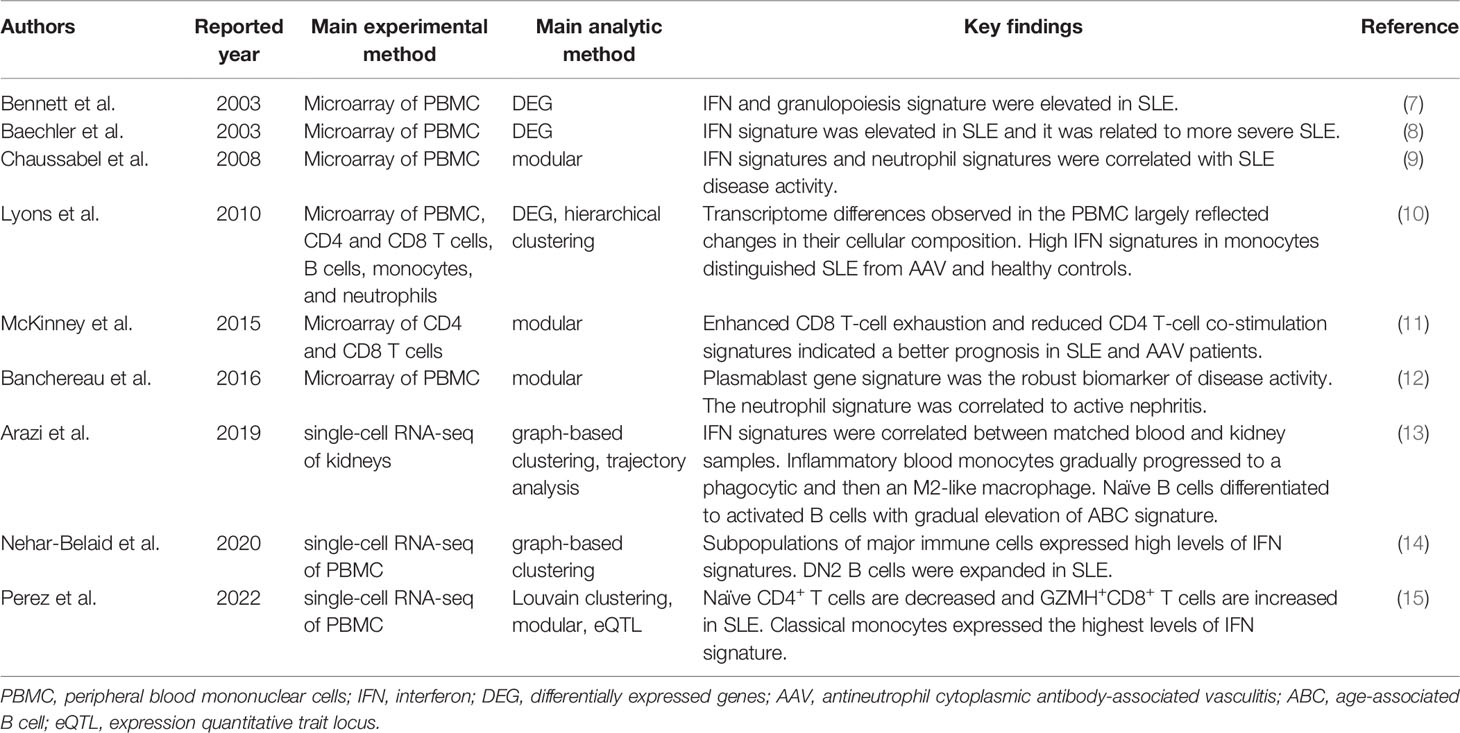
Table 1 Key immune cell transcriptome reports in SLE.
Peripheral blood IFN signature genes are expressed not only in SLE but also in other autoimmune diseases, including rheumatoid arthritis (RA), dermatomyositis, systemic sclerosis (SSc), and Sjögren’s syndrome (20–23). In RA, the most prevalent autoimmune disease, characterized by chronic autoimmune inflammation in the joints (24), the preclinical IFN signature predicts the development of arthritis (20). Moreover, a third to a half of established RA patients express IFN signature genes (21, 22). In a comparative study of five autoimmune diseases, the proportion of patients positive for type I IFN signature genes was 73% for SLE, 66% for dermatomyositis, 61% for polymyositis, 68% for SSc, and 33% for RA (22). These data suggest variable contributions of IFN signature genes to the pathogenesis of autoimmune diseases.
Modular Analysis of the Blood Transcriptome and Cell-Type Gene Signatures
Analysis of differentially expressed genes at the transcriptome level is generally permissive to noise because of the large number of genes (usually > 10,000) analyzed and relatively limited sample numbers (usually ~100 and at most ~1,000). To overcome this “curse of dimensionality”, Chaussabel et al. applied modular analysis to peripheral blood mononuclear cell (PBMC) microarray data from 239 individuals and found two SLE disease activity-related transcriptional modules: IFN-signature and neutrophil genes (9). In modular analysis, sets of coordinately expressed genes are identified, and modules are constructed in a data-driven way. The modules typically represent functionally associated genes, such as plasma cell-type genes and IFN signature genes.
Banchereau et al. applied this modular analysis to data from the whole blood of 156 pediatric SLE patients and identified the plasmablast cell-type gene signature as the most robust biomarker of disease activity (12). The neutrophil module was activated in a subset of patients with active nephritis. The authors proposed a model of gradual disease progression, with early increases in IFN responses and B-cell differentiation into plasmablasts, followed by development of kidney disease and full-blown systemic inflammation fueled by myeloid cells, including neutrophils.
The most valuable lesson from these early transcriptome analyses is that blood transcriptomic differences are largely driven by compositional changes in immune cell populations. For example, blood transcriptome studies revealed that peripheral neutrophils are increased in lupus patients with active nephritis, but they could not determine the qualitative changes in neutrophils in detail.
Bulk Immune Cell Transcriptome and Purified Cell-Type Specific Signatures
Lyons et al. isolated CD4 and CD8 T cells, B cells, monocytes, and neutrophils from patients with SLE or ANCA-associated vasculitis (AAV) and performed microarray analysis in comparison with microarray analysis of whole PBMCs (10). In their study, a substantial number of differentially expressed genes were identified only in the purified immune cells samples. Transcriptomic data from the monocytes differentiated AAV and SLE patients from each other and from controls more robustly compared with the PBMC transcriptomic data. Especially, IFN signature gene levels in monocytes distinguished the two diseases.
McKinney et al. analyzed the transcriptomes of purified CD8 and CD4 T cells using a module analysis approach (11). They found that enhanced CD8 T-cell exhaustion and reduced CD4 T-cell co-stimulation gene signatures indicated a better prognosis in SLE and AAV patients. In contrast, the CD8 T-cell exhaustion signature was associated with poor outcomes in patients with viral infections.
ImmuNexUT; Bulk RNA-Seq Across Immune Cells and Immune-Mediated Diseases
Recently, we reported ImmuNexUT, a large database containing immune cell gene expression data from various immune-mediated diseases and many types of immune cells, in addition to healthy controls. In the first flagship study (6), we performed RNA sequencing (RNA-seq) in 28 types of purified bulk immune cells from healthy samples and 10 immune-mediated diseases (https://www.immunexut.org/). RNA-seq directly determines cDNA sequences using next-generation sequencers, independent of prior knowledge of genomic sequences, and the dynamic range to quantify gene expression levels is superior to that of microarrays (25). Modular analysis revealed that characteristically expressed gene modules in autoimmune diseases overlap IFN signature gene sets, and those in autoinflammatory diseases overlap IL-18- or IL-1β-activated gene sets (Figure 1). When comparing gene expression among individuals, we observed remarkable heterogeneity within diseases. Especially, patients with idiopathic inflammatory myopathy (IIM) with anti-MDA5 antibodies expressed high levels of IFN signature genes comparable with those in SLE patients, while the immune cell transcriptomes of the other IIM patients were heterogeneous. Anti-MDA5 antibodies in IIM are associated with life-threatening, rapidly progressing interstitial lung diseases (27). Because MDA5 is a cytosolic sensor of double-stranded RNA regulating IFN signaling, IFN signaling could have pathophysiological relevance, especially in this subtype of IIM.

Figure 1 Heterogeneity of immune-mediated diseases in ImmuNexUT. In the ImmuNexUT flagship article, we applied weighted gene correlation network analysis (26) to immune cell gene expression data and systemically characterized the gene modules related to immune-mediated diseases. When we compared the expression of these modules between autoimmune disease patients and healthy controls, gene modules enriched with IFN-induced gene sets were overexpressed in autoimmune disease patients. SLE, mixed connective tissue disease (MCTD), Sjögren’s syndrome (SjS), systemic sclerosis (SSc), idiopathic inflammatory myopathy (IIM), and rheumatoid arthritis (RA). Gene modules enriched with IL-18 or IL-1β-induced gene sets were overexpressed in patients with autoinflammatory diseases: Behçet’s disease (BD) and adult-onset Still’s disease (AOSD). Takayasu arteritis (TAK) or ANCA-associated vasculitis (AAV) patients showed similar expression patterns to those in autoinflammatory disease patients. SSc, IIM, and RA patients were more heterogeneous compared with the other diseases.
ImmuNexUT Sub-analysis of SSc
SSc is an intractable autoimmune disease characterized by skin and internal organ fibrosis and vasculopathy (28). The rate of disease-related mortality is higher in SSc patients than in other autoimmune disease patients (26). Treatment approaches such as immunosuppressive drugs, vasodilation, and antifibrotic therapy only partially ameliorate the disease. Bulk transcriptome analysis of the affected skin showed adaptive immune cell signatures were associated with early-phase disease, while fibroblast and macrophage cell type signatures were associated with advanced fibrosis (29). Valenzi et al. have performed a single-cell RNA-seq analysis of the affected lung tissue from SSc patients and have identified a large proliferating myofibroblast population (30). However, little was known about the transcriptomic changes of peripheral blood immune cells in SSc.
In a sub-analysis of SSc patients from ImmuNexUT, we performed a modular analysis of gene expression data from each immune cell type to compare SSc and healthy controls (31). Using a machine learning approach, random forest, we prioritized the most important gene co-expression module for discriminating SSc from healthy controls. An inflammatory gene module in CD16+ monocytes, including KLF10, PLAUR, JUNB, and JUND genes, showed the greatest capacity for discrimination. Integration with single-cell RNA-seq data from peripheral blood and interstitial lung disease lesional monocytes revealed a significant overlap of the gene module with a subgroup of monocytes. Because monocytes and their subpopulations are involved in tissue fibrosis (32–34), the pro-inflammatory monocyte subpopulation identified in that study might have a profibrotic capacity as well.
In addition, in a subsequent analysis comparing the transcriptomes of early-stage SSc (disease duration < 5 years) and late phase SSc (35), we revealed distinct differentially expressed genes in regulatory T cells (Tregs). In an integrative analysis with single-cell RNA-seq data, we performed deconvolution (36), a method to statistically estimate the proportions of cell subpopulations based on mixed cell data. Again, we found expansion of an activated subpopulation of Tregs in early-stage SSc (and also in IIM) with marked differences in gene expression. The role of Tregs in fibrosis is controversial because whether Tregs are profibrotic or antifibrotic depends on the experimental animal model (37). Our data suggest a profibrotic role of Tregs during the early phase of fibrotic autoimmune diseases.
In sharp contrast, a similar analysis of ImmuNexUT data in AAV patients versus healthy controls identified upregulation of a gene module related to neutrophil extracellular trap formation (NETosis) in AAV patients (38), revealing the importance of NETosis in the pathogenesis of AAV. In fact, the neutrophil enzymes MPO and PR3 are released by NETosis and are targets of autoantibodies in AAV (39, 40).
Because these analyses are performed using a data-driven hypothesis-free approach, the identified candidate immune cell populations, pro-inflammatory monocytes, and activated Tregs, could be characteristic of SSc and worth further investigation. These results also taught us that even the gene expression data from highly purified bulk immune cells in ImmuNexUT are influenced by changes in the sizes of target immune cell subpopulations.
Single-Cell RNA-Seq of Blood Immune Cells in SLE
The complex immune system involves interactions among multiple types of immune cells. Advances in single-cell RNA-seq technology have allowed comprehensive identification and characterization of distinct immune cell subpopulations at a single-cell resolution (41–44). However, currently available single-cell RNA-seq technologies capture only a few thousand of the most highly expressed genes per cell, resulting in a sparse gene expression picture with higher technical noise compared with bulk-cell RNA-seq technologies.
Nehar-Belaid et al. reported large-scale single-cell RNA-seq profiles (> 350,000 single cells) in the PBMCs of child and adult SLE patients (14), comprising 33 child and 11 adult patients. That study revealed that a small subpopulation of monocytes and other major immune cells expressing high levels of IFN signature genes was expanded and capable of distinguishing SLE from healthy controls. The results imply that enhanced expression of IFN signature genes in peripheral blood in many autoimmune diseases is, in fact, derived from a small subpopulation of high IFN-expressing cells. They also report an expansion of the B cell subpopulation expressing both IFN signatures and extrafollicular, potentially autoreactive, double negative switched memory B cell phenotype (CD27-IgD-CXCR5-CD11c+ DN2 cells) (45). This B cell subpopulation was enriched with monogenic lupus-associated genes, which suggest a causal role of this subpopulation in the SLE. DN2s are closely related to age-associated B cells (ABC), sharing their surface marker CD11c (45). ABCs are implicated in both aging and autoimmunity. In addition, a fraction of SLE CD8+ T cells showed upregulation of cytotoxic genes.
Recently, Perez et al. also reported larger-scale single-cell RNA-seq profiles (>1.2 million single cells) in the PBMC of 162 SLE patients and healthy controls both from European and Asian ancestries (15). They revealed a reduction in naïve CD4+ T cells and an increase of GZMH+CD8+ T cells in SLE. GZMH+CD8+ T cells expressed cytotoxic, exhaustion, and IFN signatures. GZMH+CD8+ T cells were clonally expanded and restricted, and they may have a pathogenic role in the disease process. The presence of an atypical B cell population, sharing some ABC markers (CD11c+TBX21+) was confirmed. Classical monocytes expressed the highest levels of IFN signature. These results support the utility of single-cell RNA-seq technology to identify and characterize disease-relevant subpopulations of immune cells.
Single-Cell RNA-Seq Analysis of Tissue and Proinflammatory Macrophages
Peripheral blood immune cells are popular cell models for transcriptome analyses of autoimmune diseases, probably because of the better access to such cell samples in comparison with immune cells infiltrating affected organs, such as the synovium in RA. However, whether peripheral blood immune cells accurately capture the immunological abnormalities of the affected organs is debated.
In a single-cell profiling experiment of immune cells, Wu et al. simultaneously analyzed peripheral blood and synovial CD45+ mononuclear cells from RA patients with and without anti-citrullinated peptide antibodies (ACPAs), hallmark autoantibodies of RA (46). Peripheral blood analysis revealed important characteristics of RA, such as an expansion of cytotoxic CD4 T cell population (47, 48), while synovial gene profiling revealed correlates of ACPA status, including up-regulation of CCL13, CCL18, and MMP3 in myeloid cell subsets of ACPA-negative RA compared with ACPA-positive RA. Although reports directly comparing the utility of single-cell RNA-seq analysis in blood versus synovium are scarce, synovial immune cell profiling seems more sensitive than peripheral blood profiling in the detection of immunological correlates of RA subpopulations.
As part of the Accelerating Medicines Partnership consortium, Zhang et al. profiled 51 synovial tissue samples from both RA and osteoarthritis patients by combining single-cell RNA-seq, bulk RNA-seq, and mass cytometry data (49). They found expansion of IL1B+ pro-inflammatory monocytes, ITGAX+TBX21+ autoimmune-associated B cells, PDCD1+ peripheral helper T cells (Tph), and follicular helper T cells (Tfh) in the RA synovium. Tph cells are a new subset of helper T cells previously identified in the RA synovium, which can induce plasma cell differentiation in vitro (50). In contrast to classical CXCR5+ Tfh cells, Tph cells lack surface CXCR5 and produce CXCL13 and IL-21 to recruit both Tfh and B cells. Therefore, Tph cells appear to have an important role in the local autoantibody production in the inflamed tissues.
Kuo et al. focused on synovial macrophages and, using single-cell RNA-seq, identified HBEGF+ pro-inflammatory macrophages enriched in the RA synovium (51). This macrophage subpopulation has the capacity to promote fibroblast invasiveness in an EGF receptor-dependent manner. Also, synovial fibroblasts can promote the HBEGF+ inflammatory phenotype of macrophages. The crosstalk between pro-inflammatory macrophages and synovial fibroblasts might be important in the pathophysiology of chronic inflammation in RA joints. Interestingly, synovial pro-inflammatory macrophages express some common gene markers, such as PLAUR, NR4A2, and CXCL2, to those expressed in inflammatory monocytes that we identified in the peripheral blood of patients with SSc (31). This may imply similarities between monocytes and macrophages in the pathophysiology of RA or SSc. Zhang et al. performed integrative single-cell RNA-seq analysis of > 300,000 cells in bronchoalveolar lavage samples from COVID-19, RA, and other inflammatory diseases, all of which exhibited expansion of CXCL10+CCL2+ inflammatory macrophages, experimentally driven by a combination of the pro-inflammatory cytokines IFN-γ and tumor necrosis factor (TNF)-α (52). That study is a good example demonstrating the utility of cross-disease data analysis to reveal shared disease processes, in this case, the expansion of inflammatory macrophage subpopulations in various disease conditions.
Single Cell RNA-Seq Analysis of Lupus Nephritis
In the Accelerating Medicines Partnership consortium, Arazi et al. reported immune cell clusters in lupus nephritis samples (13). Trajectory analysis, based on the similarity of single-cell gene expression, suggested a gradual progression of inflammatory blood monocytes to a phagocytic and then an alternatively activated (M2-like) macrophage phenotype in the kidney. Alternatively, activated (M2) macrophages have an anti-inflammatory function and regulate wound healing (53). Trajectory analysis also revealed a gradual differentiation from naïve B cells to activated B cells with an incremental elevation of the ABC gene signature. They compared the CD8+ T cell exhaustion signatures, previously reported to be associated with lower lupus flares (11), between blood and kidney. The CD8+ T cell exhaustion signature of patients with lupus nephritis was high in blood but not in the kidney. In that report, IFN signature gene expression was correlated between matched blood and kidney samples (n = 10), implying that the IFN response may be an extrarenal process. When comparing urine and kidney leukocytes, the urine samples had a higher frequency of phagocytic macrophages, and high transcriptomic correlations were observed between the samples. Urine cells may serve, at least partially, as an alternative to their kidney counterparts. Der et al. reported tubular and keratinocyte single-cell RNA-seq data (54). They showed that the IFN signatures in tubular cells and keratinocytes distinguished patients with lupus nephritis from healthy control subjects. Moreover, high IFN and fibrotic gene signatures in tubular cells were associated with failure to respond to treatment.
Dynamic eQTL Analysis of Autoimmune Diseases
Genome-wide association studies (GWASs) have identified tens of thousands of gene variants significantly associated with diseases (55). In RA and SLE, large-scale GWASs have identified more than a hundred robust genetic variants associated with each disease (4, 56, 57). However, most of the identified causal genetic variants of these autoimmune diseases are located in non-coding enhancer regions of the genome (58, 59), and their biological mechanisms in autoimmunity are not self-explanatory.
Expression quantitative trait locus (eQTL) analysis evaluates associations between genetic variants and gene expression levels (Figure 2) via linear regression of normalized gene expression levels and the tested allele dosages. Genetic variants associated with diseases have greater eQTL effects compared with other variants (60). The variants can alter the binding capacity of transcription factors to the enhancers or promotors of genes and thus regulate the expression of nearby genes (61). Importantly, eQTL analysis provides directional information on the effects of the tested single nucleotide polymorphisms (SNPs) on target gene expression. In the example in Figure 2, if the G allele of gene X is a GWAS risk SNP, enhanced expression of gene X, especially in stimulated monocytes, is a candidate biological mechanism. The following are limitations of eQTL analysis: large-scale transcriptomic data with typically more than 50–100 samples are required (62); eQTL effects are variable among immune cell types (63, 64) and stimulations (65, 66); overlap of GWAS and eQTL signals do not guarantee causality of the identified genes (67); and only common SNPs (allele frequency > 0.01–0.05) can be tested, while rare variants cannot.
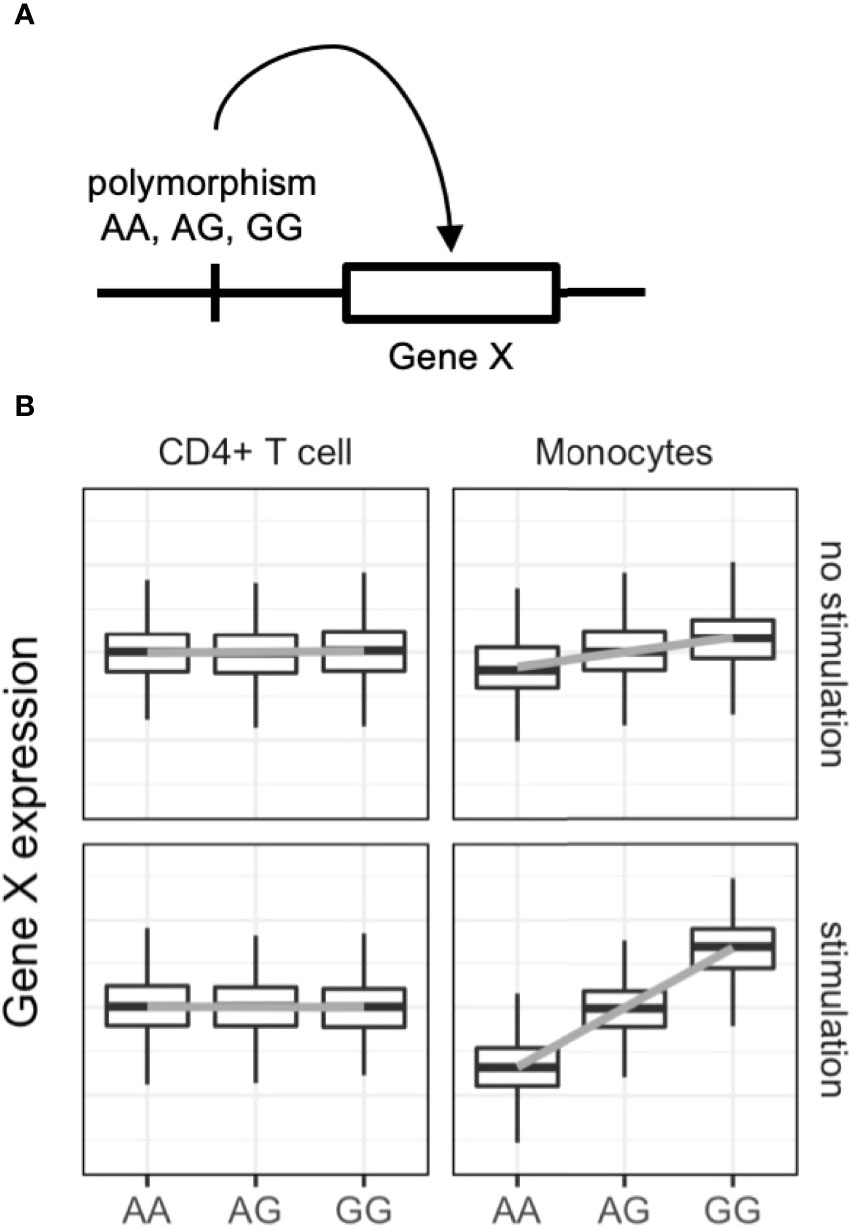
Figure 2 Dynamic eQTL of the immune cells. (A) Schematic representation of expression quantitative trait locus (eQTL) analysis. eQTL is an association test between common single nucleotide polymorphisms and nearby (in most cases) gene expression. (B) An example of dynamic eQTL in immune cells. eQTL effect sizes, expressed as standardized linear regression coefficients, are cell-type and cell-state dependent. In this example stimulated monocytes have four times more eQTL effects compared with unstimulated monocytes.
ImmuNexUT includes samples from more than 400 individuals comprising both healthy controls and immune-mediated disease patients (unstimulated and stimulated immune cells in vivo) and 28 immune cell types (Figure 1). Using eQTL analysis of ImmuNexUT data (6), we identified immune cell-type specific and disease-specific eQTLs. A median of 7,092 genes was significantly regulated by eQTL in each immune cell type. Partitioning of GWAS heritability with cell-type-specific eQTL data revealed candidate causal immune cells in autoimmune diseases: effector Tregs in RA and naïve and unswitched memory B cells in SLE. Colocalization analysis between SLE GWAS and ImmuNexUT eQTL data identified candidate causal genes. For example, decreased expression of ARHGAP31 in plasmablasts was associated with SLE. Those results highlight the power of eQTL analysis in elucidating autoimmune disease mechanisms.
In the OneK1K cohort, Yazar et al. collected PBMC single-cell RNA seq data of 1.27 million cells from 982 healthy donors (68). They identified 14 major immune cell populations and eQTL analysis identified variable number of independent eQTLs (399 in plasma cells and 6473 in naïve and central memory CD4+ T cells). They showed the overlap of various autoimmune GWAS loci and immune cell eQTLs. Also, using single-cell RNA-seq data of SLE patients, Perez et al. performed eQTL analysis in the eight most abundant cell types (15). Their analysis identified 3331 genes with at least one eQTL in a cell type. The advantage of these single-cell RNA-seq based approaches over a bulk RNA-seq based approach is the ability to compute dynamic transcriptional transitions of cellular state using pseudotime analysis. However, cell-type-specific effects of the population with a small fraction size could not be estimated because of the limited number of cells. For example, the cell-type-specific eQTL effects of Treg were not examined in these single-cell RNA-seq eQTL studies, despite the importance of Treg in its ability to regulate autoimmune reactions. Further, Yazar et al. detected fewer eQTL signals in each immune cell type despite the higher number of analyzed individuals (n=982) in comparison to the ImmuNexUT project (n=416). Therefore, the bulk RNA-seq based approach has some advantages in the detection power of immune cell eQTL analysis over the single-cell RNA-seq based approach.
Clinical Application of Transcriptome Analyses
In clinical trials of anifrolumab for SLE, higher baseline levels of IFN signature genes were associated with a better clinical response (18, 19). In those reports, IFN gene signatures, classified as either high or low, were estimated by whole-blood quantitative PCR-based analysis of four genes (IFI27, IFI44, IFI44L, and RSAD2). These results are consistent with the specific binding of anifrolumab to INFAR1. Similarly, baseline protein levels of TNF and soluble interleukin-6 (IL-6) receptor are associated with the response to their respective targeted treatment in RA patients (69, 70). In addition, the B cell subpopulation levels are associated with the treatment responses of B-cell-targeted anti-CD20 rituximab therapy in AAV or SLE patients (71, 72). As seen in these examples, gene or protein expression levels or cell populations appear to be promising candidate biomarkers for predicting treatment responses. However, these biomarkers do not have enough sensitivity or specificity for routine clinical use. One reason might be the use of blood for estimating the biological activity of cytokines because they typically act locally via both autocrine and paracrine manners on other cells (73).
Interestingly, peripheral blood levels of IFN signature genes are associated with the response to RA treatment. For example, high IFN signature gene levels are associated with better responses to treatments with a TNF-α inhibitor (74), the IL-6 receptor inhibitor tocilizumab (75), and the T-cell-blocking CTLA4-Ig abatacept (76). Meanwhile, IFN signature gene levels were associated with non-responsiveness to methotrexate (77) and B-cell-targeting rituximab (78, 79). Those reports imply that the IFN signature status could be used for immunological stratification of RA patients, thereby affecting treatment choice.
Transcriptome analysis of blood samples can capture both cytokine signaling gene expression (e.g., IFN signature) and immune cell-type signature gene expression (e.g., plasmablast signature). Therefore, peripheral blood transcriptome profiling is a candidate approach in precision medicine based on biologically targeted therapies. In addition, the peripheral blood transcriptome can be used to predict the natural history of various autoimmune diseases. In the report by McKinney et al., the “exhaustion signature” of purified CD8+ T cells was associated with a lower number of disease flares in SLE and AAV patients (11). Serial peripheral blood transcriptome analyses have also identified gene signatures preceding RA flares, associated with B cell activation and subsequent expansion of CD45-CD31-PDPN+ pre-inflammatory mesenchymal cells, which show gene expression features similar to those of inflammatory synovial fibroblasts (80). With the establishment of accurate and robust prognostic prediction by transcriptome analysis, treatments can be tailored based on the obtained transcriptomic data.
In RA, several studies have shown that gene expression analysis of joint synovial tissues can identify disease subtypes and predict treatment responses (81–84). Humby et al. combined gene expression with immunohistological analyses of the synovium in treatment-naïve early-stage RA patients (82). Three groups of patients were identified according to the synovial tissue phenotype: pauci-immune fibroid, diffuse-myeloid, and lympho-myeloid patients. Elevation of myeloid- and lymphoid-associated gene expression was strongly correlated with disease activity and the treatment (90% methotrexate) response at six months. Lewis et al. also profiled early RA-associated genes using RNA-seq and showed that the gene signature of synovial plasma cells predicts future joint damage (83). In addition, they compared the blood and synovial RNA-seq data and showed that synovial genes are more differentially expressed among the different synovial tissue phenotypes. In addition, the blood IFN signature was associated with synovial B and plasma cell infiltration, which may at least partially explain the correlation between the blood IFN signature and treatment effects (78). Finally, Humby et al. reported a clinical trial comparing the effects of the anti-CD20 monoclonal antibody rituximab and anti-IL6 receptor tocilizumab in non-responders to anti-TNF therapy (84). Baseline synovial biopsies were subjected to classical histological and RNA-seq analyses to classify the samples as B-cell rich or poor. In B-cell-poor RA, tocilizumab treatment had a better response rate than that of B-cell targeted rituximab therapy. An important finding of that study was that RNA-seq-based classification was better correlated to the treatment response than was histological classification. Currently, synovial biopsies are not standard clinical practice for RA, but they might become such, considering the limited invasiveness of the biopsy procedure and potential benefits of precision medicine based on the molecular disease subtype.
Conclusion
Here, we reviewed how the transcriptome analysis of immune cells has improved our understanding of the pathophysiology of autoimmune diseases with a focus on the ImmuNexUT analysis that we recently reported. Single-cell RNA-seq analyses have been expanding our knowledge of the immune cells infiltrating disease lesions. Inflammatory monocytes and macrophages are expanded across various autoimmune and inflammatory diseases. IFN pathway, neutrophils, and B cell subpopulations have been robust signatures in SLE in different experimental and analytic methods (Table 1). These cell populations could have pathophysiological relevance to autoimmune diseases. Expression QTL analysis, integrated with GWAS data, has identified candidate causal immune cells and genes. Genes identified by transcriptome analyses of the peripheral blood or the RA synovium can be used as clinical predictive or prognostic biomarkers. Therefore, transcriptome analysis of autoimmune diseases is not only a useful tool for the investigation of disease mechanisms but also has the potential for direct clinical application in future precision medicine.
Author Contributions
YN, HY, and KF conceived and designed the study concept. YN wrote the original manuscript draft. HY and KF reviewed and edited the manuscript. All authors contributed to the article and approved the submitted version.
Funding
This work was supported by JSPS KAKENHI Grant Number 19K16973, GSK Japan Research Grant 2020, and the Social Cooperation Program, Department of Functional Genomics and Immunological Diseases, supported by Chugai Pharmaceutical. The funders were not involved in the study design, collection, analysis, interpretation of data, the writing of this article or the decision to submit it for publication.
Conflict of Interest
YN belongs to the Social Cooperation Program, Department of Functional Genomics and Immunological Diseases, supported by Chugai Pharmaceutical, and has received financial support and/or speaking fees from BMS, Chugai, GlaxoSmithKline, Kissei, Mitsubishi Tanabe, and Pfizer. KF has received speaking fees and/or honoraria from Tanabe Mitsubishi, Bristol Myers, Eli Lilly, Chugai, Jansen, Pfizer, Ono, AbbVie, Ayumi, Astellas, Sanofi, Novartis, Daiichi Sankyo, Eisai, Asahi Kasei, Japan Blood Products Organization, and Kowa, and has received research grants from Tanabe Mitsubishi, Bristol Myers, Eli Lilly, Chugai, AbbVie, Ayumi, Astellas, Sanofi, Eisai, Tsumura and Co., and Asahi Kasei. The remaining author declares that the research was conducted in the absence of any commercial or financial relationships that could be construed as a potential conflict of interest.
Publisher’s Note
All claims expressed in this article are solely those of the authors and do not necessarily represent those of their affiliated organizations, or those of the publisher, the editors and the reviewers. Any product that may be evaluated in this article, or claim that may be made by its manufacturer, is not guaranteed or endorsed by the publisher.
Acknowledgments
We would like to thank all of the participants who have contributed to our research program and all the members of the ImmuNexUT consortium for their generous support and critical discussions.
References
1. Ma WT, Gao F, Gu K, Chen DK. The Role of Monocytes and Macrophages in Autoimmune Diseases: A Comprehensive Review. Front Immunol (2019) 10:1140. doi: 10.3389/fimmu.2019.01140
2. Navegantes KC, de Souza Gomes R, Pereira PAT, Czaikoski PG, Azevedo CHM, Monteiro MC. Immune Modulation of Some Autoimmune Diseases: The Critical Role of Macrophages and Neutrophils in the Innate and Adaptive Immunity. J Transl Med (2017) 15(1):36. doi: 10.1186/s12967-017-1141-8
3. Lisnevskaia L, Murphy G, Isenberg D. Systemic Lupus Erythematosus. Lancet (2014) 384(9957):1878–88. doi: 10.1016/s0140-6736(14)60128-8
4. Wang YF, Zhang Y, Lin Z, Zhang H, Wang TY, Cao Y, et al. Identification of 38 Novel Loci for Systemic Lupus Erythematosus and Genetic Heterogeneity Between Ancestral Groups. Nat Commun (2021) 12(1):772. doi: 10.1038/s41467-021-21049-y
5. Deapen D, Escalante A, Weinrib L, Horwitz D, Bachman B, Roy-Burman P, et al. A Revised Estimate of Twin Concordance in Systemic Lupus Erythematosus. Arthritis Rheum (1992) 35(3):311–8. doi: 10.1002/art.1780350310
6. Ota M, Nagafuchi Y, Hatano H, Ishigaki K, Terao C, Takeshima Y, et al. Dynamic Landscape of Immune Cell-Specific Gene Regulation in Immune-Mediated Diseases. Cell (2021) 184(11):3006–21. doi: 10.1016/j.cell.2021.03.056
7. Bennett L, Palucka AK, Arce E, Cantrell V, Borvak J, Banchereau J, et al. Interferon and Granulopoiesis Signatures in Systemic Lupus Erythematosus Blood. J Exp Med (2003) 197(6):711–23. doi: 10.1084/jem.20021553
8. Baechler EC, Batliwalla FM, Karypis G, Gaffney PM, Ortmann WA, Espe KJ, et al. Interferon-Inducible Gene Expression Signature in Peripheral Blood Cells of Patients With Severe Lupus. Proc Natl Acad Sci USA (2003) 100(5):2610–5. doi: 10.1073/pnas.0337679100
9. Chaussabel D, Quinn C, Shen J, Patel P, Glaser C, Baldwin N, et al. A Modular Analysis Framework for Blood Genomics Studies: Application to Systemic Lupus Erythematosus. Immunity (2008) 29(1):150–64. doi: 10.1016/j.immuni.2008.05.012
10. Lyons PA, McKinney EF, Rayner TF, Hatton A, Woffendin HB, Koukoulaki M, et al. Novel Expression Signatures Identified by Transcriptional Analysis of Separated Leucocyte Subsets in Systemic Lupus Erythematosus and Vasculitis. Ann Rheum Dis (2010) 69(6):1208–13. doi: 10.1136/ard.2009.108043
11. McKinney EF, Lee JC, Jayne DR, Lyons PA, Smith KG. T-Cell Exhaustion, Co-Stimulation and Clinical Outcome in Autoimmunity and Infection. Nature (2015) 523(7562):612–6. doi: 10.1038/nature14468
12. Banchereau R, Hong S, Cantarel B, Baldwin N, Baisch J, Edens M, et al. Personalized Immunomonitoring Uncovers Molecular Networks That Stratify Lupus Patients. Cell (2016) 165(3):551–65. doi: 10.1016/j.cell.2016.03.008
13. Arazi A, Rao DA, Berthier CC, Davidson A, Liu Y, Hoover PJ, et al. The Immune Cell Landscape in Kidneys of Patients With Lupus Nephritis. Nat Immunol (2019) 20(7):902–14. doi: 10.1038/s41590-019-0398-x
14. Nehar-Belaid D, Hong S, Marches R, Chen G, Bolisetty M, Baisch J, et al. Mapping Systemic Lupus Erythematosus Heterogeneity at the Single-Cell Level. Nat Immunol (2020) 21(9):1094–106. doi: 10.1038/s41590-020-0743-0
15. Perez RK, Gordon MG, Subramaniam M, Kim MC, Hartoularos GC, Targ S, et al. Single-Cell RNA-Seq Reveals Cell Type-Specific Molecular and Genetic Associations to Lupus. Science (2022) 376(6589):eabf1970. doi: 10.1126/science.abf1970
16. Barrat FJ, Crow MK, Ivashkiv LB. Interferon Target-Gene Expression and Epigenomic Signatures in Health and Disease. Nat Immunol (2019) 20(12):1574–83. doi: 10.1038/s41590-019-0466-2
17. Munroe ME, Lu R, Zhao YD, Fife DA, Robertson JM, Guthridge JM, et al. Altered Type II Interferon Precedes Autoantibody Accrual and Elevated Type I Interferon Activity Prior to Systemic Lupus Erythematosus Classification. Ann Rheum Dis (2016) 75(11):2014–21. doi: 10.1136/annrheumdis-2015-208140
18. Morand EF, Furie R, Tanaka Y, Bruce IN, Askanase AD, Richez C, et al. Trial of Anifrolumab in Active Systemic Lupus Erythematosus. N Engl J Med (2020) 382(3):211–21. doi: 10.1056/NEJMoa1912196
19. Furie R, Khamashta M, Merrill JT, Werth VP, Kalunian K, Brohawn P, et al. Anifrolumab, an Anti-Interferon-Alpha Receptor Monoclonal Antibody, in Moderate-To-Severe Systemic Lupus Erythematosus. Arthritis Rheumatol (2017) 69(2):376–86. doi: 10.1002/art.39962
20. Lübbers J, Brink M, van de Stadt LA, Vosslamber S, Wesseling JG, van Schaardenburg D, et al. The Type I IFN Signature as a Biomarker of Preclinical Rheumatoid Arthritis. Ann Rheum Dis (2013) 72(5):776–80. doi: 10.1136/annrheumdis-2012-202753
21. van der Pouw Kraan TC, Wijbrandts CA, van Baarsen LG, Voskuyl AE, Rustenburg F, Baggen JM, et al. Rheumatoid Arthritis Subtypes Identified by Genomic Profiling of Peripheral Blood Cells: Assignment of a Type I Interferon Signature in a Subpopulation of Patients. Ann Rheum Dis (2007) 66(8):1008–14. doi: 10.1136/ard.2006.063412
22. Higgs BW, Liu Z, White B, Zhu W, White WI, Morehouse C, et al. Patients With Systemic Lupus Erythematosus, Myositis, Rheumatoid Arthritis and Scleroderma Share Activation of a Common Type I Interferon Pathway. Ann Rheum Dis (2011) 70(11):2029–36. doi: 10.1136/ard.2011.150326
23. Båve U, Nordmark G, Lövgren T, Rönnelid J, Cajander S, Eloranta ML, et al. Activation of the Type I Interferon System in Primary Sjögren's Syndrome: A Possible Etiopathogenic Mechanism. Arthritis Rheum (2005) 52(4):1185–95. doi: 10.1002/art.20998
24. McInnes IB, Schett G. The Pathogenesis of Rheumatoid Arthritis. N Engl J Med (2011) 365(23):2205–19. doi: 10.7748/phc2011.11.21.9.29.c8797
25. Mortazavi A, Williams BA, McCue K, Schaeffer L, Wold B. Mapping and Quantifying Mammalian Transcriptomes by RNA-Seq. Nat Methods (2008) 5(7):621–8. doi: 10.1038/nmeth.1226
26. Tyndall AJ, Bannert B, Vonk M, Airò P, Cozzi F, Carreira PE, et al. Causes and Risk Factors for Death in Systemic Sclerosis: A Study From the EULAR Scleroderma Trials and Research (EUSTAR) Database. Ann Rheum Dis (2010) 69(10):1809–15. doi: 10.1136/ard.2009.114264
27. Nombel A, Fabien N, Coutant F. Dermatomyositis With Anti-MDA5 Antibodies: Bioclinical Features, Pathogenesis and Emerging Therapies. Front Immunol (2021) 12:773352. doi: 10.3389/fimmu.2021.773352
28. Denton CP, Khanna D. Systemic Sclerosis. Lancet (2017) 390(10103):1685–99. doi: 10.1016/s0140-6736(17)30933-9
29. Skaug B, Khanna D, Swindell WR, Hinchcliff ME, Frech TM, Steen VD, et al. Global Skin Gene Expression Analysis of Early Diffuse Cutaneous Systemic Sclerosis Shows a Prominent Innate and Adaptive Inflammatory Profile. Ann Rheum Dis (2020) 79(3):379–86. doi: 10.1136/annrheumdis-2019-215894
30. Valenzi E, Bulik M, Tabib T, Morse C, Sembrat J, Trejo Bittar H, et al. Single-Cell Analysis Reveals Fibroblast Heterogeneity and Myofibroblasts in Systemic Sclerosis-Associated Interstitial Lung Disease. Ann Rheum Dis (2019) 78(10):1379–87. doi: 10.1136/annrheumdis-2018-214865
31. Kobayashi S, Nagafuchi Y, Okubo M, Sugimori Y, Shirai H, Hatano H, et al. Integrated Bulk and Single-Cell RNA-Sequencing Identified Disease-Relevant Monocytes and a Gene Network Module Underlying Systemic Sclerosis. J Autoimmun (2021) 116:102547. doi: 10.1016/j.jaut.2020.102547
32. Moreno-Moral A, Bagnati M, Koturan S, Ko JH, Fonseca C, Harmston N, et al. Changes in Macrophage Transcriptome Associate With Systemic Sclerosis and Mediate GSDMA Contribution to Disease Risk. Ann Rheum Dis (2018) 77(4):596–601. doi: 10.1136/annrheumdis-2017-212454
33. Satoh T, Nakagawa K, Sugihara F, Kuwahara R, Ashihara M, Yamane F, et al. Identification of an Atypical Monocyte and Committed Progenitor Involved in Fibrosis. Nature (2017) 541(7635):96–101. doi: 10.1038/nature20611
34. Scott MKD, Quinn K, Li Q, Carroll R, Warsinske H, Vallania F, et al. Increased Monocyte Count as a Cellular Biomarker for Poor Outcomes in Fibrotic Diseases: A Retrospective, Multicentre Cohort Study. Lancet Respir Med (2019) 7(6):497–508. doi: 10.1016/s2213-2600(18)30508-3
35. Kobayashi S, Nagafuchi Y, Okubo M, Sugimori Y, Hatano H, Yamada S, et al. Dysregulation of the Gene Signature of Effector Regulatory T Cells in the Early Phase of Systemic Sclerosis. Rheumatol (Oxford) (2022) 18:keac031. doi: 10.1093/rheumatology/keac031
36. Newman AM, Steen CB, Liu CL, Gentles AJ, Chaudhuri AA, Scherer F, et al. Determining Cell Type Abundance and Expression From Bulk Tissues With Digital Cytometry. Nat Biotechnol (2019) 37(7):773–82. doi: 10.1038/s41587-019-0114-2
37. Zhang M, Zhang S. T Cells in Fibrosis and Fibrotic Diseases. Front Immunol (2020) 11:1142. doi: 10.3389/fimmu.2020.01142
38. Yanaoka H, Nagafuchi Y, Hanata N, Takeshima Y, Ota M, Suwa Y, et al. Identifying the Most Influential Gene Expression Profile in Distinguishing ANCA-Associated Vasculitis From Healthy Controls. J Autoimmun (2021) 119:102617. doi: 10.1016/j.jaut.2021.102617
39. Kessenbrock K, Krumbholz M, Schonermarck U, Back W, Gross WL, Werb Z, et al. Netting Neutrophils in Autoimmune Small-Vessel Vasculitis. Nat Med (2009) 15(6):623–5. doi: 10.1038/nm.1959
40. Sangaletti S, Tripodo C, Chiodoni C, Guarnotta C, Cappetti B, Casalini P, et al. Neutrophil Extracellular Traps Mediate Transfer of Cytoplasmic Neutrophil Antigens to Myeloid Dendritic Cells Toward ANCA Induction and Associated Autoimmunity. Blood (2012) 120(15):3007–18. doi: 10.1182/blood-2012-03-416156
41. Donlin LT, Park SH, Giannopoulou E, Ivovic A, Park-Min KH, Siegel RM, et al. Insights Into Rheumatic Diseases From Next-Generation Sequencing. Nat Rev Rheumatol (2019) 15(6):327–39. doi: 10.1038/s41584-019-0217-7
42. Giladi A, Amit I. Single-Cell Genomics: A Stepping Stone for Future Immunology Discoveries. Cell (2018) 172(1-2):14–21. doi: 10.1016/j.cell.2017.11.011
43. Zhao M, Jiang J, Chang C, Wu H, Lu Q. The Application of Single-Cell RNA Sequencing in Studies of Autoimmune Diseases: A Comprehensive Review. Clin Rev Allergy Immunol (2021) 60(1):68–86. doi: 10.1007/s12016-020-08813-6
44. Papalexi E, Satija R. Single-Cell RNA Sequencing to Explore Immune Cell Heterogeneity. Nat Rev Immunol (2018) 18(1):35–45. doi: 10.1038/nri.2017.76
45. Jenks SA, Cashman KS, Zumaquero E, Marigorta UM, Patel AV, Wang X, et al. Distinct Effector B Cells Induced by Unregulated Toll-Like Receptor 7 Contribute to Pathogenic Responses in Systemic Lupus Erythematosus. Immunity (2018) 49(4):725–39.e6. doi: 10.1016/j.immuni.2018.08.015
46. Wu X, Liu Y, Jin S, Wang M, Jiao Y, Yang B, et al. Single-Cell Sequencing of Immune Cells From Anticitrullinated Peptide Antibody Positive and Negative Rheumatoid Arthritis. Nat Commun (2021) 12(1):4977. doi: 10.1038/s41467-021-25246-7
47. Fonseka CY, Rao DA, Teslovich NC, Korsunsky I, Hannes SK, Slowikowski K, et al. Mixed-Effects Association of Single Cells Identifies an Expanded Effector CD4(+) T Cell Subset in Rheumatoid Arthritis. Sci Transl Med (2018) 10(463):eaaq0305. doi: 10.1126/scitranslmed.aaq0305
48. van de Berg PJ, van Leeuwen EM, ten Berge IJ, van Lier R. Cytotoxic Human CD4(+) T Cells. Curr Opin Immunol (2008) 20(3):339–43. doi: 10.1016/j.coi.2008.03.007
49. Zhang F, Wei K, Slowikowski K, Fonseka CY, Rao DA, Kelly S, et al. Defining Inflammatory Cell States in Rheumatoid Arthritis Joint Synovial Tissues by Integrating Single-Cell Transcriptomics and Mass Cytometry. Nat Immunol (2019) 20(7):928–42. doi: 10.1038/s41590-019-0378-1
50. Rao DA, Gurish MF, Marshall JL, Slowikowski K, Fonseka CY, Liu Y, et al. Pathologically Expanded Peripheral T Helper Cell Subset Drives B Cells in Rheumatoid Arthritis. Nature (2017) 542(7639):110–4. doi: 10.1038/nature20810
51. Kuo D, Ding J, Cohn IS, Zhang F, Wei K, Rao DA, et al. HBEGF + Macrophages in Rheumatoid Arthritis Induce Fibroblast Invasiveness. Sci Transl Med (2019) 11(491):eaau8587. doi: 10.1126/scitranslmed.aau8587
52. Zhang F, Mears JR, Shakib L, Beynor JI, Shanaj S, Korsunsky I, et al. IFN-γ and TNF-α Drive a CXCL10+ CCL2+ Macrophage Phenotype Expanded in Severe COVID-19 Lungs and Inflammatory Diseases With Tissue Inflammation. Genome Med (2021) 13(1):64. doi: 10.1186/s13073-021-00881-3
53. Murray PJ, Wynn TA. Protective and Pathogenic Functions of Macrophage Subsets. Nat Rev Immunol (2011) 11(11):723–37. doi: 10.1038/nri3073
54. Der E, Suryawanshi H, Morozov P, Kustagi M, Goilav B, Ranabothu S, et al. Tubular Cell and Keratinocyte Single-Cell Transcriptomics Applied to Lupus Nephritis Reveal Type I IFN and Fibrosis Relevant Pathways. Nat Immunol (2019) 20(7):915–27. doi: 10.1038/s41590-019-0386-1
55. Buniello A, MacArthur JAL, Cerezo M, Harris LW, Hayhurst J, Malangone C, et al. The NHGRI-EBI GWAS Catalog of Published Genome-Wide Association Studies, Targeted Arrays and Summary Statistics 2019. Nucleic Acids Res (2019) 47(D1):D1005–12. doi: 10.1093/nar/gky1120
56. Okada Y, Wu D, Trynka G, Raj T, Terao C, Ikari K, et al. Genetics of Rheumatoid Arthritis Contributes to Biology and Drug Discovery. Nature (2014) 506(7488):376–81. doi: 10.1038/nature12873
57. Yin X, Kim K, Suetsugu H, Bang SY, Wen L, Koido M, et al. Meta-Analysis of 208370 East Asians Identifies 113 Susceptibility Loci for Systemic Lupus Erythematosus. Ann Rheum Dis (2021) 80(5):632–40. doi: 10.1136/annrheumdis-2020-219209
58. Farh KK, Marson A, Zhu J, Kleinewietfeld M, Housley WJ, Beik S, et al. Genetic and Epigenetic Fine Mapping of Causal Autoimmune Disease Variants. Nature (2015) 518(7539):337–43. doi: 10.1038/nature13835[doi
59. Finucane HK, Bulik-Sullivan B, Gusev A, Trynka G, Reshef Y, Loh PR, et al. Partitioning Heritability by Functional Annotation Using Genome-Wide Association Summary Statistics. Nat Genet (2015) 47(11):1228–35. doi: 10.1038/ng.3404
60. Nicolae DL, Gamazon E, Zhang W, Duan S, Dolan ME, Cox NJ. Trait-Associated SNPs are More Likely to be eQTLs: Annotation to Enhance Discovery From GWAS. PloS Genet (2010) 6(4):e1000888. doi: 10.1371/journal.pgen.1000888
61. Albert FW, Kruglyak L. The Role of Regulatory Variation in Complex Traits and Disease. Nat Rev Genet (2015) 16(4):197–212. doi: 10.1038/nrg3891
62. Consortium G. The GTEx Consortium Atlas of Genetic Regulatory Effects Across Human Tissues. Science (2020) 369(6509):1318–30. doi: 10.1126/science.aaz1776
63. Schmiedel BJ, Singh D, Madrigal A, Valdovino-Gonzalez AG, White BM, Zapardiel-Gonzalo J, et al. Impact of Genetic Polymorphisms on Human Immune Cell Gene Expression. Cell (2018) 175(6):1701–15.e16. doi: 10.1016/j.cell.2018.10.022
64. Ishigaki K, Kochi Y, Suzuki A, Tsuchida Y, Tsuchiya H, Sumitomo S, et al. Polygenic Burdens on Cell-Specific Pathways Underlie the Risk of Rheumatoid Arthritis. Nat Genet (2017) 49(7):1120–5. doi: 10.1038/ng.3885
65. Ye CJ, Feng T, Kwon HK, Raj T, Wilson MT, Asinovski N, et al. Intersection of Population Variation and Autoimmunity Genetics in Human T Cell Activation. Science (2014) 345(6202):1254665. doi: 10.1126/science.1254665
66. Fairfax BP, Humburg P, Makino S, Naranbhai V, Wong D, Lau E, et al. Innate Immune Activity Conditions the Effect of Regulatory Variants Upon Monocyte Gene Expression. Science (2014) 343(6175):1246949. doi: 10.1126/science.1246949
67. Chun S, Casparino A, Patsopoulos NA, Croteau-Chonka DC, Raby BA, De Jager PL, et al. Limited Statistical Evidence for Shared Genetic Effects of eQTLs and Autoimmune-Disease-Associated Loci in Three Major Immune-Cell Types. Nat Genet (2017) 49(4):600–5. doi: 10.1038/ng.3795
68. Yazar S, Alquicira-Hernandez J, Wing K, Senabouth A, Gordon MG, Andersen S, et al. Single-Cell eQTL Mapping Identifies Cell Type-Specific Genetic Control of Autoimmune Disease. Science (2022) 376(6589):eabf3041. doi: 10.1126/science.abf3041
69. Takeuchi T, Miyasaka N, Tatsuki Y, Yano T, Yoshinari T, Abe T, et al. Baseline Tumour Necrosis Factor Alpha Levels Predict the Necessity for Dose Escalation of Infliximab Therapy in Patients With Rheumatoid Arthritis. Ann Rheum Dis (2011) 70(7):1208–15. doi: 10.1136/ard.2011.153023
70. Nishina N, Kikuchi J, Hashizume M, Yoshimoto K, Kameda H, Takeuchi T. Baseline Levels of Soluble Interleukin-6 Receptor Predict Clinical Remission in Patients With Rheumatoid Arthritis Treated With Tocilizumab: Implications for Molecular Targeted Therapy. Ann Rheum Dis (2014) 73(5):945–7. doi: 10.1136/annrheumdis-2013-204137
71. Md Yusof MY, Vital EM, Das S, Arumugakani G, Savic S, et al. Repeat Cycles of Rituximab on Clinical Relapse in ANCA-Associated Vasculitis: Identifying B cell Biomarkers for Relapse to Guide Retreatment Decisions. Ann Rheum Dis (2015) 74(9):1734–8. doi: 10.1136/annrheumdis-2014-206496
72. Md Yusof MY, Shaw D, El-Sherbiny YM, Dunn E, Rawstron AC, Emery P, et al. Predicting and Managing Primary and Secondary non-Response to Rituximab Using B-Cell Biomarkers in Systemic Lupus Erythematosus. Ann Rheum Dis (2017) 76(11):1829–36. doi: 10.1136/annrheumdis-2017-211191
73. Lin JX, Leonard WJ. Fine-Tuning Cytokine Signals. Annu Rev Immunol (2019) 37:295–324. doi: 10.1146/annurev-immunol-042718-041447
74. Wright HL, Thomas HB, Moots RJ, Edwards SW. Interferon Gene Expression Signature in Rheumatoid Arthritis Neutrophils Correlates With a Good Response to TNFi Therapy. Rheumatol (Oxford) (2015) 54(1):188–93. doi: 10.1093/rheumatology/keu299
75. Sanayama Y, Ikeda K, Saito Y, Kagami S, Yamagata M, Furuta S, et al. Prediction of Therapeutic Responses to Tocilizumab in Patients With Rheumatoid Arthritis: Biomarkers Identified by Analysis of Gene Expression in Peripheral Blood Mononuclear Cells Using Genome-Wide DNA Microarray. Arthritis Rheumatol (2014) 66(6):1421–31. doi: 10.1002/art.38400
76. Yokoyama-Kokuryo W, Yamazaki H, Takeuchi T, Amano K, Kikuchi J, Kondo T, et al. Identification of Molecules Associated With Response to Abatacept in Patients With Rheumatoid Arthritis. Arthritis Res Ther (2020) 22(1):46. doi: 10.1186/s13075-020-2137-y
77. Plant D, Maciejewski M, Smith S, Nair N, Hyrich K, Ziemek D, et al. Maximising Therapeutic Utility in Rheumatoid Arthritis Consortium: Profiling of Gene Expression Biomarkers as a Classifier of Methotrexate Nonresponse in Patients With Rheumatoid Arthritis. Arthritis Rheumatol (2019) 71(5):678–84. doi: 10.1002/art.40810
78. Sellam J, Marion-Thore S, Dumont F, Jacques S, Garchon HJ, Rouanet S, et al. Use of Whole-Blood Transcriptomic Profiling to Highlight Several Pathophysiologic Pathways Associated With Response to Rituximab in Patients With Rheumatoid Arthritis: Data From a Randomized, Controlled, Open-Label Trial. Arthritis Rheumatol (2014) 66(8):2015–25. doi: 10.1002/art.38671
79. Raterman HG, Vosslamber S, de Ridder S, Nurmohamed MT, Lems WF, Boers M, et al. The Interferon Type I Signature Towards Prediction of non-Response to Rituximab in Rheumatoid Arthritis Patients. Arthritis Res Ther (2012) 14(2):R95. doi: 10.1186/ar3819
80. Orange DE, Yao V, Sawicka K, Fak J, Frank MO, Parveen S, et al. RNA Identification of PRIME Cells Predicting Rheumatoid Arthritis Flares. N Engl J Med (2020) 383(3):218–28. doi: 10.1056/NEJMoa2004114
81. Dennis G, Holweg CT, Kummerfeld SK, Choy DF, Setiadi AF, Hackney JA, et al. Synovial Phenotypes in Rheumatoid Arthritis Correlate With Response to Biologic Therapeutics. Arthritis Res Ther (2014) 16(2):R90. doi: 10.1186/ar4555
82. Humby F, Lewis M, Ramamoorthi N, Hackney JA, Barnes MR, Bombardieri M, et al. Synovial Cellular and Molecular Signatures Stratify Clinical Response to csDMARD Therapy and Predict Radiographic Progression in Early Rheumatoid Arthritis Patients. Ann Rheum Dis (2019) 78(6):761–72. doi: 10.1136/annrheumdis-2018-214539
83. Lewis MJ, Barnes MR, Blighe K, Goldmann K, Rana S, Hackney JA, et al. Molecular Portraits of Early Rheumatoid Arthritis Identify Clinical and Treatment Response Phenotypes. Cell Rep (2019) 28(9):2455–70.e5. doi: 10.1016/j.celrep.2019.07.091
84. Humby F, Durez P, Buch MH, Lewis MJ, Rizvi H, Rivellese F, et al. Rituximab Versus Tocilizumab in Anti-TNF Inadequate Responder Patients With Rheumatoid Arthritis (R4RA): 16-Week Outcomes of a Stratified, Biopsy-Driven, Multicentre, Open-Label, Phase 4 Randomised Controlled Trial. Lancet (2021) 397(10271):305–17. doi: 10.1016/S0140-6736(20)32341-2
Keywords: transcriptome, eQTL, autoimmune disease, immune cell, monocytes, macrophages, systemic lupus erythematosus, rheumatoid arthritis
Citation: Nagafuchi Y, Yanaoka H and Fujio K (2022) Lessons From Transcriptome Analysis of Autoimmune Diseases. Front. Immunol. 13:857269. doi: 10.3389/fimmu.2022.857269
Received: 18 January 2022; Accepted: 20 April 2022;
Published: 18 May 2022.
Edited by:
Maria I. Bokarewa, University of Gothenburg, SwedenReviewed by:
Sun Jung Kim, Northwell Health, United StatesKarine Chemin, Karolinska University Laboratory, Sweden
Copyright © 2022 Nagafuchi, Yanaoka and Fujio. This is an open-access article distributed under the terms of the Creative Commons Attribution License (CC BY). The use, distribution or reproduction in other forums is permitted, provided the original author(s) and the copyright owner(s) are credited and that the original publication in this journal is cited, in accordance with accepted academic practice. No use, distribution or reproduction is permitted which does not comply with these terms.
*Correspondence: Yasuo Nagafuchi, bmFnYWZ1Y2hpQGcuZWNjLnUtdG9reW8uYWMuanA=