Abstract
Traditional observational studies have indicated a link between specific food intakes and inflammatory bowel disease (IBD), but the nature of such links remains unknown. We sought to assess the potential causal relationship between food intakes and IBD risk using Mendelian randomization methods. This study used summary statistics data from large-scale genome-wide association studies (GWAS) on food intakes, Crohn’s disease (CD), and ulcerative colitis (UC). In the primary analysis, we used the inverse variance-weighted method to determine whether specific food was causal for CD and UC. In addition, we also ran four other Mendelian randomization methods, including MR Egger, weighted median, maximum likelihood, and weighted mode as a complement. The primary analysis showed that high consumption of poultry (OR, 3.696; 95% CI, 1.056–12.937; p = 0.041) and cereal (OR, 2.449; 95% CI, 1.094–5.482; p = 0.029) had a significant causal association with CD, while high oily fish intake level was found to be statistically significantly associated with the risk of UC (OR, 1.482; 95% CI, 1.002–2.194; p = 0.049). This MR study provides evidence of a potential causal link between certain food intake and CD and UC.
Introduction
Inflammatory bowel disease (IBD), including Crohn’s disease (CD) and ulcerative colitis (UC), is a multifactorial disease characterized by a deregulated immune response to environmental and microbial components on a genetic susceptibility background (1). While several environmental factors participate in the pathogenesis and progression of IBD, the role of diet has attracted considerable attention. Although the exact mechanism remains uncertain, it has been proposed that certain food intake may modify the risk of IBD through its impact on host immunity system, gut barrier, and gut microbiome, all of which are critical factors in IBD pathogenesis (2–6). Many food risk factors have been established to be associated with IBD pathogenesis, especially the components of a Western diet, which is known to be high in fat, n-6 polyunsaturated fatty acids (PUFAs), and red and processed meat, and low in fruits and vegetables (7).
While a few studies have identified some food risk factors for IBD progression, insufficient evidence supports their causal roles in IBD incidence. Some cross-sectional studies were conducted to determine the diet responsible for IBD incidence. These observations, however, might be confounded by unidentified factors and therefore contradict the causality of the associations. RCTs are the gold standard for determining a causal relationship (8, 9). However, due to ethical constraints, an RCT is difficult to implement in most cases. Mendelian randomization (MR) analysis can help overcome these limitations. In MR analysis, genetic variants such as single-nucleotide polymorphisms (SNPs) are used as instrumental variables (IVs) to estimate the causal associations between an exposure and an outcome (10). Since genetic variation is inherited from parents and remains unchanged after birth, the association between genetic variation and outcome is reasonable. MR analysis relies on three critical assumptions: (i) IVs are strongly associated with exposure; (ii) IVs should be independent of confounders of exposure and outcome; and (iii) IV–outcome association is only mediated via exposure (10).
Understanding the exact role of foods in IBD risk may be helpful to develop more effective prevention, prediction, and treatment strategies for essential conditions. Therefore, we applied the MR method to analyze the causal relationships between food intakes and two IBD subtypes, CD and UC.
Methods
Data sources
Genome-wide association studies of food intakes
A flowchart describes the study design briefly (Figure 1). For summary statistics for food intakes, we used data from the UK Biobank (UKB). The UKB project is a large, prospective cohort study with about 500,000 participants from the United Kingdom (11).
Figure 1

Flowchart of MR analysis in this study. IBD, inflammatory bowel disease; CD, Crohn’s disease; UC, ulcerative colitis; MAF, minor allele frequency; IVs, instrumental variables; SNPs, single-nucleotide polymorphisms; MR analysis, Mendelian randomization analysis.
Genome-wide association studies of CD and UC
For CD and UC, we used publicly available meta-analysis GWAS (12). GWAS of CD (ebi-a-GCST004132) included 12,194 cases and 28,072 control subjects, and GWAS of UC (ebi-a-GCST004133) included 12,366 cases and 33,609 control subjects.
Genetic IV selection
We selected eligible genetic IVs using a series of quality control criteria based on the GWAS summary food data. First, we used independent genetic variants significantly associated (p < 5 × 10⁻⁸) for each instrument with each exposure. Then, we performed the clumping procedure with R2 < 0.001 and a window size >10,000 kb to avoid linkage disequilibrium (LD) (13). Third, we eliminated SNPs with a minor allele frequency (MAF) of less than 0.01. Fourth, to prevent potential pleiotropic effects for the instruments, we used Phenoscanner, a database that includes genotype–phenotype associations (14). We searched for each SNP included as an instrument in our analysis and removed SNPs associated with IBD, CD, or UC. SNP harmonization was also performed to rectify the orientation of the alleles (15).
Evaluation of the strength of the genetic instruments
To assess the strength of genetic instruments for each food intake, we calculated the proportion of variance explained (R2) and F statistics for all SNPs. IVs (F statistics < 10) were considered weak instruments, and the exposure would be excluded from MR analysis (16).
Pleiotropy, heterogeneity, and sensitivity analysis
MR Egger regression was used to assess the possibility of horizontal pleiotropy, as indicated by the intercept (17). In the presence of pleiotropy (p ≤ 0.05), MR Pleiotropy REsidual Sum and Outlier (MR-PRESSO) test was conducted using MR-PRESSO package in R, and SNP with the smallest pleiotropy p-value was removed (18). In addition, we used the inverse-variance weighted (IVW) approach and MR Egger regression to identify heterogeneity, which was quantified using Cochran’s Q statistic. In addition, we conducted the leave-one-out analysis to identify the stability of results.
MR analysis
In this study, we used IVW two-sample MR as our primary analysis (19) to estimate the causal effects of exposures on the risk of CD and UC. The IVW method assumes that all variants are valid IVs, providing the most precise results. In addition, we ran MR Egger, weighted median, maximum likelihood, and weighted mode as a complement. The MR analysis was carried out in R using TwoSampleMR and MendelianRandomization packages (20).
Results
Overall, 17 kinds of food intake exposures were included in our study, excluding those without effective IVs (i.e., milk intake). The number of SNPs for each food intake ranged from 6 to 48 after a series of quality control steps (Tables 1, 2). The F statistic values were more than the empirical threshold of 10, suggesting that all SNPs had sufficient validity.
Table 1
| Exposure | GWAS data | Nsnp | sample | R2 | F |
|---|---|---|---|---|---|
| Alcohol intake frequency | ukb-a-25 | 29 | 336965 | 0.00159 | 18.5018 |
| Beef intake | ukb-b-2862 | 10 | 461053 | 0.00032 | 14.6281 |
| Bread intake | ukb-b-11348 | 24 | 452236 | 0.00096 | 18.0272 |
| Cereal intake | ukb-b-15926 | 29 | 441,640 | 0.00118 | 17.9189 |
| Cheese intake | ukb-b-1489 | 48 | 451,486 | 0.00145 | 13.688 |
| Coffee intake | ukb-b-5237 | 32 | 428860 | 0.00236 | 31.7542 |
| Cooked vegetable intake | ukb-b-8089 | 12 | 448651 | 0.00046 | 17.2863 |
| Dried fruit intake | ukb-b-16576 | 30 | 421,764 | 0.00112 | 15.7614 |
| Fresh fruit intake | ukb-b-3881 | 38 | 446462 | 0.00166 | 19.5377 |
| Lamb intake | ukb-b-14179 | 25 | 460006 | 0.00082 | 15.0406 |
| Non-oily fish intake | ukb-b-17627 | 9 | 460,880 | 0.00036 | 18.6157 |
| Oily fish intake | ukb-b-2209 | 42 | 460,443 | 0.00163 | 17.8875 |
| Pork intake | ukb-b-5640 | 10 | 460162 | 0.00035 | 16.0884 |
| Poultry intake | ukb-b-8006 | 6 | 461900 | 0.00019 | 14.4174 |
| Processed meat intake | ukb-b-6324 | 19 | 461981 | 0.00062 | 15.1364 |
| Raw vegetable intake | ukb-b-1996 | 9 | 435435 | 0.00031 | 14.9826 |
| Tea intake | ukb-b-6066 | 32 | 447,485 | 0.00194 | 27.1543 |
Summary of modifiable risk factors for CD.
F, F statistics; R2, phenotype variance explained by genetics.
Table 2
| Exposure | GWAS data | Nsnp | sample | R2 | F |
|---|---|---|---|---|---|
| Alcohol intake frequency | ukb-a-25 | 29 | 336965 | 0.00159 | 18.5018 |
| Beef intake | ukb-b-2862 | 10 | 461053 | 0.00032 | 14.6281 |
| Bread intake | ukb-b-11348 | 24 | 452236 | 0.00096 | 18.0272 |
| Cereal intake | ukb-b-15926 | 29 | 441,640 | 0.00118 | 17.9189 |
| Cheese intake | ukb-b-1489 | 48 | 451,486 | 0.00145 | 13.688 |
| Coffee intake | ukb-b-5237 | 32 | 428860 | 0.00236 | 31.7542 |
| Cooked vegetable intake | ukb-b-8089 | 12 | 448651 | 0.00046 | 17.2863 |
| Dried fruit intake | ukb-b-16576 | 30 | 421,764 | 0.00112 | 15.7614 |
| Fresh fruit intake | ukb-b-3881 | 38 | 446462 | 0.00166 | 19.5377 |
| Lamb intake | ukb-b-14179 | 25 | 460006 | 0.00082 | 15.0406 |
| Non-oily fish intake | ukb-b-17627 | 9 | 460,880 | 0.00036 | 18.6157 |
| Oily fish intake | ukb-b-2209 | 43 | 460,443 | 0.00166 | 17.8055 |
| Pork intake | ukb-b-5640 | 10 | 460162 | 0.00035 | 16.0884 |
| Poultry intake | ukb-b-8006 | 6 | 461900 | 0.00019 | 14.4174 |
| Processed meat intake | ukb-b-6324 | 19 | 461981 | 0.00062 | 15.1364 |
| Raw vegetable intake | ukb-b-1996 | 9 | 435435 | 0.00031 | 14.9826 |
| Tea intake | ukb-b-6066 | 32 | 447,485 | 0.00194 | 27.1543 |
Summary of modifiable risk factors for UC.
F, F statistics; R2, phenotype variance explained by genetics.
MR estimates of different methods are presented in Tables 3, 4. In the primary IVW MR analysis, two causal associations from 17 food intakes to CD were identified, while only one causal association was observed for UC. As shown in Figures 2, 3, We found evidence that increased consumption of poultry was associated with a higher risk of CD (OR, 3.696; 95% CI, 1.056–12.937; p = 0.041) but was not associated with UC (OR, 0.633; 95% CI, 0.114–3.505; p = 0.600). Higher cereal intake level also increased CD risk (OR, 2.449; 95% CI, 1.094–5.482; p = 0.029). On the contrary, genetically predicted oily fish intake level was statistically significantly associated with the risk of UC (OR, 1.482; 95% CI, 1.002–2.194; p = 0.049) but not with CD (OR, 1.010; 95% CI, 0.603–1.692; p = 0.969). In addition to the above causal associations identified by the IVW test, several intriguing results were identified by other MR tests, including cheese intake based on maximum likelihood method (OR, 0.671; 95% CI, 0.474–0.950; p = 0.024) and processed meat intake based on the weighted median method (OR, 0.360; 95% CI, 0.136–0.952; p = 0.040), both of which were suggested to be associated with a decreased risk of CD (Table 3). Conversely, bread intake based on the weighted median method (OR, 0.332; 95% CI, 0.146–0.752; p = 0.008) and dried fruit intake based on the MR Egger method (OR, 0.029; 95% CI, 0.001–0.603; p = 0.030) were suggested to be associated with a decreased UC risk (Table 4).
Table 3
| Analysis | OR | Lower 95%CI | Upper 95%CI | P | Horizontal pleiotropy: Egger intercept | Horizontal pleiotropy: P | Heterogeneity: Q | Heterogeneity: P |
|---|---|---|---|---|---|---|---|---|
| Alcohol intake frequency | ||||||||
| Inverse variance weighted | 1.169647401 | 0.760988571 | 1.797760301 | 0.474894449 | 142.7444983 | 2.46E-17 | ||
| MR Egger | 1.15593862 | 0.574253199 | 2.326837876 | 0.687950469 | 0.000526157 | 0.966538314 | 142.7350209 | 1.05E-17 |
| Weighted median | 0.982920368 | 0.753751511 | 1.281765191 | 0.898787879 | ||||
| Maximum likelihood | 1.181986806 | 0.969840296 | 1.440539042 | 0.097604461 | ||||
| Weighted mode | 0.998823095 | 0.769639652 | 1.296252828 | 0.992997648 | ||||
| Beef intake | ||||||||
| Inverse variance weighted | 0.654920282 | 0.175494129 | 2.444073653 | 0.528743351 | 17.02885728 | 0.048265987 | ||
| MR Egger | 6.851272932 | 0.010299022 | 4557.708782 | 0.577701123 | -0.02918774 | 0.489834944 | 15.98236563 | 0.042633211 |
| Weighted median | 0.643839295 | 0.152724063 | 2.714235266 | 0.548640484 | ||||
| Maximum likelihood | 0.646566036 | 0.242329443 | 1.725121118 | 0.383789127 | ||||
| Weighted mode | 3.839498843 | 0.260047095 | 56.68877536 | 0.352957322 | ||||
| Bread intake | ||||||||
| Inverse variance weighted | 1.978647471 | 0.664333747 | 5.893191229 | 0.220373356 | 112.0995093 | 1.07E-13 | ||
| MR Egger | 0.162458241 | 0.001429798 | 18.4590313 | 0.45966761 | 0.037786467 | 0.298998447 | 106.6161849 | 4.41E-13 |
| Weighted median | 1.061414065 | 0.476670475 | 2.363477236 | 0.883978243 | ||||
| Maximum likelihood | 2.043192563 | 1.20608453 | 3.461312824 | 0.007890577 | ||||
| Weighted mode | 0.978319172 | 0.340335083 | 2.812253129 | 0.967896386 | ||||
| Cereal intake | ||||||||
| Inverse variance weighted | 2.448873254 | 1.093913159 | 5.482135549 | 0.029382649 | 78.13927106 | 1.26E-06 | ||
| MR Egger | 0.826222049 | 0.028245482 | 24.16821477 | 0.912572438 | 0.015918889 | 0.52118148 | 76.93535604 | 1.09E-06 |
| Weighted median | 1.613690292 | 0.764288777 | 3.407084383 | 0.209477226 | ||||
| Maximum likelihood | 2.589344829 | 1.572245316 | 4.264415086 | 0.00018569 | ||||
| Weighted mode | 1.508534323 | 0.434752502 | 5.234416809 | 0.522446126 | ||||
| Cheese intake | ||||||||
| Inverse variance weighted | 0.685831348 | 0.380528367 | 1.23608298 | 0.209553962 | 147.3826261 | 2.75E-12 | ||
| MR Egger | 0.537858519 | 0.033974083 | 8.515072598 | 0.661936682 | 0.004026947 | 0.860585116 | 147.2827513 | 1.57E-12 |
| Weighted median | 0.677237813 | 0.394858034 | 1.161559385 | 0.156802822 | ||||
| Maximum likelihood | 0.671012053 | 0.474058762 | 0.949791905 | 0.024412055 | ||||
| Weighted mode | 0.966088317 | 0.317692296 | 2.937832142 | 0.951776305 | ||||
| Coffee intake | ||||||||
| Inverse variance weighted | 0.682662282 | 0.409195296 | 1.138888438 | 0.14375358 | 53.38027534 | 0.007489816 | ||
| MR Egger | 1.220025054 | 0.454195197 | 3.27713975 | 0.696015407 | -0.01143769 | 0.190213896 | 50.36448599 | 0.011362878 |
| Weighted median | 0.864637558 | 0.499161407 | 1.497708146 | 0.603832776 | ||||
| Maximum likelihood | 0.675640323 | 0.455439122 | 1.002307058 | 0.051349418 | ||||
| Weighted mode | 0.811097338 | 0.447165517 | 1.471220092 | 0.495856147 | ||||
| Cooked vegetable intake | ||||||||
| Inverse variance weighted | 0.571785786 | 0.140083228 | 2.333890999 | 0.436006095 | 24.66645383 | 0.010198131 | ||
| MR Egger | 0.033336015 | 6.44E-09 | 172546.4557 | 0.675468655 | 0.029889359 | 0.724911973 | 24.34746142 | 0.006729646 |
| Weighted median | 0.292268916 | 0.070485923 | 1.211889058 | 0.090045312 | ||||
| Maximum likelihood | 0.568247635 | 0.216033509 | 1.494700407 | 0.252024459 | ||||
| Weighted mode | 0.250023217 | 0.024158544 | 2.587556951 | 0.269584604 | ||||
| Dried fruit intake | ||||||||
| Inverse variance weighted | 0.615304341 | 0.307418278 | 1.231544966 | 0.170148865 | 47.04758166 | 0.018410909 | ||
| MR Egger | 0.224767651 | 0.008201675 | 6.159778309 | 0.384386865 | 0.012339299 | 0.546753932 | 46.43047001 | 0.015721818 |
| Weighted median | 0.83355948 | 0.353232581 | 1.967036576 | 0.67770847 | ||||
| Maximum likelihood | 0.602608773 | 0.345460474 | 1.051168979 | 0.074390077 | ||||
| Weighted mode | 0.970658176 | 0.200630583 | 4.696080145 | 0.970718606 | ||||
| Fresh fruit intake | ||||||||
| Inverse variance weighted | 0.813916179 | 0.401507938 | 1.64992889 | 0.567928568 | 48.94698785 | 0.090431333 | ||
| MR Egger | 1.632089057 | 0.156408303 | 17.03051969 | 0.684664341 | -0.006739103 | 0.54545628 | 48.44565387 | 0.080469374 |
| Weighted median | 1.716357548 | 0.661032282 | 4.456489211 | 0.267140725 | ||||
| Maximum likelihood | 0.815212336 | 0.437323812 | 1.519631757 | 0.520227301 | ||||
| Weighted mode | 2.123752376 | 0.463967221 | 9.721212941 | 0.33810278 | ||||
| Lamb intake | ||||||||
| Inverse variance weighted | 1.149166283 | 0.422342665 | 3.126804971 | 0.785432484 | 52.32681241 | 0.000709139 | ||
| MR Egger | 5.268576304 | 0.078477059 | 353.7071433 | 0.446668649 | -0.017246051 | 0.472229933 | 51.13906726 | 0.000651619 |
| Weighted median | 1.256552995 | 0.443832079 | 3.557483796 | 0.667114082 | ||||
| Maximum likelihood | 1.156211872 | 0.576538853 | 2.318709112 | 0.682661241 | ||||
| Weighted mode | 1.645786546 | 0.293623491 | 9.224784239 | 0.576295982 | ||||
| Non-oily fish intake | ||||||||
| Inverse variance weighted | 1.001025076 | 0.125145745 | 8.007073662 | 0.99922943 | 36.44842618 | 1.45E-05 | ||
| MR Egger | 0.037940112 | 1.12E-06 | 1287.066846 | 0.558187411 | 0.04098059 | 0.549586776 | 34.50112549 | 1.39E-05 |
| Weighted median | 1.011385888 | 0.174560653 | 5.859862455 | 0.989922164 | ||||
| Maximum likelihood | 1.001089469 | 0.360585725 | 2.779311703 | 0.99833237 | ||||
| Weighted mode | 14.32402576 | 0.058941784 | 3481.023152 | 0.370019788 | ||||
| Oily fish intake | ||||||||
| Inverse variance weighted | 1.010209832 | 0.603125281 | 1.69205957 | 0.969208727 | 76.07911037 | 0.000713223 | ||
| MR Egger | 1.408535149 | 0.16947193 | 11.70678392 | 0.752851897 | -0.005038718 | 0.752568939 | 75.88794601 | 0.000527721 |
| Weighted median | 1.541362309 | 0.865893135 | 2.743754016 | 0.141404108 | ||||
| Maximum likelihood | 1.010819232 | 0.68687898 | 1.48753354 | 0.95646407 | ||||
| Weighted mode | 2.406958199 | 0.74374486 | 7.789563437 | 0.150301346 | ||||
| Pork intake | ||||||||
| Inverse variance weighted | 0.611217198 | 0.174401093 | 2.14211079 | 0.441649591 | 11.44569682 | 0.2463907 | ||
| MR Egger | 0.044283546 | 7.58E-06 | 258.8258748 | 0.501162414 | 0.026192874 | 0.565139331 | 10.95289247 | 0.204382691 |
| Weighted median | 0.606539145 | 0.129225252 | 2.84688735 | 0.526218421 | ||||
| Maximum likelihood | 0.603929827 | 0.194917394 | 1.871209284 | 0.382103021 | ||||
| Weighted mode | 1.078369975 | 0.08426568 | 13.8001829 | 0.955007525 | ||||
| Poultry intake | ||||||||
| Inverse variance weighted | 3.696240456 | 1.056093037 | 12.9365435 | 0.040816577 | 3.965493961 | 0.554394626 | ||
| MR Egger | 0.000248918 | 4.06E-19 | 1.52432E+11 | 0.657797598 | 0.104102162 | 0.609508348 | 3.659321538 | 0.454069988 |
| Weighted median | 2.327886899 | 0.488914299 | 11.08385953 | 0.288572795 | ||||
| Maximum likelihood | 3.797450458 | 1.055752067 | 13.65910656 | 0.041045459 | ||||
| Weighted mode | 1.97554832 | 0.281489565 | 13.86478097 | 0.523881078 | ||||
| Processed meat intake | ||||||||
| Inverse variance weighted | 0.560554205 | 0.216348782 | 1.452381724 | 0.233392724 | 50.94058035 | 5.43E-05 | ||
| MR Egger | 0.016445766 | 0.000250503 | 1.079680901 | 0.071250381 | 0.053851401 | 0.108671692 | 43.58995917 | 0.000393545 |
| Weighted median | 0.360348345 | 0.136368167 | 0.952208513 | 0.039515532 | ||||
| Maximum likelihood | 0.569962962 | 0.316790992 | 1.025464062 | 0.060643369 | ||||
| Weighted mode | 0.196607582 | 0.032098081 | 1.204263294 | 0.095565668 | ||||
| Raw vegetable intake | ||||||||
| Inverse variance weighted | 1.73146074 | 0.517146747 | 5.797109448 | 0.373243068 | 8.261610977 | 0.408341507 | ||
| MR Egger | 10.75657584 | 0.021916661 | 5279.267807 | 0.476879862 | -0.019325139 | 0.573642779 | 7.870052993 | 0.34419196 |
| Weighted median | 1.905929668 | 0.375648831 | 9.670116351 | 0.436346091 | ||||
| Maximum likelihood | 1.753037449 | 0.525166816 | 5.851741204 | 0.361362317 | ||||
| Weighted mode | 0.966093391 | 0.098307225 | 9.49407774 | 0.977121689 | ||||
| Tea intake | ||||||||
| Inverse variance weighted | 0.940489324 | 0.571833233 | 1.546814906 | 0.809016946 | 73.13197196 | 2.93E-05 | ||
| MR Egger | 0.705577661 | 0.234164514 | 2.126025955 | 0.540132354 | 0.006373046 | 0.570364533 | 72.33800529 | 2.34E-05 |
| Weighted median | 0.890524492 | 0.545123898 | 1.454777296 | 0.643346379 | ||||
| Maximum likelihood | 0.939417828 | 0.675566791 | 1.30631918 | 0.710257443 | ||||
| Weighted mode | 0.830331203 | 0.507355126 | 1.358909907 | 0.465001237 | ||||
Results of the MR study testing causal association between risk factors and CD.
Table 4
| Analysis | OR | Lower 95%CI | Upper 95%CI | P | Horizontal pleiotropy: Egger intercept | Horizontal pleiotropy: P | Heterogeneity: Q | Heterogeneity: P |
|---|---|---|---|---|---|---|---|---|
| Alcohol intake frequency | ||||||||
| Inverse variance weighted | 0.960248007 | 0.760082379 | 1.213126709 | 0.733776622 | 41.1857892 | 0.051635149 | ||
| MR Egger | 0.870756621 | 0.590471541 | 1.284087448 | 0.49095844 | 0.004184219 | 0.53912919 | 40.6038877 | 0.044938595 |
| Weighted median | 0.893173489 | 0.68398792 | 1.166334753 | 0.40664003 | ||||
| Maximum likelihood | 0.959760455 | 0.790005161 | 1.165992548 | 0.679184457 | ||||
| Weighted mode | 0.906090971 | 0.691078402 | 1.187999574 | 0.481421323 | ||||
| Beef intake | ||||||||
| Inverse variance weighted | 2.08971835 | 0.67272235 | 6.491419201 | 0.202488462 | 12.8357884 | 0.170178529 | ||
| MR Egger | 0.865514015 | 0.002594981 | 288.6781755 | 0.9623321 | 0.010931152 | 0.768976796 | 12.6893222 | 0.122995545 |
| Weighted median | 1.203224862 | 0.300864509 | 4.811966928 | 0.793626202 | ||||
| Maximum likelihood | 2.160150764 | 0.818945756 | 5.697875944 | 0.11961974 | ||||
| Weighted mode | 0.968655764 | 0.143883377 | 6.521211871 | 0.974602207 | ||||
| Bread intake | ||||||||
| Inverse variance weighted | 0.79633976 | 0.363431578 | 1.744914451 | 0.56935088 | 59.20456914 | 4.97E-05 | ||
| MR Egger | 0.153345443 | 0.004996258 | 4.706487583 | 0.294751062 | 0.024876184 | 0.343166767 | 56.78201626 | 6.60E-05 |
| Weighted median | 0.331651725 | 0.146262563 | 0.752023378 | 0.008234821 | ||||
| Maximum likelihood | 0.799179923 | 0.482767401 | 1.322973648 | 0.383382668 | ||||
| Weighted mode | 0.292600777 | 0.085471082 | 1.001686326 | 0.062553682 | ||||
| Cereal intake | ||||||||
| Inverse variance weighted | 0.86870323 | 0.476918742 | 1.582335176 | 0.64547338 | 44.5670777 | 0.024394447 | ||
| MR Egger | 0.507493834 | 0.040642717 | 6.336928523 | 0.602792311 | 0.007877317 | 0.670625861 | 44.26398594 | 0.01941646 |
| Weighted median | 0.878907073 | 0.447085674 | 1.727806743 | 0.708193272 | ||||
| Maximum likelihood | 0.864946968 | 0.533304378 | 1.40282602 | 0.556493331 | ||||
| Weighted mode | 0.692471792 | 0.241686082 | 1.984049634 | 0.499432858 | ||||
| Cheese intake | ||||||||
| Inverse variance weighted | 0.992125529 | 0.619882892 | 1.587901647 | 0.973717788 | 96.9417767 | 2.52E-05 | ||
| MR Egger | 1.111798961 | 0.12184206 | 10.14507571 | 0.92555859 | -0.001885371 | 0.918116069 | 96.91926185 | 1.71E-05 |
| Weighted median | 0.875180286 | 0.524780007 | 1.459545948 | 0.609397073 | ||||
| Maximum likelihood | 0.992079861 | 0.7084839 | 1.389195224 | 0.963077857 | ||||
| Weighted mode | 0.986653645 | 0.322328954 | 3.020161251 | 0.981319408 | ||||
| Coffee intake | ||||||||
| Inverse variance weighted | 0.895537381 | 0.608756811 | 1.317418033 | 0.575326559 | 31.63882581 | 0.43438107 | ||
| MR Egger | 1.968836193 | 0.936007758 | 4.141328874 | 0.084264078 | -0.015616862 | 0.021762012 | 25.77992846 | 0.68631547 |
| Weighted median | 1.26405984 | 0.724942995 | 2.204100583 | 0.408767719 | ||||
| Maximum likelihood | 0.894671694 | 0.609099401 | 1.314132697 | 0.570453671 | ||||
| Weighted mode | 1.315266422 | 0.769602902 | 2.247816058 | 0.323990157 | ||||
| Cooked vegetable intake | ||||||||
| Inverse variance weighted | 1.162750658 | 0.45901774 | 2.945396166 | 0.750502303 | 7.484565454 | 0.75859546 | ||
| MR Egger | 0.005200763 | 2.98E-07 | 90.75920993 | 0.316105362 | 0.056857224 | 0.301057114 | 6.295299981 | 0.789873266 |
| Weighted median | 0.889136555 | 0.247041646 | 3.200123644 | 0.857285088 | ||||
| Maximum likelihood | 1.166201912 | 0.456728964 | 2.977754871 | 0.747851961 | ||||
| Weighted mode | 0.809933289 | 0.134585228 | 4.874174834 | 0.822151949 | ||||
| Dried fruit intake | ||||||||
| Inverse variance weighted | 0.582988554 | 0.298299772 | 1.13937618 | 0.114488952 | 45.05066688 | 0.029092239 | ||
| MR Egger | 0.029417951 | 0.001434985 | 0.603083585 | 0.029883024 | 0.036584528 | 0.057274734 | 39.50376068 | 0.073153933 |
| Weighted median | 0.642064307 | 0.293440539 | 1.404872605 | 0.267403159 | ||||
| Maximum likelihood | 0.575472055 | 0.332343039 | 0.996464639 | 0.04853619 | ||||
| Weighted mode | 0.541644202 | 0.114922834 | 2.552829848 | 0.444521069 | ||||
| Fresh fruit intake | ||||||||
| Inverse variance weighted | 0.921707183 | 0.418660439 | 2.029196102 | 0.83953786 | 62.78587591 | 0.005117006 | ||
| MR Egger | 1.609149166 | 0.116406346 | 22.24415697 | 0.724655302 | -0.00539628 | 0.66509333 | 62.45535338 | 0.004048581 |
| Weighted median | 0.707068848 | 0.282145682 | 1.771944031 | 0.459598548 | ||||
| Maximum likelihood | 0.917998935 | 0.495411178 | 1.701055772 | 0.785716863 | ||||
| Weighted mode | 0.363220316 | 0.071275011 | 1.850985299 | 0.230585712 | ||||
| Lamb intake | ||||||||
| Inverse variance weighted | 1.596607219 | 0.69368148 | 3.674820052 | 0.271300272 | 37.23079472 | 0.041493602 | ||
| MR Egger | 2.53098608 | 0.07349768 | 87.15772386 | 0.611966539 | -0.005216688 | 0.795002341 | 37.11928686 | 0.031590288 |
| Weighted median | 1.649723541 | 0.585837227 | 4.645638129 | 0.34327364 | ||||
| Maximum likelihood | 1.624573147 | 0.82102678 | 3.214557642 | 0.163427125 | ||||
| Weighted mode | 1.661828249 | 0.234419786 | 11.78088751 | 0.615889217 | ||||
| Non-oily fish intake | ||||||||
| Inverse variance weighted | 2.214841648 | 0.740553204 | 6.62413382 | 0.154841232 | 10.43809609 | 0.235612902 | ||
| MR Egger | 0.015131684 | 0.000149407 | 1.532510366 | 0.118501866 | 0.06241302 | 0.067260854 | 5.757425085 | 0.568341905 |
| Weighted median | 1.25048845 | 0.348320325 | 4.489319894 | 0.731765726 | ||||
| Maximum likelihood | 2.265324724 | 0.854094121 | 6.008349641 | 0.100363264 | ||||
| Weighted mode | 0.930081082 | 0.191862433 | 4.508703478 | 0.930498104 | ||||
| Oily fish intake | ||||||||
| Inverse variance weighted | 1.482394299 | 1.001507108 | 2.194185983 | 0.049122493 | 47.03784999 | 0.273840038 | ||
| MR Egger | 0.367261456 | 0.079005868 | 1.70722732 | 0.208532831 | 0.02102955 | 0.073404418 | 43.45927354 | 0.367048836 |
| Weighted median | 1.110973272 | 0.635319533 | 1.942741479 | 0.712070699 | ||||
| Maximum likelihood | 1.501367322 | 1.031370308 | 2.185542687 | 0.033902188 | ||||
| Weighted mode | 0.823172572 | 0.306144699 | 2.213375195 | 0.701742697 | ||||
| Pork intake | ||||||||
| Inverse variance weighted | 1.573711839 | 0.386499644 | 6.407687546 | 0.526749562 | 14.74009256 | 0.098327081 | ||
| MR Egger | 0.000322663 | 1.10E-07 | 0.945155904 | 0.083842859 | 0.084709306 | 0.067988915 | 9.47345866 | 0.303941398 |
| Weighted median | 1.161995553 | 0.226091384 | 5.972070404 | 0.857334701 | ||||
| Maximum likelihood | 1.616430281 | 0.526494669 | 4.962722336 | 0.401421025 | ||||
| Weighted mode | 0.877677245 | 0.07609348 | 10.12330285 | 0.91900186 | ||||
| Poultry intake | ||||||||
| Inverse variance weighted | 0.632751142 | 0.114218061 | 3.505347601 | 0.600287511 | 9.616553531 | 0.086858328 | ||
| MR Egger | 3.27E-08 | 1.18E-29 | 9.04614E+13 | 0.531391488 | 0.181828392 | 0.541535621 | 8.655194963 | 0.070320135 |
| Weighted median | 0.474914587 | 0.08982661 | 2.510880291 | 0.38080366 | ||||
| Maximum likelihood | 0.617644559 | 0.173729621 | 2.195853534 | 0.456537266 | ||||
| Weighted mode | 0.254485331 | 0.024928949 | 2.59789471 | 0.300451715 | ||||
| Processed meat intake | ||||||||
| Inverse variance weighted | 0.825911585 | 0.469339896 | 1.453381553 | 0.507123208 | 18.53478618 | 0.420980186 | ||
| MR Egger | 1.584346802 | 0.111910962 | 22.42992773 | 0.737780892 | -0.009951475 | 0.627878754 | 18.27286259 | 0.371825679 |
| Weighted median | 0.927763989 | 0.430362922 | 2.000046878 | 0.848280491 | ||||
| Maximum likelihood | 0.827088746 | 0.470409997 | 1.454211854 | 0.509651958 | ||||
| Weighted mode | 1.047580936 | 0.284305205 | 3.860027174 | 0.945077071 | ||||
| Raw vegetable intake | ||||||||
| Inverse variance weighted | 1.288586424 | 0.288628987 | 5.752904398 | 0.739775697 | 12.97118688 | 0.112844833 | ||
| MR Egger | 0.050286437 | 3.33E-05 | 75.8750762 | 0.449620819 | 0.034430372 | 0.404086986 | 11.65828902 | 0.112371136 |
| Weighted median | 1.696732148 | 0.315010206 | 9.139068901 | 0.53828427 | ||||
| Maximum likelihood | 1.300514873 | 0.392751459 | 4.306384849 | 0.667101775 | ||||
| Weighted mode | 1.73835638 | 0.135448067 | 22.31026965 | 0.682279121 | ||||
| Tea intake | ||||||||
| Inverse variance weighted | 1.092154285 | 0.720017415 | 1.65662796 | 0.67835992 | 53.35359083 | 0.007539068 | ||
| MR Egger | 1.200798319 | 0.477468781 | 3.019918076 | 0.700102019 | -0.002116573 | 0.822091289 | 53.26223943 | 0.005549248 |
| Weighted median | 1.242149121 | 0.780737408 | 1.976252737 | 0.360052069 | ||||
| Maximum likelihood | 1.095314013 | 0.794058595 | 1.510861786 | 0.579041763 | ||||
| Weighted mode | 1.207024021 | 0.757574296 | 1.923120932 | 0.434524581 | ||||
Results of the MR study testing causal association between risk factors and UC.
Figure 2
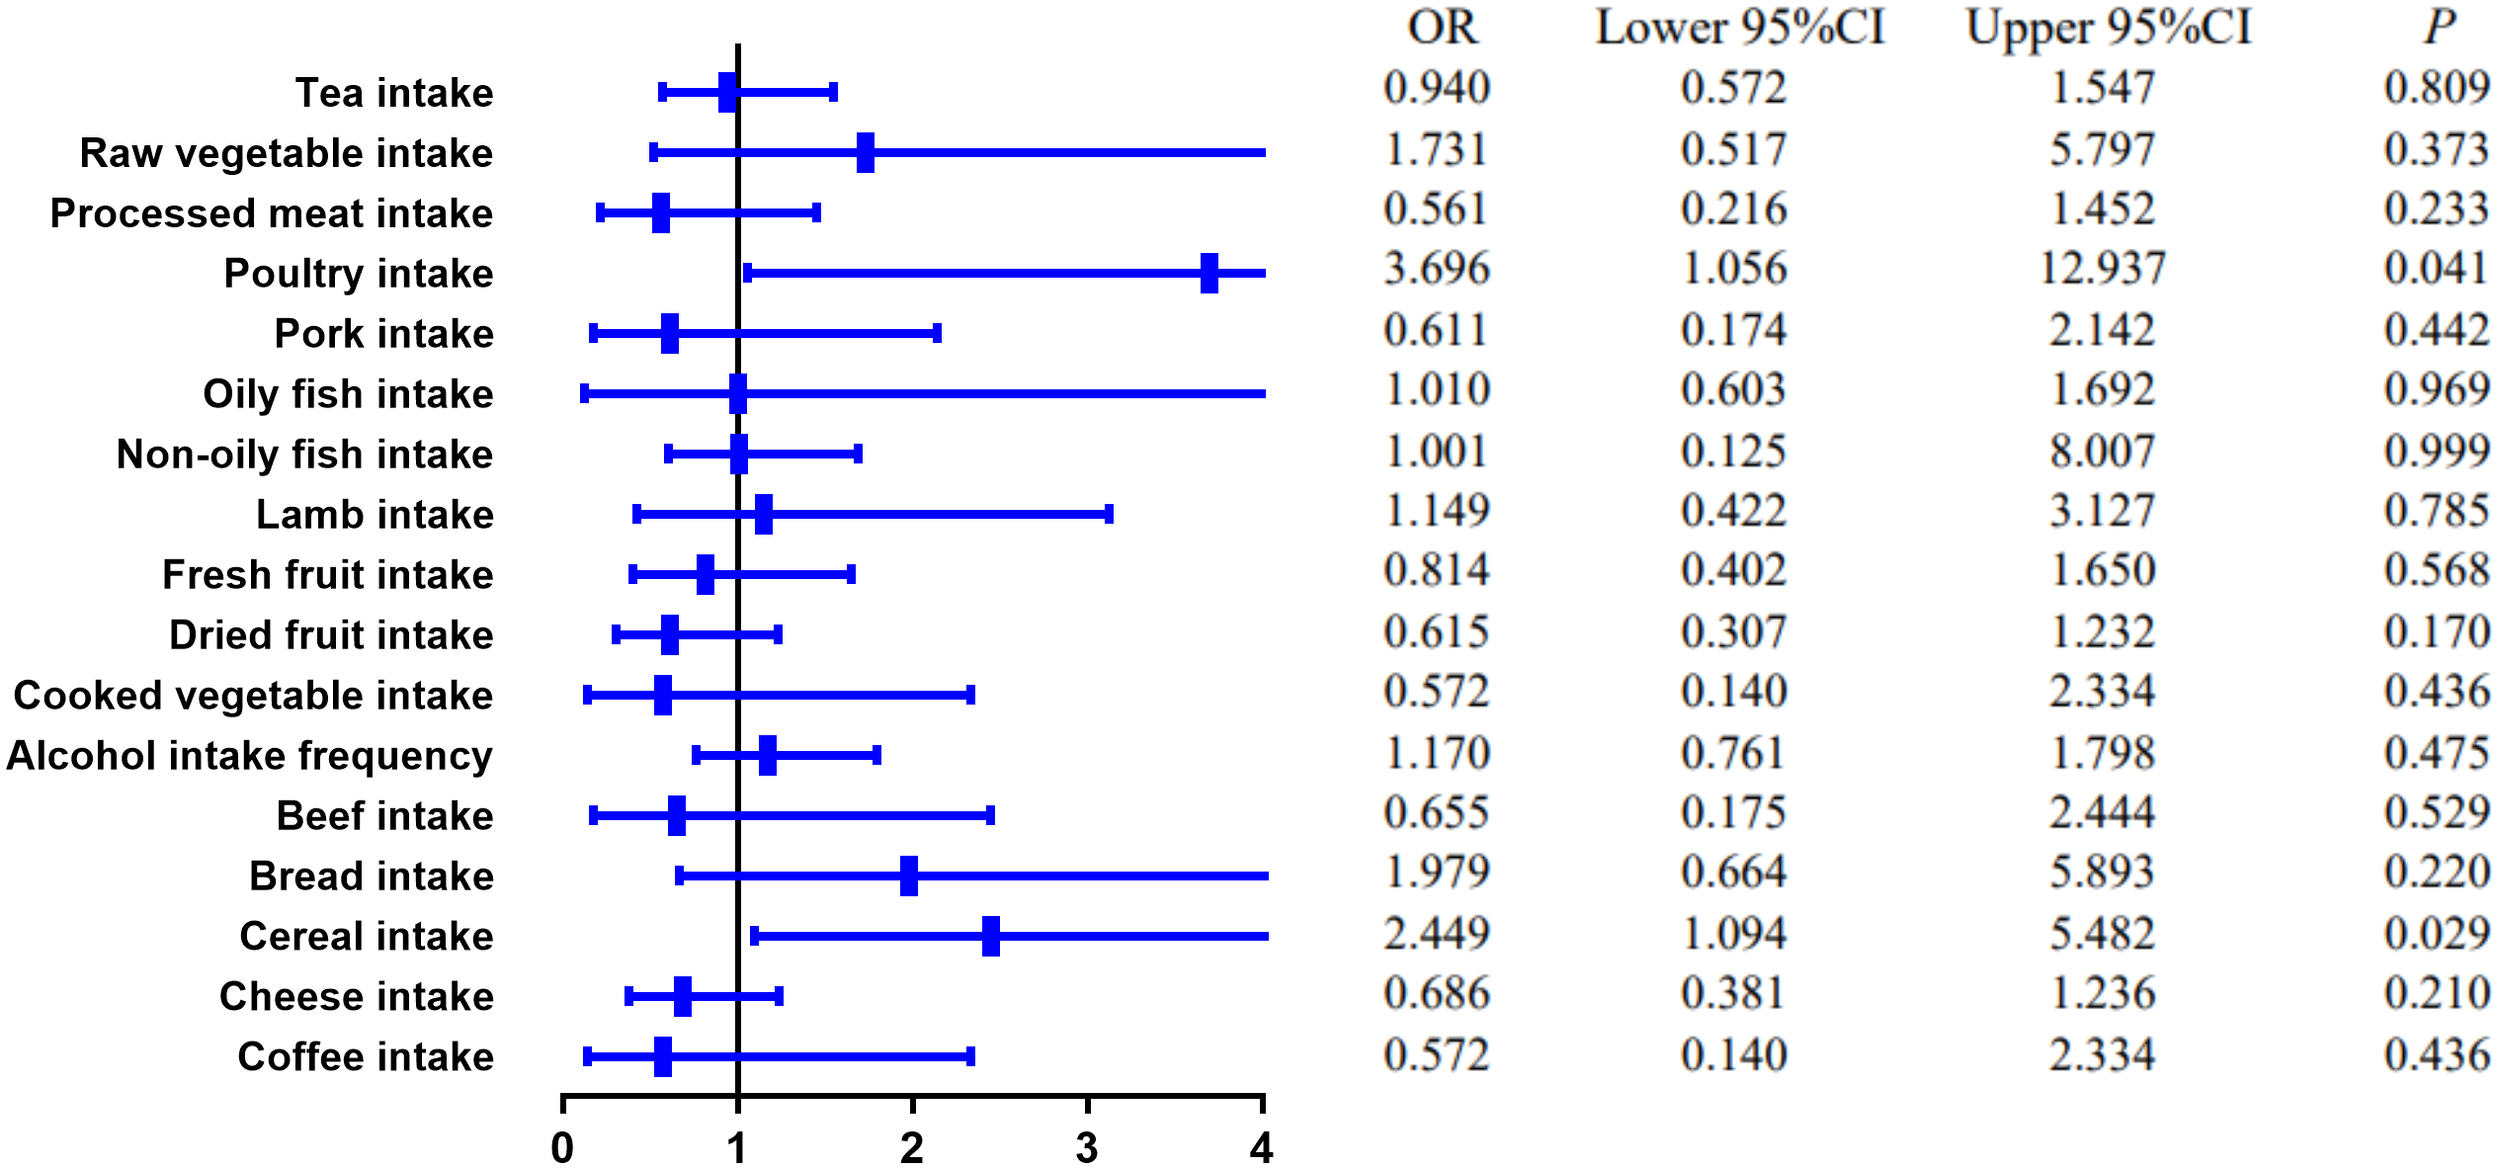
The causal effect of food risk factors on CD based on the IVW method. IVW, inverse-variance weighted; CD, Crohn’s disease.
Figure 3
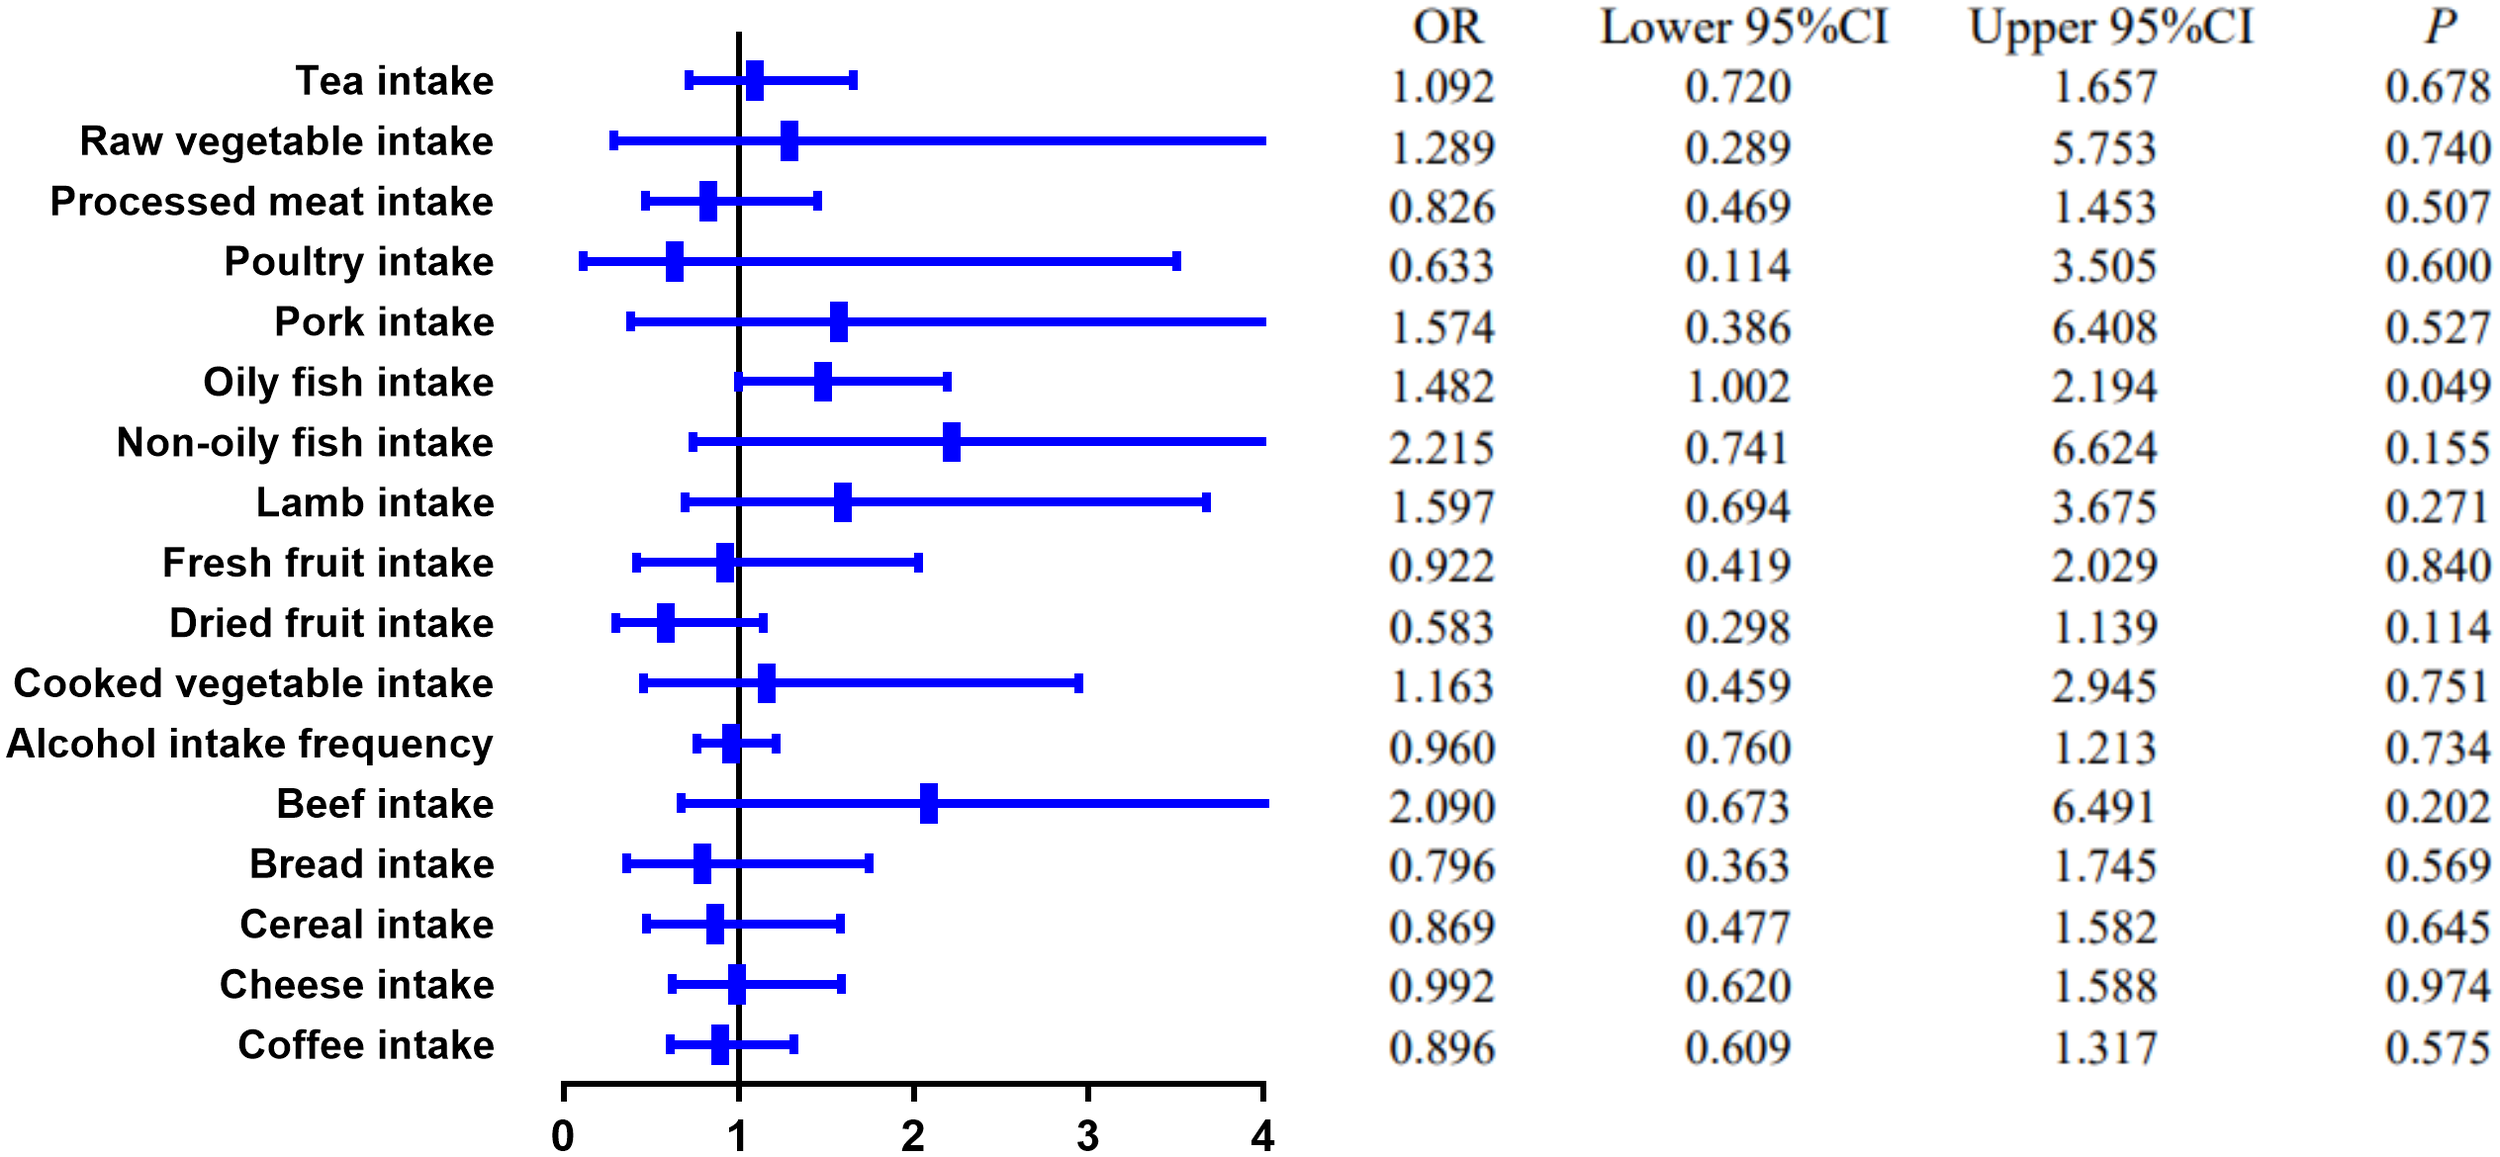
The causal effect of food risk factors on UC based on the IVW method. Abbreviations: IVW, inverse-variance weighted; UC, ulcerative colitis.
The scatter plots, forest plots, funnel plots, and leave-one-out plots for CD and UC are displayed in Figures S1A–Q, S2A–Q, S3A–Q, S4A–Q, S5A–Q, S6A–Q, S7A–Q, and S8A–Q.
Discussion
The etiology of IBD is complex, involving immune imbalance, like dysregulated IL-23/Th17, alteration of microbiome, and infection (1, 21). There is mounting evidence that certain foods may increase or decrease IBD risk in susceptible individuals (2, 4, 22–26). MR analysis was conducted to evaluate the potential causality between food intakes and IBD in this study, which uses random allocation of alleles to replicate the randomization process in double-blind clinical trials. Using large-scale summary statistics from food intake GWAS and CD, UC GWAS, we identified specific food intake that might be causally associated with CD and UC risk.
High red meat intake is one of the features of the Western diet, which is believed to be a risk factor for IBD. Peters et al. found that the “carnivorous” dietary pattern, which consists of high consumption of red meat, poultry, and processed meat, was associated with UC development (OR: 1.11, 95% CI, 1.01–1.22, p = 0.024) but not with CD (OR: 0.99, 95% CI, 0.86–1.33, p = 0.853) in a prospective population-based cohort (22). Animal studies have indicated that iron, sulfur, and fats are risk factors for colitis and ileitis, which are found in high concentrations in meats (27, 28). Hydrogen sulfide (H2S) has been demonstrated to have detrimental inflammatory effects on the colon (29). However, our MR study did not find any association between red meat intake (beef intake, lamb intake, and pork intake) and IBD risk but discovered a causal association between poultry intake and CD risk. Based on another large, multinational, prospective cohort study involving 116,087 participants from 21 countries, intakes of red meat and white meat were not associated with incident IBD (30).
Despite previous evidence from human studies supporting a possible link between processed meat consumption and IBD, the conclusion is inconsistent. It was reported that higher processed meat consumption was associated with a higher risk of IBD in Narula et al.’s study (30). However, in another prospective cohort study of three national cohorts of American health professionals, which included 245,112 participants, the author found that although higher ultra-processed food intake was associated with an increased risk of incident CD, meat products were not related to the risk of CD (23). In contrast, ultra-processed bread and other processed foods showed positive associations with CD risk (23). The conclusion is controversial because when people cut back on processed meat in their diet, they must replace it with something else. Participants in different studies may replace processed meat with different foods, affecting CD risk. Through MR analysis, our study suggested that there might be an inverse causal relationship between processed meat consumption and CD risk.
Another feature of the Western diet is a low intake of fruits and vegetables. Diets high in fruits and vegetables were found to be inversely related to CD in a large prospective cohort study (26). In addition, a nested matched case–control study using a large European Prospective Investigation into Cancer and Nutrition (EPIC) prospective database found that low vegetable intake was associated with an increased risk of UC (31). One explanation of fruit and vegetable’s beneficial role in IBD is high fiber. Because fiber reduces intestinal transit times, potential toxic exposures have less time to contact the intestinal wall. In addition, fiber can be converted into short-chain fatty acids (SCFAs), such as butyrate, which enhances mucus and antimicrobial peptide secretion, and modulates intestinal inflammation by suppressing pro-inflammatory mediators (32, 33). Fiber may also help maintain the intestinal barrier by reducing pathogen translocation across Peyer’s patches and colonic lymphoid follicles (34). Despite a few researchers reporting some protective effects and all of these proposed protective mechanisms, studies of fiber and disease onset and clinical relapse of IBD did not find any consistent effects (4, 35, 36). Narula and his colleagues reported that intake of fruit and vegetables was not associated with incident IBD (30). Based on the MR Egger method, dried fruit intake might be associated with a decreased UC risk in our study, while no relationship was found between fruit or vegetable intake and CD in our study.
Our MR analysis also indicated that high oily fish intake level might increase the risk of UC. Interestingly, in a meta-analysis, increased fish intake was a protective factor for CD in Western countries, but a risk factor for UC in Eastern countries (37). In a prospective cohort study consisting of 67581 women living in France, high consumption of meat or fish but not dairy products was found to be associated with IBD risk among sources of animal protein (38).
In addition, we found that cereal intake may increase the risk of CD and bread intake might decrease the risk of UC. In Jakosen et al.’s study, whole meal bread consumption was found to be a protective factor for CD, while white bread consumption and cereal cornflake type were found to be risk factors (33).
Dairy products, including milk, yogurt, and cheese, are common components of a Western diet. In the EPIC cohort, the researchers found that dairy product consumption may be associated with a decreased risk of CD (39). Our study also suggested that there might be a negative association between cheese and CD risk.
Several studies have demonstrated that alcohol modulates the immune system in a dose- and time-dependent manner (40, 41). However, in a recent Mendelian randomization analysis conducted by Xia Jiang et al., alcohol intake did not show a causal role in IBD risk (42). In addition, our study did not find any association between alcohol intake and IBD either.
Our research has several significant strengths, out of which the dominant one is the MR design, which is suitable for causal inference. Given the numerous challenges of designing and carrying out RCTs in IBD, an MR study could provide important insights into the associations between specific dietary components and the risk of developing IBD. Furthermore, the food intake factors included in our research, such as processed meat intake, have not previously been investigated in an MR setting. As a result, this study could serve as a model for future research into the relationship between food intake and disease risk.
However, some limitations in this MR study should be observed. First, food intake GWAS remains in its infancy in sample size and could bring compromised statistical power. The limited IV numbers weaken the proportion of phenotypic variance explained. Therefore, the null findings for some associations do not necessarily indicate that food intake has no effect. Second, we only included 17 kinds of food, as other food intakes (i.e., milk intake) do not have enough effective IVs. In addition, one thing should be noted: although only single food items were investigated in our study, these elements may act synergistically or antagonistically as part of a habitual diet (43). The dietary patterns should be studied in MR research to assess their role in CD and UC risk.
In conclusion, we thoroughly examined the potential causal relationship between food intakes and CD and UC. Two types of food intake (poultry intake and cereal intake) were found to increase the risk of CD, and high oily fish intake was associated with UC risk. More research is needed in the future to determine the exact causal relationship and mechanism underlying specific food intakes and IBD.
Funding
This work was supported by Research foundation of Guangzhou Women and Children’s Medical Center for Clinical Doctor (grant number 1600111).
Publisher’s note
All claims expressed in this article are solely those of the authors and do not necessarily represent those of their affiliated organizations, or those of the publisher, the editors and the reviewers. Any product that may be evaluated in this article, or claim that may be made by its manufacturer, is not guaranteed or endorsed by the publisher.
Statements
Data availability statement
The original contributions presented in the study are included in the article/Supplementary Material. Further inquiries can be directed to the corresponding author.
Author contributions
All authors listed have made a substantial, direct, and intellectual contribution to the work, and approved it for publication.
Conflict of interest
The authors declare that the research was conducted in the absence of any commercial or financial relationships that could be construed as a potential conflict of interest.
Supplementary material
The Supplementary Material for this article can be found online at: https://www.frontiersin.org/articles/10.3389/fimmu.2022.911631/full#supplementary-material
References
1
Abraham C Cho JH . Inflammatory bowel disease. N Engl J Med (2009) 361:2066–78. doi: 10.1056/NEJMra0804647
2
Tracy M Khalili H . You are what you eat? growing evidence that diet influences the risk of inflammatory bowel disease. J Crohns Colitis (2022) 16:1185–6. doi: 10.1093/ecco-jcc/jjac025
3
Lomer MC Thompson RP Powell JJ . Fine and ultrafine particles of the diet: Influence on the mucosal immune response and association with crohn’s disease. Proc Nutr Soc (2002) 61:123–30. doi: 10.1079/pns2001134
4
Andersen V Chan S Luben R Khaw KT Olsen A Tjonneland A et al . Fibre intake and the development of inflammatory bowel disease: A European prospective multi-centre cohort study (EPIC-IBD). J Crohns Colitis (2018) 12:129–36. doi: 10.1093/ecco-jcc/jjx136
5
Maslowski KM Mackay CR . Diet, gut microbiota and immune responses. Nat Immunol (2011) 12:5–9. doi: 10.1038/ni0111-5
6
Desai MS Seekatz AM Koropatkin NM Kamada N Hickey CA Wolter M et al . A dietary fiber-deprived gut microbiota degrades the colonic mucus barrier and enhances pathogen susceptibility. Cell (2016) 167:1339–53. doi: 10.1016/j.cell.2016.10.043
7
Hou JK Abraham B El-Serag H . Dietary intake and risk of developing inflammatory bowel disease: A systematic review of the literature. Am J Gastroenterol (2011) 106:563–73. doi: 10.1038/ajg.2011.44
8
West SG Thoemmes F . Campbell’s and rubin’s perspectives on causal inference. Psychol Methods (2010) 15:18–37. doi: 10.1037/a0015917
9
Steeger CM Buckley PR Pampel FC Gust CJ Hill KG . Common methodological problems in randomized controlled trials of preventive interventions. Prev Sci (2021) 22:1159–72. doi: 10.1007/s11121-021-01263-2
10
Smith GD Ebrahim S . ‘Mendelian randomization’: Can genetic epidemiology contribute to understanding environmental determinants of disease? Int J Epidemiol (2003) 32:1–22. doi: 10.1093/ije/dyg070
11
Collins R . What makes UK biobank special? Lancet (2012) 379:1173–4. doi: 10.1016/S0140-6736(12)60404-8
12
de Lange KM Moutsianas L Lee JC Lamb CA Luo Y Kennedy NA et al . Genome-wide association study implicates immune activation of multiple integrin genes in inflammatory bowel disease. Nat Genet (2017) 49:256–61. doi: 10.1038/ng.3760
13
Park S Lee S Kim Y Lee Y Kang MW Kim K et al . Atrial fibrillation and kidney function: A bidirectional mendelian randomization study. Eur Heart J (2021) 42:2816–23. doi: 10.1093/eurheartj/ehab291
14
Staley JR Blackshaw J Kamat MA Ellis S Surendran P Sun BB et al . PhenoScanner: A database of human genotype-phenotype associations. Bioinformatics (2016) 32:3207–9. doi: 10.1093/bioinformatics/btw373
15
Emdin CA Khera AV Kathiresan S . Mendelian randomization. JAMA (2017) 318:1925–6. doi: 10.1001/jama.2017.17219
16
Palmer TM Lawlor DA Harbord RM Sheehan NA Tobias JH Timpson NJ et al . Using multiple genetic variants as instrumental variables for modifiable risk factors. Stat Methods Med Res (2012) 21:223–42. doi: 10.1177/0962280210394459
17
Bowden J Davey SG Burgess S . Mendelian randomization with invalid instruments: Effect estimation and bias detection through egger regression. Int J Epidemiol (2015) 44:512–25. doi: 10.1093/ije/dyv080
18
Verbanck M Chen CY Neale B Do R . Detection of widespread horizontal pleiotropy in causal relationships inferred from mendelian randomization between complex traits and diseases. Nat Genet (2018) 50:693–8. doi: 10.1038/s41588-018-0099-7
19
Lawlor DA Harbord RM Sterne JA Timpson N Davey SG . Mendelian randomization: Using genes as instruments for making causal inferences in epidemiology. Stat Med (2008) 27:1133–63. doi: 10.1002/sim.3034
20
Yavorska OO Burgess S . MendelianRandomization: An r package for performing mendelian randomization analyses using summarized data. Int J Epidemiol (2017) 46:1734–9. doi: 10.1093/ije/dyx034
21
Murdaca G Colombo BM Puppo F . The role of Th17 lymphocytes in the autoimmune and chronic inflammatory diseases. Intern Emerg Med (2011) 6:487–95. doi: 10.1007/s11739-011-0517-7
22
Peters V Bolte L Schuttert E Andreu-Sanchez S Dijkstra G Weersma R et al . Western And carnivorous dietary patterns are associated with greater likelihood of IBD-development in a large prospective population-based cohort. J Crohns Colitis (2021) 16:931–9. doi: 10.1093/ecco-jcc/jjab219
23
Lo CH Khandpur N Rossato SL Lochhead P Lopes EW Burke KE et al . Ultra-processed foods and risk of crohn’s disease and ulcerative colitis: A prospective cohort study. Clin Gastroenterol Hepatol (2021) 20:e1323–37. doi: 10.1016/j.cgh.2021.08.031
24
Ananthakrishnan AN Khalili H Song M Higuchi LM Richter JM Nimptsch K et al . High school diet and risk of crohn’s disease and ulcerative colitis. Inflammation Bowel Dis (2015) 21:2311–9. doi: 10.1097/MIB.0000000000000501
25
Lo CH Lochhead P Khalili H Song M Tabung FK Burke KE et al . Dietary inflammatory potential and risk of crohn’s disease and ulcerative colitis. Gastroenterology (2020) 159:873–83. doi: 10.1053/j.gastro.2020.05.011
26
Ananthakrishnan AN Khalili H Konijeti GG Higuchi LM de Silva P Korzenik JR et al . A prospective study of long-term intake of dietary fiber and risk of crohn’s disease and ulcerative colitis. Gastroenterology (2013) 145:970–7. doi: 10.1053/j.gastro.2013.07.050
27
Werner T Wagner SJ Martinez I Walter J Chang JS Clavel T et al . Depletion of luminal iron alters the gut microbiota and prevents crohn’s disease-like ileitis. Gut (2011) 60:325–33. doi: 10.1136/gut.2010.216929
28
Fiorucci S Orlandi S Mencarelli A Caliendo G Santagada V Distrutti E et al . Enhanced activity of a hydrogen sulphide-releasing derivative of mesalamine (ATB-429) in a mouse model of colitis. Br J Pharmacol (2007) 150:996–1002. doi: 10.1038/sj.bjp.0707193
29
Medani M Collins D Docherty NG Baird AW O’Connell PR Winter DC . Emerging role of hydrogen sulfide in colonic physiology and pathophysiology. Inflammation Bowel Dis (2011) 17:1620–5. doi: 10.1002/ibd.21528
30
Narula N Wong E Dehghan M Mente A Rangarajan S Lanas F et al . Association of ultra-processed food intake with risk of inflammatory bowel disease: Prospective cohort study. BMJ (2021) 374:n1554. doi: 10.1136/bmj.n1554
31
Racine A Carbonnel F Chan SS Hart AR Bueno-de-Mesquita HB Oldenburg B et al . Dietary patterns and risk of inflammatory bowel disease in europe: Results from the EPIC study. Inflammation Bowel Dis (2016) 22:345–54. doi: 10.1097/MIB.0000000000000638
32
Vinolo MA Rodrigues HG Nachbar RT Curi R . Regulation of inflammation by short chain fatty acids. Nutrients (2011) 3:858–76. doi: 10.3390/nu3100858
33
Jakobsen C Paerregaard A Munkholm P Wewer V . Environmental factors and risk of developing paediatric inflammatory bowel disease – a population based study 2007-2009. J Crohns Colitis (2013) 7:79–88. doi: 10.1016/j.crohns.2012.05.024
34
Roberts CL Keita AV Duncan SH O’Kennedy N Soderholm JD Rhodes JM et al . Translocation of crohn’s disease escherichia coli across m-cells: Contrasting effects of soluble plant fibres and emulsifiers. Gut (2010) 59:1331–9. doi: 10.1136/gut.2009.195370
35
Spooren CE Pierik MJ Zeegers MP Feskens EJ Masclee AA Jonkers DM . Review article: The association of diet with onset and relapse in patients with inflammatory bowel disease. Aliment Pharmacol Ther (2013) 38:1172–87. doi: 10.1111/apt.12501
36
Andersen V Olsen A Carbonnel F Tjonneland A Vogel U . Diet and risk of inflammatory bowel disease. Dig Liver Dis (2012) 44:185–94. doi: 10.1016/j.dld.2011.10.001
37
Zhao M Feng R Ben-Horin S Zhuang X Tian Z Li X et al . Systematic review with meta-analysis: Environmental and dietary differences of inflammatory bowel disease in Eastern and Western populations. Aliment Pharmacol Ther (2022) 55:266–76. doi: 10.1111/apt.16703
38
Jantchou P Morois S Clavel-Chapelon F Boutron-Ruault MC Carbonnel F . Animal protein intake and risk of inflammatory bowel disease: The E3N prospective study. Am J Gastroenterol (2010) 105:2195–201. doi: 10.1038/ajg.2010.192
39
Opstelten JL Leenders M Dik VK Chan SS van Schaik FD Khaw KT et al . Dairy products, dietary calcium, and risk of inflammatory bowel disease: Results from a european prospective cohort investigation. Inflammation Bowel Dis (2016) 22:1403–11. doi: 10.1097/MIB.0000000000000798
40
Barr T Helms C Grant K Messaoudi I . Opposing effects of alcohol on the immune system. Prog Neuropsychopharmacol Biol Psychiatry (2016) 65:242–51. doi: 10.1016/j.pnpbp.2015.09.001
41
Zhang H Zhu Z Zhang F Meadows GG . Alcohol consumption and antitumor immunity: Dynamic changes from activation to accelerated deterioration of the immune system. Adv Exp Med Biol (2015) 815:313–31. doi: 10.1007/978-3-319-09614-8_18
42
Jiang X Zhu Z Manouchehrinia A Olsson T Alfredsson L Kockum I . Alcohol consumption and risk of common autoimmune inflammatory diseases-evidence from a Large-scale genetic analysis totaling 1 million individuals. Front Genet (2021) 12:687745. doi: 10.3389/fgene.2021.687745
43
Hu FB . Dietary pattern analysis: A new direction in nutritional epidemiology. Curr Opin Lipidol (2002) 13:3–9. doi: 10.1097/00041433-200202000-00002
Summary
Keywords
Mendelian randomization analysis, causal effects, food intakes, risk factors, inflammatory bowel disease
Citation
Chen B, Han Z and Geng L (2022) Mendelian randomization analysis reveals causal effects of food intakes on inflammatory bowel disease risk. Front. Immunol. 13:911631. doi: 10.3389/fimmu.2022.911631
Received
02 April 2022
Accepted
24 August 2022
Published
22 September 2022
Volume
13 - 2022
Edited by
Amber Farooqui, University of Toronto, Canada
Reviewed by
Marcos Edgar Herkenhoff, University of São Paulo, Brazil; Vanessa Fernandes Rodrigues, Department of Biochemistry and Immunology, University of São Paulo, Brazil; Giuseppe Murdaca, University of Genoa, Italy; Zhixing He, Zhejiang Chinese Medical University, China
Updates
Copyright
© 2022 Chen, Han and Geng.
This is an open-access article distributed under the terms of the Creative Commons Attribution License (CC BY). The use, distribution or reproduction in other forums is permitted, provided the original author(s) and the copyright owner(s) are credited and that the original publication in this journal is cited, in accordance with accepted academic practice. No use, distribution or reproduction is permitted which does not comply with these terms.
*Correspondence: Bingxia Chen, 2589935838@qq.com
This article was submitted to Nutritional Immunology, a section of the journal Frontiers in Immunology
Disclaimer
All claims expressed in this article are solely those of the authors and do not necessarily represent those of their affiliated organizations, or those of the publisher, the editors and the reviewers. Any product that may be evaluated in this article or claim that may be made by its manufacturer is not guaranteed or endorsed by the publisher.