 Sicong Li
 Lanxing Li
 Tianyan Pan
 Xiaoqun Li
 Yujia Tong
 Yongdong Jin
- 1School of Pharmacy, Peking University Health Science Centre, Beijing, China
- 2School of Medicine, University of Electronic Science and Technology of China, Chengdu, China
- 3Center of Disease Prevention Treatment, The Third Affiliated Hospital of Beijing University of Chinese Medicine, Beijing, China
- 4Institute of Medical Information, Chinese Academy of Medical Sciences/Peking Union Medical College, Beijing, China
- 5Department of Medical Oncology, Sichuan Cancer Hospital and Institute, Sichuan Cancer Center, School of Medicine, University of Electronic Science and Technology of China, Chengdu, China
Background: T-cell immunoreceptor with Ig and ITIM domains (TIGIT) participates in tumor immune escape by delivering inhibitory signals to T cells. The purpose of this article was to assess the prognostic value of TIGIT and its immunological function in solid cancers.
Methods: Three databases were searched for relevant articles. The main endpoints were overall survival (OS), progression-free survival (PFS), recurrence-free survival (RFS), and disease-free survival (DFS). Hazard ratios (HR) were pooled by using fixed-effects or random-effects models. Pancancer analysis of TIGIT was performed based on public online databases, mainly The Cancer Genome Atlas (TCGA), Genotype-Tissue Expression (GTEx), and UCSC Xena. The possible relationships between TIGIT expression and the tumor microenvironment (TME), infiltration of immune cells, immune-related genes, tumor mutation burden (TMB), and microsatellite instability (MSI) were revealed in this article.
Results: Sixteen studies met the inclusion criteria. High expression of TIGIT was associated with worse OS [HR= 1.73, 95% confidence interval (CI) 1.50, 1.99], PFS (HR = 1.53, 95% CI [1.25, 1.88]), RFS (HR = 2.40, 95% CI [1.97, 2.93]), and DFS (HR= 6.57, 95% CI [0.73, 59.16]) in East Asian patients with solid cancers. TIGIT expression was positively correlated with immune infiltration scores and infiltration of CD8 T lymphocytes in all of the cancers included. TIGIT was found to be coexpressed with the genes encoding immunostimulators, immunoinhibitors, chemokines, chemokine receptors, and major histocompatibility complex (MHC), especially in gastroesophageal cancer. TMB and MSI were also associated with TIGIT upregulation in diverse kinds of cancers.
Conclusion: High expression of TIGIT is associated with poorer prognosis in East Asian patients with solid cancers. TIGIT is a novel prognostic biomarker and immunotherapeutic target for various solid cancers because of its activity in cancer immunity and tumorigenesis.
1 Introduction
In the tumor microenvironment (TME), T cells are the second most abundant cell type after tumor-associated macrophages (TAMs) (1–3). Several immune inhibitor receptors (IRs), such as TIGIT, are upregulated in solid cancers and take part in tumor immune escape (4–6). As an important T-cell receptor in the TME, TIGIT competes with the costimulatory receptor cluster of differentiation 226 (CD226) for its interaction with the cluster of differentiation 155 (CD155) (7, 8) and participates in inhibiting adaptive and innate immunity. Highly expressed on active Regulatory T cells(Tregs), memory cluster of differentiation8(CD8) and memory cluster of differentiation (CD4) T-cell (9, 10), TIGIT can inhibit the cytotoxicity mediated by natural killer (NK) cells (1), the maturation and proinflammatory response of dendritic cells(DCs) (11), the effector functions of T helper cell 17(Th17) and T helper cell 1(Th1) cells (12), and enhance the immunosuppressive functions of Tregs by promoting the production of interleukin-10(IL-10) and fibrinogen-like protein 2 (Fgl2) (13).
The prognostic value of TIGIT has become a research hotspot in recent years, but the results remain controversial. Therefore, we conducted a meta- and bioinformatic analysis in this article for the following purposes: ①to evaluate the prognostic value of TIGIT in OS, DFS, PFS, and RFS and ② to determine the relationship between TIGIT expression and the tumor microenvironment and immune microenvironment.
2 Methods
2.1 Meta-analysis
2.1.1 Data sources and search strategy
This systematic review and meta-analysis were performed according to the Preferred Reporting Items for Systematic Reviews and Meta-Analysis (PRISMA) guidelines (14). Embase (https://www.embase.com/), PubMed (https://pubmed.ncbi.nlm.nih.gov/), and the Cochrane Library (https://www.cochranelibrary.com/) were searched for articles. The retrieval time was from inception to May 28, 2022. This review was registered on the PROSPERO platform (CRD42022324498). The search strategy is described in Supplementary Materials Tables 1–3.
2.1.2 Inclusion and exclusion criteria
Inclusion criteria included ① East Asian patients diagnosed with solid cancer before enrollment, ② randomized controlled trials (RCTs) or observational studies, ③ sufficient data about TIGIT expression and clinical outcome for meta-analysis, and ④ TIGIT expression was determined by using immunohistochemistry.
The exclusion criteria included ① case reports, single-cell sequencing data, animal experiments, meta-analyses, network meta-analyses, conference presentations, or study protocols.
2.1.3 Outcomes
Outcomes included ①overall survival (OS), ② progression-free survival (PFS), ③ recurrence-free survival (RFS), and ④ disease-free survival (DFS).
2.1.4 Study selection and data extraction
Two review authors (Sicong Li and Lanxing Li) independently reviewed the titles and abstracts of trials with potential eligibility. After that, we downloaded the full texts of trials eligible for inclusion. Two authors (Xiaoqun Li and Tianyan Pan) independently extracted the following data: ① basic information, including first author, publication year, sample size, country, and study design; ② characteristics of patients, including sex, age, type, and stage of cancer; ③ details about TIGIT, including expression location and cutoff value to judge high expression; ④ details about clinical outcomes; ⑤ information of cancer treatment; ⑥ information of quality assessment. Any disagreement was resolved by group discussion and consensus. We excluded results reported in only one study. In the studies that did not report HR values, we obtained the required data related to survival analysis from the survival curve by using GetData Graph Digitizer software.
2.1.5 Strategy for meta-analysis
This meta-analysis was performed by using R (version 4.0.3). The chi-square test and χ2 value were used to measure statistical heterogeneity. I2<50% and P value>0.05 indicated no substantial heterogeneity, and a fixed-effects model was used to pool the value of HR and 95% confidence interval. Otherwise, the random-effects model was used because of significant heterogeneity. Subgroup analysis was conducted to analyze sources of heterogeneity, while sensitivity analysis was conducted by excluding one study each time. Begg’s and Egger’s tests were used to assess publication bias. Statistical significance was set as α=0.05 in this study.
2.1.6 Quality assessment
Two reviewers (Yongdong Jin, Yujia Tong) assessed the quality of eligible studies independently by using the Newcastle–Ottawa Quality Assessment Scale (NOS) (15). The NOS assessed the quality of studies from the aspects of selection, comparability, and exposure, with a total score ranging from 0 to 9 points. More than 6 points was defined as high-quality.
2.2 Pan-cancer analysis
2.2.1 Data extraction and preprocessing
We downloaded the standardized pancancer data set from the UCSC (https://xenabrowser.net/) database: TCGA TARGET GTEx (PANCAN, N=19131, G=60499). Then, we extracted the expression data of the ENSG00000181847 (TIGIT) gene and 150 immune-related genes, including chemokines (n = 41), receptors (n = 18), major histocompatibility complexes (n = 21), immunoinhibitors (n = 24) and immunostimulators (n = 46), in normal solid tissues, primary solid tumors, normal tissues, primary blood-derived cancer-bone marrow, and peripheral blood. After excluding the cancer species with less than 3 samples in a single cancer species, the expression data of cancer species mentioned in the meta-analysis were finally obtained, including bladder urothelial carcinoma (BLCA), colon adenocarcinoma (COAD), colon adenocarcinoma/Rectum adenocarcinoma esophageal carcinoma (COADREAD), esophageal carcinoma (ESCA), liver hepatocellular carcinoma (LIHC), lung adenocarcinoma(LUAD), lung squamous cell carcinoma (LUSC), rectum adenocarcinoma (READ), stomach adenocarcinoma (STAD), skin cutaneous melanoma (SKCM), stomach and esophageal carcinoma(STES), thyroid carcinoma(THCA). We also extracted the gene expression profile of each tumor and converted the Tag names into gene symbols.
2.2.2 Differential expression of TIGIT among tumor and normal samples
We used the unpaired Wilcoxon-rank sum and signed-rank tests to compare the difference in TIGIT expression between normal samples and tumor samples in each tumor. A violin plot was used to visualize the results.
2.2.3 Differential expression of TIGIT among simple nucleotide variation (SNV) and copy number variation (CNV) data
From the GDC (https://portal.gdc.cancer.gov/) database, we downloaded the simple nucleoside variation (SNV) data set (level 4) and the copy number variation (CNV) data set (level 4) of all TCGA samples processed by MuTect2 (16) and GISTIC software (17), respectively. After removing samples of synonymous mutations, we obtained the expression data of 9 and 6 cancer species for CNV and SNV, respectively. Moreover, the domain information of TIGIT was obtained from the maftools package (version 2.2.10) of R software. A lollipop plot was used to depict the protein mutational distribution and domains.
2.2.4 Relevance between TIGIT expression and the tumor microenvironment
We used the ESTIMATE package (version 1.0.13, https://bioinformatics.mdanderson.org/public software/estimate/) (18) to calculate the stromal, immune, and estimate scores for the cancers included in this article. The increased stromal and immune scores indicated an increased proportion of immune cells or stromal cells in the TME. Furthermore, the corr.test function of the psych package in R software (version 2.1.6) was used to conduct Pearson’s correlation test.
2.2.5 Correlation between TIGIT expression and immune cell infiltration
We used the deconvo_CIBERSOR (19) and TIMER methods (20) in IOBR (version 0.99.9) (21) of R software to calculate the infiltration score of the 22 tumor-infiltrating immune cells, including naive B cells, memory B cells, plasma cells, CD8 T cells, naive CD4 T cells, resting and activated memory T cells, follicular helper T cells (Tfhs), regulatory T cells (Tregs), gamma delta T cells, resting and activated NK cells, monocytes, resting M0, M1 and M2 macrophages, resting and activated dendritic cells (DCs), resting and activated mast cells, eosinophils, and neutrophils. The results are displayed in the form of heatmap plots.
2.2.6 Associations of TIGIT expression with immune-related genes, tumor mutation burden (TMB) level and microsatellite instability (MSI) status
First, we calculated the Spearman correlation between TIGIT and the 150 immunomodulators. The results were visualized in heatmap plots. Then, we used the TMB function of the maftools package (version 2.8.05) in R software to calculate the TMB score for each tumor and obtained the MSI score of each tumor from a previous study reported by Russell Bonneville (22). We integrated the MSI and gene expression data of the samples and further performed log2 (x+0.001) transformation on each expression value. The correlation between TIGIT expression and TMB or MSI was analyzed by means of the Spearman correlation coefficient, and the results are displayed in the form of lollipop plots (23).
2.2.7 Protein−protein interaction network construction
GeneMANIA (http://www.genemania.org) was used to build a protein−protein interaction (PPI) network. Physical interaction, coexpression, and gene enrichment analyses were performed by using the network integration algorithm. The results were visualized by using the bioinformatic website (http://www.bioinformatics.com.cn/).
2.2.8 Construction of competing endogenous RNA (ceRNA) networks
First, we used miRwalk (http://mirwalk.umm.uni-heidelberg.de/accessed on 30 May 2022) to predict target miRNAs of TIGIT that can bind to the TIGIT 3′-UTR. Next, miRNA–lncRNA interactions were obtained from RNAInter v4.0 (http://www.rnainter.org/search/) with the species set as Homo sapiens. Finally, the ceRNA network was visualized by using Cytoscape 3.8.2 (24) software.
2.2.9 Statistical analysis
Statistical data analysis was conducted by using R software (version 4.0.3) (https://www.r-project.org/). The unpaired Wilcoxon-rank sum and signed-rank tests were used to analyze the significance of the difference between two groups, and the Kruskal test was used to test the difference among multiple groups of samples. The correlation between TIGIT expression and the other variable was assessed utilizing the Spearman correlation coefficient. P values of less than 0.05, 0.01 and 0.001 are presented as “*”, “**”, and “***”, respectively.
3 Results
3.1 Results of the meta-analysis
3.1.1 Search results
In total, 16 studies involving 2488 patients with solid cancers were found to meet the inclusion criteria. All of them were retrospective cohort studies. Although Pooja Ghatalia (25) and Pankaj Ahluwalia (26) reported the prognostic value of TIGIT in cancer patients, they did not report the hazard ratio or odds ratio value of TIGIT. Therefore, the patients included were from the East Asian population. The flow chart of the study selection process is presented in Figure 1.
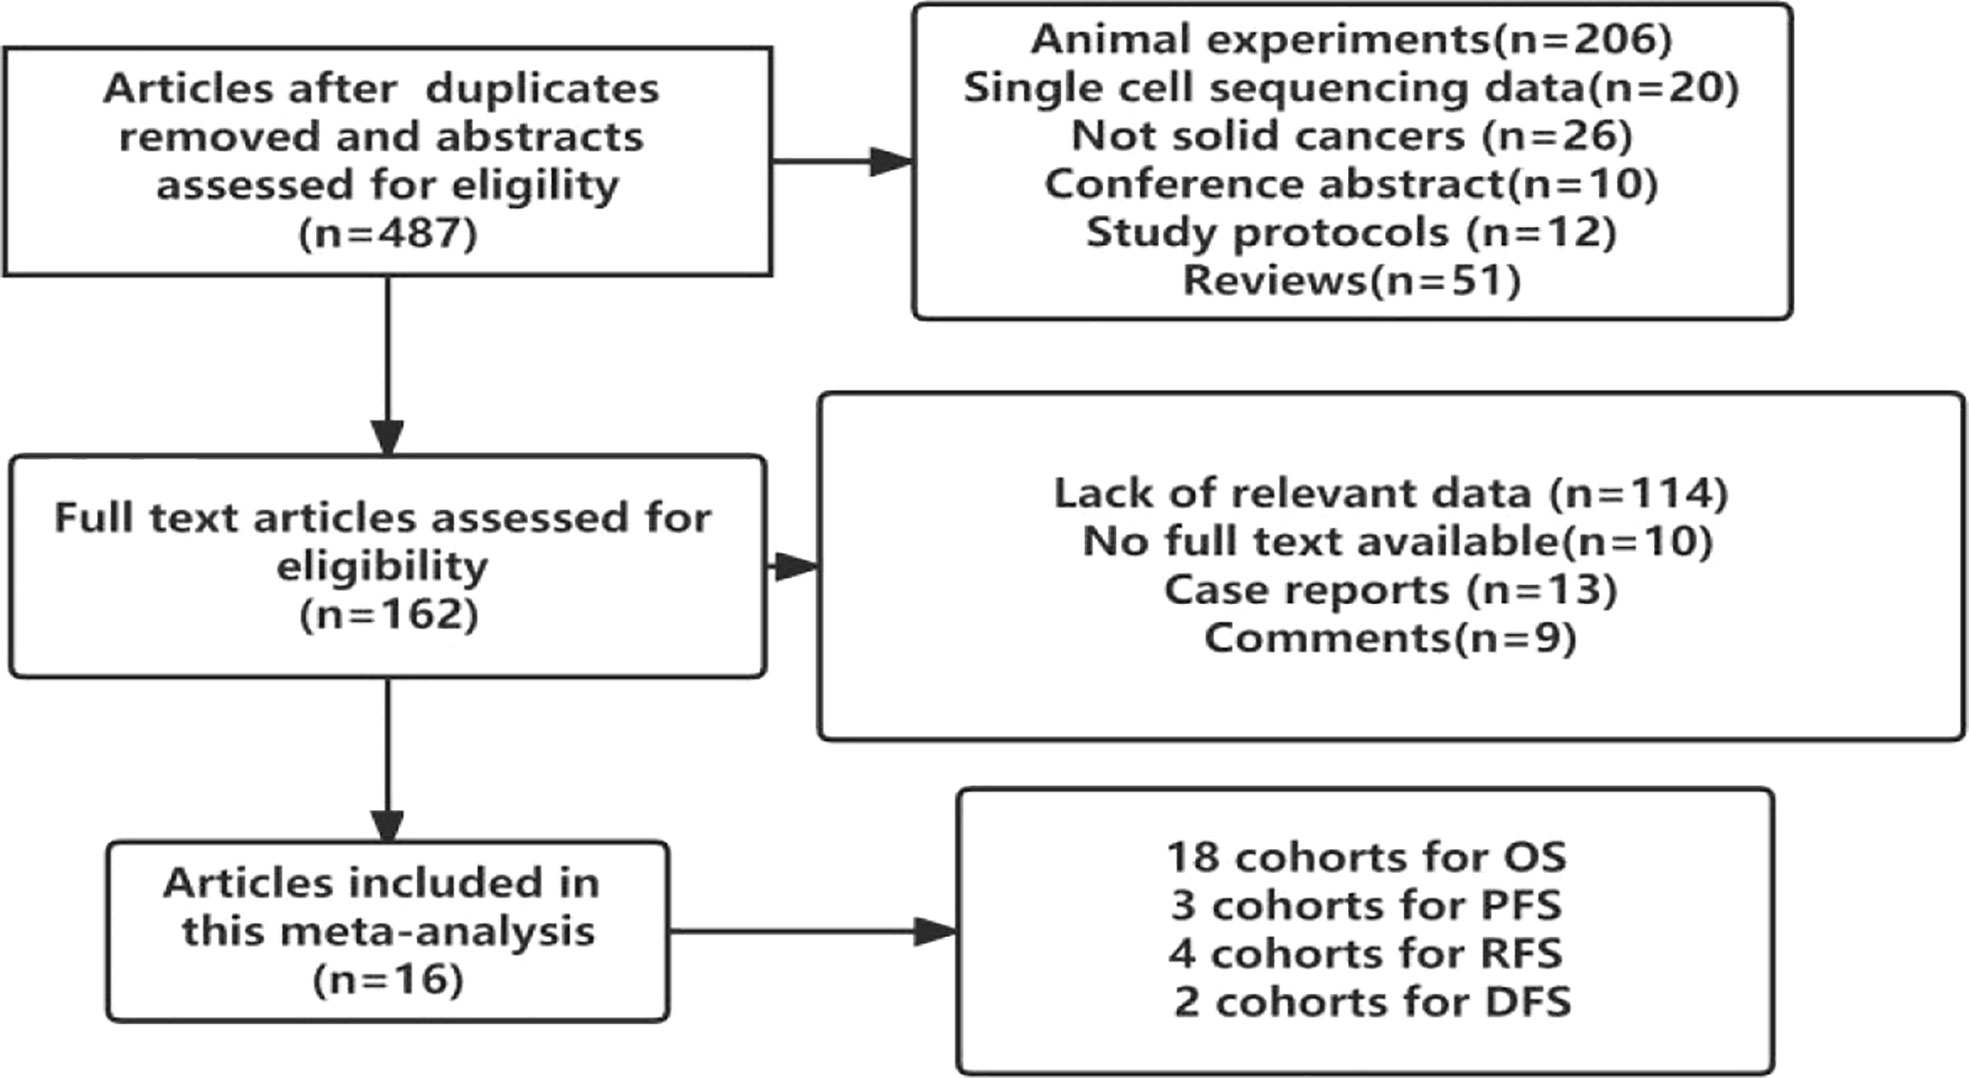
Figure 1 Study selection flowchart.
3.1.2 Study characteristics
The basic characteristics of the included studies are shown in Table 1. Studies were published between 2018 and 2022. Zhao JJ (27), Peipei Wang (28) and Zhao K (29) reported survival outcomes of esophageal squamous cell carcinoma (ESCC) or primary small cell carcinoma of esophagus (PSCCE), Tang W (30) and Liu HF (31) reported gastric cancer (GC), Xu Y (32) reported small cell lung cancer (SCLC), Sun Y (33) and Jiang C (34) reported non-small cell lung cancer (NSCLC), Zhou X (35), Liang R (36) and Daisuke Murakami (37) reported colorectal cancer (CRC), Lee WJ (38) reported melanoma, Yu LH (39) reported hepatitis B virus hepatocellular carcinoma (HBV-HCC), and Liu ZP et al. reported the ZSHS cohort and the FUSCC cohort that reported survival outcomes of patients with muscle-invasive bladder cancer (MIBC) (40). Luo Y reported (41) 3 cohorts of patients with advanced thyroid carcinoma (ATC), including anaplastic thyroid carcinoma (ATC), poorly differentiated thyroid carcinoma (PDTC), and locally advanced papillary thyroid carcinoma (PTC). HR values in the studies reported by Xu Y (2019), Liang R (2021), Lee WJ (2020), Sun Y (2020), and Zhao K (2020) were obtained by calculating the data extracted from the survival curve.
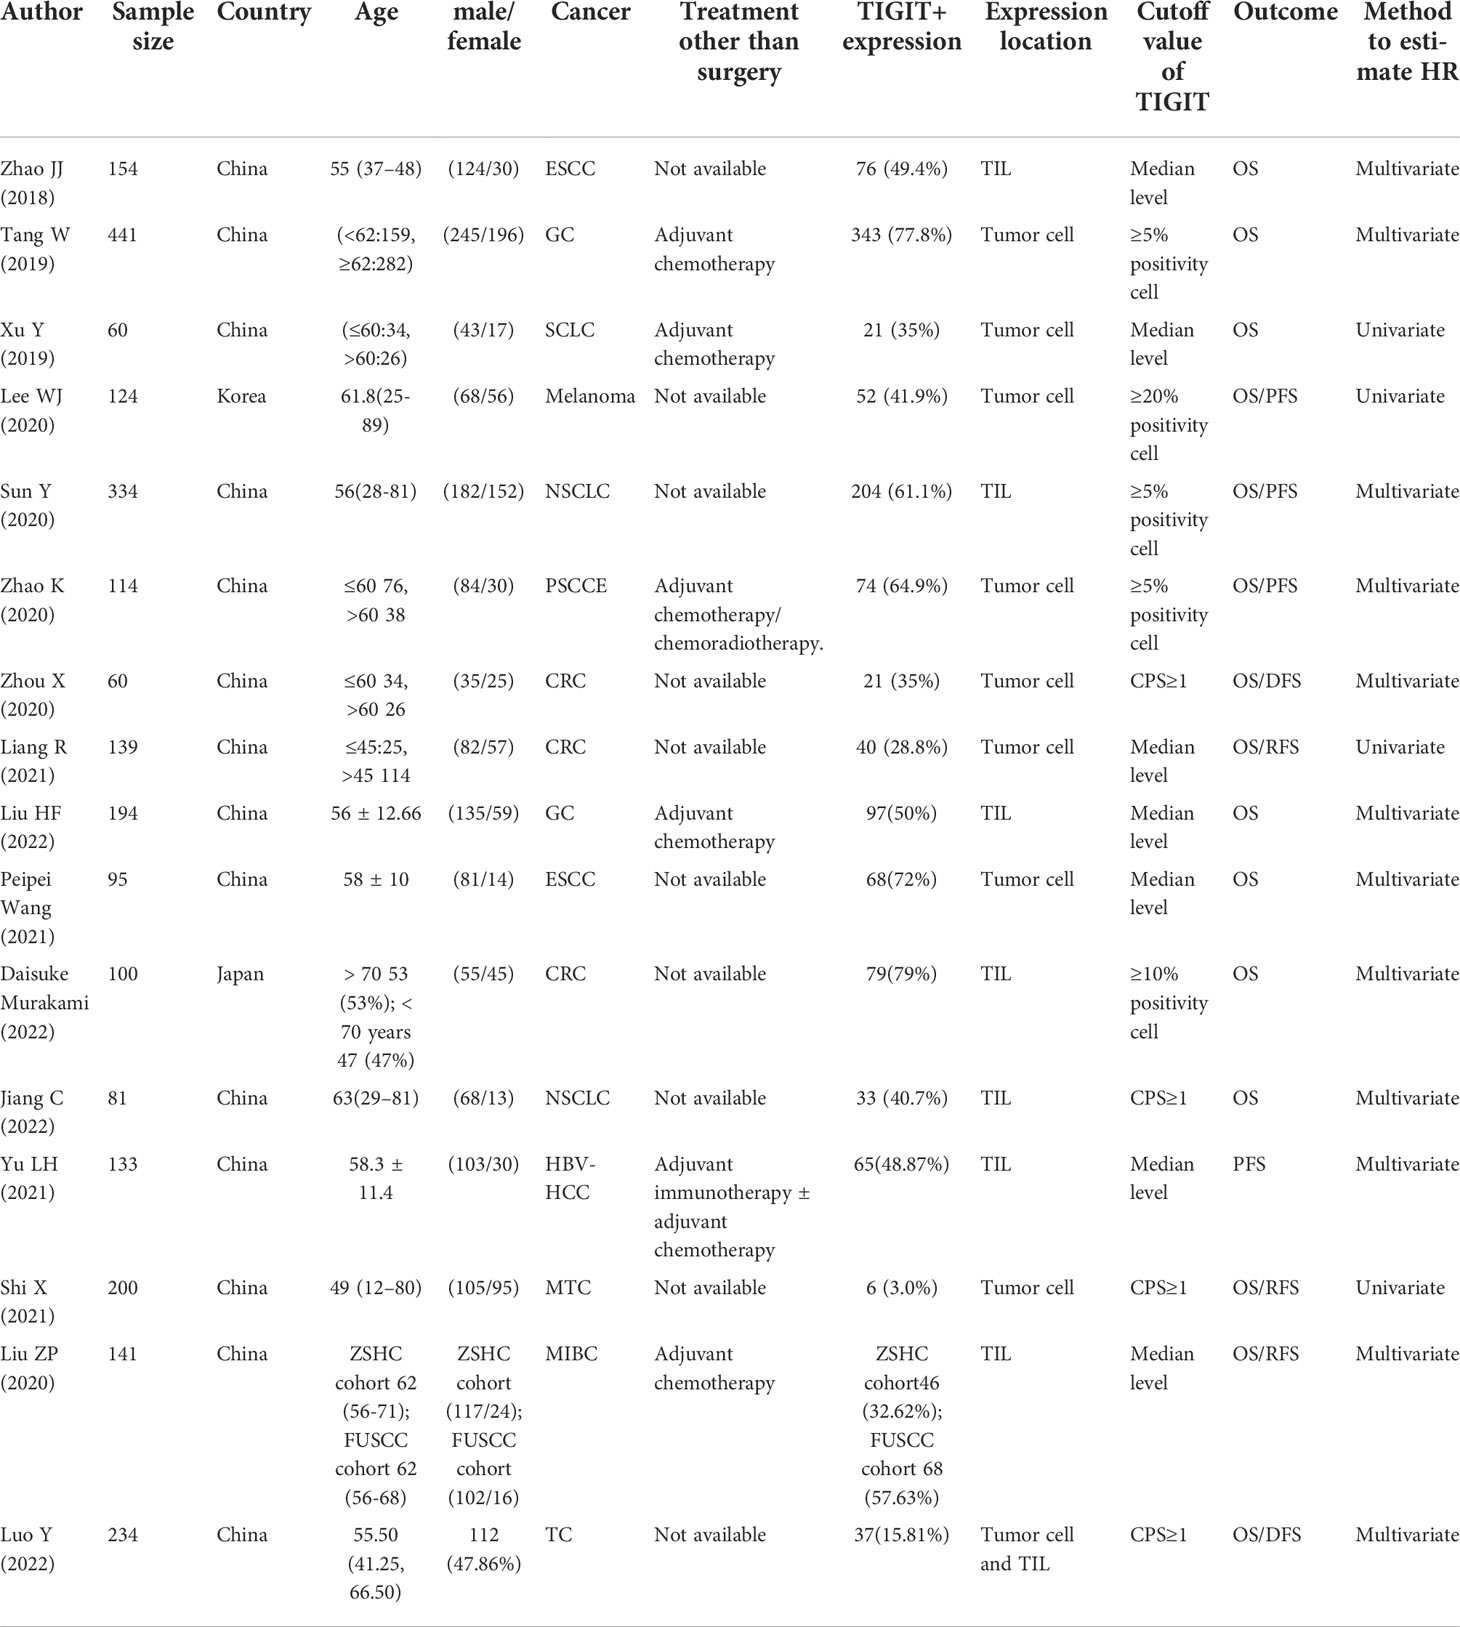
Table 1 Basic characteristics.
The HR values in the studies reported by Xu Y (2019), Liang R (2021), Lee WJ (2020), and Shi X (2021) were estimated by only univariate analysis, while the others were estimated by both multivariate analyses. Regarding the quality of the included studies, NOS scores ranged from 6 to 8.
3.1.3 Results of OS, PFS, RFS, and DFS
The I (2) value was less than 50%, and the p value was above 0.05, so the fixed-effect model was used in the comparison of OS, PFS, RFS, and DFS. The pooled results of the meta-analysis showed that high expression of TIGIT was associated with shorter OS (HR = 1.73, 95% CI [1.50, 1.99]), PFS (HR =1.53, 95% CI[1.25,1.88]), RFS (HR = 2.40, 95% CI [1.97, 2.93] and DFS (HR = 4.37, 95% CI [1.65, 11.55]) in patients with solid cancers than low expression of TIGIT (see Figure 2).
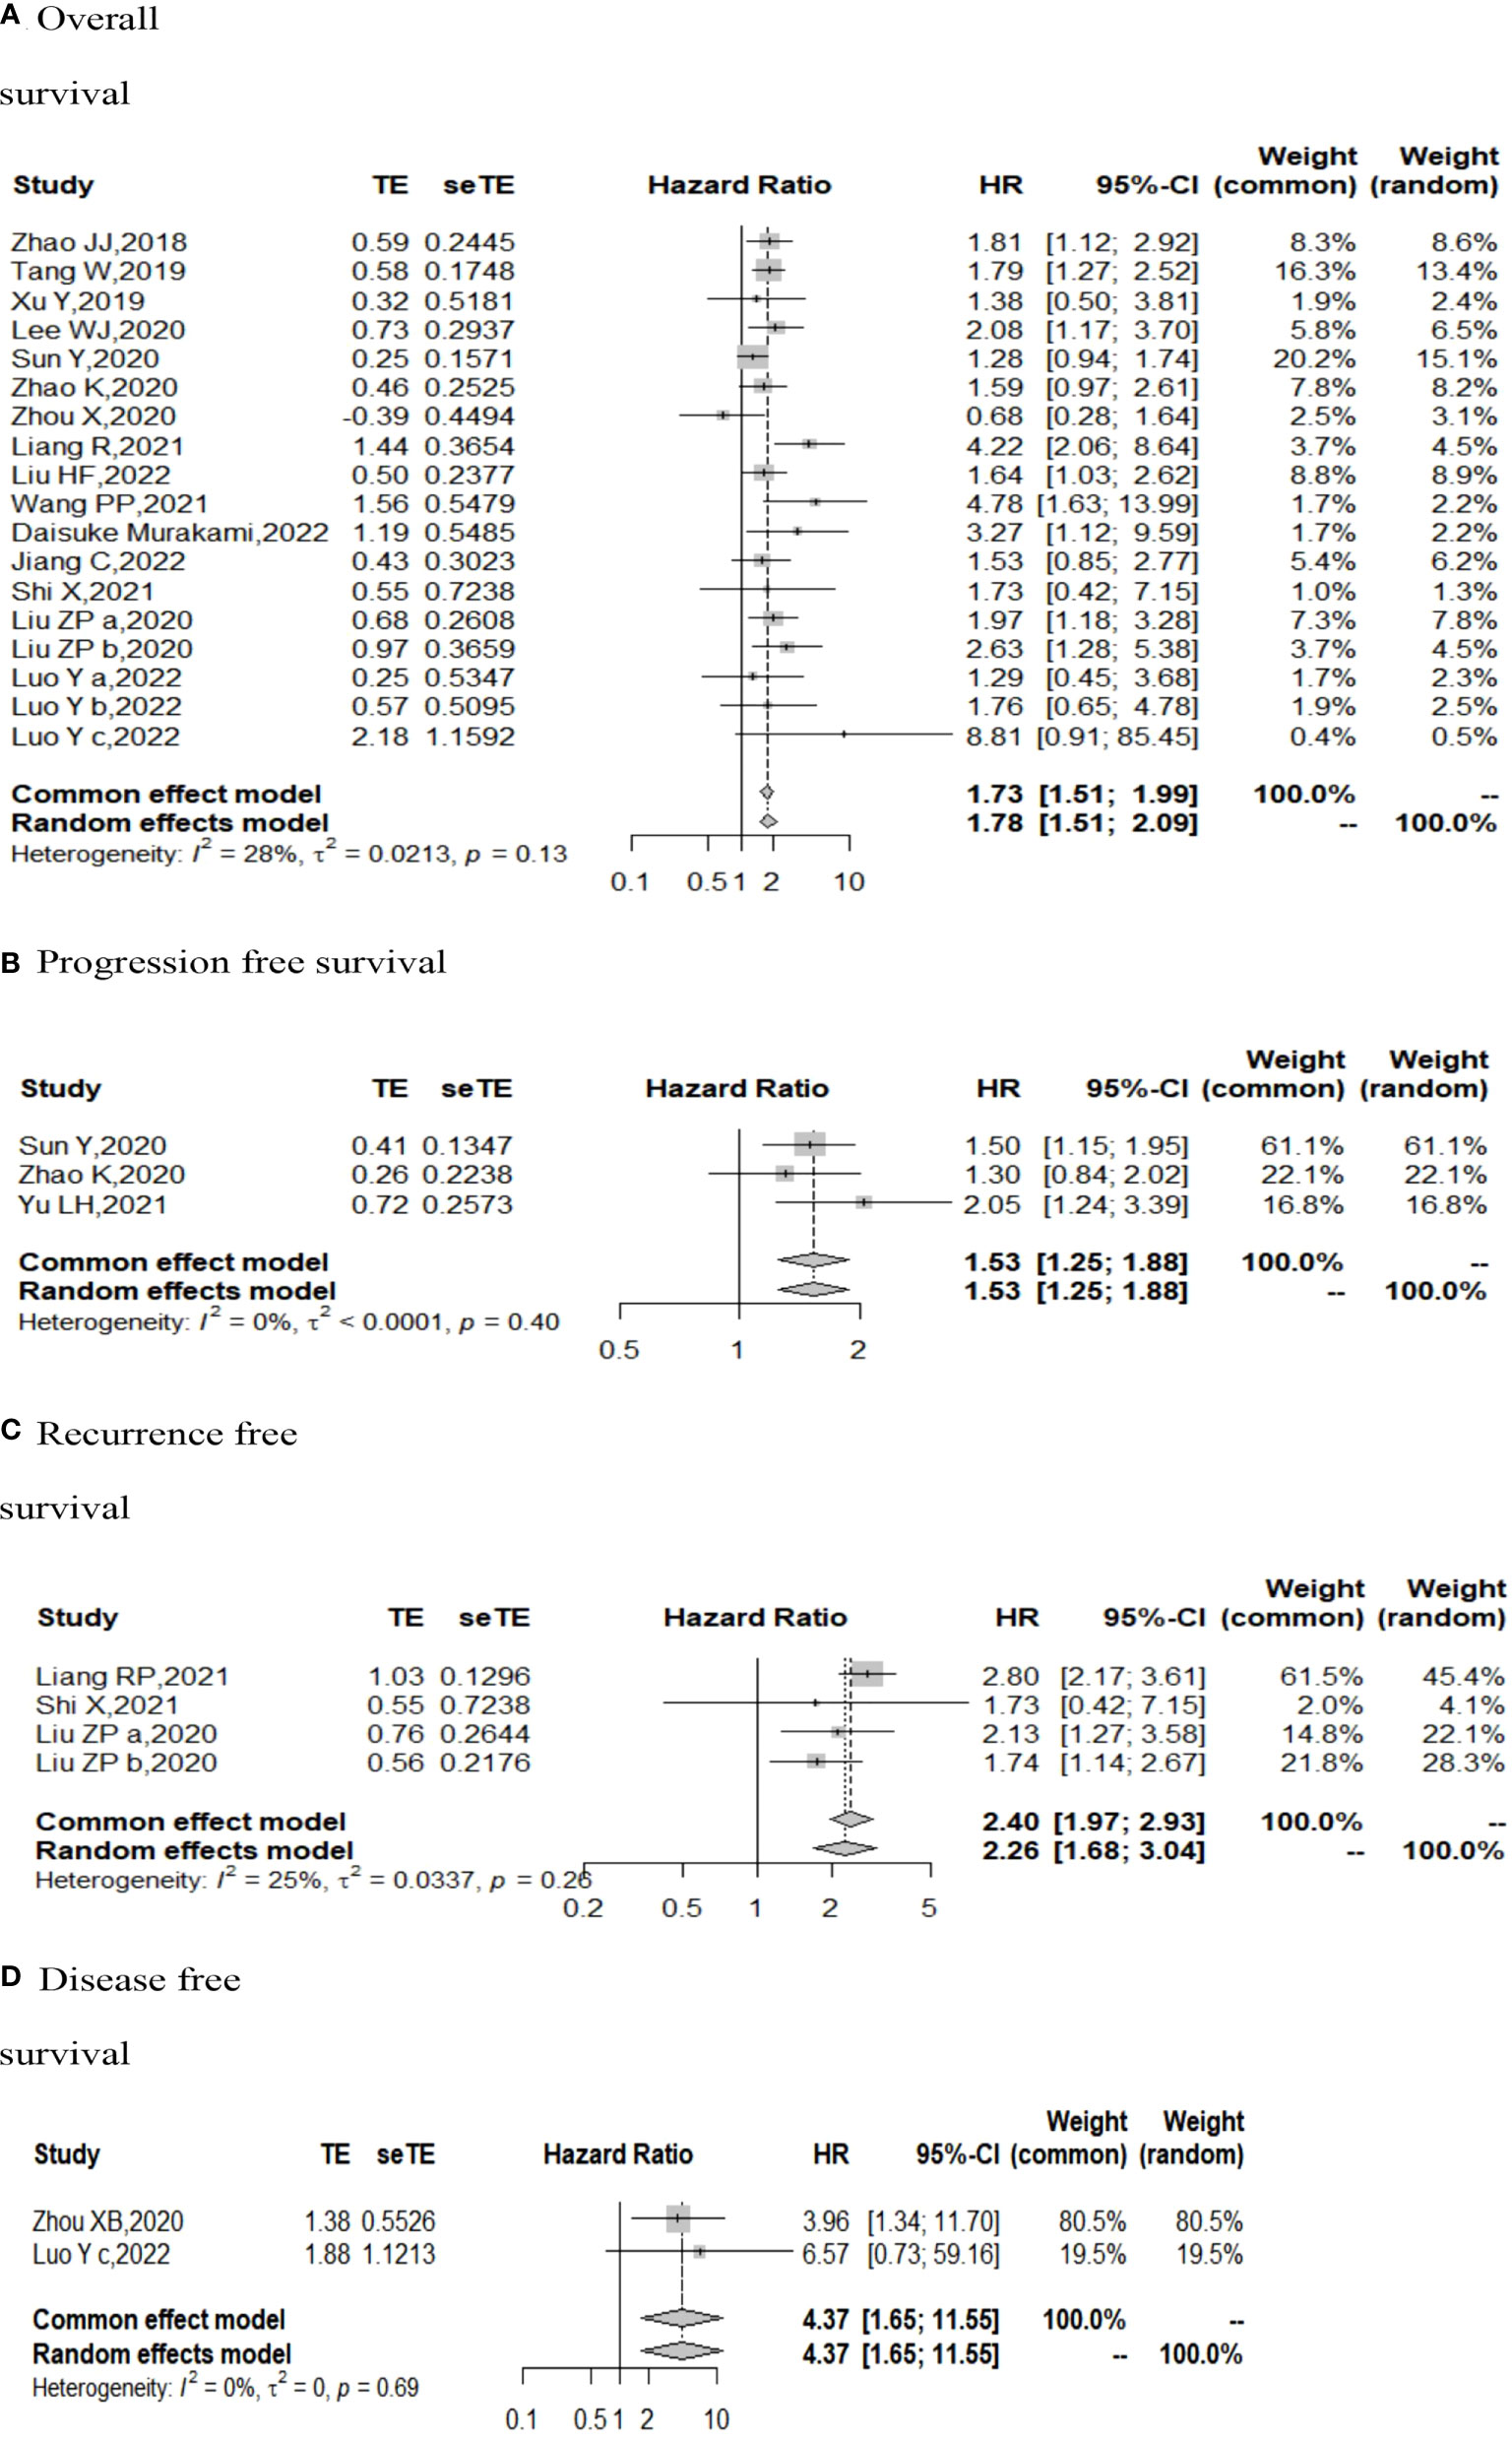
Figure 2 Forest plot for all outcomes. (A. Overall survival B. Progression free survival C. Recurrence free survival D. Disease free survival).
In the 2 studies about DFS, TIGIT was expressed on tumor cells, and CPS≥1 was set as the cutoff value of TIGIT expression. Moreover, multivariate analysis was used to estimate the HR value in the comparison of DFS and PFS, so we did not conduct subgroup analysis in these aspects. No significant prognostic value of TIGIT was found in the OS of cancers, including SCLC, CRC, MTC, ATC, PDTC and PTC. Studies with sample sizes <100 did not support the prognostic value of TIGIT and OS (HR = 1.55, 95% CI [0.76, 3.19]). PSCCE and TIGIT expressed on tumor cells did not support the prognostic value of TIGIT in PFS, while medullary thyroid carcinoma and papillary thyroid carcinoma did not support the prognostic value of TIGIT in RFS and DFS, respectively. Postoperative treatments were not found to be a source of heterogeneity in OS and RFS, probably because nearly half of the studies did not describe them. In terms of PFS, adjuvant chemotherapy/chemoradiotherapy did not support the prognostic value of TIGIT, and this result should be discussed with care because of limited study numbers and sample sizes (see Figures 3–6).
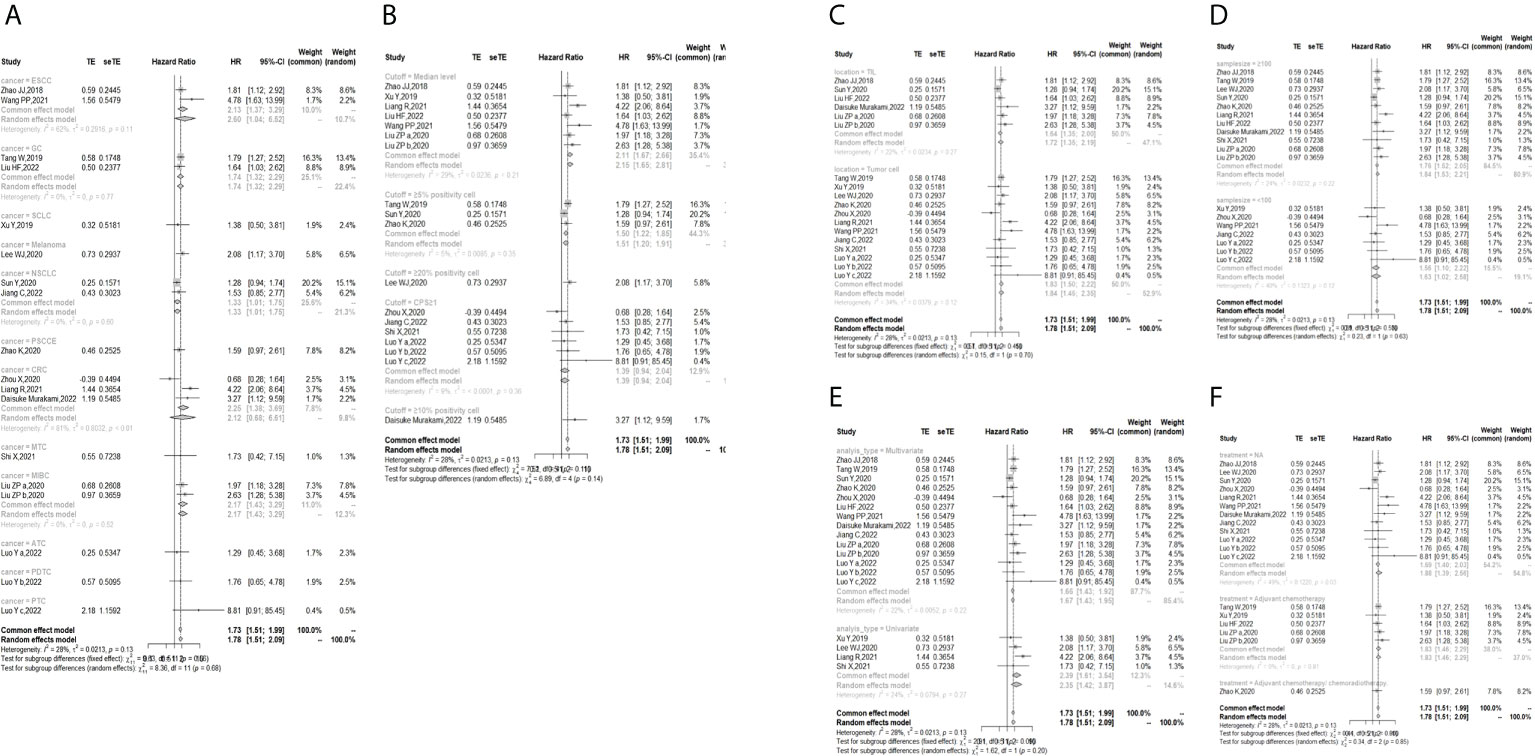
Figure 3 Subgroup analysis for the relationship between TIGIT and overall survival (A) Grouped by different cancers (B) Grouped by different cutoff values of TIGIT expression (C) Grouped by location of TIGIT expression (D) Grouped by sample size (E) Grouped by different methods to estimate HR (F) Grouped by different postoperative treatments).
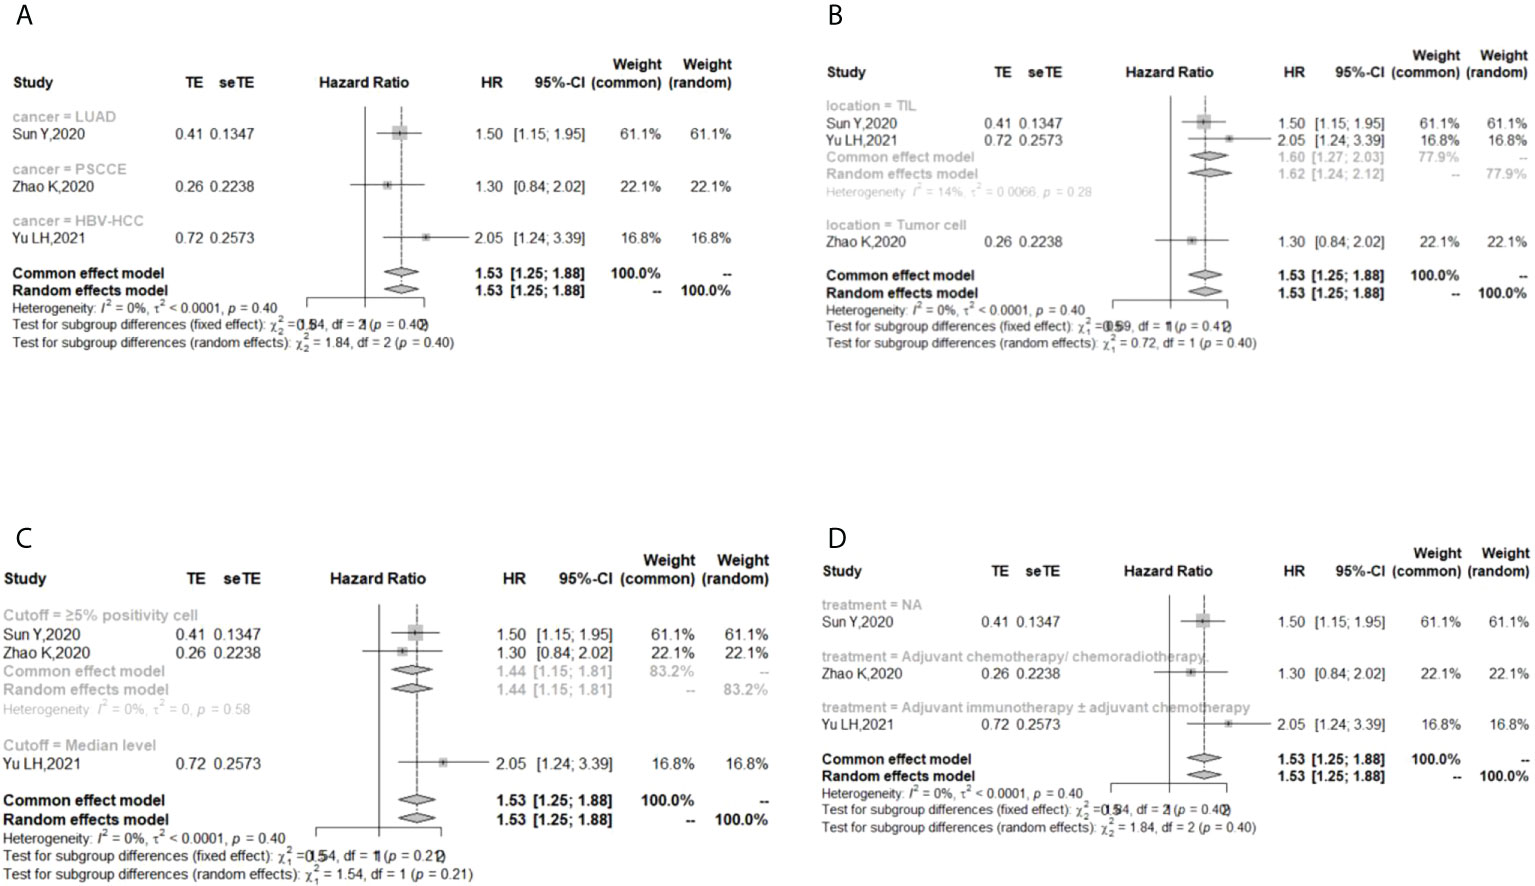
Figure 4 Subgroup analysis for the relationship between TIGIT and progression-free survival (A) Grouped by different cancers (B) Grouped by location of TIGIT expression (C) Grouped by different cutoff values of TIGIT expression (D) Grouped by different postoperative treatments).
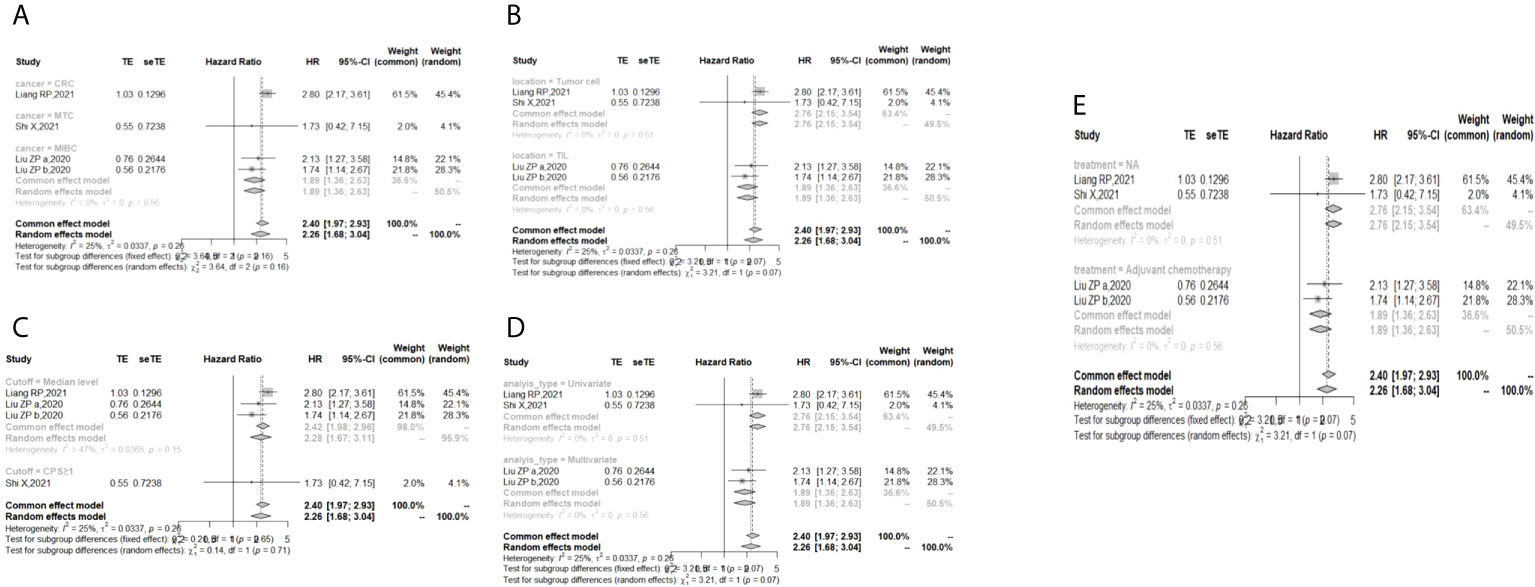
Figure 5 Subgroup analysis for the relationship between TIGIT and recurrence-free survival (A) Grouped by different cancers (B) Grouped by location of TIGIT expression (C) Grouped by different cutoff values of TIGIT expression (D) Grouped method to estimate HR (E) Grouped by different postoperative treatments).
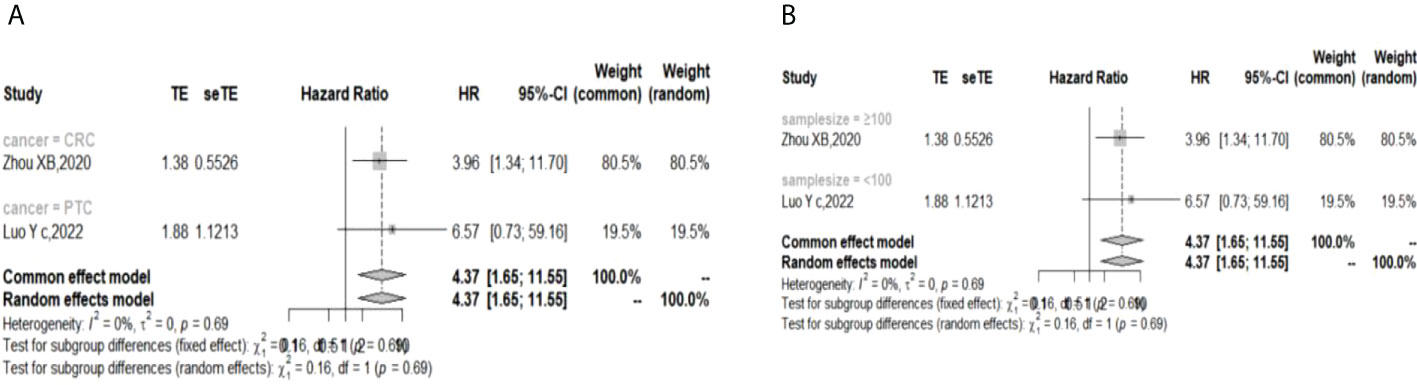
Figure 6 Subgroup analysis for the relationship between TIGIT and disease-free survival (A) Grouped by different cancers (B) Grouped by different sample sizes).
The p values of Begg’s test and Egger’s test for OS and RFS were above 0.05, which indicated no significant publication bias. In the sensitivity analysis, the DFS results would change if Zhou XB (2020) was omitted. (Liang R, 2021), (Yu LH,2021), (Liu ZP, 2020), and (Luo YC,2022) contributed the most to the overall heterogeneity in OS, PFS, RFS, and DFS, respectively.
3.2 Pancancer analysis
The design flow and implementation approaches of this study are illustrated in Figure 7. This study integrally revealed the role of TIGIT in the tumor immune microenvironment.
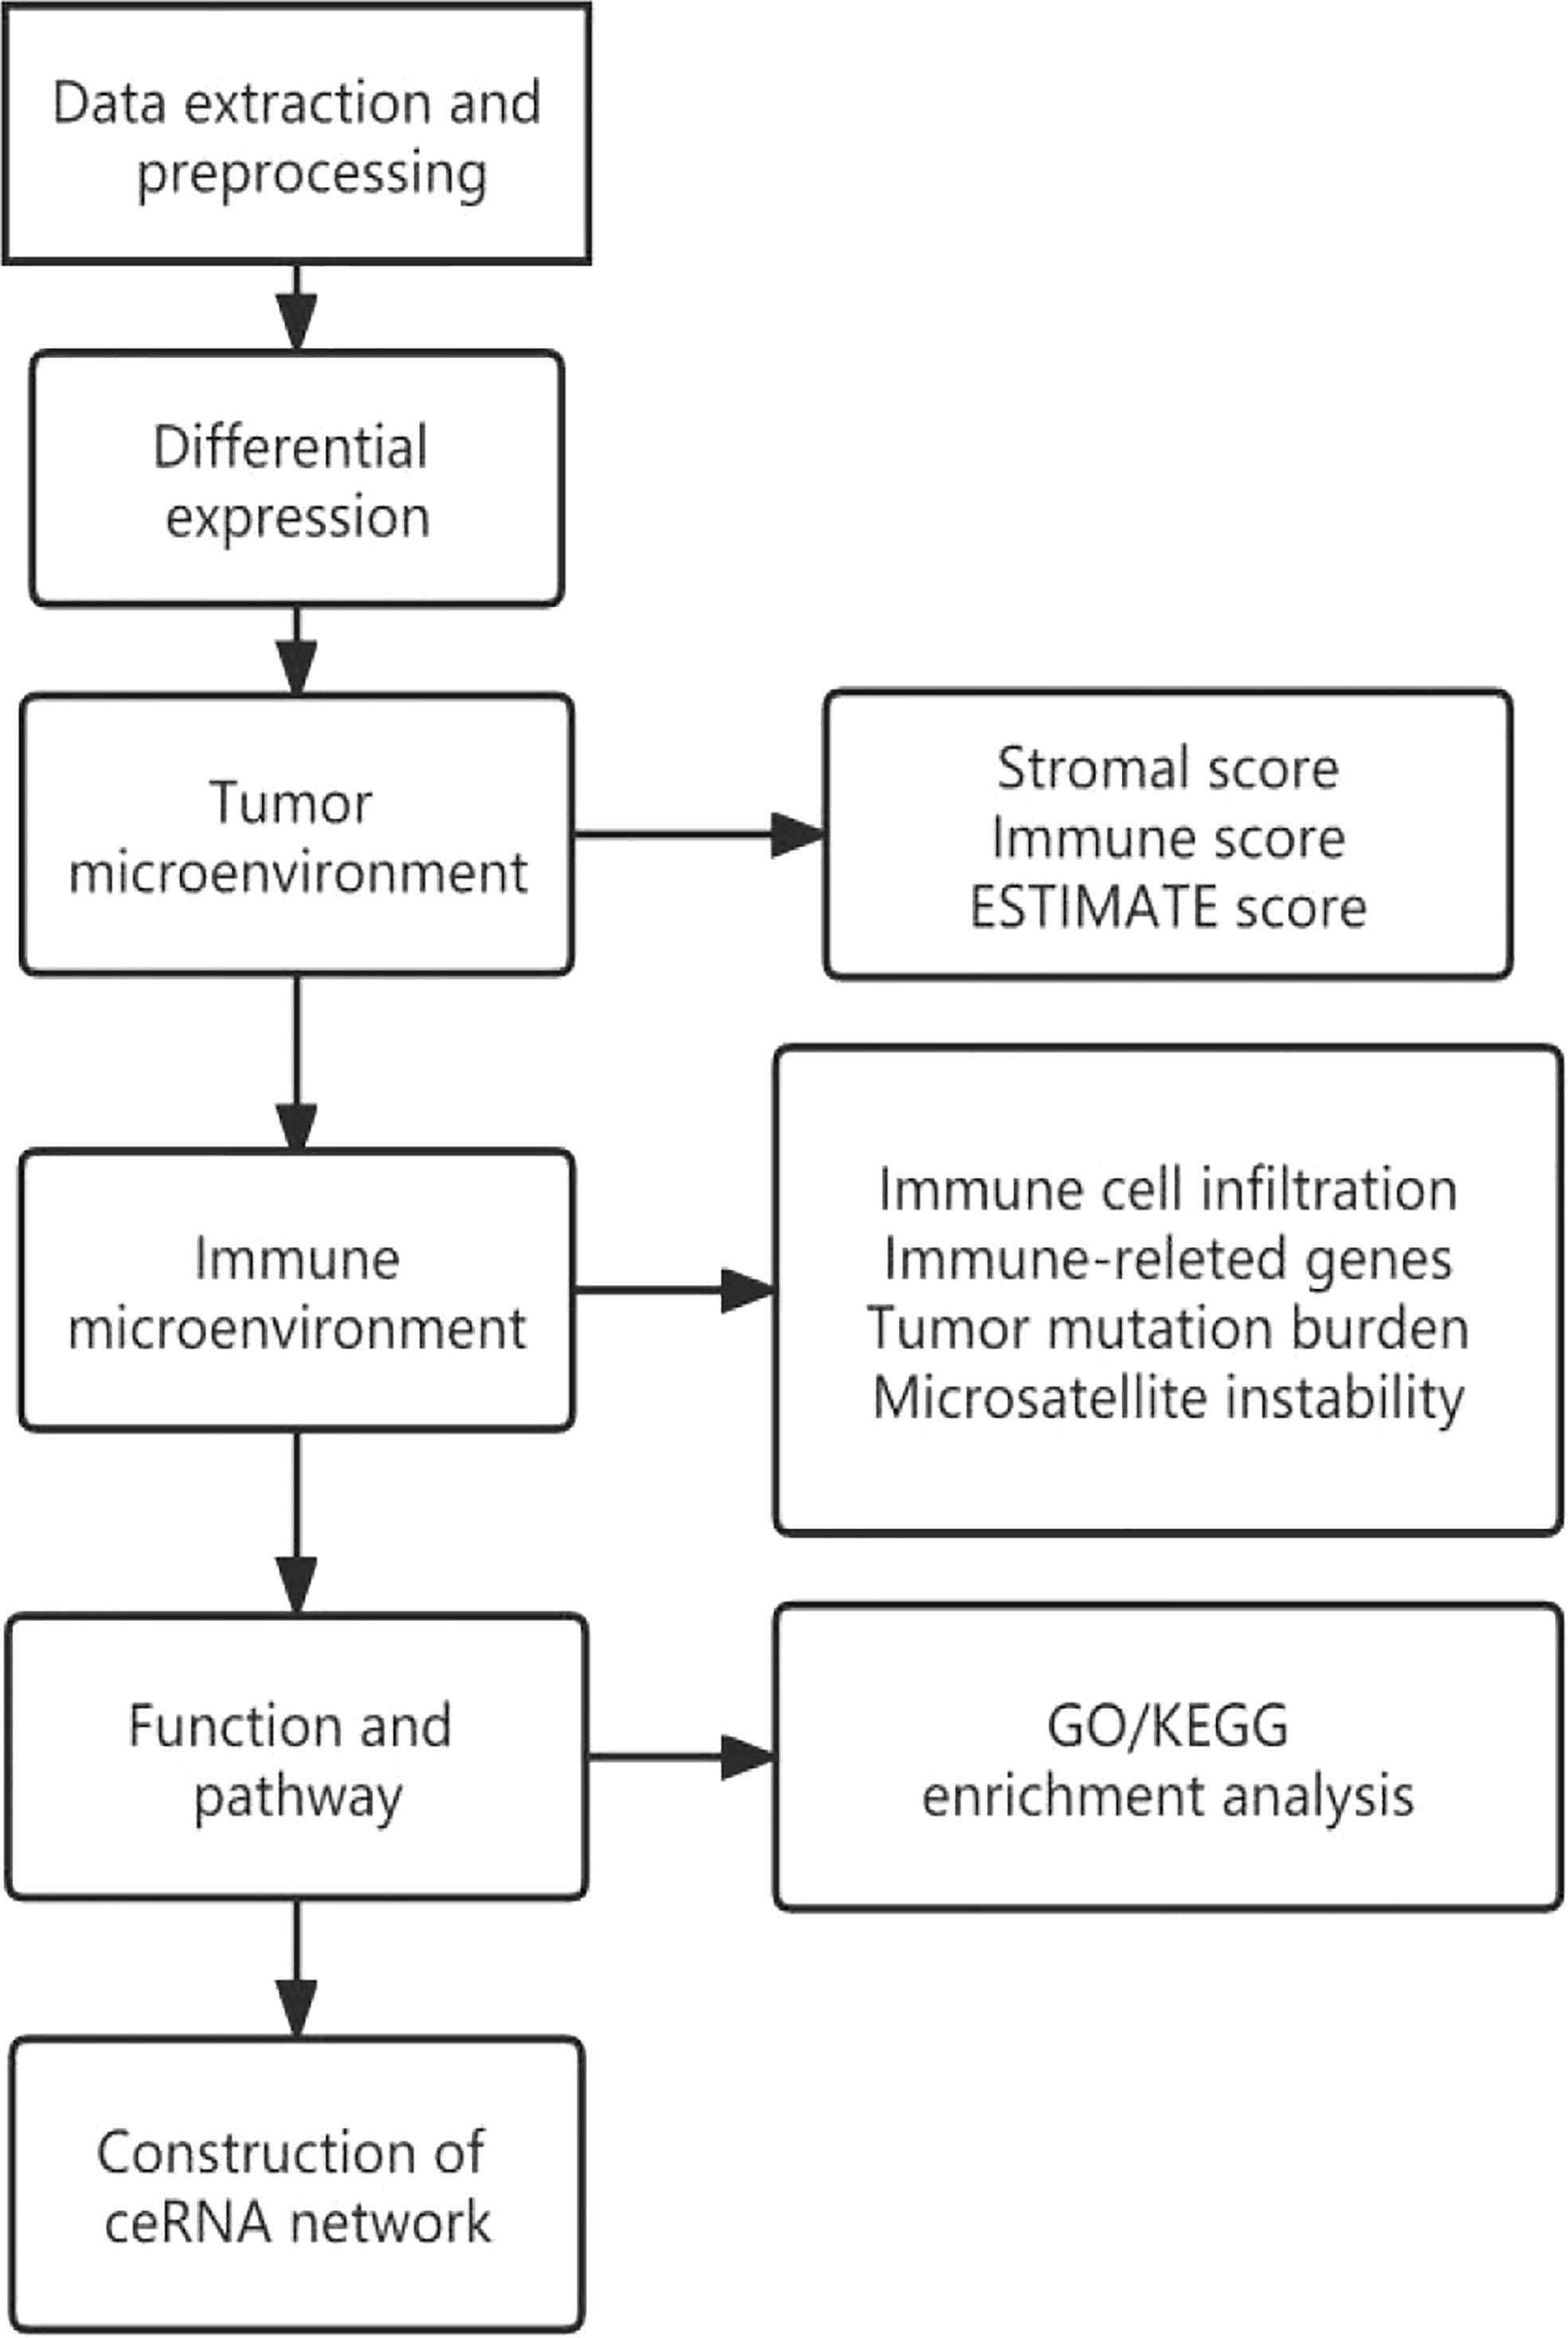
Figure 7 Flow chart of pancancer analysis.
3.2.1 Differential expression of TIGIT among cancer and normal samples
The expression of TIGIT was significantly upregulated in the 9 cancers involved in this study, including LUAD (tumor:1.44 ± 1.33, normal:0.49 ± 0.99, P=2.6e-32<0.05), ESCA (tumor: 0.29 ± 1.59, normal:-2.58 ± 1.72,P=2.5e-57<0.05), STES (tumor: 0.71 ± 1.57, normal: -2.35 ± 1.73, P=1.3e-151<0.05), COAD (tumor:0.01 ± 1.62,normal:-1.81 ± 2.07, P=1.4e-26<0.05), COADREAD (tumor:-0.03 ± 1.60,normal:-1.75 ± 2.08,P=1.9e-27<0.05), STAD (tumor:0.89 ± 1.53,normal:-1.66± 1.58,P=7.8e-54<0.05),LUSC (tumor:1.25 ± 1.36,normal:0.49 ± 0.99,P=1.8e-22<0.05),LIHC (tumor:-1.18 ± 1.86,normal:-1.71 ± 1.23,P=3.4e-3<0.05),SKCM (tumor:-0.10 ± 2.07,normal:-2.40 ± 1.31,P=1.6e-26<0.05),THCA (tumor:-0.51 ± 2.01,normal:-0.89 ± 1.92,P=1.6e-4<0.05). However, no significant difference was observed between cancer and normal samples in BLCA (P=0.09>0.05) and READ (P=0.11>0.05) (Figure 8). The TIGIT expression values in different cancers are shown in Supplementary Table 5.
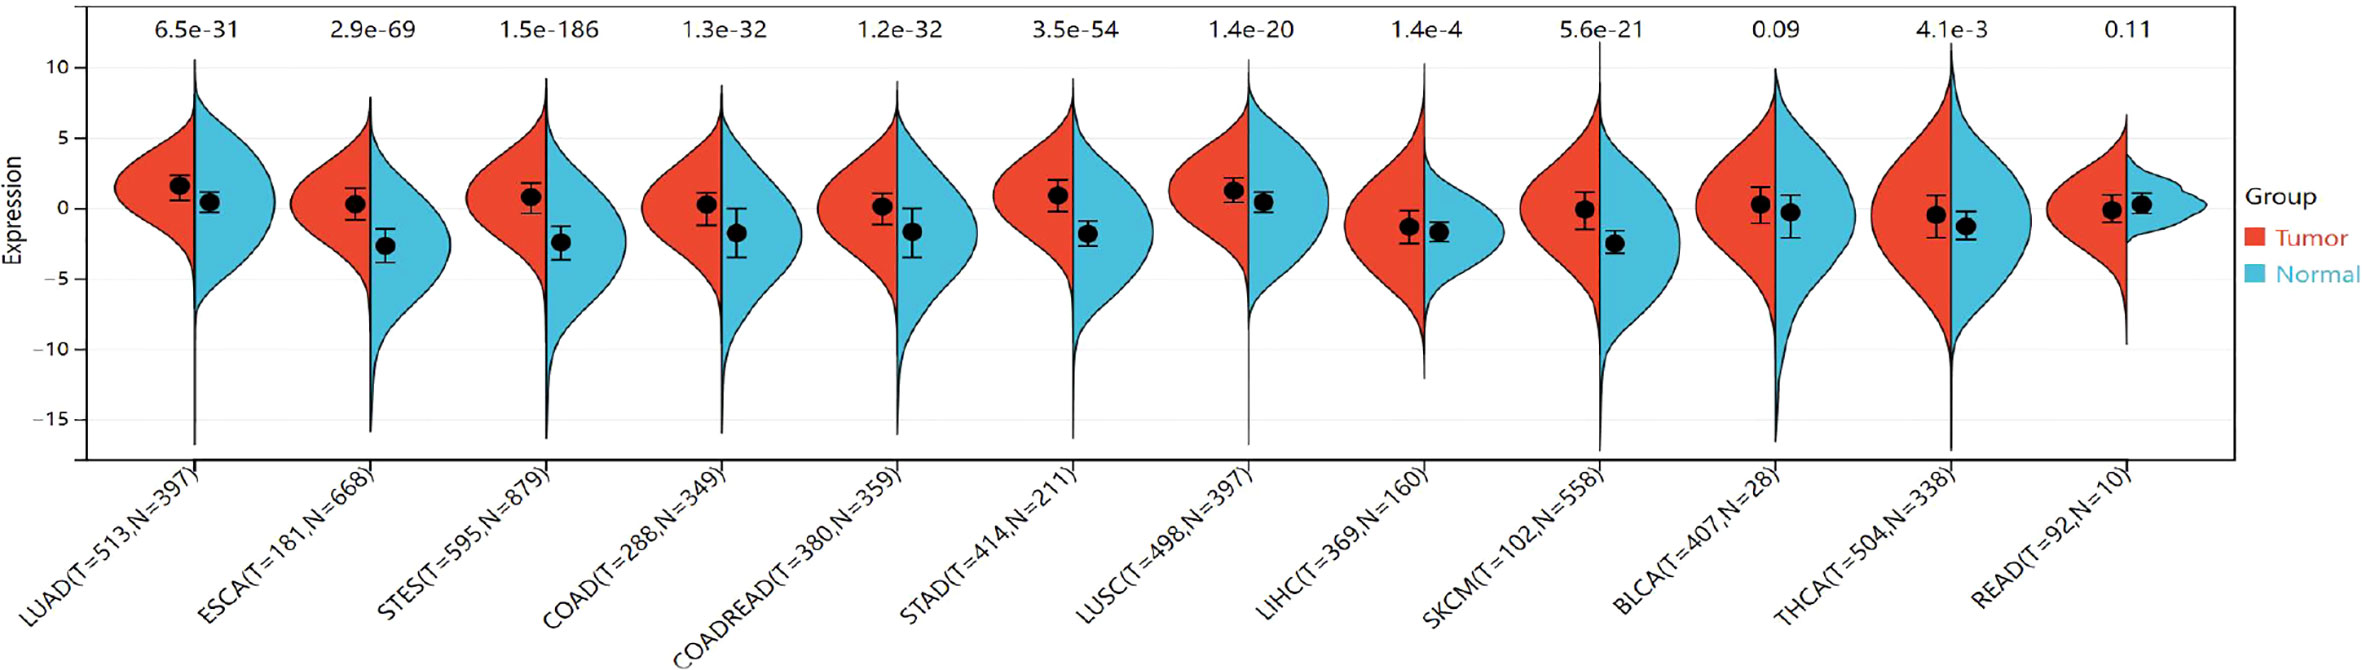
Figure 8 Differential TIGIT mRNA expression in 12 kinds of cancers and normal tissues by using the combination of box diagram and violin diagram. P values were presented by using scientific notation. LUAD, lung adenocarcinoma; ESCA, esophageal carcinoma; STES, Stomach and Esophageal carcinoma; COAD, colon adenocarcinoma; COADREAD, colon adenocarcinoma/Rectum adenocarcinoma esophageal carcinoma; STAD stomach adenocarcinoma; LUSC, Lung squamous cell carcinoma; LIHC, liver hepatocellular carcinoma; SKCM, skin cutaneous melanoma; THCA, hyroid carcinoma; READ, rectum adenocarcinoma.
3.2.2 Impact of CNV and SNV on TIGIT expression
TIGIT expression was higher in CNV neutrals than in CNV gains in STAD and LUSC. Moreover, TIGIT expression was higher in CNV neutral samples than in samples with CNV losses in LIHC and SKCM. This result indicated that CNV influenced TIGIT expression. No significant difference was found in TIGIT expression among patients with wild type and TIGIT mutation in terms of SNV.
Missense mutation was the most common type of mutation in the cancers included. Missense mutations in V-seIg were found in STES, COAD, COADREAD, LUAD, STAD, SKCM and READ. Among them, LUAD was found to have the most missense mutations. In-frame deletion occurred in COAD and COADREAD. A splice site was found in STAD and STES (see Figure 9). READ presented a relatively high mutation frequency (2.2%). TIGIT expression values in patients with wild-type, SNV or CNV are presented in Supplementary Tables 6, 7.
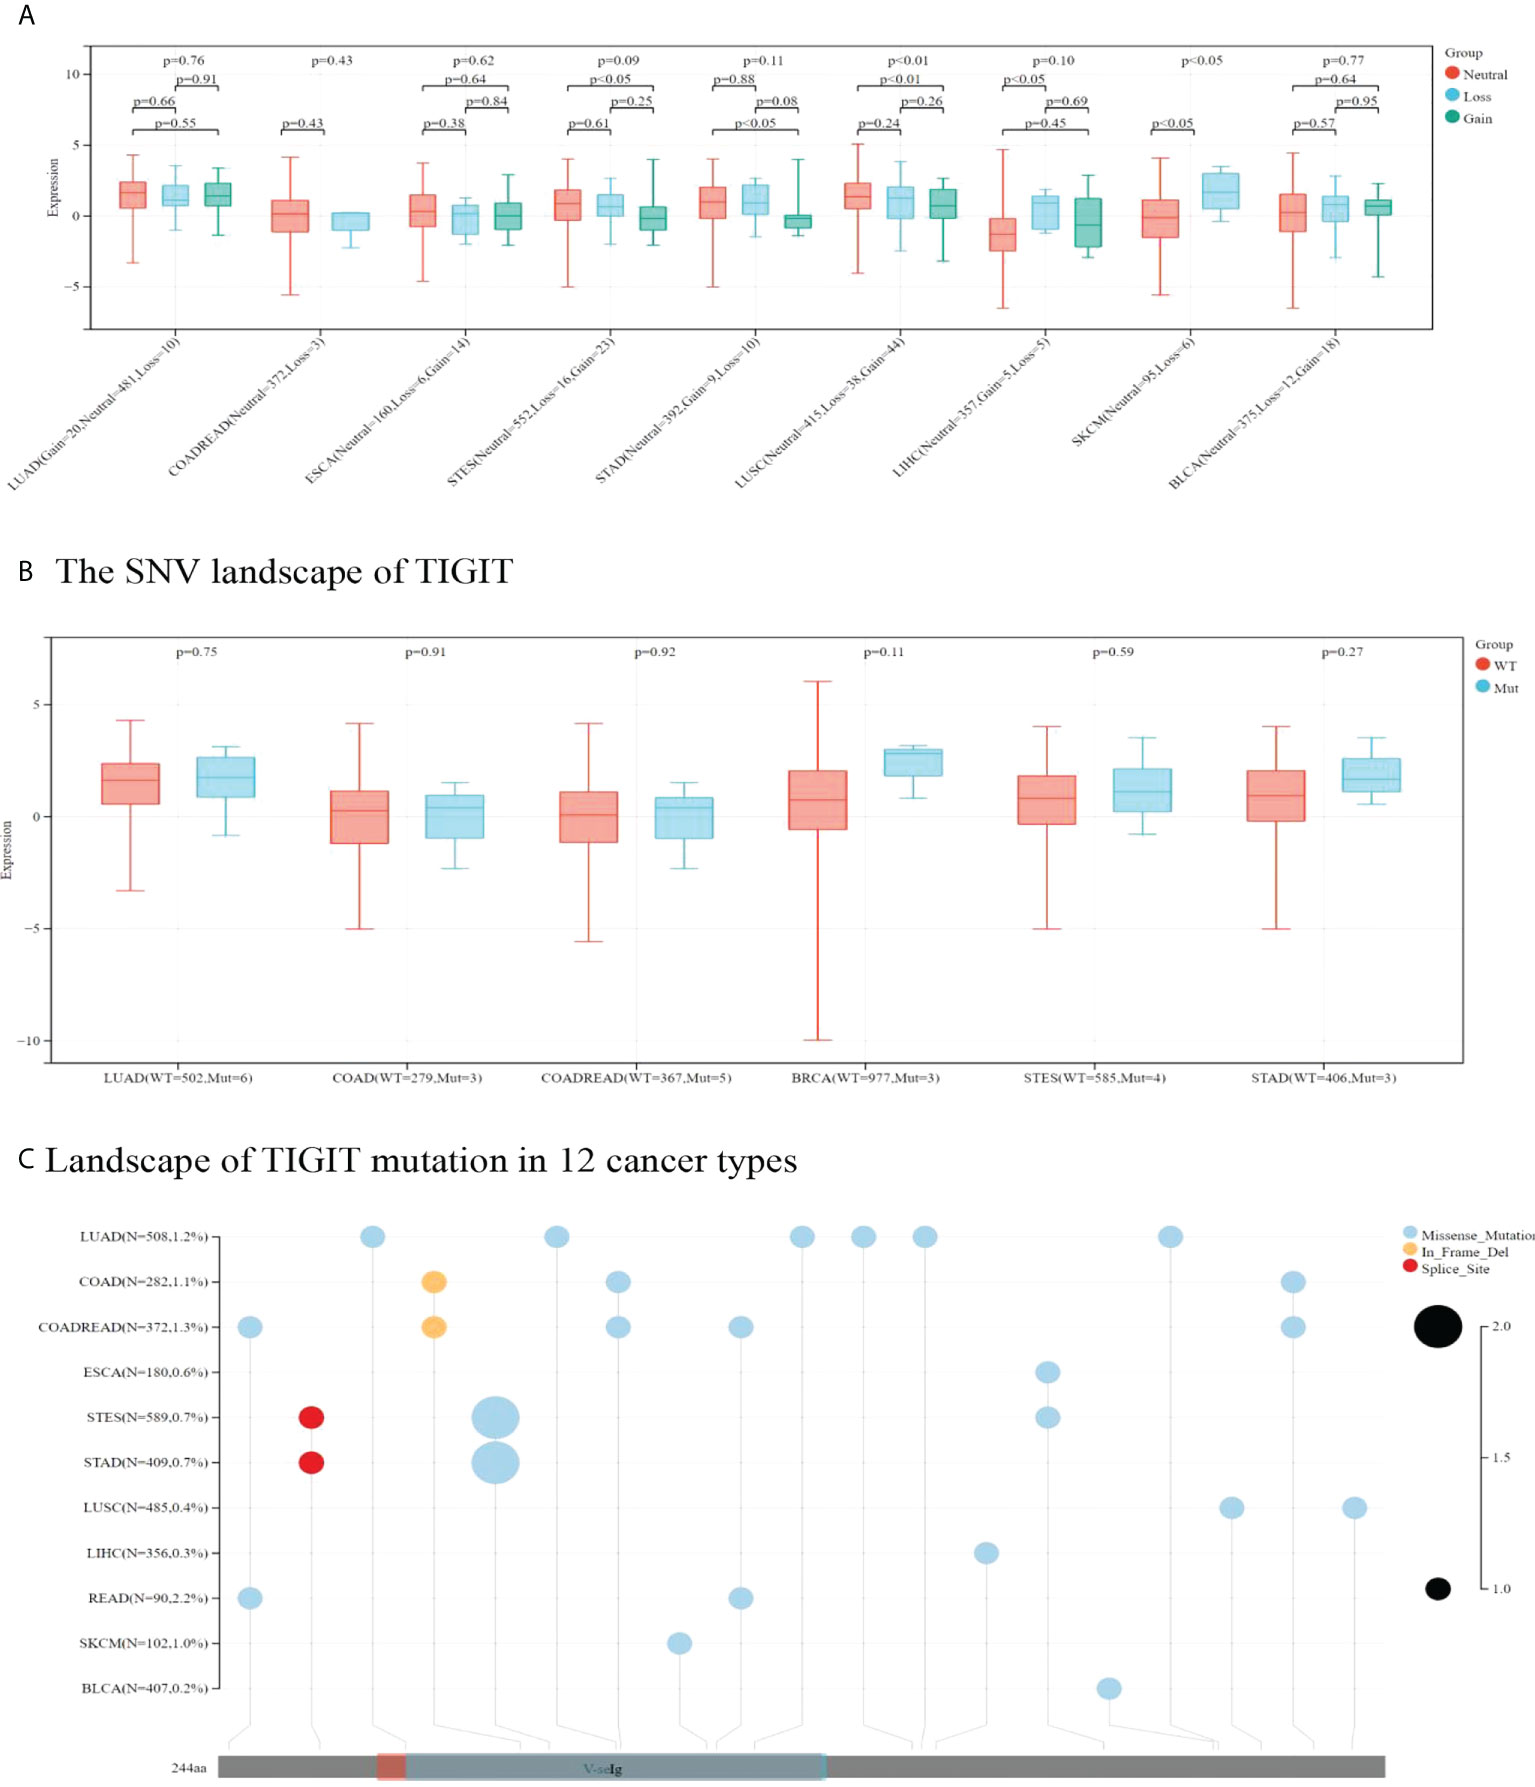
Figure 9 In A and B correlation between TIGIT expression and CNV and SNV were presented in boxplot. P values were presented by using scientific notation. In C, different color patches represent different domains of TIGIT. The sites marked with lollipops are mutation sites. Circular size represents mutation frequency.
3.2.3 Correlation between TIGIT expression and the tumor microenvironment
Stromal and immune cells are two main types of nontumor components in the TME. The ESTIMATE algorithm can help to predict the tumor purity in tumor samples. We calculated the Spearman correlation coefficient between TIGIT expression and immune infiltration scores by using corr.test psych (version 2.1.6) in R software. Finally, a significant positive correlation was observed between TIGIT expression and immune infiltration scores (Stromals score, Immunes score and ESTIMATE score) in 12 kinds of cancers involved in these studies (see Supplementary Figures 5–7).
3.2.4 Correlation between TIGIT expression and the infiltration score of immune cells (CIBERSORT AND TIMER)
Tumor-infiltrating immunocytes could affect the survival prognosis of patients. TIGIT expression showed a positive correlation with the infiltration scores of CD8 T cells (especially in SKCM), M1 macrophages in 12 kinds of cancers, naive B cells in 10 kinds of cancers, activated memory CD4 T cells, Tregs in LUAD, LUSC, LIHC, SKCM, THCA, COADREAD and activated NK cells in LUAD, LUSC, SKCM, STES, BLCA. TIGIT expression was also negatively correlated with activated dendritic cells and mast cells in most of the cancers included. The correlation coefficient between TIGIT expression and immune cell infiltration (CIBERSORT) is presented in Supplementary Table 8. Moreover, TIGIT expression was found to be positively related to B cell, CD4, CD8 T cell, neutrophil, macrophage and DC infiltration in most cancers based upon the TIMER algorithm (Figure 10).
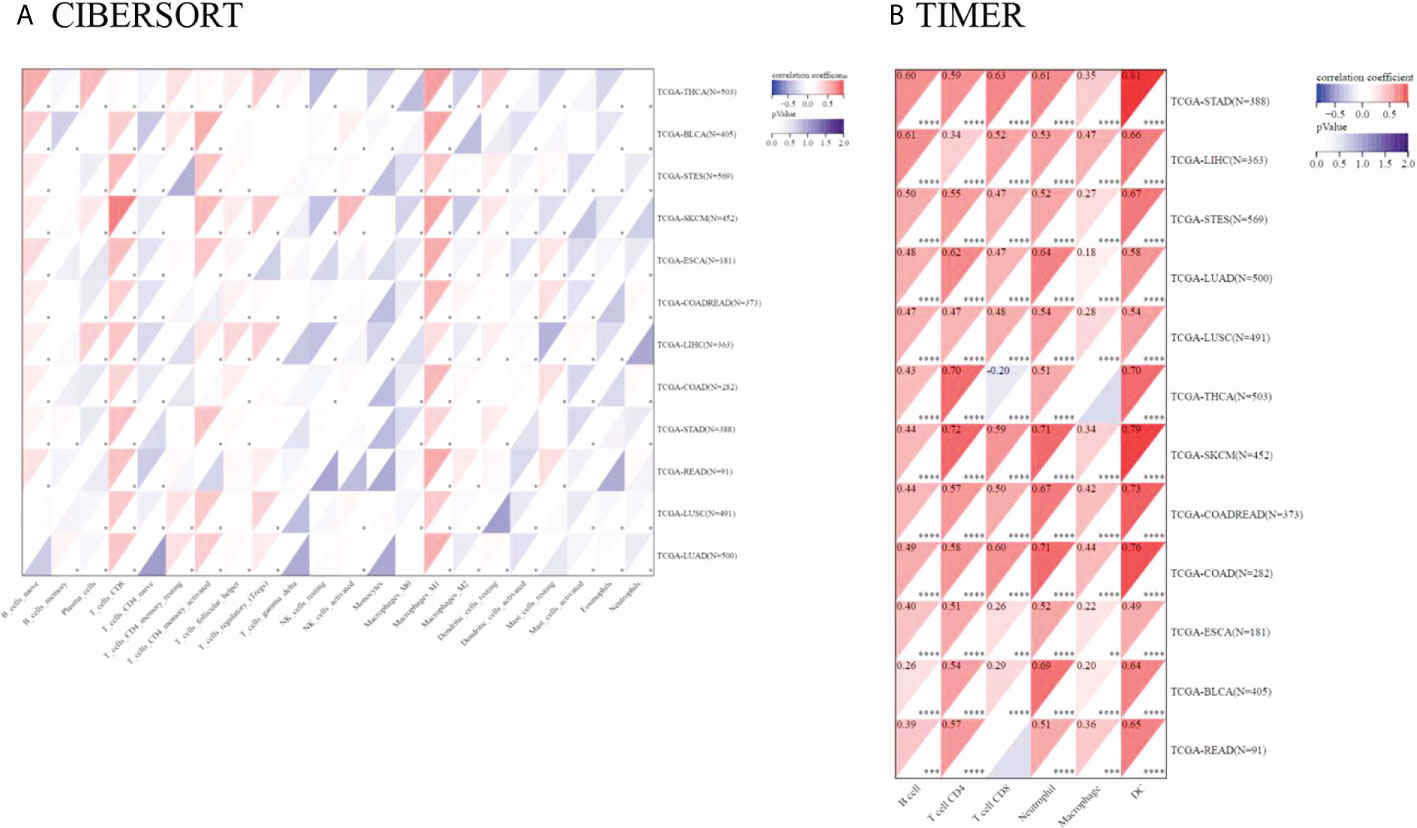
Figure 10 Pancancer analysis of the Spearman correlation between TIGIT expression and immune cell infiltration. CIBERSORT in (A), TIMER in (B). Red represents a positive correlation, and blue represents a negative correlation. The darker the color is, the greater the correlation coefficient. ∗P< 0.05, ∗∗P< 0.01, ∗∗∗P< 0.001 and ∗∗∗∗p< 0.0001.
3.2.5 Correlation between TIGIT expression and 150 immune-related genes
The results showed that TIGIT exhibited a significant coexpression relationship with most chemokines, receptors, major histocompatibility complex (MHC), immunoinhibitors and immunostimulators. Notably, TIGIT expression was positively correlated with the expression of programmed cell death 1 (PDCD1), programmed cell death 1 ligand 2 (PDCD1LG2), cytotoxic T-lymphocyte associated protein 4 (CTLA4), lymphocyte activating 3 (LAG3), indoleamine 2,3-dioxygenase 1 (IDO1), interleukin 10 (IL-10), and transforming growth factor beta 1 (TGFB1), especially in gastroesophageal tumors and melanoma (Figure 11).
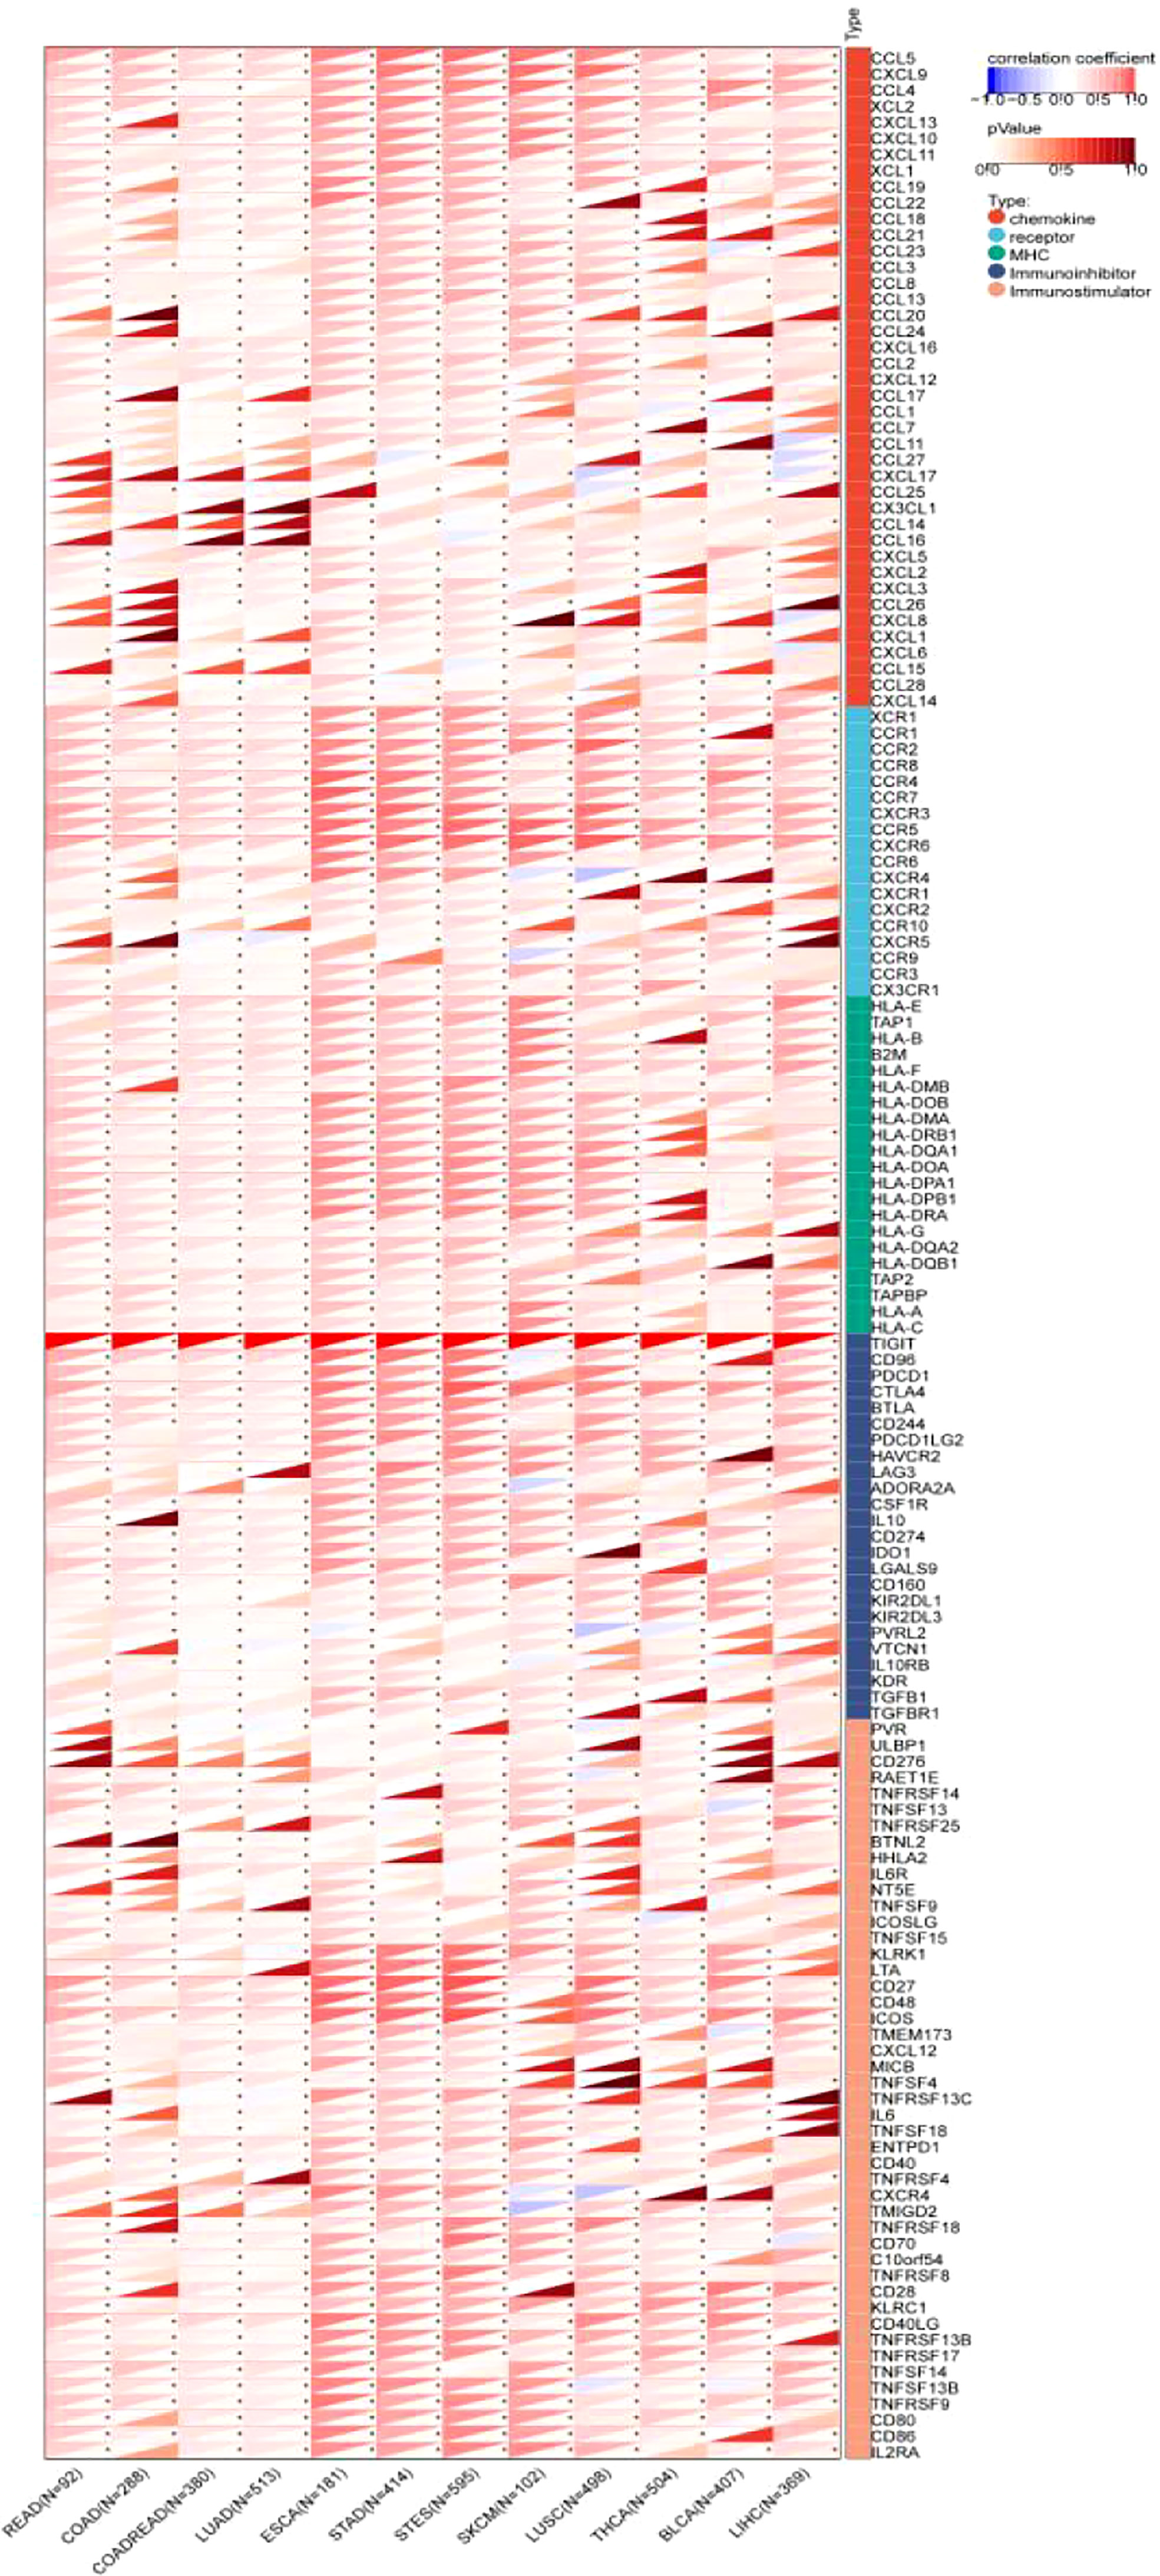
Figure 11 Pancancer analysis of the Spearman correlation betweenTIGIT expression and 150 immune-related genes, including 41 chemokines, 24 immunoinhibitors, 46 immunostulators, 21 MHCs and 18 receptors. Red represents a positive correlation, and blue represents a negative correlation. The darker the color is, the greater the correlation coefficient. ∗P< 0.05, ∗∗P< 0.01, and ∗∗∗P< 0.001. CCL5, C-C Motif Chemokine Ligand 5; CXCL9, C-X-C Motif Chemokine Ligand 9; CCL4, C-C Motif Chemokine Ligand 4;XCL2, X-C Motif Chemokine Ligand 2; CXCL13, C-X-C Motif Chemokine Ligand 13; CXCL10, C-X-C Motif Chemokine Ligand 10; CXCL11, C-X-C Motif Chemokine Ligand 11; XCL1, X-C Motif Chemokine Ligand 1; CCL19, C-C Motif Chemokine Ligand 19; CCL22, C-C Motif Chemokine Ligand 22; CCL18, C-C Motif Chemokine Ligand 18; CCL21, C-C Motif Chemokine Ligand 21; CCL23, C-C Motif Chemokine Ligand 23; CCL3, C-C Motif Chemokine Ligand 3; CCL8, CC Motif Chemokine Ligand 8; CCL13, C-C Motif Chemokine Ligand 13; CCL20, C-C Motif Chemokine Ligand 20; CCL24, C-C Motif Chemokine Ligand 24; CXCL16, C-X-C Motif Chemokine Ligand 16; CCL2, C-C Motif Chemokine Ligand 2; CXCL12, C-X-C Motif Chemokine Ligand 12; CCL17, C-C Motif Chemokine Ligand 17; CCL1, C-C Motif Chemokine Ligand 1; CCL7, C-C Motif Chemokine Ligand 7; CCL11, C-C Motif Chemokine Ligand 11; CCL27, C-C Motif Chemokine Ligand 27; CXCL17, C-X-C Motif Chemokine Ligand 17; CCL25, C-C Motif Chemokine Ligand 25; CX3CL1, C-X3-C Motif Chemokine Ligand 1; CCL14, C-C Motif Chemokine Ligand 14; CCL16, C-C Motif Chemokine Ligand 16; CXCL5, C-X-C Motif Chemokine Ligand 5; CXCL2, C-X-C Motif Chemokine Ligand 2; CXCL3, C-X-C Motif Chemokine Ligand 3; CCL26, C-C Motif Chemokine Ligand 26; CXCL8, C-X-C Motif Chemokine Ligand 8; CXCL1, C-X-C Motif Chemokine Ligand 1; CXCL6, C-X-C Motif Chemokine Ligand 6; CCL15, C-C Motif Chemokine Ligand 15; CCL28, C-C Motif Chemokine Ligand 28; CXCL14, C-X-C Motif Chemokine Ligand 14; XCR1, X-C Motif Chemokine Receptor 1; CCR1, C-C Motif Chemokine Receptor 1; CCR2, C-C Motif Chemokine Receptor 2; CCR8, C-C Motif Chemokine Receptor 8; CCR4, C-C Motif Chemokine Receptor 4; CCR7, C-C Motif Chemokine Receptor 7; CXCR3, C-X-C Motif Chemokine Receptor 3; CCR5, C-C Motif Chemokine Receptor 5; CXCR6, C-X-C Motif Chemokine Receptor 6; CCR6, C-C Motif Chemokine Receptor 6; CXCR4, C-X-C Motif Chemokine Receptor 4; CXCR1, C-X-C Motif Chemokine Receptor 1; CXCR2, C-X-C Motif Chemokine Receptor 2; CCR10, C-C Motif Chemokine Receptor 10; CXCR5, C-X-C Motif Chemokine Receptor 5; CCR9, C-C Motif Chemokine Receptor 9; CCR3, C-C Motif Chemokine Receptor 3; CX3CR1, C-X3-C Motif Chemokine Receptor 1; HLA-E, Major Histocompatibility Complex, Class I, E; TAP1, Transporter 1, ATP Binding Cassette Subfamily B Member; HLA-B, Major Histocompatibility Complex, Class I, B; B2M, Beta-2-Microglobulin; HLA-F, Major Histocompatibility Complex, Class I, F; HLA-DMB, Major Histocompatibility Complex, Class II, DM Beta; HLA-DOB, Major Histocompatibility Complex, Class II, DO Beta; HLA-DMA, Major Histocompatibility Complex, Class II, DM Alpha; HLA-DRB1, Major Histocompatibility Complex, Class II, DR Beta 1; HLA-DQA1, Major Histocompatibility Complex, Class II, DQ Alpha 1; HLA-DOA, Major Histocompatibility Complex, Class II, DO Alpha; HLA-DPA1, Major Histocompatibility Complex, Class II, DP Alpha 1; HLA-DPB1, Major Histocompatibility Complex, Class II, DP Beta 1; HLA-DRA, Major Histocompatibility Complex, Class II, DR Alpha; HLA-G, Major Histocompatibility Complex, Class I, G; HLA-DQA2, Major Histocompatibility Complex, Class II, DQ Alpha 2; HLA-DQB1, Major Histocompatibility Complex, Class II, DQ Beta 1; TAP2, Transporter 2, ATP Binding Cassette Subfamily B Member; TAPBP, TAP Binding Protein; HLA-A, Major Histocompatibility Complex, Class I, A; HLA-C, Major Histocompatibility Complex, Class I, C; TIGIT, T-Cell Immunoreceptor With Ig And ITIM Domains; CD96, CD96 Molecule; PDCD1, Programmed Cell Death 1; CTLA4, Cytotoxic T-Lymphocyte Associated Protein 4; BTLA, B And T Lymphocyte Associated; CD244, CD244 Molecule; PDCD1LG2, Programmed Cell Death 1 Ligand 2; HAVCR2, Hepatitis A Virus Cellular Receptor 2; LAG3, Lymphocyte Activating 3; ADORA2A, Adenosine A2a Receptor; CSF1R, Colony Stimulating Factor 1 Receptor; IL10, Interleukin 10; CD274, CD274 Molecule; IDO1, Indoleamine 2,3-Dioxygenase 1; LGALS9, Galectin 9; CD160, CD160 Molecule; KIR2DL1, Killer Cell Immunoglobulin Like Receptor, Two Ig Domains And Long Cytoplasmic Tail 1; KIR2DL3, Killer Cell Immunoglobulin Like Receptor, Two Ig Domains And Long Cytoplasmic Tail 3; NECTIN2, Nectin Cell Adhesion Molecule 2; VTCN1, V-Set Domain Containing T-Cell Activation Inhibitor 1; IL10RB, Interleukin 10 Receptor Subunit Beta; KDR, Kinase Insert Domain Receptor; TGFBR1, Transforming Growth Factor Beta 1 Transforming Growth Factor Beta Receptor 1; PVR, PVR Cell Adhesion Molecule; ULBP1, UL16 Binding Protein 1; CD276, CD276 Molecule; RAET1E, Retinoic Acid Early Transcript 1E; TNFRSF14, TNF Receptor Superfamily Member 14; TNFSF13, TNF Superfamily Member 13; TNFRSF25, TNF Receptor Superfamily Member 25; BTNL2, Butyrophilin Like 2; HHLA2, HERV-H LTR-Associating 2; IL6R, Interleukin 6 Receptor; NT5E, 5’- Nucleotidase Ecto; TNFSF9, TNF Superfamily Member 9; ICOSLG, Inducible T-Cell Costimulator Ligand; TNFSF15, TNF Superfamily Member 15; KLRK1, Killer Cell Lectin Like Receptor K1; LTA, Lymphotoxin Alpha; CD27, CD27 Molecule; CD48, CD48 Molecule; ICOS, Inducible T-Cell Costimulator; STING1, Stimulator Of Interferon Response CGAMP Interactor 1; CXCL12, C-X-C Motif Chemokine Ligand 12; MICB, MHC Class I Polypeptide-Related Sequence B; TNFSF4, TNF Superfamily Member 4; TNFRSF13C, TNF Receptor Superfamily Member 13C; IL6, Interleukin 6; TNFSF18, TNF Superfamily Member 18; ENTPD1, Ectonucleoside Triphosphate Diphosphohydrolase 1; CD40, CD40 Molecule; TNFRSF4, TNF Receptor Superfamily Member 4; CXCR4, C-X-C Motif Chemokine Receptor 4; TMIGD2, Transmembrane And Immunoglobulin Domain Containing 2; TNFRSF18, TNF Receptor Superfamily Member 18; CD70, CD70 Molecule; VSIR, V-Set Immunoregulatory Receptor; TNFRSF8, TNF Receptor Superfamily Member 8; CD28, CD28 Molecule; KLRC1, Killer Cell Lectin Like Receptor C1; CD40LG, CD40 Ligand; TNFRSF13B, TNF Receptor Superfamily Member 13B; TNFRSF17, TNF Receptor Superfamily Member 17; TNFSF14, TNF Superfamily Member 14; TNFSF13B, TNF Superfamily Member 13b; TNFRSF9, TNF Receptor Superfamily Member 9; CD80, CD80 Molecule; CD86, CD86 Molecule; IL2RA, Interleukin 2 Receptor Subunit Alpha.CCL5, C-C Motif Chemokine Ligand 5; CXCL9, C-X-C Motif Chemokine Ligand 9; CCL4, C-C Motif Chemokine Ligand 4;XCL2, X-C Motif Chemokine Ligand 2; CXCL13, C-X-C Motif Chemokine Ligand 13; CXCL10, C-X-C Motif Chemokine Ligand 10; CXCL11, C-X-C Motif Chemokine Ligand 11; XCL1, X-C Motif Chemokine Ligand 1; CCL19, C-C Motif Chemokine Ligand 19; CCL22, C-C Motif Chemokine Ligand 22; CCL18, C-C Motif Chemokine Ligand 18; CCL21, C-C Motif Chemokine Ligand 21; CCL23, C-C Motif Chemokine Ligand 23; CCL3, C-C Motif Chemokine Ligand 3; CCL8, CC Motif Chemokine Ligand 8; CCL13, C-C Motif Chemokine Ligand 13; CCL20, C-C Motif Chemokine Ligand 20; CCL24, C-C Motif Chemokine Ligand 24; CXCL16, C-X-C Motif Chemokine Ligand 16; CCL2, C-C Motif Chemokine Ligand 2; CXCL12, C-X-C Motif Chemokine Ligand 12; CCL17, C-C Motif Chemokine Ligand 17; CCL1, C-C Motif Chemokine Ligand 1; CCL7, C-C Motif Chemokine Ligand 7; CCL11, C-C Motif Chemokine Ligand 11; CCL27, C-C Motif Chemokine Ligand 27; CXCL17, C-X-C Motif Chemokine Ligand 17; CCL25, C-C Motif Chemokine Ligand 25; CX3CL1, C-X3-C Motif Chemokine Ligand 1; CCL14, C-C Motif Chemokine Ligand 14; CCL16, C-C Motif Chemokine Ligand 16; CXCL5, C-X-C Motif Chemokine Ligand 5; CXCL2, C-X-C Motif Chemokine Ligand 2; CXCL3, C-X-C Motif Chemokine Ligand 3; CCL26, C-C Motif Chemokine Ligand 26; CXCL8, C-X-C Motif Chemokine Ligand 8; CXCL1, C-X-C Motif Chemokine Ligand 1; CXCL6, C-X-C Motif Chemokine Ligand 6; CCL15, C-C Motif Chemokine Ligand 15; CCL28, C-C Motif Chemokine Ligand 28; CXCL14, C-X-C Motif Chemokine Ligand 14; XCR1, X-C Motif Chemokine Receptor 1; CCR1, C-C Motif Chemokine Receptor 1; CCR2, C-C Motif Chemokine Receptor 2; CCR8, C-C Motif Chemokine Receptor 8; CCR4, C-C Motif Chemokine Receptor 4; CCR7, C-C Motif Chemokine Receptor 7; CXCR3, C-X-C Motif Chemokine Receptor 3; CCR5, C-C Motif Chemokine Receptor 5; CXCR6, C-X-C Motif Chemokine Receptor 6; CCR6, C-C Motif Chemokine Receptor 6; CXCR4, C-X-C Motif Chemokine Receptor 4; CXCR1, C-X-C Motif Chemokine Receptor 1; CXCR2, C-X-C Motif Chemokine Receptor 2; CCR10, C-C Motif Chemokine Receptor 10; CXCR5, C-X-C Motif Chemokine Receptor 5; CCR9, C-C Motif Chemokine Receptor 9; CCR3, C-C Motif Chemokine Receptor 3; CX3CR1, C-X3-C Motif Chemokine Receptor 1; HLA-E, Major Histocompatibility Complex, Class I, E; TAP1, Transporter 1, ATP Binding Cassette Subfamily B Member; HLA-B, Major Histocompatibility Complex, Class I, B; B2M, Beta-2-Microglobulin; HLA-F, Major Histocompatibility Complex, Class I, F; HLA-DMB, Major Histocompatibility Complex, Class II, DM Beta; HLA-DOB, Major Histocompatibility Complex, Class II, DO Beta; HLA-DMA, Major Histocompatibility Complex, Class II, DM Alpha; HLA-DRB1, Major Histocompatibility Complex, Class II, DR Beta 1; HLA-DQA1, Major Histocompatibility Complex, Class II, DQ Alpha 1; HLA-DOA, Major Histocompatibility Complex, Class II, DO Alpha; HLA-DPA1, Major Histocompatibility Complex, Class II, DP Alpha 1; HLA-DPB1, Major Histocompatibility Complex, Class II, DP Beta 1; HLA-DRA, Major Histocompatibility Complex, Class II, DR Alpha; HLA-G, Major Histocompatibility Complex, Class I, G; HLA-DQA2, Major Histocompatibility Complex, Class II, DQ Alpha 2; HLA-DQB1, Major Histocompatibility Complex, Class II, DQ Beta 1; TAP2, Transporter 2, ATP Binding Cassette Subfamily B Member; TAPBP, TAP Binding Protein; HLA-A, Major Histocompatibility Complex, Class I, A; HLA-C, Major Histocompatibility Complex, Class I, C; TIGIT, T-Cell Immunoreceptor With Ig And ITIM Domains; CD96, CD96 Molecule; PDCD1, Programmed Cell Death 1; CTLA4, Cytotoxic T-Lymphocyte Associated Protein 4; BTLA, B And T Lymphocyte Associated; CD244, CD244 Molecule; PDCD1LG2, Programmed Cell Death 1 Ligand 2; HAVCR2, Hepatitis A Virus Cellular Receptor 2; LAG3, Lymphocyte Activating 3; ADORA2A, Adenosine A2a Receptor; CSF1R, Colony Stimulating Factor 1 Receptor; IL10, Interleukin 10; CD274, CD274 Molecule; IDO1, Indoleamine 2,3-Dioxygenase 1; LGALS9, Galectin 9; CD160, CD160 Molecule; KIR2DL1, Killer Cell Immunoglobulin Like Receptor, Two Ig Domains And Long Cytoplasmic Tail 1; KIR2DL3, Killer Cell Immunoglobulin Like Receptor, Two Ig Domains And Long Cytoplasmic Tail 3; NECTIN2, Nectin Cell Adhesion Molecule 2; VTCN1, V-Set Domain Containing T-Cell Activation Inhibitor 1; IL10RB, Interleukin 10 Receptor Subunit Beta; KDR, Kinase Insert Domain Receptor; TGFBR1, Transforming Growth Factor Beta 1 Transforming Growth Factor Beta Receptor 1; PVR, PVR Cell Adhesion Molecule; ULBP1, UL16 Binding Protein 1; CD276, CD276 Molecule; RAET1E, Retinoic Acid Early Transcript 1E; TNFRSF14, TNF Receptor Superfamily Member 14; TNFSF13, TNF Superfamily Member 13; TNFRSF25, TNF Receptor Superfamily Member 25; BTNL2, Butyrophilin Like 2; HHLA2, HERV-H LTR-Associating 2; IL6R, Interleukin 6 Receptor; NT5E, 5’- Nucleotidase Ecto; TNFSF9, TNF Superfamily Member 9; ICOSLG, Inducible T-Cell Costimulator Ligand; TNFSF15, TNF Superfamily Member 15; KLRK1, Killer Cell Lectin Like Receptor K1; LTA, Lymphotoxin Alpha; CD27, CD27 Molecule; CD48, CD48 Molecule; ICOS, Inducible T-Cell Costimulator; STING1, Stimulator Of Interferon Response CGAMP Interactor 1; CXCL12, C-X-C Motif Chemokine Ligand 12; MICB, MHC Class I Polypeptide-Related Sequence B; TNFSF4, TNF Superfamily Member 4; TNFRSF13C, TNF Receptor Superfamily Member 13C; IL6, Interleukin 6; TNFSF18, TNF Superfamily Member 18; ENTPD1, Ectonucleoside Triphosphate Diphosphohydrolase 1; CD40, CD40 Molecule; TNFRSF4, TNF Receptor Superfamily Member 4; CXCR4, C-X-C Motif Chemokine Receptor 4; TMIGD2, Transmembrane And Immunoglobulin Domain Containing 2; TNFRSF18, TNF Receptor Superfamily Member 18; CD70, CD70 Molecule; VSIR, V-Set Immunoregulatory Receptor; TNFRSF8, TNF Receptor Superfamily Member 8; CD28, CD28 Molecule; KLRC1, Killer Cell Lectin Like Receptor C1; CD40LG, CD40 Ligand; TNFRSF13B, TNF Receptor Superfamily Member 13B; TNFRSF17, TNF Receptor Superfamily Member 17; TNFSF14, TNF Superfamily Member 14; TNFSF13B, TNF Superfamily Member 13b; TNFRSF9, TNF Receptor Superfamily Member 9; CD80, CD80 Molecule; CD86, CD86 Molecule; IL2RA, Interleukin 2 Receptor Subunit Alpha.
The correlation coefficients are presented in detail in Supplementary Table 9.
3.2.6 Associations of TIGIT expression with tumor mutational burden (TMB) and microsatellite instability (MSI)
Because of the essential roles of TMB and MSI in the prediction of the response to immune therapy, Spearman correlation analysis was conducted to assess the relationship between TIGIT expression, TMB and MSI. The results showed that TIGIT expression was positively related to TMB in BLCA, COADREAD, COAD, and SKCM but negatively related to TMB in THCA. Moreover, TIGIT expression was positively correlated with MSI in COAD, COADREAD, and LUAD, while it was negatively correlated with MSI in ESCA and STES (see Figure 12). The correlation coefficients and P values are presented in Supplementary Tables 10, 11.
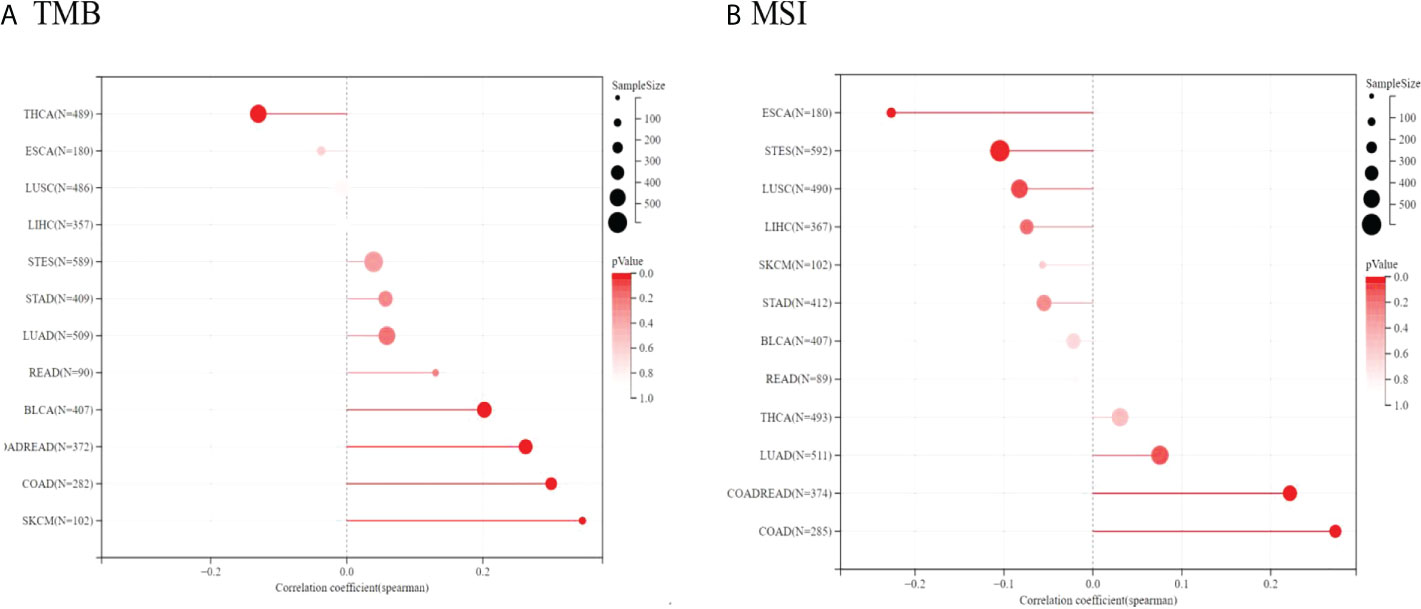
Figure 12 Spearman correlation between TMB, MSI and TIGIT gene expression were presented in (A, B) respectively. The correlation coefficient is presented by using the length of the lollipop. The redder the color, the more statistically significant it is.
The results strongly indicated that TIGIT was well associated with tumor immunity. Therefore, TIGIT might be considered a promising biomarker for predicting the immunotherapy response.
3.2.7 Construction of the protein protein interaction (PPI) network, gene ontology (GO) and Kyoto encyclopedia of gene and genomes (KEGG) enrichment analysis
As presented in Figure 13A, we utilized the GeneMANIA online program to create a PPI network for 21 genes that interacted with TIGIT. TIGIT was found to interact with PDCD1, which indicated that patients with resistance to PD-1 inhibitors might benefit from the combination of TIGIT inhibitors. The biological processes (BP) enriched in this gene set were primarily those related to cell adhesion, heterophilic cell−cell adhesion via plasma membrane cell adhesion molecules and homophilic cell adhesion via plasma membrane adhesion molecules, while the cellular components (CC) enriched were plasma membrane AND integral component of membrane. The enriched molecular functions (MF) were linked to identical protein binding and receptor binding. The KEGG results showed that they were mainly enriched in the cell adhesion molecules, adherens junction and T-cell receptor signaling pathways (Figures 13B, C).
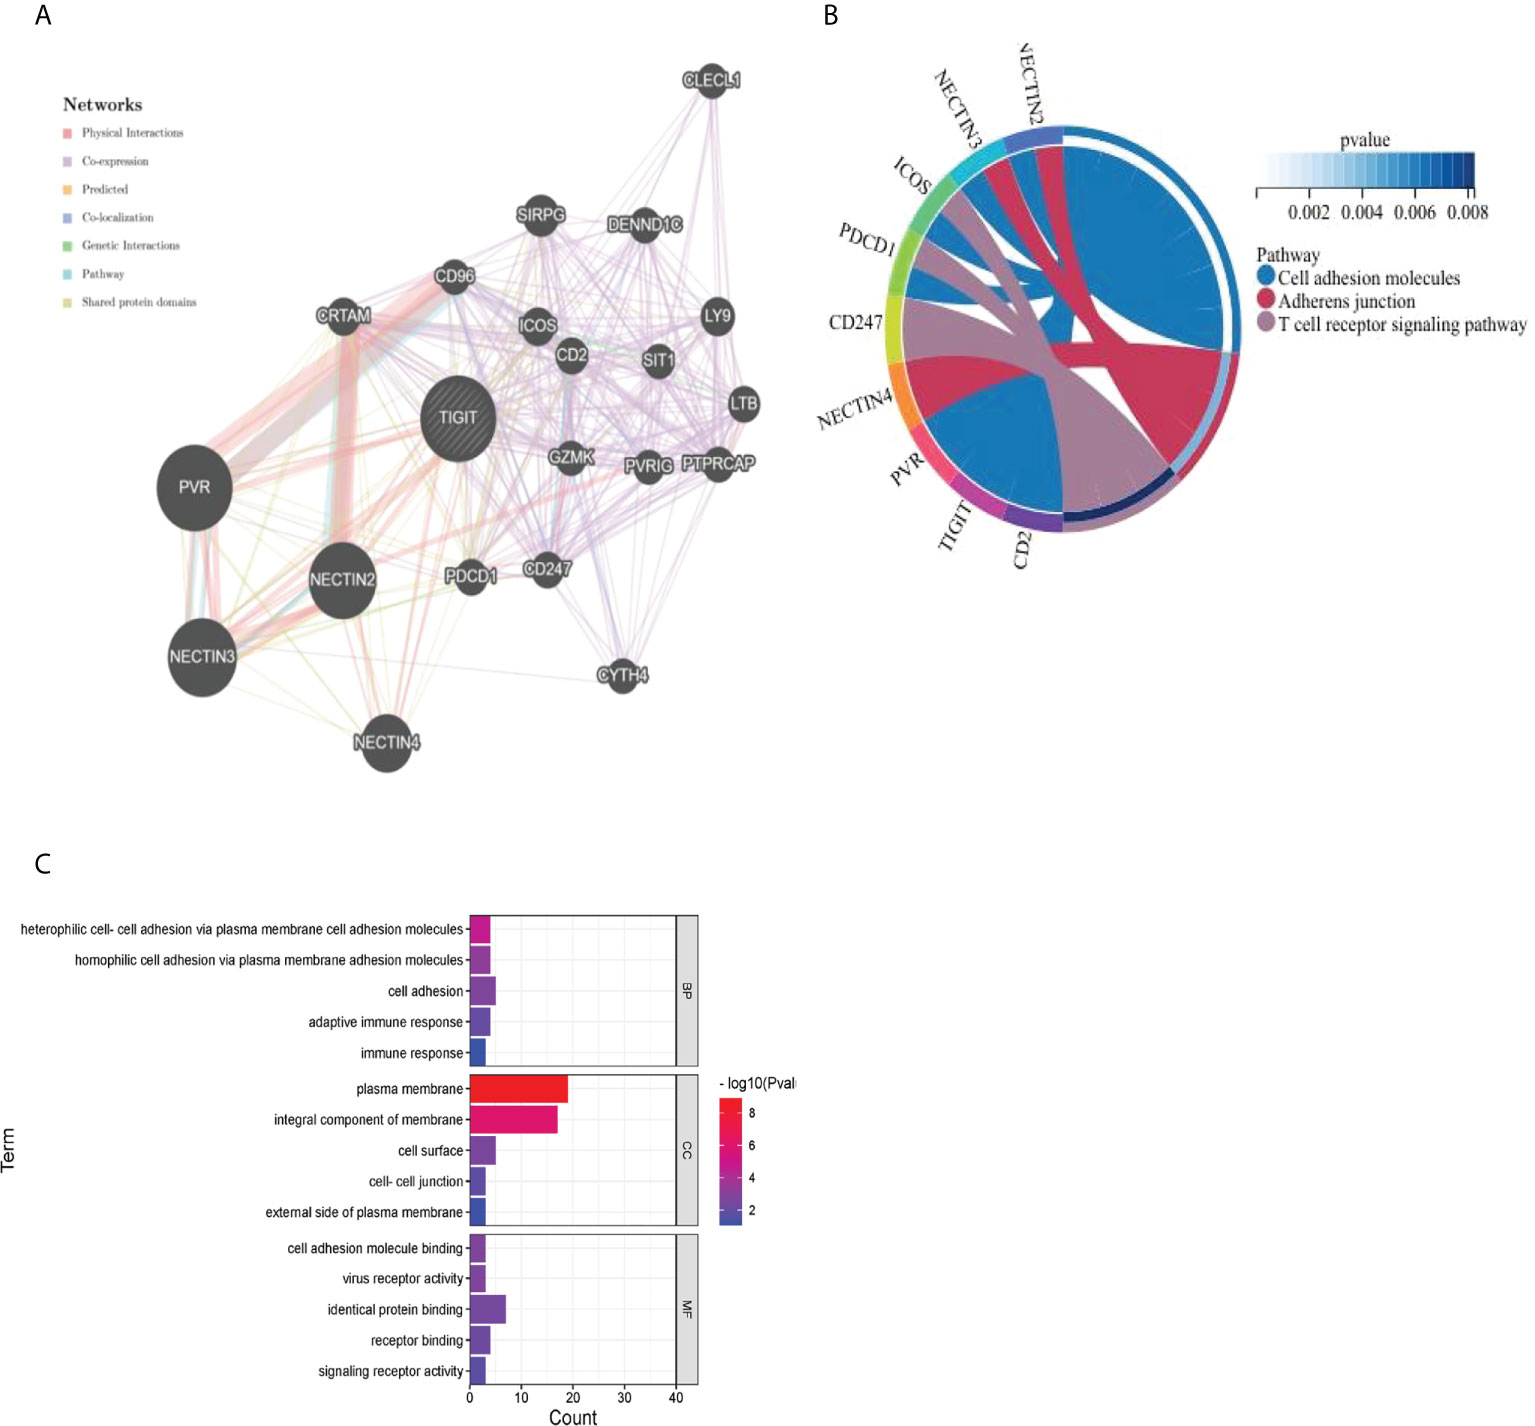
Figure 13 Visualization and enrichment analysis for genes that interacted with TIGIT (A) PPI network (B) Chord diagram for KEGG analysis (C) Bar graph for GO analysis).
3.2.8 Construction of the ceRNA regulatory network
As shown in Figure 14, a ceRNA coexpression network consisting of 70 lncRNAs, 34 miRNAs, and 1 mRNA was visualized by Cytoscape after merging these predicted results. By using the CytoHubba plug-in in Cytoscape, we screened out the top 10 node degrees to represent the central genes of the PPI network, including TIGIT, hsa-miR-4516, hsa-miR-1255a, hsa-miR-1255b-5p, hsa-miR-1306-5p, hsa-miR-514a-3p, hsa-miR-6849-3p, hsa-miR-514b-3p, SNHG16, and hsa-miR-4534.
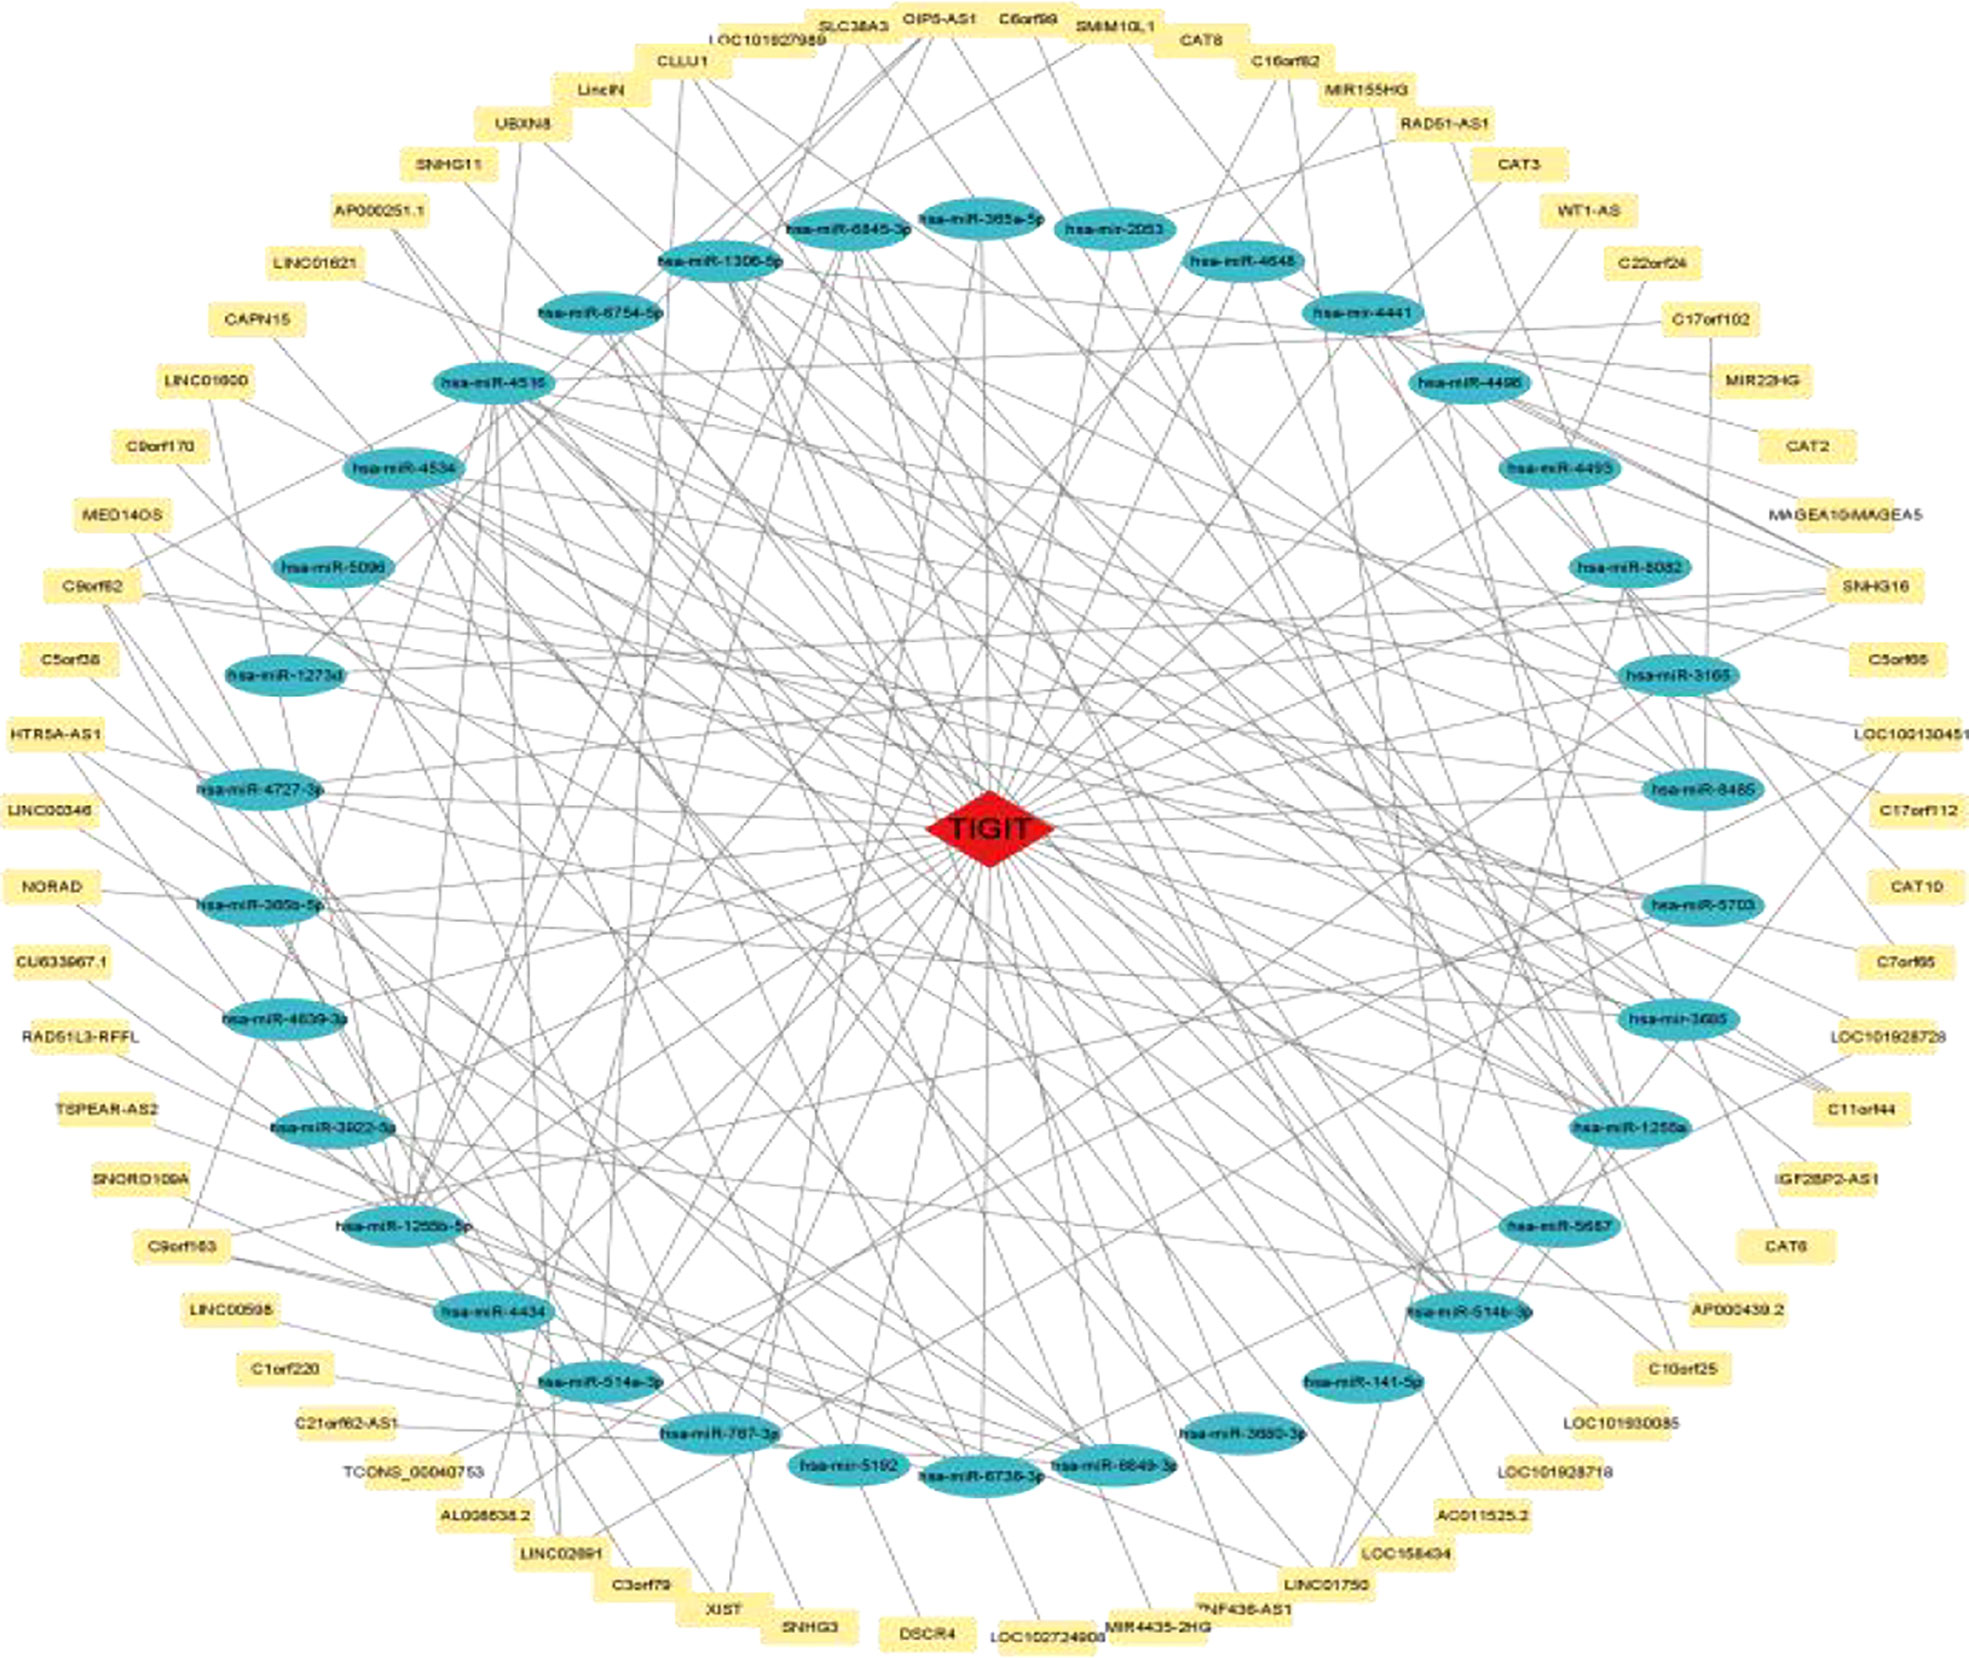
Figure 14 TIGIT-miRNA−lncRNA network.
4 Discussion
The results of the meta-analysis showed that high expression of TIGIT was associated with poorer OS, PFS, RFS and DFS in East Asian patients with solid cancers. In contrast to the study reported by Kunmin Xiao et al (42), we also discussed the relationship between TIGIT and DFS and RFS. DFS and RFS are important clinical outcomes for cancers with relatively good clinical prognosis. Most importantly, we discussed the heterogeneity caused by postoperative treatments, which might have a very important impact on the prognosis of cancer patients. It was found in our study that the cancer type, sample sizes, and different cutoff values might be the source of heterogeneity. The high expression of TIGIT was not significantly correlated with poor PFS of PSCCE, RFS of MTC, DFS of PTC or OS of SCLC, CRC, MTC, ATC, PDTC and PTC. Studies with sample sizes <100 did not support the relationship between high expression of TIGIT and OS or DFS, while studies taking CPS≥1 as the cutoff value did not support the relationship between high expression of TIGIT and OS or RFS. Whether postoperative treatments result in heterogeneity still needs further study.
SCLC is a classical neuroendocrine tumor with low immunogenicity and low MHC I expression levels, which makes it difficult to recognize by CD8 T-cell receptors. Its immune regulation is more complex than that of other solid tumors due to the existence of autocrine or paracrine molecules. In ATC, TIGIT expression is not found to have prognostic value (38). The reason may be that ATC patients suffer from extremely short survival, and the sample size may be too small to distinguish the prognosis.
In our meta-analysis, a relationship between high expression of TIGIT and poorer OS was not found in the studies taking CPS≥1 as the cutoff value. The tumor proportion score (TPS) and the combined positive score (CPS) have been widely used in clinical research. TPS calculates the ratio of TIGIT-stained tumor cells to the total number of viable tumor cells, while CPS calculates the ratio of potential TIGIT expression, including tumor cells and immune cells, to the total number of viable tumor cells. However, it remains unclear which is more suitable for assessing TIGIT expression as a prognostic biomarker (43).
Vascular endothelial cells, nonmalignant cells, immunocytes, tumor-associated macrophages (TAMs), cancer-associated fibroblasts (CAFs), myeloid-derived suppressor cells (MDSCs), natural killer (NK) cells, dendritic cells (DCs) and tumor-associated neutrophils (TANs) make up the tumor microenvironment (TME) (44, 45). TIGIT was highly positively correlated with the ESTIMATE score in all of the cancers included, which indicated an advanced cancer stage with a poor prognosis.
Tumor-infiltrating immunocytes can promote or antagonize tumorigenesis and progression (46). TIGIT expressed on TILs responded to the TME. TIGIT marks the most dysfunctional subset of CD8+ T cells and Tregs with a highly suppressive function (47). In this study, high TIGIT expression promoted the infiltration levels of CD8 T cells, M1 macrophages, naive B cells, activated memory CD4 T cells, Tregs and activated NK cells while inhibiting the infiltration levels of activated dendritic cells and mast cells in most of the cancers included. Among them, M1 macrophages, activated memory CD4 T cells, activated dendritic cells, mast cells and activated NK cells play antitumor roles in the TME and are related to better outcomes, while Tregs play immune suppression roles and are related to worse survival prognosis (48). A positive correlation was discovered between the expression of TIGIT and most of the other immune checkpoints, especially in ESCA, STAD, STES and SKCM (12, 47, 49, 50). This result suggested that TIGIT might be involved in different immune responses and immunocyte infiltration. The combined blockade of TIGIT and other new immune checkpoints may be a possible option for immunotherapy, especially in patients with gastroesophageal tumors and melanoma.
MSI and TMB are two valuable indexes suggesting the sensitivity of immune checkpoint inhibitors. TMB can induce new antigens to facilitate immune recognition. MSI caused by hypermutability (gain or loss) of nucleotides from DNA elements is associated with increased expression of neoantigens, higher PD-L1 expression and TMB-H (51). In this study, TIGIT expression was positively related to TMB and MSI in COAD and COADREAD, which indicated that patients with COAD or COADREAD might benefit from TIGIT inhibitors.
Regarding the possible regulatory mechanisms, the results of the GO and KEGG enrichment analyses indicated that TIGIT was closely related to the functions of cell adhesion, adherens junction and the T-cell receptor signaling pathway, which supported the oncogenic role and immunological function of TIGIT in the tumor immune microenvironment.
Currently, it is urgent to find new immune checkpoints to compensate for drug resistance and severe adverse reactions caused by PD-1/PD-L1 and CTLA4 inhibitors. Studies on TIGIT expression provided more encouraging results than those on LAG-3 and TIM-3 (52). TIGIT inhibitors, such as tibolumab, vibostolimab, ocperlimab, M-6223, ASP-8374, COM-902 and IBI-939, have been under clinical trials in patients with non-small cell lung cancer (NSCLC), esophageal squamous cell carcinoma (ESCC) and gastric adenocarcinoma (GAC). TIGIT expression paralleled that of PD-1 (2). Most TIGIT inhibitors are used in combination with PD-L1/PD-1 inhibitors, such as zimberelimab and atezolizumab (53, 54). We will continue to follow up the results of relevant clinical reports.
There were some limitations in our meta-analysis. Over half of the studies did not report postoperative therapy, which led to some bias in our analysis. Second, all of the subjects were Asian, and whether the conclusion could be applied to other populations remained uncertain. Third, the scale of the included studies was limited. Some parts of the subgroup analysis only included one kind of cancer. Large sample size studies are still needed to determine the relationship between TIGIT expression and survival prognosis, especially PFS, RFS and DFS.
5 Conclusion
TIGIT is valuable in predicting the survival prognosis of patients with solid cancers. TIGIT is correlated with the TME, infiltration of immune cells, immune-related genes, MSI and TMB. The results indicate the role of TIGIT in tumoriFabbrevgenesis and progression. TIGIT inhibitors may be promising choices for solid cancers in the future.
Data availability statement
The original contributions presented in the study are included in the article/Supplementary Material. Further inquiries can be directed to the corresponding author.
Author contributions
SL and LL contributed equally to article review, manuscript writing and revisions for intellectual content. TP and XL were responsible for data extraction and English translation. YT was responsible for data extraction, English translation and quality assessment. YJ was the corresponding author and was responsible for quality assessment and revisions for intellectual content. All authors contributed to the article and approved the submitted version.
Acknowledgments
The authors would like to thank all the scholars who made constant efforts for cancer research.
Conflict of interest
The authors declare that the research was conducted in the absence of any commercial or financial relationships that could be construed as a potential conflict of interest.
Publisher’s note
All claims expressed in this article are solely those of the authors and do not necessarily represent those of their affiliated organizations, or those of the publisher, the editors and the reviewers. Any product that may be evaluated in this article, or claim that may be made by its manufacturer, is not guaranteed or endorsed by the publisher.
Supplementary material
The Supplementary Material for this article can be found online at: https://www.frontiersin.org/articles/10.3389/fimmu.2022.977016/full#supplementary-material
References
1. Noguchi Y, Maeda A, Lo PC, Takakura C, Haneda T, Kodama T, et al. Human TIGIT on porcine aortic endothelial cells suppresses xenogeneic macrophage-mediated cytotoxicity. Immunobiology (2019) 224(5):605–13. doi: 10.1016/j.imbio.2019.07.008
2. Alenzi FQ, Lotfy M, Wyse R. Swords of cell death: Caspase activation and regulation. Asian Pac J Cancer Prev (2010) 11(2):271–80.
3. Alenzi FQ. The significance and occurrence of TNF receptor polymorphisms in the Saudi population. Saudi J Biol Sci (2016) 23(6):767–72. doi: 10.1016/j.sjbs.2016.04.015
4. Blackburn SD, Shin H, Haining WN, Zou T, Workman CJ, Polley A, et al. Coregulation of CD8+ T-cell exhaustion by multiple inhibitory receptors during chronic viral infection. Nat Immunol (2009) 10(1):29–37. doi: 10.1038/ni.1679
5. Zarour HM. Reversing T-cell dysfunction and exhaustion in cancer. Clin Cancer Res (2016) 22(8):1856–64. doi: 10.1158/1078-0432.CCR-15-1849
6. Alenzi FQ, Alenazi FA, Al-Kaabi Y, Salem ML. The use of growth factors to modulate the activities of antigen-specific CD8+ T cells in vitro. J Med Life (2011) 4(4):399–406.
7. Stengel KF, Harden-Bowles K, Yu X, Rouge L, Yin J, Comps-Agrar L, et al. Structure of TIGIT immunoreceptor bound to poliovirus receptor reveals a cell−cell adhesion and signaling mechanism that requires cis-trans receptor clustering. Proc Natl Acad Sci USA (2012) 109(14):5399–404. doi: 10.1073/pnas.1120606109
8. Yu X, Harden K, Gonzalez LC, Francesco M, Chiang E, Irving B, et al. The surface protein TIGIT suppresses T-cell activation by promoting the generation of mature immunoregulatory dendritic cells. Nat Immunol (2009) 10(1):48–57. doi: 10.1038/ni.1674
9. Uhlén M, Fagerberg L, Hallström BM, Lindskog C, Oksvold P, Mardinoglu A, et al. Proteomics. tissue-based map of the human proteome. Science (2015) 347(6220):1260419. doi: 10.1126/science.1260419
10. Wang F, Hou H, Wu S, Tang Q, Liu W, Huang M, et al. TIGIT expression levels on human NK cells correlate with functional heterogeneity among healthy individuals. Eur J Immunol (2015) 45(10):2886–97. doi: 10.1002/eji.201545480
11. Hasan MM, Nair SS, O’Leary JG, Thompson-Snipes L, Nyarige V, Wang J, et al. Implication of TIGIT+ human memory b cells in immune regulation. Nat Commun (2021) 12(1):1534. doi: 10.1038/s41467-021-21413-y
12. Joller N, Lozano E, Burkett PR, Patel B, Xiao S, Zhu C, et al. Treg cells expressing the coinhibitory molecule TIGIT selectively inhibit proinflammatory Th1 and Th17-cell responses. Immunity (2014) 40(4):569–81. doi: 10.1016/j.immuni.2014.02.012
13. Rabea MA, Nafea MA, Tamimi W, Alenzi FQ. Role of T lymphocytes in chronic leukemia. Bangladesh J Med Sci (2017) 16(2):207–11. doi: 10.3329/bjms.v16i2.31939
14. Page MJ, McKenzie JE, Bossuyt PM, Boutron I, Hoffmann TC, Mulrow CD, et al. The PRISMA 2020 statement: An updated guideline for reporting systematic reviews. Syst Rev (2021) 10(1):89. doi: 10.1186/s13643-021-01626-4
15. Stang A. Critical evaluation of the Newcastle−Ottawa scale for the assessment of the quality of nonrandomized studies in meta-analyses. Eur J Epidemiol (2010) 25(9):603–5. doi: 10.1007/s10654-010-9491-z
16. Beroukhim R, Mermel CH, Porter D, Wei G, Raychaudhuri S, Donovan J, et al. The landscape of somatic copy-number alteration across human cancers. Nature (2010) 463(7283):899–905. doi: 10.1038/nature08822
17. Mermel CH, Schumacher SE, Hill B, Meyerson ML, Beroukhim R, Getz G, et al. GISTIC2.0 facilitates sensitive and confident localization of the targets of focal somatic copy-number alteration in human cancers. Genome Biol (2011) 12(4):R41. doi: 10.1186/gb-2011-12-4-r41
18. Yoshihara K, Shahmoradgoli M, Martínez E, Vegesna R, Kim H, Torres-Garcia W, et al. Inferring tumor purity and stromal and immune cell admixture from expression data. Nat Commun (2013) 4:2612. doi: 10.1038/ncomms3612
19. Newman AM, Liu CL, Green MR, Gentles AJ, Feng W, Xu Y, et al. Robust enumeration of cell subsets from tissue expression profiles. Nat Methods (2015) 12(5):453–7. doi: 10.1038/nmeth.3337
20. Li T, Fan J, Wang B, Traugh N, Chen Q, Liu JS, et al. TIMER: A web server for comprehensive analysis of tumor-infiltrating immune cells. Cancer Res (2017) 77(21):e108–10. doi: 10.1158/0008-5472.CAN-17-0307
21. Zeng D, Ye Z, Shen R, Yu G, Wu J, Xiong Y, et al. IOBR: Multi-omics immuno-oncology biological research to decode tumor microenvironment and signatures. Front Immunol (2021) 12 doi: 10.3389/fimmu
22. Bonneville R, Krook MA, Kautto EA, Miya J, Wing MR, Chen HZ, et al. Landscape of microsatellite instability across 39 cancer types. JCO Precis Oncol (2017) 2017:23–31. doi: 10.1200/PO.17.00073
23. Shen W, Song Z, Zhong X, Huang M, Shen D, Gao P, et al. Sangerbox: A comprehensive, interaction-friendly clinical bioinformatics analysis platform. iMeta (2022) 1:e36. doi: 10.1002/imt2.36
24. Ragueneau E, Shrivastava A, Morris JH, Del-Toro N, Hermjakob H, Porras P., et al. IntAct app: a cytoscape application for molecular interaction network visualization and analysis. Bioinformatics (2021) 37(20):3684–5. doi: 10.1093/bioinformatics/btab319
25. Ghatalia P, Gordetsky J, Kuo F, Dulaimi E, Cai KQ, Devarajan K, et al. Prognostic impact of immune gene expression signature and tumor infiltrating immune cells in localized clear cell renal cell carcinoma. J Immunother Cancer (2019) 7(1):273. doi: 10.1186/s40425-019-0621-1
26. Ahluwalia P, Ahluwalia M, Mondal AK, Sahajpal N, Kota V, Rojiani MV, et al. Immunogenomic gene signature of cell-death associated genes with prognostic implications in lung cancer. Cancers (Basel) (2021) 13(1):155. doi: 10.3390/cancers13010155
27. Zhao JJ, Zhou ZQ, Wang P, Chen CL, Liu Y, Pan QZ, et al. Orchestration of immune checkpoints in tumor immune contexture and their prognostic significance in esophageal squamous cell carcinoma. Cancer Manag Res (2018) 10:6457–68. doi: 10.2147/CMAR.S181949
28. Wang P, Chen Y, Long Q, Li Q, Tian J, Liu T, et al. Increased coexpression of PD-L1 and TIM3/TIGIT is associated with poor overall survival of patients with esophageal squamous cell carcinoma. J Immunother Cancer (2021) 9(10):e002836. doi: 10.1136/jitc-2021-002836
29. Zhao K, Ma L, Feng L, Huang Z, Meng X, Yu J, et al. CD155 overexpression correlates with poor prognosis in primary small cell carcinoma of the esophagus. Front Mol Biosci (2021) 7:608404. doi: 10.3389/fmolb.2020.608404
30. Tang W, Pan X, Han D, Rong D, Zhang M, Yang L, et al. Clinical significance of CD8+ T-cell immunoreceptor with ig and ITIM domains+ in locally advanced gastric cancer treated with SOX regimen after D2 gastrectomy. Oncoimmunology (2019) 8(6):e1593807. doi: 10.1080/2162402X.2019.1593807
31. Liu H, Wu J, Xu X, Wang H, Zhang C, Yin S, et al. Peritumoral TIGIT+CD20+ b-cell infiltration indicates poor prognosis but favorable adjuvant chemotherapeutic response in gastric cancer. Int Immunopharmacol (2022) 108:108735. doi: 10.1016/j.intimp.2022.108735
32. Xu Y, Cui G, Jiang Z, Li N, Zhang X. Survival analysis with regard to PD-L1 and CD155 expression in human small cell lung cancer and a comparison with associated receptors. Oncol Lett (2019) 17(3):2960–8. doi: 10.3892/ol.2019.9910
33. Sun Y, Luo J, Chen Y, Cui J, Lei Y, Cui Y, et al. Combined evaluation of the expression status of CD155 and TIGIT plays an important role in the prognosis of LUAD (lung adenocarcinoma). Int Immunopharmacol (2020) 80:106198. doi: 10.1016/j.intimp.2020.106198
34. Jiang C, Qu X, Ma L, Cheng X, Gao X. CD155 expression impairs anti-PD1 therapy response in non-small cell lung cancer. Clin Exp Immunol (2022) 208(2):220–32. doi: 10.1093/cei/uxac020
35. Zhou X, Ding X, Li H, Yang C, Ma Z, Xu G, et al. Upregulation of TIGIT and PD-1 in colorectal cancer with mismatch-repair deficiency. Immunol Invest (2021) 50(4):338–55. doi: 10.1080/08820139.2020.1758130
36. Liang R, Zhu X, Lan T, Ding D, Zheng Z, Chen T, et al. TIGIT promotes CD8+T cells exhaustion and predicts poor prognosis of colorectal cancer. Cancer Immunol Immunother (2021) 70(10):2781–93. doi: 10.1007/s00262-021-02886-8
37. Murakami D, Matsuda K, Iwamoto H, Mitani Y, Mizumoto Y, Nakamura Y, et al. Prognostic value of CD155/TIGIT expression in patients with colorectal cancer. PLoS One (2022) 17(3):e0265908. doi: 10.1371/journal.pone.0265908
38. Lee WJ, Lee YJ, Choi ME, Yun KA, Won CH, Lee MW, et al. Expression of lymphocyte-activating gene 3 and T-cell immunoreceptor with immunoglobulin and ITIM domains in cutaneous melanoma and their correlation with programmed cell death 1 expression in tumor-infiltrating lymphocytes. J Am Acad Dermatol (2019) 81(1):219–27. doi: 10.1016/j.jaad.2019.03.012
39. Yu L, Liu X, Wang X, Yan F, Wang P, Jiang Y, et al. TIGIT+ TIM-3+ NK cells are correlated with NK-cell exhaustion and disease progression in patients with hepatitis b virus−related hepatocellular carcinoma. Oncoimmunology (2021) 10(1):1942673. doi: 10.1080/2162402X.2021.1942673
40. Liu Z, Zhou Q, Wang Z, Zhang H, Zeng H, Huang Q, et al. Intratumoral TIGIT+ CD8+ T-cell infiltration determines poor prognosis and immune evasion in patients with muscle-invasive bladder cancer. J Immunother Cancer (2020) 8(2):e000978. doi: 10.1136/jitc-2020-000978
41. Luo Y, Yang YC, Shen CK, Ma B, Xu WB, Wang QF, et al. Immune checkpoint protein expression defines the prognosis of advanced thyroid carcinoma. Front Endocrinol (Lausanne) (2022) 13:859013. doi: 10.3389/fendo.2022.859013
42. Xiao K, Xiao K, Li K, Xue P, Zhu S. Prognostic role of TIGIT expression in patients with solid tumors: A meta-analysis. J Immunol Res (2021) 2021:5440572. doi: 10.1155/2021/5440572
43. Yamashita K, Iwatsuki M, Harada K, Eto K, Hiyoshi Y, Ishimoto T, et al. Prognostic impacts of the combined positive score and the tumor proportion score for programmed death ligand-1 expression by double immunohistochemical staining in patients with advanced gastric cancer. Gastric Cancer (2020) 23(1):95–104. doi: 10.1007/s10120-019-00999-9
44. Fathi M, Pustokhina I, Kuznetsov SV, Khayrullin M, Hojjat-Farsangi M, Karpisheh V, et al. T-Cell immunoglobulin and ITIM domain, as a potential immune checkpoint target for immunotherapy of colorectal cancer. IUBMB Life (2021) 73(5):726–38. doi: 10.1002/iub.2461
45. Lei X, Lei Y, Li JK, Du WX, Li RG, Yang J, et al. Immune cells within the tumor microenvironment: Biological functions and roles in cancer immunotherapy. Cancer Lett (2020) 470:126–33. doi: 10.1016/j.canlet.2019.11.009
46. Kondĕlková K, Vokurková D, Krejsek J, Borská L, Fiala Z, Ctirad A. Regulatory T cells (TREG) and their roles in immune system with respect to immunopathological disorders. Acta Med (Hradec Kralove) (2010) 53(2):73–7. doi: 10.14712/18059694.2016.63
47. Kurtulus S, Sakuishi K, Ngiow SF, Joller N, Tan DJ, Teng MW, et al. TIGIT predominantly regulates the immune response via regulatory T cells. J Clin Invest (2015) 125(11):4053–62. doi: 10.1172/JCI81187
48. Melo V, Bremer E, Martin JD. Toward immunotherapy-induced normalization of the tumor microenvironment. Front Cell Dev Biol (2022) 10:908389. doi: 10.3389/fcell.2022.908389
49. Chauvin JM, Pagliano O, Fourcade J, Sun Z, Wang H, Sander C, et al. TIGIT and PD-1 impair tumor antigen-specific CD8⁺ T cells in melanoma patients. J Clin Invest (2015) 125(5):2046–58. doi: 10.1172/JCI80445
50. Josefsson SE, Huse K, Kolstad A, Beiske K, Pende D, Steen CB, et al. T Cells expressing checkpoint receptor TIGIT are enriched in follicular lymphoma tumors and characterized by reversible suppression of T-cell receptor signaling. Clin Cancer Res (2018) 24(4):870–81. doi: 10.1158/1078-0432.CCR-17-2337
51. Dudley JC, Lin MT, Le DT, Sun Z, Wang H, Sander C, et al. Microsatellite instability as a biomarker for PD-1 blockade. Clin Cancer Res (2016) 22(4):813–20. doi: 10.1158/1078-0432.CCR-15-1678
52. Ge Z, Peppelenbosch MP, Sprengers D, Beiske K, Pende D, Steen CB, et al. TIGIT, the next step toward successful combination immune checkpoint therapy in cancer. Front Immunol (2021) 12:699895. doi: 10.3389/fimmu.2021.699895
53. Tian X, Ning Q, Yu J, Dudley JC, Lin MT, Le DT, et al. T-Cell immunoglobulin and ITIM domain in cancer immunotherapy: A focus on tumor-infiltrating regulatory T cells. Mol Immunol (2022) 147:62–70. doi: 10.1016/j.molimm.2022.04.014
54. Blessin NC, Simon R, Kluth M, Fischer K, Hube-Magg C, Li W, et al. Patterns of TIGIT expression in lymphatic tissue, inflammation, and cancer. Dis Markers (2019) 2019:5160565. doi: 10.1155/2019/5160565
Glossary
Keywords: TIGIT, solid cancer, prognosis, meta-analysis, systematic review
Citation: Li S, Li L, Pan T, Li X, Tong Y and Jin Y (2022) Prognostic value of TIGIT in East Asian patients with solid cancers: A systematic review, meta-analysis and pancancer analysis. Front. Immunol. 13:977016. doi: 10.3389/fimmu.2022.977016
Received: 24 June 2022; Accepted: 26 August 2022;
Published: 21 September 2022.
Edited by:
Faris Alenzi, Prince Sattam Bin Abdulaziz University, Saudi ArabiaReviewed by:
Stephen Blake, South Australian Health and Medical Research Institute (SAHMRI), AustraliaFan Yun, Zhejiang Cancer Hospital, China
Copyright © 2022 Li, Li, Pan, Li, Tong and Jin. This is an open-access article distributed under the terms of the Creative Commons Attribution License (CC BY). The use, distribution or reproduction in other forums is permitted, provided the original author(s) and the copyright owner(s) are credited and that the original publication in this journal is cited, in accordance with accepted academic practice. No use, distribution or reproduction is permitted which does not comply with these terms.
*Correspondence: Yongdong Jin, Y2NjamluQDE2My5jb20=
†These authors have contributed equally to this work