 Jérôme de Sèze1,2*
 Elisabeth Maillart3,4
 Antoine Gueguen5David A. Laplaud6
 Laure Michel7,8,9Eric Thouvenot10,11
 Hélène Zephir12
 Luc Zimmer13
 Damien Biotti14
 Roland Liblau15,16
- 1Department of Neurology, Hôpital de Hautepierre, Clinical Investigation Center, Institut National de la Santé et de la Recherche Médicale (INSERM), Strasbourg, France
- 2Fédération de Médecine Translationelle, Institut National de la Santé et de la Recherche Médicale (INSERM), Strasbourg, France
- 3Department of Neurology, Pitié Salpêtrière Hospital, Paris, France
- 4Centre de Ressources et de Compétences Sclérose en Plaques, Paris, France
- 5Department of Neurology, Rothschild Ophthalmologic Foundation, Paris, France
- 6Department of Neurology, Centre Hospitalier Universitaire (CHU) Nantes, Nantes Université, Institut National de la Santé et de la Recherche Médicale (INSERM), Centre d’Investigation Clinique (CIC), Center for Research in Transplantation and Translational Immunology, UMR, UMR1064, Nantes, France
- 7Clinical Neuroscience Centre, CIC_P1414 Institut National de la Santé et de la Recherche Médicale (INSERM), Rennes University Hospital, Rennes University, Rennes, France
- 8Microenvironment, Cell Differentiation, Immunology and Cancer Unit, Institut National de la Santé et de la Recherche Médicale (INSERM), Rennes I University, French Blood Agency, Rennes, France
- 9Neurology Department, Rennes University Hospital, Rennes, France
- 10Department of Neurology, Centre Hospitalier Universitaire (CHU) Nîmes, University of Montpellier, Nîmes, France
- 11Institut de Génomique Fonctionnelle, UMR, Institut National de la Santé et de la Recherche Médicale (INSERM), University of Montpellier, Montpellier, France
- 12University of Lille, Institut National de la Santé et de la Recherche Médicale (INSERM) U1172, Centre Hospitalier Universitaire (CHU), Lille, France
- 13Université Claude Bernard Lyon 1, Hospices Civils de Lyon, Institut National de la Santé et de la Recherche Médicale (INSERM), CNRS, Lyon Neuroscience Research Center, Lyon, France
- 14Centre Ressources et Compétences Sclérose En Plaques (CRC-SEP) and Department of Neurology, Centre Hospitalier Universitaire (CHU) Toulouse Purpan – Hôpital Pierre-Paul Riquet, Toulouse, France
- 15Toulouse Institute for Infectious and Inflammatory Diseases (Infinity), University of Toulouse, CNRS, Institut National de la Santé et de la Recherche Médicale (INSERM), UPS, Toulouse, France
- 16Department of Immunology, Toulouse University Hospital, Toulouse, France
The immune system plays a significant role in multiple sclerosis. While MS was historically thought to be T cell-mediated, multiple pieces of evidence now support the view that B cells are essential players in multiple sclerosis pathogenic processes. High-efficacy disease-modifying therapies that target the immune system have emerged over the past two decades. Anti-CD20 monoclonal antibodies selectively deplete CD20+ B and CD20+ T cells and efficiently suppress inflammatory disease activity. These monotherapies prevent relapses, reduce new or active magnetic resonance imaging brain lesions, and lessen disability progression in patients with relapsing multiple sclerosis. Rituximab, ocrelizumab, and ofatumumab are currently used in clinical practice, while phase III clinical trials for ublituximab have been recently completed. In this review, we compare the four anti-CD20 antibodies in terms of their mechanisms of action, routes of administration, immunological targets, and pharmacokinetic properties. A deeper understanding of the individual properties of these molecules in relation to their efficacy and safety profiles is critical for their use in clinical practice.
1 Introduction
Multiple sclerosis (MS) is a chronic immune-mediated disease of the central nervous system. The MS clinical course, neuroradiological manifestations, and response to therapy vary significantly among individuals (1, 2). Evidence over the past 10 years has shown that B cells play a key role in MS pathogenesis (3). B cells express the surface molecule CD20, that can serve as a specific target for monoclonal antibodies (mAbs). While rituximab was the first anti-CD20 therapeutic used in MS, ocrelizumab, a humanized anti-CD20 monoclonal antibody, was the first treatment approved for relapsing forms of MS (RMS) and primary progressive MS (PPMS) based on phase III positive outcomes (4, 5). Ofatumumab, a fully human anti-CD20 monoclonal antibody, represents the first subcutaneous (SC) self-administered anti-CD20 therapy approved for RMS (6). Finally, phase III clinical trials results for ublituximab in RMS patients were just recently published (7). In this review, we describe the neurological and immunological mechanisms involved in MS. We decipher differences and similarities between anti-CD20 mAbs. Finally, we discuss how these differences might influence efficacy and safety, as well as their relevance for clinical practice.
2 MS pathophysiology: Contribution of T and B cells
2.1 T cells in MS pathology
Evidence for immune system involvement in MS pathogenesis first came from the examination of active demyelinating lesions (8). These lesions show heterogeneity between patients but also vary according to the stage of the disease. Analysis of a wide collection of samples (51 biopsies and 32 autopsies) showed that infiltrating cells located in the demyelinating plaques mainly corresponded to macrophages and CD3+ T cells, despite the heterogeneity of the lesions. Plasma cells only accounted for a small fraction of the cells (8). Further analysis of T cells by flow cytometry revealed that CD8+ T cells outnumbered CD4+ T cells in active lesions of patients with MS (9). These CD8+ T cells preferentially expressed an effector memory and a tissue-resident phenotype (9–11). White matter lesions contained activated CD8+ T cells expressing a cytotoxic effector phenotype, and higher numbers of CD8+ T cells expressing co-inhibitory and co-stimulatory receptors (9).
Recent work using single-cell RNA sequencing compared gene expression of cerebrospinal fluid (CSF) cells from “MS-discordant monozygotic twin pairs” (12). “Healthy” co-twins had subclinical neuroinflammation with small magnetic resonance imaging (MRI) lesions. Clonally expanded CD8+ T cells showing activated tissue-resident memory T cell characteristics, plasmablasts, and CD4+ T cells were identified in both patients with MS and subjects with subclinical neuroinflammation. This suggested that there is early activation of adaptive immune cells in MS. Another study comparing patients with MS and healthy donors confirmed that clonally expanded CD8+ and CD4+ T cells in CSF expressed genes that are involved in T cell activation and cytotoxicity and were different from the T cell phenotype found in the blood (13). Several studies have further demonstrated that T cells derived from the blood of patients with MS displayed enhanced production of interferon (IFN)-γ, IL-17, and GM-CSF compared to healthy controls (14, 15). In addition, profiling of clones from CCR6+ myelin-reactive T cells, mainly corresponding to CD4+ T helper (Th17) cells from patients with MS, revealed increased production of proinflammatory cytokines (14). Interestingly, Th1-like Th17 effector memory cells have been found to be recruited into the CSF of patients with clinically isolated syndrome (CIS), which suggests an early activation of this cell population in MS (16). While the involvement of T cells in MS pathogenesis is no longer a matter of debate, recent profiling techniques have tremendously contributed to a deeper understanding of T cell subpopulations and their respective roles in MS development.
2.2 B cells in MS pathology
B cell contribution to MS pathology has emerged more recently. The analysis of autopsies at different disease stages indicated that inflammation in the brain occurred in RMS, secondary progressive MS (SPMS), and PPMS (11, 17). T and B cell infiltrates correlated with active lesions, where CD20+ B cells localized in the perivascular space of large veins. Plasma cell infiltrates were more abundant in the perivascular space and the meninges of patients with progressive MS (11, 17) (Figures 1A–C). Consistent with these findings, another study detected B cell aggregates resembling lymphoid follicle structures in the meninges of 20 out of 37 SPMS cases (21). These structures correlated with subpial demyelination, neuronal loss, and cortical atrophy. This indicated that B cell maturation and immune responses could occur locally within the CNS. Interestingly, deep sequencing of immunoglobulin G (IgG) heavy chain variable region genes in paired CSF and peripheral blood samples from patients with MS identified a small subset of clonally related B cells (26, 27). This suggested that B cell activation could take place in parallel in the periphery and within the CNS.
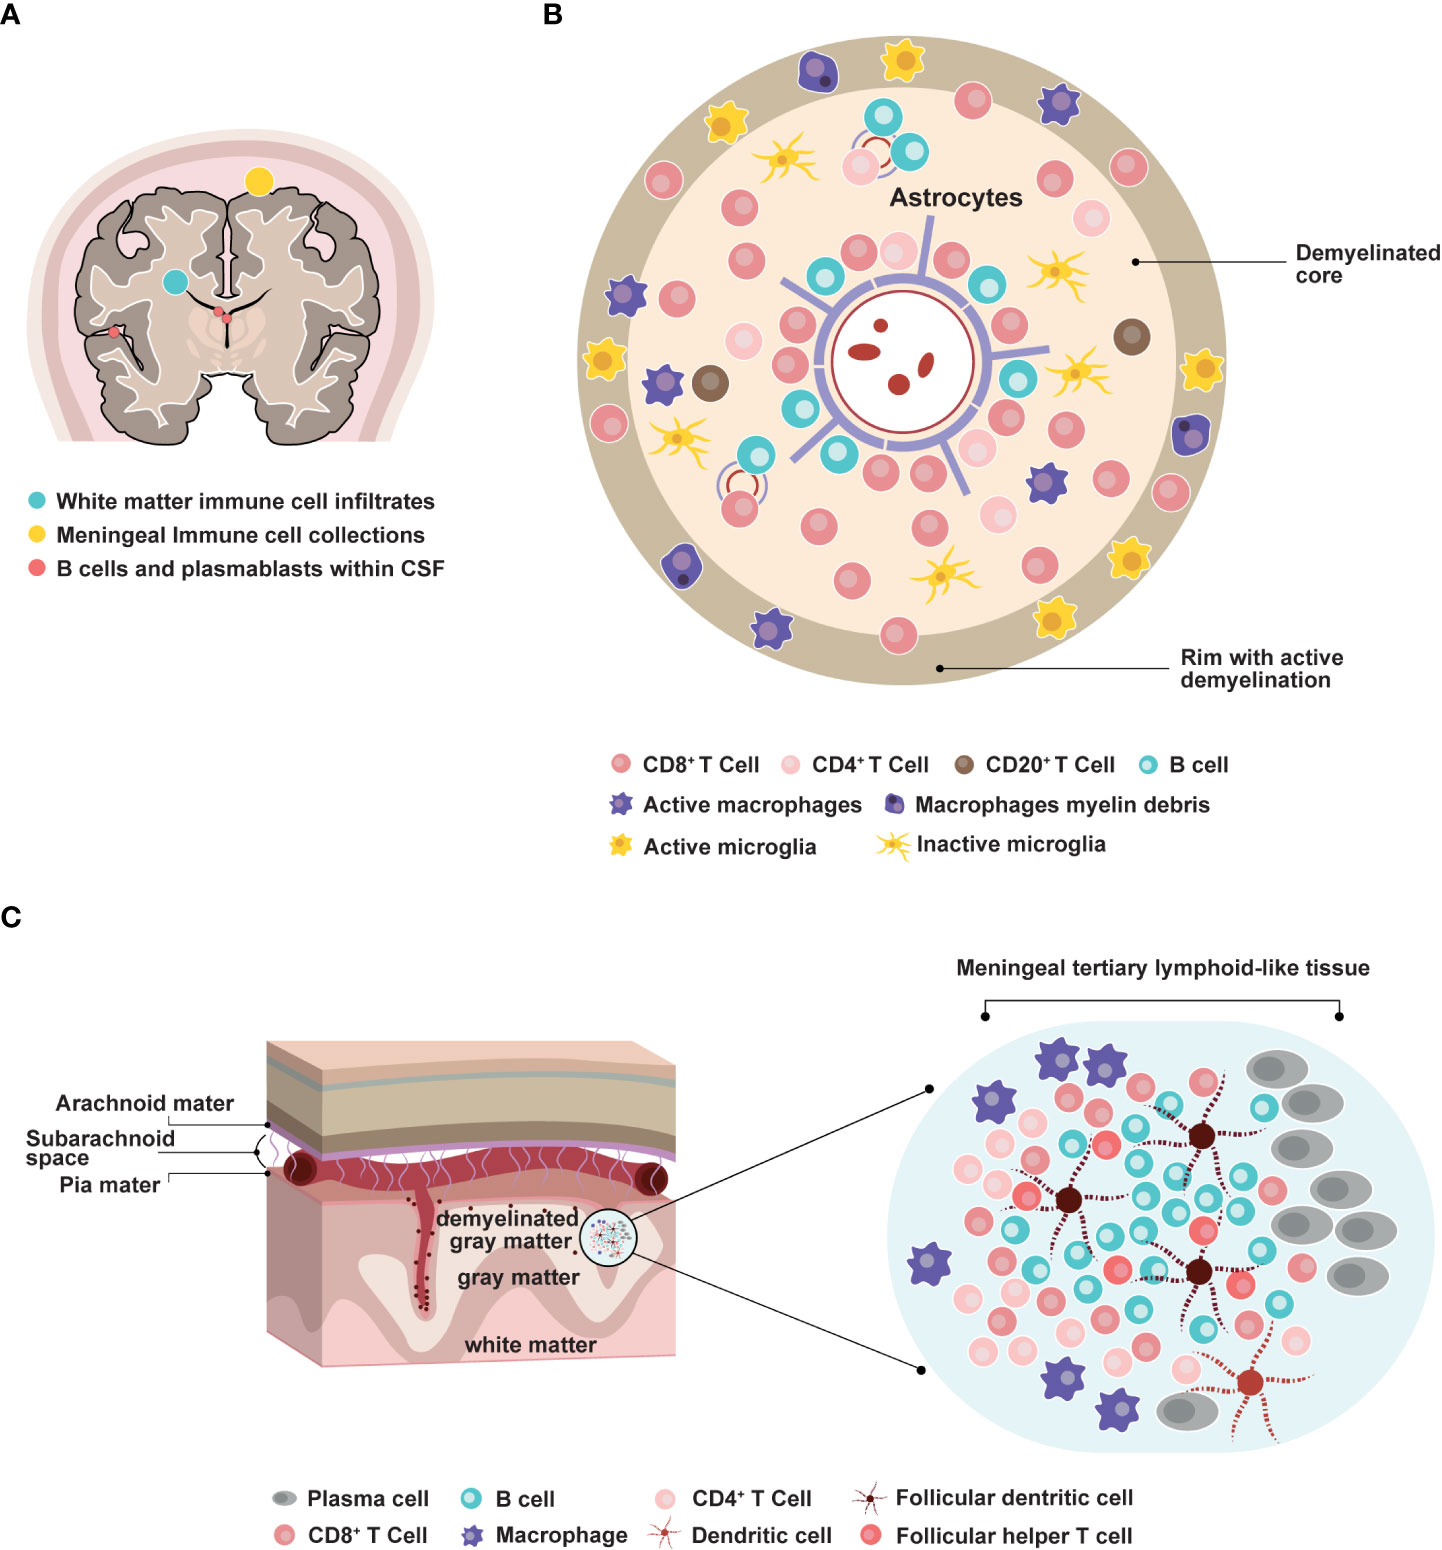
Figure 1 Involvement of B cells in multiple sclerosis pathophysiology. (A) Distribution of B cells in the central nervous system areas involved in MS pathology. CSF: cerebrospinal fluid. (B) Representation of an active MS lesion with a central inflamed vein, a demyelinated core, and a rim of active demyelination, and distribution of immune cell subpopulations (8, 9, 11, 17–20) (C) Representation of a meningeal follicle-like structure (17, 18, 21–25).
2.3 The potential role of Epstein-Barr virus in MS
Epstein–Barr virus (EBV), a highly B cell-tropic DNA herpes virus, induces asymptomatic infection in most people and can cause mononucleosis in adolescents and young adults (28).Analysis of postmortem brain tissue from patients with SPMS suggested that EBV infection could persist in B cells and plasma cells, especially within meningeal ectopic B cell follicles (29). The presence of EBV-infected cells was correlated with the activation of cytotoxic CD8+ T cells. Conversely, a recent single-cell RNA sequencing study did not detect EBV transcripts in CSF B cells in patients with RMS (30), and Angelini and colleagues reported that patients with active MS had a higher frequency of CD8+ T cells that were specific for lytic, but not latent EBV antigens when compared with patients with inactive MS or healthy donors (31). The authors postulated that EBV reactivation could occur during the active course of MS. This idea is further supported by a recent deep TCRβ repertoire analysis revealing that MS patients exhibited a higher number of TCRβ sequences against EBV (mostly lytic antigens) in peripheral blood T cells than matched healthy controls (32). A similar difference was found in MS-discordant monozygotic twins, with affected twins having greater EBV-specific TCRβ sequences than their healthy sibling.
To understand whether immune responses to EBV were detectable in patients with CIS and could predict conversion to MS, a cohort of 147 patients with CIS and 50 healthy controls were followed for seven years (33). The results indicated that patients with CIS had increased responses to EBV but not herpesvirus 6, measles, or cytomegalovirus. EBV-encoded nuclear antigen-1 (EBNA1) immune response was correlated with the number of T2 lesions at baseline, the number of T2 lesions, the presence of new T2 lesions, and the Expanded Disability Status Scale (EDSS) at follow-up. This suggested that EBNA1-specific IgG titers might be a prognostic marker for progression to MS. Interestingly, EBV viral reactivation was also increased in children with MS compared to healthy controls (34).
Assessment of antigen specificity of clonally expanded B cells from the CSF of patients with MS led to the identification of clones recognizing EBNA1 and a post-translationally modified form of GlialCAM, which is a self-antigen expressed by astrocytes and oligodendrocytes (26). This cross-reactivity was also detected in the serum of patients with MS and may provide a mechanistic link between EBV infection and MS pathogenesis.
Recent compelling results have implicated EBV as the trigger for MS development (35). In that large-scale study, the authors analyzed serum EBV antibodies from individuals who developed MS among a cohort of more than 10 million adults on active duty in the US military. The results indicated a 32-fold increase in the risk of developing MS after EBV infection. These findings warrant future efforts to elucidate how infection of B cells with EBV can initiate MS pathology.
2.4 Mechanisms underlying inflammation, demyelination, and neurodegeneration
Inflammation within the CNS leads to demyelination, subsequent neuronal loss, and axonal injury. Fundamental mechanisms driving demyelination and neurodegeneration include adaptive and innate immune systems, microglia activation, and oxidative damage (36). Analysis of 51 MS autopsies revealed that demyelination in the cerebral cortex was correlated with both inflammatory infiltrates in the meninges and oxidative-related degeneration of cortical neurons (18). By contrast, focal demyelinating lesions in the white matter occurred around blood vessels and involved retrograde neurodegeneration due to axonal loss. These observations suggested that local accumulation of inflammatory cells and production of soluble factors could induce demyelination and/or cytotoxic activity in a way that was directly or indirectly dependent on microglial activation (17, 18) (Figure 1B). Consistent with these results, in vitro experiments have indicated that lymphocyte-derived factors could influence the differentiation of oligodendrocyte precursor cells through crosstalk with microglial cells (37). Understanding these mechanisms in vivo is still challenging as it mostly relies on animal studies.
2.5 Role of peripheral B cells
B cells originate from hematopoietic stem cells in the bone marrow. Their maturation involves two distinct phases—antigen-independent maturation in the bone marrow and antigen-dependent maturation in the peripheral lymphoid tissue (38, 39). Pro-B cells (CD19- and CD20-) differentiate into pre-B cells (CD19+ CD20+), which develop into immature B cells expressing IgM while still in the bone marrow. Upon activation by an antigen and co-stimulatory factors, they evolve into mature B cells. In the germinal center, after Ig isotype switching, B cells become activated and exit to differentiate into memory B cells (CD27low), early plasmablasts (CD27high and CD40L+), and ‘late’ plasmablasts (CD27+ CD38+). These cells migrate to the bone marrow, gut, spleen, tonsils, and brain under the direction of specific chemokines (CXCL12, CCL25, and CCL28), where they evolve into antibody-producing plasma cells. B cells can function as antigen-presenting cells. They can also produce proinflammatory cytokines, enhancing the inflammatory process (36). Various proposed mechanisms suggest that interactions between B and T cells drive MS pathogenesis (40). In particular, it has been postulated that peripheral B cells in MS escape the control of functionally impaired T regulatory cells. Activated B cells interact with Th cells in germinal centers and differentiate into memory B cells, which in turn induce Th effector cell activation. By expressing distinct chemokine receptors, adhesion molecules, and proinflammatory cytokines, highly pathogenic B and T cells break through the blood-brain barrier and become locally reactivated within the CNS, causing MS pathology.
3 Targets of anti-CD20 therapies
3.1 Structure of anti-CD20 monoclonal antibodies
Anti-CD20 mAbs target a cell membrane protein, “cluster of differentiation 20” (CD20), which is predicted to have four transmembrane helices with two extracellular loops. Several hypotheses have emerged regarding CD20 function – it has been suggested to function as an ion channel by some authors (41, 42), and to indirectly regulate calcium release from the B cell receptor by others (43). Structural analyses have revealed that CD20 can assemble as a compact dimeric double barrel (44). This challenged previous findings that it functions as an ion channel.
Four anti-CD20 mAbs exist for MS treatment, as follows: rituximab, ocrelizumab, ofatumumab, and ublituximab. Although all anti-CD20 mAbs bind to the same target, they have distinct molecular and pharmacological features. Rituximab, an IgG1 mouse-human chimeric mAb, binds to amino-acid residues 168-175 on the large extracellular loop of CD20 (45). Rougé and colleagues also demonstrated that two rituximab Fabs could bind each CD20 dimer to form a circular rituximab-CD20 assembly that could allow complement recruitment (44). Ocrelizumab is a humanized glycosylated anti-CD20 IgG1 mAb that targets the large extracellular loop of CD20 on amino-acid residues 165-180, a different but overlapping epitope to that targeted by rituximab (45) (Figures 2A, B). Ofatumumab is the first fully human IgG1 mAb approved for the treatment of MS. Ofatumumab binds to discontinuous sequences of the small (amino-acid residues 74-80) and large (amino-acid residues 145-161) extracellular loops of CD20 (45) (Figures 2A, B). Ublituximab is an IgG1 chimeric mAb with a glycosylated Fc segment that enhances affinity for FcγRIIIa. It binds to amino-acid residues 158-159 and 168-171 on the large extracellular loop of CD20 (46, 47) (Figures 2A, B).
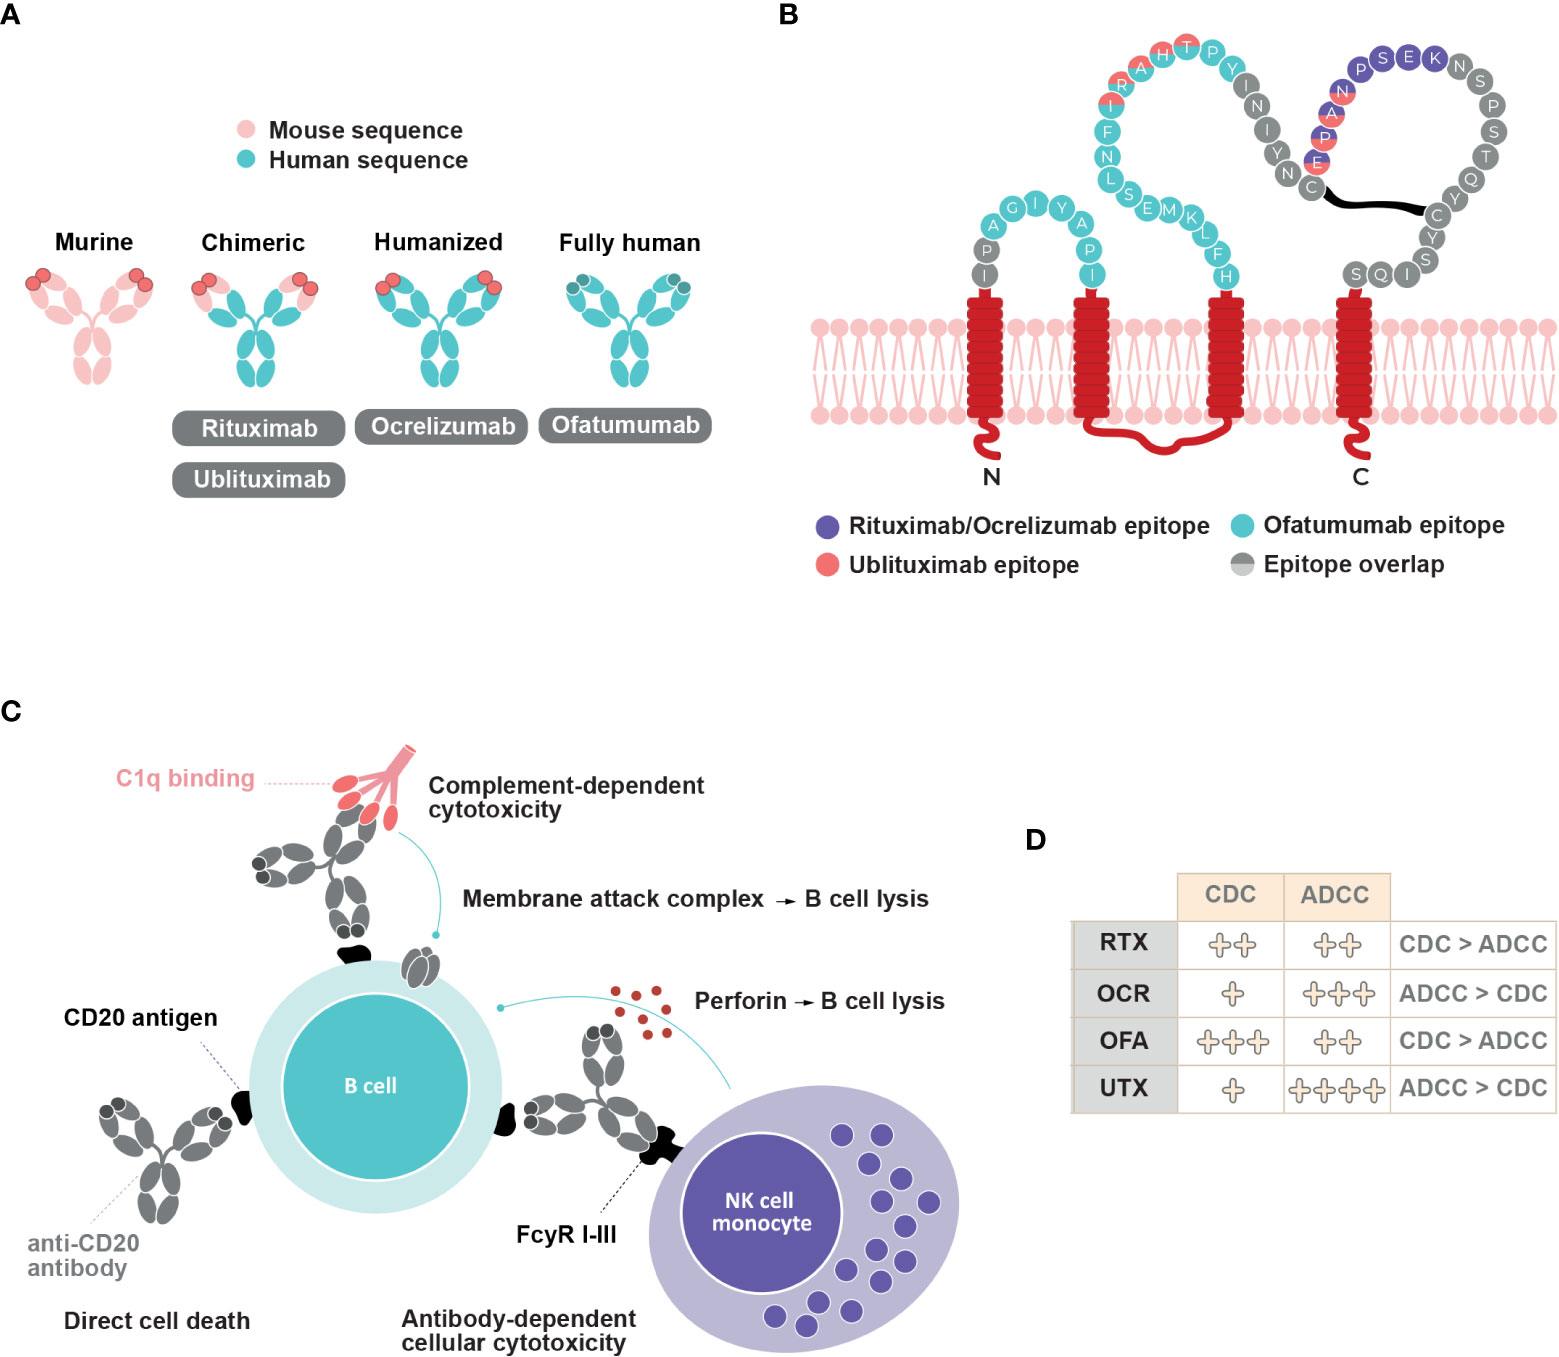
Figure 2 Anti-CD20 mAbs structure, epitope binding and mechanisms of action. (A) Structure of rituximab, ocrelizumab, ofatumumab and ublituximab antibodies (B) Binding epitopes of rituximab, ocrelizumab, ofatumumab and ublituximab on CD20. Adapted from Fox, 2021 (46) (C) Schematic representation of different mechanisms of action involved upon anti-CD20 mAbs binding and their relative contribution (D). CDC, complement dependent cytotoxicity; ADCC, antibody-dependent cellular cytotoxicity; RTX, rituximab; OCR, ocrelizumab; OFA, ofatumumab; UTX, ublituximab.
Immune responses generated against anti-CD20 mAbs may reduce therapy efficacy and/or cause adverse events. Murine-chimeric antibodies (rituximab and ublituximab) could potentially induce immunogenic responses compared to humanized (ocrelizumab) and fully human (ofatumumab) mAbs (45, 48).
3.2 Cellular targets of anti-CD20 mAbs
CD20 is expressed by pre-B cells in the bone marrow and naïve and memory B cells in the lymphoid tissues or germinal centers (39). Conversely, hematopoietic stem cells, most plasmablasts, and antibody-producing plasma cells do not express CD20. Although B cells represent the majority of CD20+ cells, a subset of CD3+ T cells also expresses CD20 on their cell surface (49, 50). These cells have been detected in the lymphatic tissues, blood, and CSF of healthy patients and were comparatively enriched in the blood and CSF of patients with MS. CD20+ T cells have a proinflammatory phenotype, and mostly correspond to CD8+ T cells with an effector memory T cell signature. CD20+ T cells in the CNS exhibit a tissue-resident memory phenotype (19). Further work is needed to understand the contribution of these cells to immune responses.
3.3 Mechanisms of action of anti-CD20 mAbs: In vitro evidence
Anti-CD20 mAbs molecular structure and epitope binding dictate the contribution of at least three distinct mechanisms of B cell depletion. The binding of anti-CD20 mAbs can induce direct cell death, complement-dependent cytotoxicity (CDC), and antibody-dependent cellular cytotoxicity (ADCC) (Figures 2C, D). ADCC involves antibody recognition by Fc-gamma receptors expressed on immune effectors such as natural killer cells and macrophages, which leads to direct cytotoxicity or phagocytosis (45, 51). Although all four anti-CD20 mAbs can induce the translocation of CD20 into lipid rafts, which allows for greater activation of complement proteins, the relative level of CDC activity varies between them. CDC activity predominates in rituximab and ofatumumab compared to ADCC activity (6, 45, 52). In vitro studies have indicated that ofatumumab exerts a two-fold greater ADCC activity than does rituximab, and a ten-fold higher CDC activity in rituximab-sensitive tumor cell lines (53, 54). Additionally, ofatumumab has a stronger binding affinity to the cell membrane and has a slower dissociation rate from CD20 than does rituximab (45, 55, 56). Ofatumumab induces greater CDC activity compared to ocrelizumab (77.1% vs. 7.1%) after a 2-hour exposure (57). In contrast, ADCC activity predominates over CDC activity in ocrelizumab and ublituximab (45, 46, 52). Compared with rituximab, ocrelizumab exhibits two- to five-fold greater ADCC activity and three- to five-fold lower CDC activity (58). Ublituximab, which is designed to have an enhanced affinity for FcγRIIIa, exerts greater ADCC activity than do rituximab, ocrelizumab, and ofatumumab (46, 59). Higher ADCC activity may allow lower doses and shorter infusion times (46), whereas weaker CDC activity may decrease infusion-related reactions (60).
3.4 Route of administration, dosing regimens, and kinetics of B cell depletion and reconstitution
Differences in the clinical efficacy and safety between anti-CD20 mAbs may depend on the route of administration. Patients treated with rituximab, ocrelizumab, and ublituximab receive intravenous (IV) infusion, whereas ofatumumab is delivered by SC self-injection (Table 1). IV-administered drugs offer fast bioavailability as they directly reach systemic blood circulation (61). In addition, they induce profound depletion of CD20-expressing B cells in the spleen due to the presence of loose capillaries (62). SC-administrated drugs are transported from the hypodermis to the lymphatics before entering the systemic circulation. Slower absorption can result in incomplete bioavailability compared to IV administration. Simultaneously, it may limit the side effects associated with high serum concentration (61).
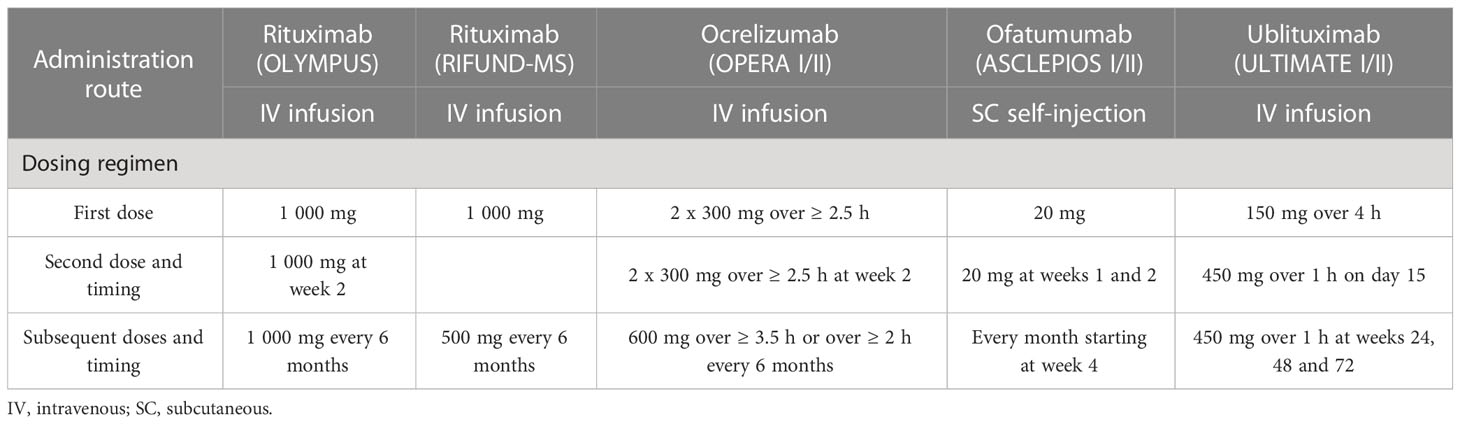
Table 1 Administration route and dosing regimens of anti-CD20 mAbs in phase II/III clinical trials.
Current dose regimens for rituximab, ocrelizumab, ofatumumab, and ublituximab result in rapid and near-complete depletion of circulating B cells, with varying rates of B cell reconstitution. Rituximab has been studied in two small clinical trials involving patients with RRMS (HERMES trial) (63) and with PPMS (OLYMPUS trial) (64), and more recently in a phase III clinical trial comparing rituximab and dimethyl fumarate in patients with RRMS (RIFUND-MS trial) (65). In the HERMES trial, patients received two 1000 mg IV infusions administered two weeks apart (at weeks 0 and 2) (63). In the OLYMPUS trial, patients were administrated two 1000 mg IV infusions at weeks 0 and 2, and subsequent two 1 000 mg infusions every six months at an interval of 14 days (64) (Table 1). Premedication was required before rituximab administration. Rituximab led to a > 95% reduction of CD19+ peripheral B cells within two weeks after the last infusion (63, 64). By week 48, the repletion of CD19+ cells corresponded to 30.7% of baseline values in the HERMES trial (63). In the OLYMPUS trial, peripheral B cells were above the lower limit of normal (LLN) in 35% of rituximab-treated patients 50 weeks after their last dose (64). In the RIFUND-MS trial, patients received a starting dose of 1000 mg IV rituximab followed by 500 mg every 6 months. No analysis of B cell depletion was reported (65).
Ocrelizumab efficacy and safety have been evaluated in the treatment of patients with RMS and PPMS, in the phase III trials OPERA I/II (4) and ORATORIO (5, 66), respectively. In both trials, patients treated with ocrelizumab received two 300 mg IV infusions (delivered over ≥ 2.5 hours) on days 1 and 15, and subsequent 600 mg infusions every six months (delivered over ≥ 3.5 hours) (Table 1). Premedication was recommended before ocrelizumab administration. Ocrelizumab induced an almost complete depletion of B cells by week 2 (after the first dose) in the OPERA I/II trials (4). For 90% of patients, the repletion of B cells occurred within 2.5 years after the last infusion (compared to the baseline or LLN), with a median time of 72 weeks (67).
Ofatumumab efficacy and safety have been studied in phase II MIRROR (68) and phase III ASCLEPIOS I/II trials in patients with RMS (6). Depletion of B cells occurred in a dose-dependent manner in the MIRROR trial (68). At week 12, B cell counts were between 2% and 25% of baseline levels. Repletion of B cells was also dependent on the dose, with 64-74% of patients reaching the LLN at week 132. Interestingly, B cell reconstitution started at approximately week 30 for the highest dose (60 mg every four weeks) and week 16-18 for the lower doses (3 mg, 30 mg, and 60 mg every 12 weeks), which suggests that the onset of B cell reconstitution was also dose dependent. Ofatumumab treatment consists of an SC self-administered injection of 20 mg once monthly (three initial doses administered weekly starting at week 0, followed by once-monthly doses starting at week 4, which allows rapid but safe B cell depletion with improved tolerability) and does not require premedication (6, 69) (Table 1). Rapid and near-complete depletion of B cells has been reported in 82–85% of patients by week 2 (6). By week 4, 94% of patients had less than 10 cells/μl. This percentage increased to 98% at week 12. B cell depletion was maintained independently of the patient’s body weight for as long as 120 weeks (69, 70). Clinical studies have shown a median time of 24.6 weeks for B cell reconstitution. This is consistent with PK-B cell modeling and simulation studies that estimated a median time of 23 weeks to B cell recovery (69).
Ublituximab has been evaluated in phase II (46, 71) and phase III clinical trials (7). In the phase III ULTIMATE I/II trials, patients with RMS received a 150 mg IV infusion (over 1-4 hours), followed by a 450 mg IV infusion (over 1 hour) 2 weeks later. Subsequent doses were administrated every 24 weeks up to week 96 (Table 1). Premedication was required before ublituximab infusion (7, 46). In phase II 48-week trial, B cell counts were significantly reduced 24 hours after the first dose (from 7.3% at baseline to 0.2%). A near-complete depletion of B cells (≥ 95%) occurred in all patients treated with ublituximab within two weeks after the second infusion. At week 48, no significant repletion was observed (46). In the phase III ULTIMATE I/II trials, CD19+ B cell depletion was achieved in 96% of patients treated with ublituximab 24 hours after the first dose (7). No significant increase in CD19+ was observed at the end of the trial, with cell counts still reduced by 97% in the ublituximab group.
3.5 Kinetics of B cell depletion and reconstitution in the CSF and tissues
Evaluating total B cell depletion is a challenge because blood counts do not necessarily reflect B cell depletion within tissues. An open-label phase II clinical trial analyzed B and T cells in the CSF of patients with RRMS treated with rituximab. The results indicated that a reduction in B and T cells in the CSF occurred in most patients 24 weeks after initial treatment (72). Blood infusion of rituximab allows minimal diffusion within the CNS through the blood-brain barrier (CSF:serum ratio 1:260), and its peak concentration in CSF remains very low (73). While anti-CD20 mAbs have proven efficacy for RMS treatment, they have failed to prevent long-term disability in SPMS. Pathophysiological data have suggested that meningeal ectopic lymphoid follicles are associated with SPMS (11, 17, 22). The proliferation of B cells and subpial inflammation have been linked to disease severity in SPMS, in that they lead to disease progression and neurodegeneration. This could in part, be explained by the inability of mAbs to cross the blood-brain barrier. The ongoing OBOE clinical trial (NCT02688985) evaluates biomarkers in the CSF of patients with RMS or PPMS who received ocrelizumab 600 mg every 24 weeks (74). The preliminary results have shown reductions in the concentration of neurofilament light chain, and the numbers of CD19+ B cells and CD3+ T cells, 12 and 24 weeks after ocrelizumab treatment. Interestingly, neurofilament light chain decrease over time was correlated with B and T cell numbers. This suggested a positive effect of ocrelizumab on reducing axonal injury. Analysis of B cells in the peripheral blood and CSF of a patient with RRMS treated with rituximab indicated a total depletion of CD19+ B cells in both compartments within eight weeks after rituximab administration (75). In this study, B cell depletion was still detected 6 months after the first infusion and was correlated with a reduction of gadolinium-enhancing T1 lesions.
To understand the kinetics of B cell depletion and recovery in different immune compartments, Häusler and colleagues used models of experimental autoimmune encephalomyelitis (76). The authors showed that ocrelizumab treatment reduced mature B cells in the bone marrow, blood, lymph nodes, and spleen. After treatment arrest, B cells simultaneously repopulated in the bone marrow and spleen before reappearing in blood. Ofatumumab treatment of cynomolgus monkeys induced a rapid and efficient depletion of B and CD20+ T cells but spared marginal zone B cells in the spleen and lymph nodes (77).
Analysis of B cell depletion and repletion in tissues remains a technical challenge, and many questions remain unanswered. In particular, the role and origin of plasma cells in the CNS of patients with MS remain unclear. Recent work examined the hypothesis that recirculating intestinal IgA-producing cells can regulate neuroinflammation (78). Data obtained in an experimental autoimmune encephalomyelitis mouse model suggested that some plasma cells found in the CNS originated from the gut and produced IgA, suppressing neuroinflammation via an IL-10-dependent mechanism. These intriguing findings warrant future efforts to understand the complexity of immune responses within MS tissues.
3.6 Subtypes changes and function
Anti-CD20 mAbs can quickly and efficiently deplete B cells in patients with MS. By contrast, B cells replenish at different times and frequencies according to the different antibodies. Several studies have examined how the absence and reoccurrence of B cells influence frequency, differentiation, and the activity of other immune populations, particularly T cells. A detailed analysis of peripheral B cell repletion after rituximab treatment for 24 months showed that reappearing B cells mainly corresponded to transitional and mature-naïve B cells, whereas memory B cell numbers were reduced (79). Interestingly, reappearing B cells corresponded to a more activated phenotype, as shown by enhanced expression of CD25. The cytokine B cell-activating factor of the TNF family (BAFF) is essential for B cell survival and differentiation. B cell depletion induced by rituximab increased BAFF production, a mechanism that could explain the survival of some B cells or the re-emergence of autoreactive B cells (80). Interestingly, genome-wide association studies have found that a variant in TNFSF13B (a disease risk allele), encoding BAFF, was associated with MS. This allele induced higher humoral immunity through increased levels of BAFF, B cells, and immunoglobulins (81).
While the involvement of EBV seroconversion on MS risk is getting clearer, the role of EBV infection and reactivation on the progression of established MS remains to be clarified. Since EBV mostly infects memory B cells, the observation of protracted reduced levels of memory B cells in the blood after B cell-depletion therapy (79) begs the question of whether changes in the proportion of EBV-infected B cells (or rates of latent vs. lytic infection) is one mechanism of action of anti-CD20 mAb therapy in MS. Dedicated longitudinal analysis of peripheral blood mononuclear cells biobanked prior to anti-CD20 mAb therapy, as well as before and after B cell repopulation in selected subgroups of treated MS patients should help tackle this important issue. These studies would interrogate both the B cell pool and the T cell repertoire (32).
Anti-CD20 depletion can also result in a relative loss in CD4+ CD8+ T effector function, a decrease in terminally differentiated T cells (CD4+ > CD8+), and an increase of CD4+ effector memory T cells (79). B cell depletion with rituximab in patients with RRMS significantly reduced proliferation and proinflammatory cytokine (Th1 and Th17) responses of both CD4+ CD8+ T cells. B cell-mediated activation of T cells appeared to be associated, at least in part, with B cell production of the proinflammatory cytokines LT and TNFα (82). Another study investigated the role of B cells in “autoproliferation” or self-reactivity of peripheral Th1 cells (83). The authors showed that “autoproliferation” of Th1 cells was increased in patients carrying the HLA-DR15 haplotype (a genetic risk factor for MS) and was mediated by memory B cells in an HLA-DR-dependent manner. Depletion of B cells by anti-CD20 effectively reduced T cell autoproliferation. Although myelin proteins are considered to be potential autoantigenic targets, prior studies of myelin-reactive CD8+ T cells in MS were performed in vitro. In this study, ex vivo measurements of precursor frequencies and phenotypes of myelin-specific CD8+ T cells in the peripheral blood revealed an increased proportion of myelin-specific CD8+ T cells in patients with MS who exhibited a memory phenotype and expressed CD20 compared to control subjects (84). The proportion of memory and myelin-specific CD20+ CD8+ T cells was significantly reduced following anti-CD20 treatment (Figure 3).
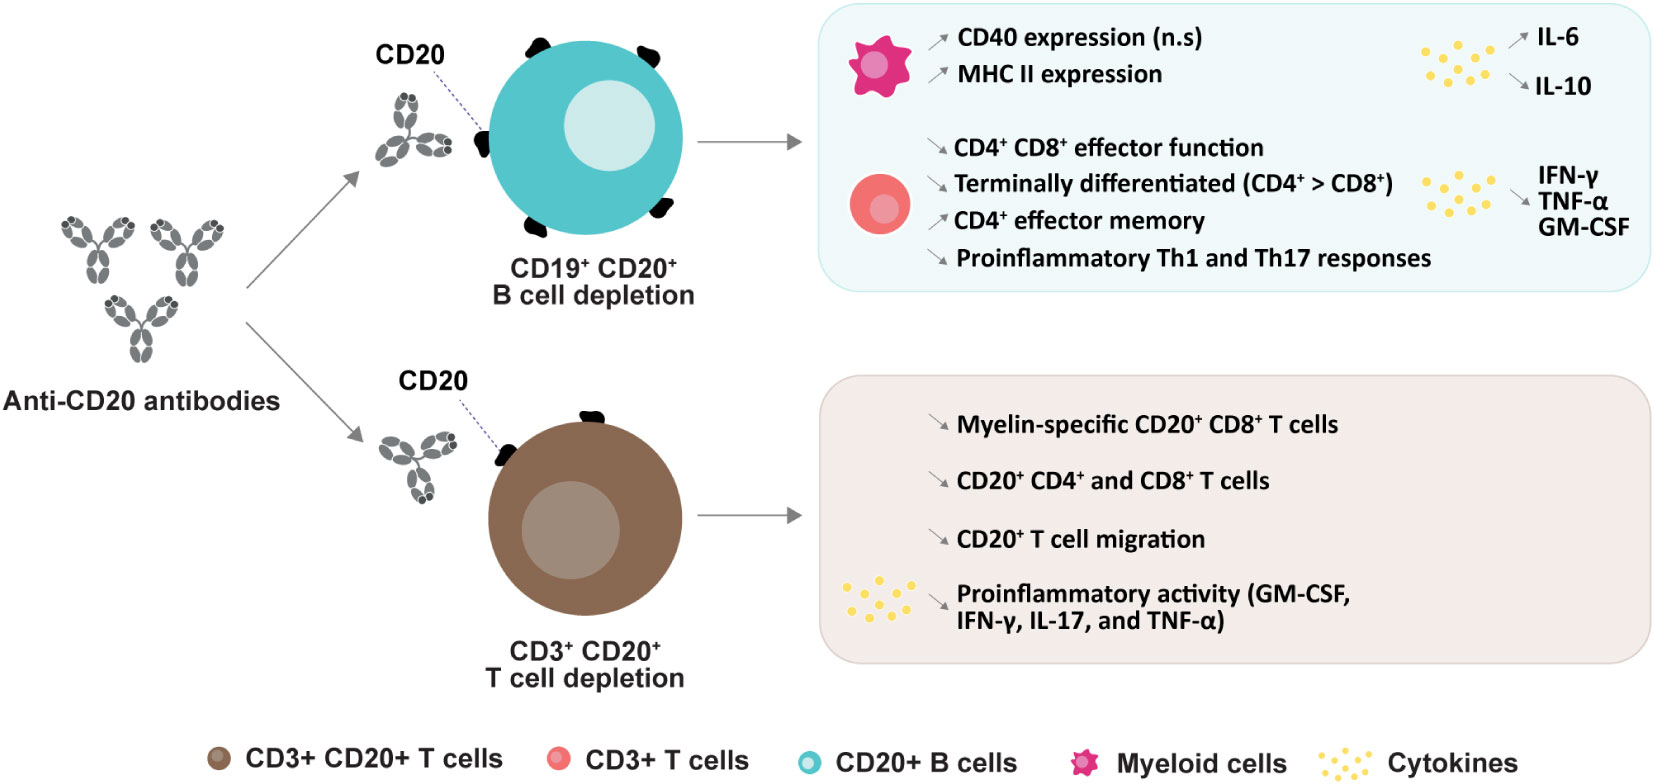
Figure 3 Anti-CD20 mediated changes in subtypes and their functions. CD20+ B cell depletion leads to an increase in CD40 expression (n.s: non-significant) and MHC II expression in myeloid cells (79); a decrease in CD4+ and CD8+ effector function (79), proinflammatory Th1 and Th17 responses (82), and numbers of terminally differentiated T cells, and an increase in CD4+ effector memory cells (85). Secretion of cytokines are changed upon B cell deletion (79, 85). CD20+ T cell depletion induces a decrease in myelin-specific CD20+ CD8+ cells (84), in both CD20+ CD4+ and CD8+ cells (86), in CD20+ T cell migration (85) and a decrease in pro-inflammatory cytokines (49, 87).
Although B cells represent the primary target for anti-CD20 mAbs, a subpopulation of circulating CD3+ T cells also express CD20 (49, 50). Rituximab treatment in MS has been found to effectively target and deplete CD20+ CD3+ T cells in peripheral blood. Interestingly, this cell population replenished at earlier times and higher frequencies than CD20+ CD19+ B cells (49, 88). Similarly, it has been reported that depletion of CD3+ CD20+ T cells occurred two weeks after administration of 300 mg ocrelizumab (89). The APLIOS study also indicated a rapid depletion of specific CD20+ T cell subsets (CD20+ CD3+ CD8+ T cells) that are known to exhibit an activated phenotype (86) (Figure 3). Together, these findings suggest that depletion of CD20+ CD3+ T cells may contribute to some treatment effects.
4 Clinical and radiological efficacy of anti-CD20 mAbs
4.1 Rituximab
4.1.1 Efficacy of rituximab in RRMS
4.1.1.1 Phase II
Despite its broad use in clinical practice, rituximab is not approved for the treatment of RRMS, and few trials have analyzed its efficacy in MS. In the phase II HERMES trial, 69 patients with RRMS received 1000 mg of IV rituximab (vs. 35 patients who received a placebo) on days 1 and 15 (63) (Table 2). Total counts of gadolinium-enhancing lesions and new gadolinium-enhancing lesions were reduced at weeks 12, 16, 20, and 24 in patients who received rituximab compared to controls (p < 0.001). Rituximab-treated patients experienced a lower number of relapses at week 24 (14.5% vs. 34.3%, p = 0.02) and week 48 (20.3% vs. 40.0%, p = 0.04), compared to controls. The annualized relapse rate (ARR) was also decreased in patients who received rituximab at week 24 (p = 0.04), but not at week 48 (p = 0.08).
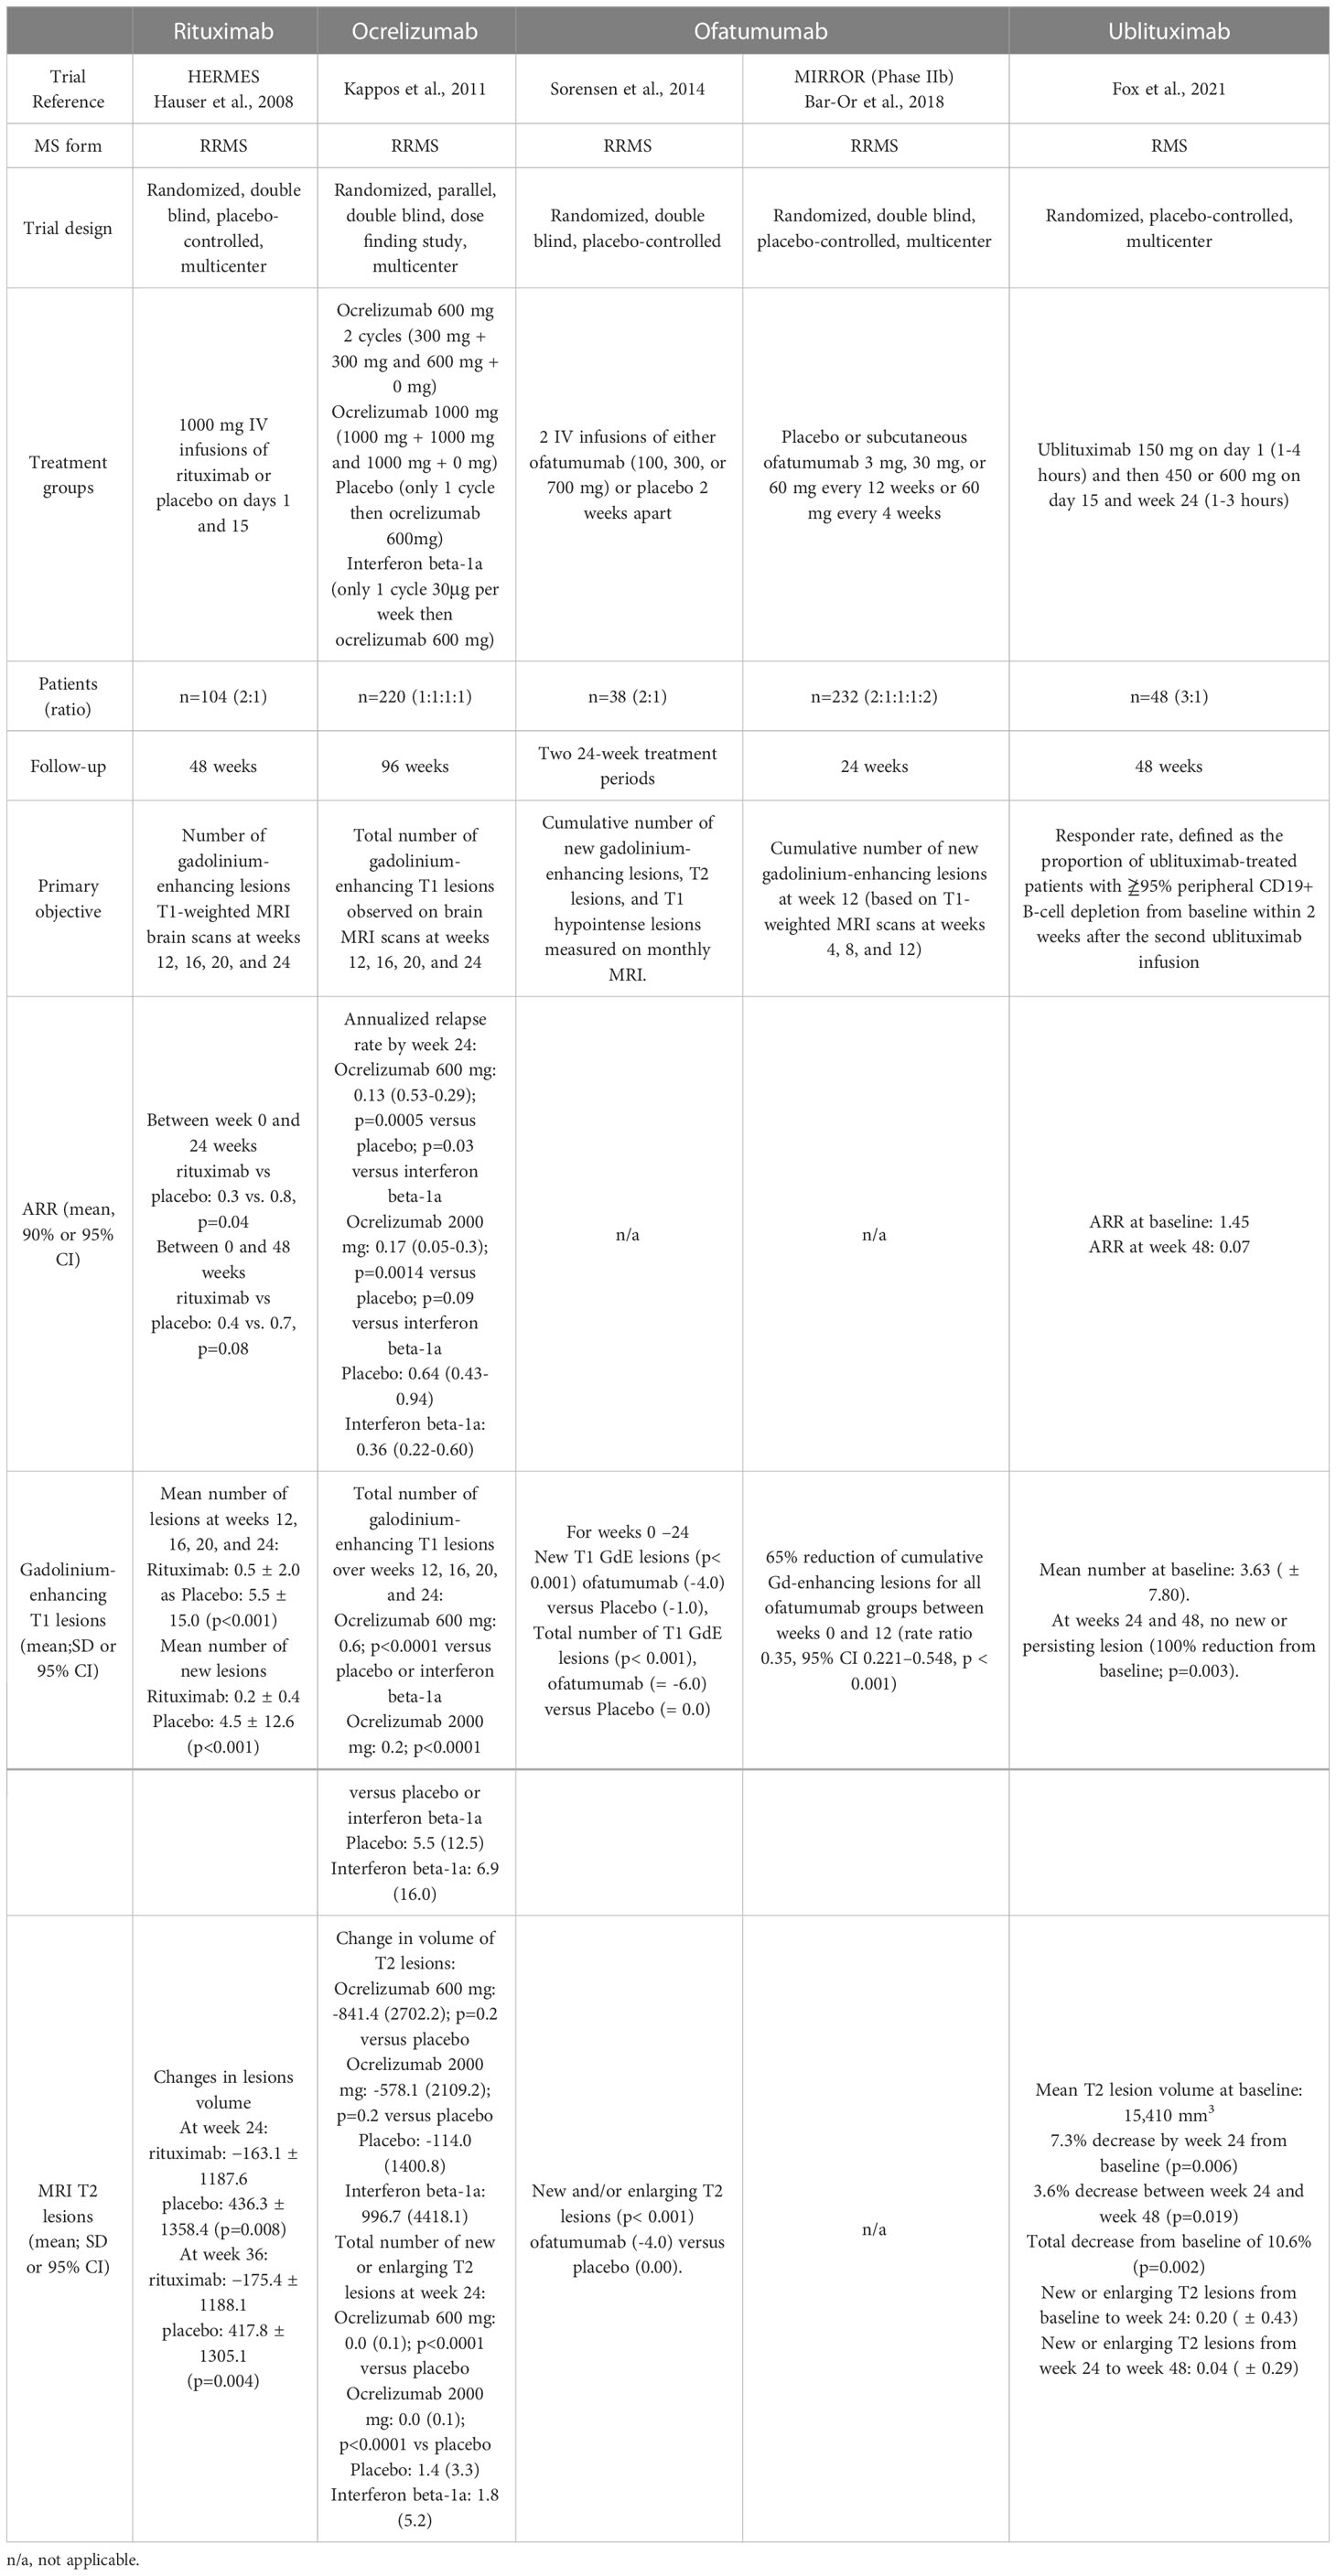
Table 2 Summary of clinical and MRI efficacy in phase II clinical trials.
4.1.1.2 Phase III
The RIFUND-MS trial evaluated the efficacy and safety of rituximab compared to dimethyl fumarate in patients with RRMS or CIS (65). In this study, 100 patients received 1 000 mg of IV rituximab followed by 500 mg every 6 months and 100 patients received oral dimethyl fumarate 240 mg twice daily for an observation period of 24 months. A total of five patients were removed from the intention-to-treat analysis. Relapses occurred in 3% of patients treated with rituximab vs. 16% of patients in the dimethyl fumarate group, corresponding to a risk ratio of 0.19 (p=0.0060) (Table 3). The annualized relapse rate was inferior in the rituximab group (0.015) compared to the dimethyl fumarate group (0.087). Secondary outcomes indicated that no new MRI activity was detected in 79% and 63% of patients treated with rituximab and dimethyl fumarate, respectively. Patients treated with rituximab had reduced numbers of T2 lesions (mean: 0.3 vs. 1.5, p=0.0047) and Gd+ lesions (mean: 0.04 vs. 0.26, p=0.0062) compared to patients who received dimethyl fumarate. No significant difference was observed between the groups for the Expanded Disability Status Scale score (Table 3).
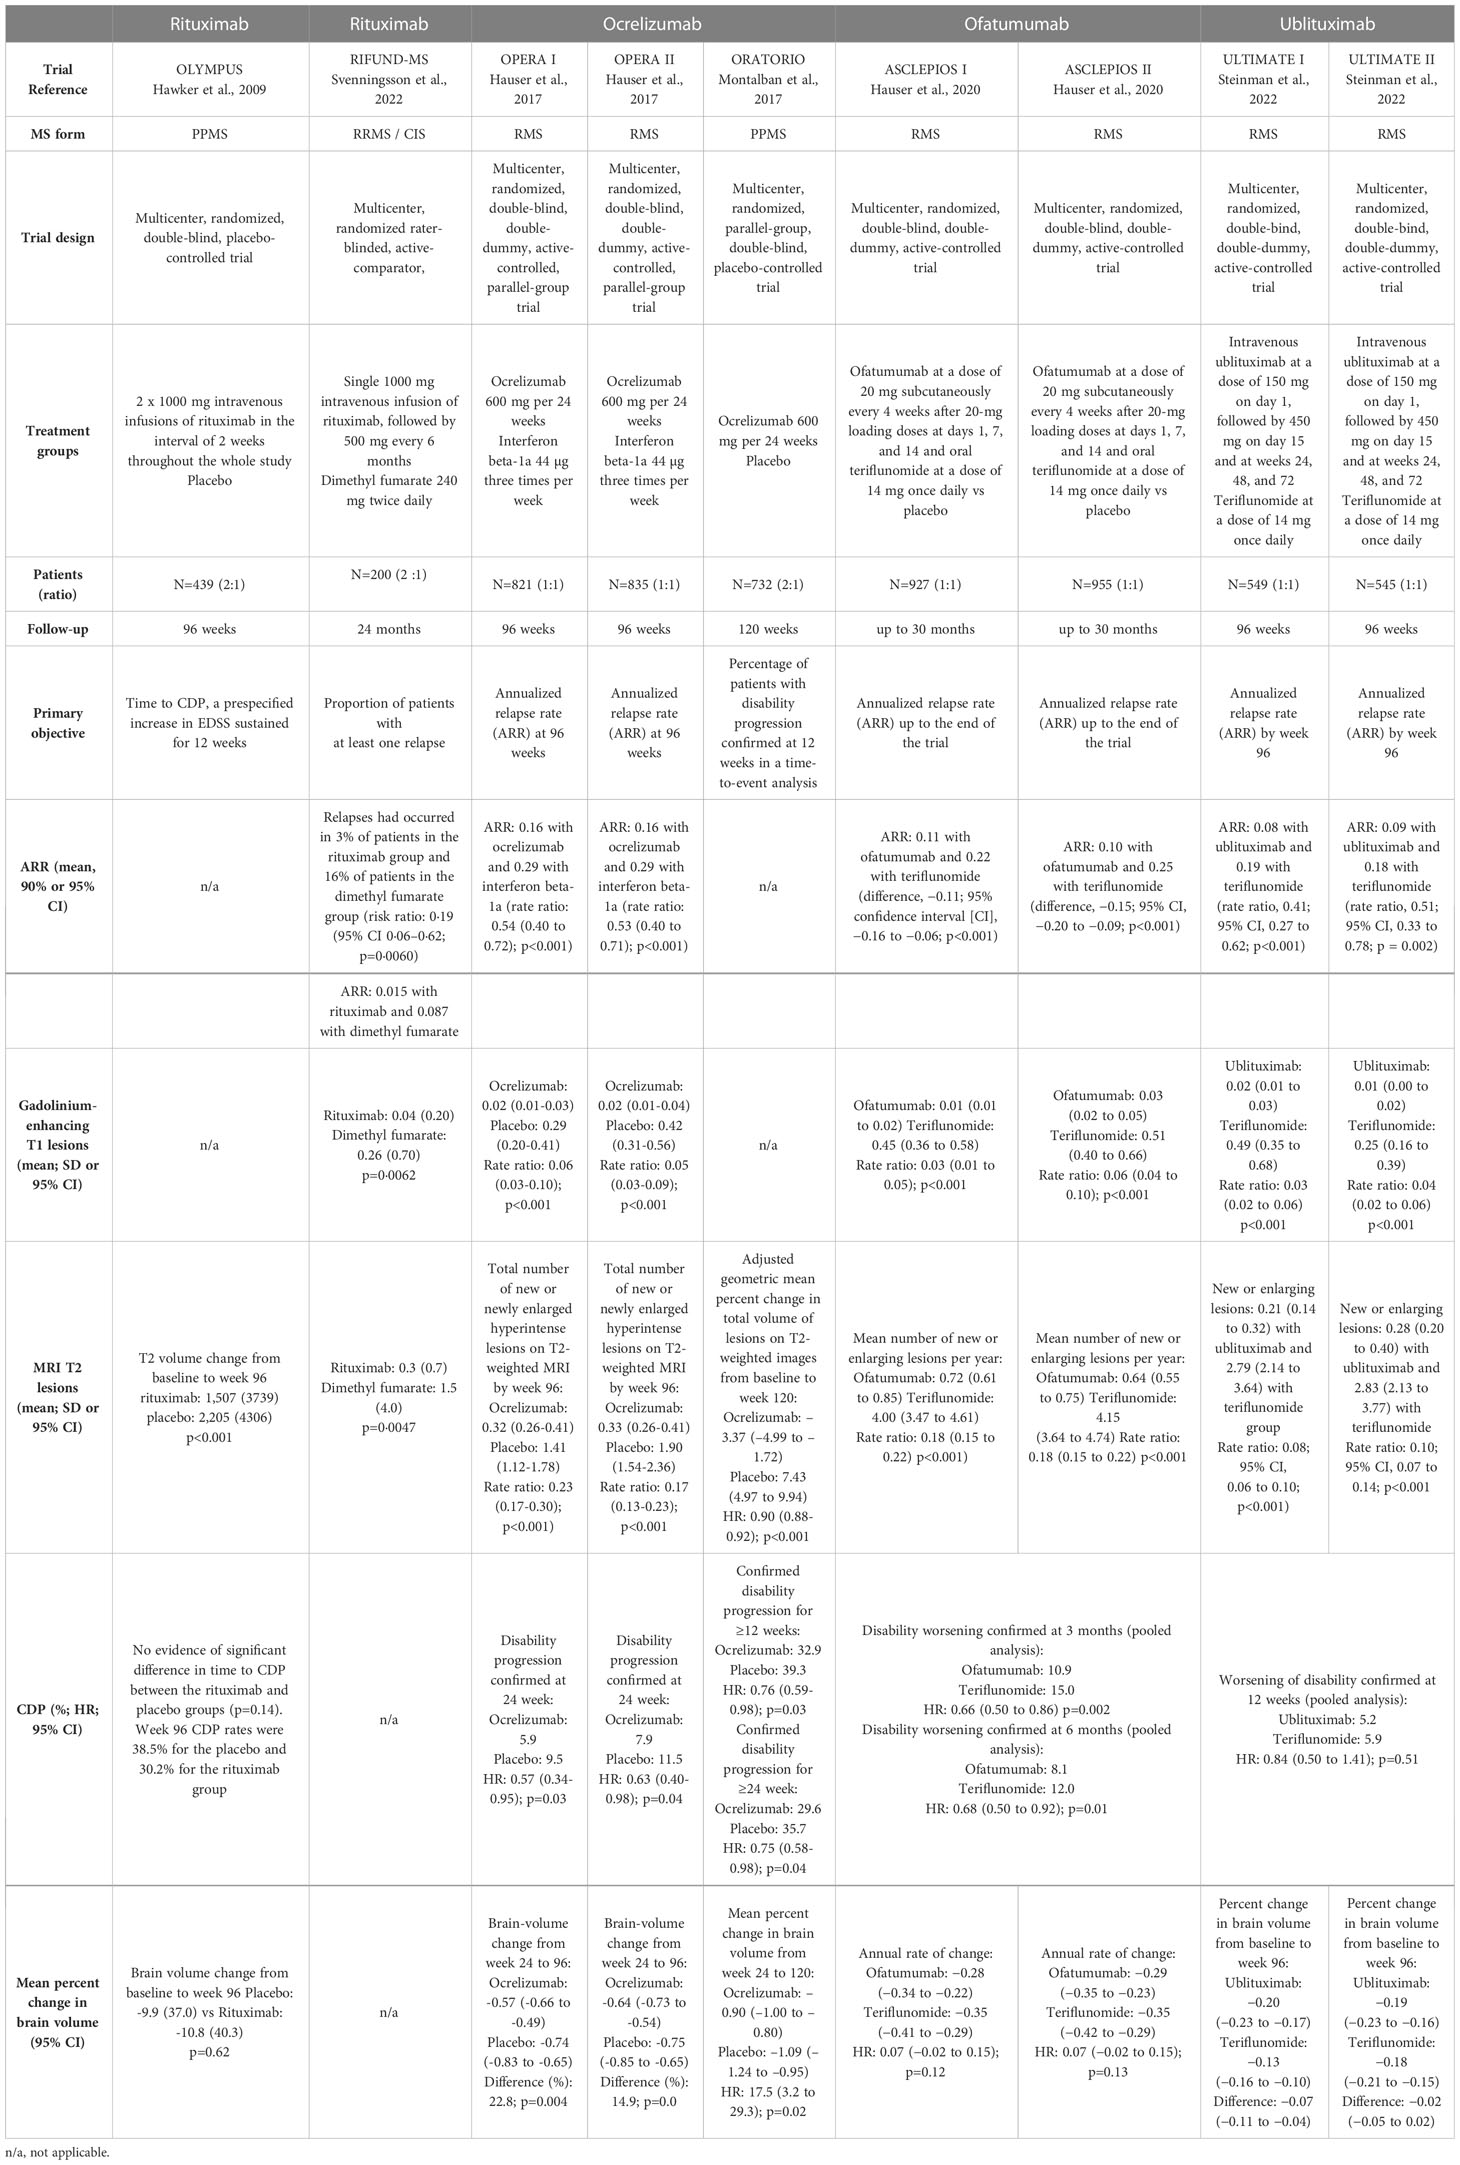
Table 3 Summary of clinical and MRI efficacy in phase III clinical trials.
4.1.2 Efficacy of rituximab in PPMS
The phase II/III OLYMPUS trial evaluated the efficacy and safety of rituximab in 439 patients with PPMS (64). In this study, 292 patients received rituximab at weeks 0, 2, 24, 26, 48, 50, 72, and 74, and were compared to patients who received placebo (Table 3). Although time to confirmed disease progression (CDP) was not significantly different between groups, T2-weighed lesion volume from baseline to week 96 increased less in patients who received rituximab.
Consistent with these data, retrospective studies have reported a significant reduction of disease activity, with reduced ARR, T2, and gadolinium-enhancing lesions, in patients treated with rituximab (90, 91).
4.2 Ocrelizumab
4.2.1 Efficacy of ocrelizumab in RMS
4.2.1.1 Phase II
Ocrelizumab efficacy has been studied in patients with RRMS in a phase II placebo-controlled clinical trial (92) (Table 2). Among the 220 patients included, 204 (93%) completed the 24-week study, and 218 (99%) were included in the intention-to-treat analysis. At week 24, the number of gadolinium-enhancing T1 lesions was reduced in patients treated with 600 mg (89% reduction) and 2000 mg (96% reduction) ocrelizumab compared to those in the placebo group. The ARR showed 80% and 73% reductions in the 600 mg and 2000 mg ocrelizumab groups, respectively, compared to the placebo group.
4.2.1.2 Phase III
Phase II results have been confirmed in two phase III trials—OPERA I and OPERA II (4) (Table 3). At the end of the 96-week treatment period, 86.3% and 89.3% of patients who received ocrelizumab, and 76.6% and 82.7% of those who were given IFN-β-1a, had completed the study (for OPERA I and OPERA II, respectively). The ARR was lower with ocrelizumab compared to IFN-β-1a at 96 weeks (0.16 vs. 0.29), corresponding to 46% and 47% reductions in OPERA I and OPERA II, respectively. A relative risk reduction of 40% was observed for both 12-week and 24-week CDP with ocrelizumab compared to IFN-β-1a (9.1% and 6.9% for ocrelizumab; 13.6% and 10.5% for IFN-β-1a). The total mean number of gadolinium-enhancing T1 lesions was lower with ocrelizumab than with IFN-β-1a (94% fewer lesions with ocrelizumab in OPERA I and 95% in OPERA II). Ocrelizumab reduced the total number of Gd-enhancing T1 lesions by 94% in OPERA I and 95% in OPERA II) and the total number of new or newly enlarged T2 lesions by 77% in OPERA I and 83% in OPERA II. Finally, the percentage of patients who achieved no evidence of disease activity (NEDA3) was higher with ocrelizumab compared to IFN-β-1a (64–89% difference), and the brain volume loss was reduced by 14.9% to 22.8% in the ocrelizumab group. However, these results were inconclusive due to a failure of the statistical hierarchical testing procedure.
In the open-label extension study, patients switching from IFN-β-1a to ocrelizumab (at two years) had a similar ARR at five years (93). The proportion of patients with CDP at five years was lower with ocrelizumab compared to patients switching from IFN-β-1a to ocrelizumab (16.1% and 21.3%, respectively), but the risk of CDP after switching was similar. MRI activity (total number of T1 Gd-enhancing lesions and new/enlarging T2 lesions) was lower in patients switching from IFN-β-1a to ocrelizumab, with similar results compared to patients treated with ocrelizumab. Brain volume loss was unchanged in patients treated with ocrelizumab for five years.
4.2.2 Efficacy of ocrelizumab in PPMS
4.2.2.1 Phase III
The placebo-controlled ORATORIO trial evaluated the efficacy of ocrelizumab in patients with PPMS (5) (Table 3). Overall, 82% of patients who received ocrelizumab and 71% of those in the placebo group completed the 120-week treatment period. A relative risk reduction of 23% was reported for 12-week CDP with ocrelizumab compared to placebo (32.9% vs. 39.3%). This result was confirmed for 24-week CDP, with a relative risk reduction of 25%. Ocrelizumab also induced a 29.3% reduction in the timed 25-foot walk performance from baseline to week 120 compared to placebo. However, the SF-36 Physical Component Summary score was unchanged between the two groups. At 120 weeks, the total volume of T2 lesions, the number of new or enlarging T2 lesions, and the brain volume loss were reduced in ocrelizumab-treated patients. However, a bias in favor of the ocrelizumab group was introduced because there was more withdrawal in the placebo group than in the ocrelizumab group (34% and 21%, respectively), and this was considered to indicate a greater disease progression. When censoring was applied at withdrawal to these patients, the effect of ocrelizumab decreased, with an odds ratio of 0.86 (95% confidence interval: 0.62–1.19).
4.3 Ofatumumab
4.3.1 Efficacy of ofatumumab in RMS
4.3.1.1 Phase II
Ofatumumab was first evaluated in a placebo-controlled phase II trial involving 38 patients with RRMS (94). Patients received two IV infusions of ofatumumab at three different doses. Significant reductions in the number of T1 Gd-enhancing lesions, new T1 Gd-enhancing, and new and/or enlarging T2 lesions were observed in ofatumumab-treated patients (Table 2).
The MIRROR phase IIb trial evaluated the efficacy of SC administration of ofatumumab vs. placebo (68). In this 48-week study, patients received ofatumumab 3 mg, 30 mg, or 60 mg every 12 weeks, ofatumumab 60 mg every four weeks, or a placebo. Patients in the placebo group were given 3 mg ofatumumab at week 12. The cumulative number of new lesions was reduced by 65% for all ofatumumab dose groups compared to the placebo group from weeks 0 to 12. From weeks 4 to 12, the mean rate of new Gd-enhancing lesions was reduced, from 71% to 92% across ofatumumab groups. A ≥ 90% suppression of new lesions was observed over 12 weeks with cumulative doses ≥ 30 mg and 9% to 22% of patients across the ofatumumab groups relapsed vs. 25% in the placebo group (Table 2). Patients who received ofatumumab also experienced fewer relapses (9% to 22% across groups) than those in the placebo group over the 24-week treatment period.
4.3.1.2 Phase III
The ASCLEPIOS I and II trials evaluated the efficacy of ofatumumab in patients with RMS (6). In ASCLEPIOS I, patients who received ofatumumab had a lower adjusted ARR (0.11) compared to those in the teriflunomide group (0.22), corresponding to a 50.5% relative reduction. Similar results were obtained in ASCLEPIOS II with a 58.5% relative reduction (Table 3). The mean number of T1 gadolinium-enhancing lesions was decreased with ofatumumab (0.01) compared to with teriflunomide (0.45) in ASCLEPIOS I (97% relative reduction with ofatumumab). The corresponding values in ASCLEPIOS II were 0.03 for ofatumumab and 0.51 for teriflunomide, corresponding to a 94% relative reduction. The number of new or enlarging lesions on T2-weighted MRI was reduced in the ofatumumab group in both ASCLEPIOS I (82% relative reduction) and ASCLEPIOS II (85% relative reduction). Finally, the annualized rate of brain volume loss did not differ significantly between patients treated with ofatumumab and those treated with teriflunomide.
4.4 Ublituximab
4.4.1 Ublituximab efficacy in RMS
4.4.1.1 Phase II
Ublituximab has been designed to induce higher ADCC compared to other anti-CD20 mAbs (46). In the phase II placebo-controlled 48-week trial, 36 patients with RMS received three ublituximab infusions (150 mg on day 1, 450-600 mg on day 15 and week 24) (Table 2). No T1 gadolinium-enhancing lesions were detected at weeks 24 and 48 (p = 0.003) and the T2 lesions volume was decreased by 10.6% at week 48 (p = 0.002) in ublituximab-treated patients. The annualized relapse rate was low (0.07), with 93% of patients remaining relapse-free during the study.
4.4.1.2 Phase III
The phase III ULTIMATE I and II trials evaluated the efficacy (Table 3) and safety of ublituximab in patients with RMS (7). At 96 weeks, ublituximab treatment resulted in a lower ARR than teriflunomide (0.08 vs. 0.19 in ULTIMATE I; 0.09 vs. 0.18 in ULTIMATE II). Fewer T1 Gd-enhancing lesions were detected with ublituximab compared to teriflunomide in both trials (0.02 vs. 0.49 in ULTIMATE I; 0.01 vs. 0.25 in ULTIMATE II). The total number of new or enlarging lesions was also reduced in ublituximab-treated patients compared to the teriflunomide group (0.21 vs. 2.79 in ULTIMATE I; 0.28 vs. 2.83 in ULTIMATE II). In the ULTIMATE I trial, 44.6% of ublituximab-treated patients showed no evidence of disease activity (vs. 15% in the teriflunomide group). Similar results were reported in the ULTIMATE II trial, with 43% of the ublituximab group showing no evidence of disease activity vs. 11.4% in the teriflunomide group. However, no significant difference in the worsening of disability at 12 weeks was found between ublituximab- and teriflunomide-treated patients in the pooled analysis of the two trials (5.2% vs. 5.9%). Finally, brain volume change was not significant between the two groups.
5 Safety of anti-CD20 mAbs
5.1 Adverse events after anti-CD20 therapy
5.1.1 Infusion/injections-related reactions
Infusion/injections-related reactions (IRRs) are the most common adverse events reported in patients treated with anti-CD20 mAbs (Table 4). Administration-related reactions generally occur within 24 hours of the first injection/infusion and decrease with subsequent doses. In the phase II HERMES and phase II/III OLYMPUS trials, 67.1% to 78.3% of patients treated with rituximab experienced IRRs following the initial infusion (63, 64). This percentage decreased to 20.3% to 22.6% after the second infusion and 4.9% after the eighth infusion. IRRs were mild-to-moderate, with 7.4% of rituximab-treated patients presenting grade 3 (63) and no grade 4 adverse events reported (63, 64). In the RIFUND-MS trial, 40.9% of patients treated with rituximab reported infusion-related reactions. The OPERA I/II study reported a 34.3% incidence of IRRs for ocrelizumab vs. 9.7% for IFN-β-1a (4). In the phase III ORATORIO study, the incidence of IRR was 39.9% for ocrelizumab vs. 25.5% for placebo (5). The phase II MIRROR study revealed that IRRs were more frequent with higher doses of ofatumumab and a shorter administration time (68). In phase III ASCLEPIOS trials, 20.2% of patients who received ofatumumab experienced mild-to-moderate IRRs, predominantly during the first injection (99.8% of IRRs), vs. 15% in patients receiving a placebo in the teriflunomide group (6). In the phase II trial, ublituximab caused grade 1 or 2 IRRs (50% of patients), although 77% of ublituximab infusions did not induce IRRs (46). Comparable results were reported in ULTIMATE I/II trials, with an occurrence of IRRs in 47.7% of ublituximab-treated patients (7). The frequency of these adverse events was higher with the first dose and subsequently decreased, as reported with the other anti-CD20 mAbs.
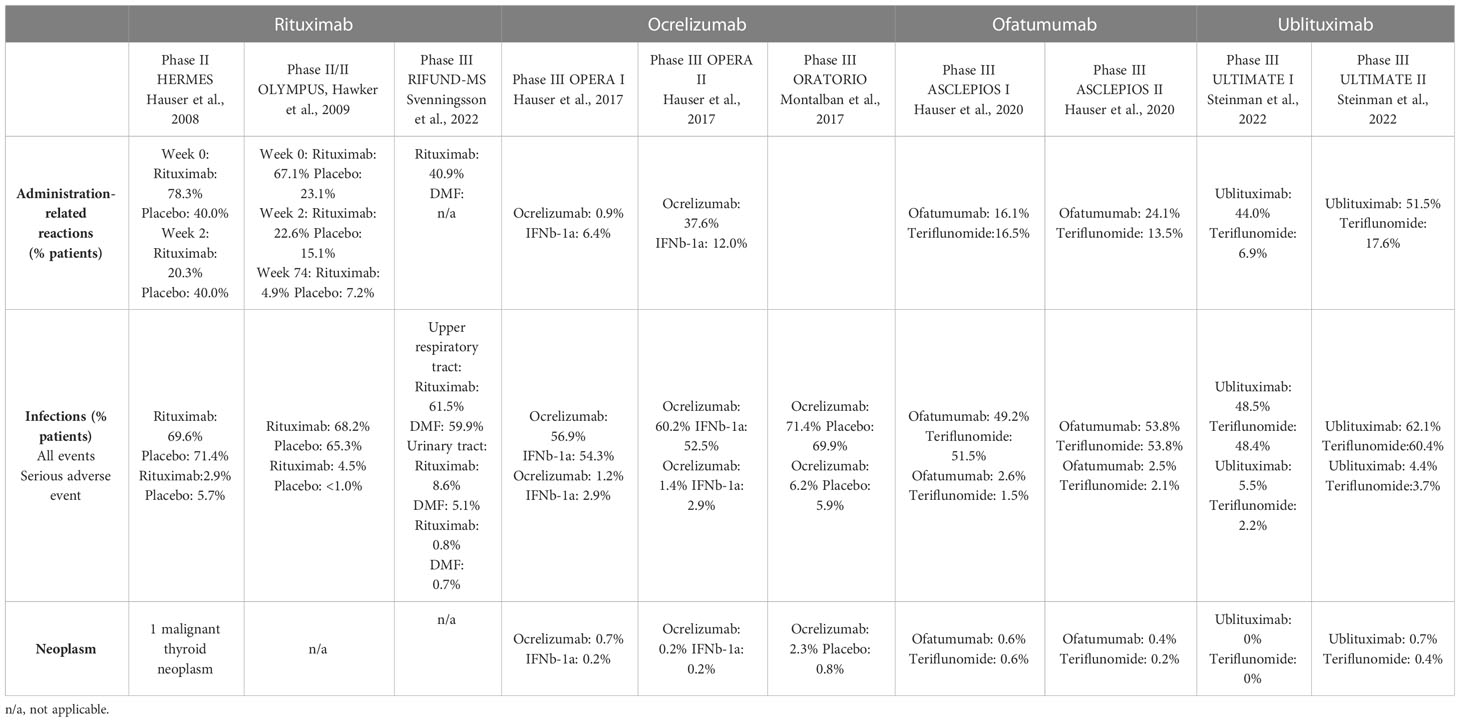
Table 4 Most common adverse events observed with rituximab, ocrelizumab, ofatumumab and ublituximab in phase II/III trials.
Murine-chimeric antibodies (rituximab and ublituximab) are more likely to cause immunogenic reactions than humanized (ocrelizumab) and fully human (ofatumumab) mAbs (45, 48). Human anti-chimeric antibodies were detected in 24.1% of patients treated with IV rituximab in the HERMES trial and 7% (vs. 6.3% for patients who received the placebo) in the OLYMPUS trial (63, 64). In the OPERA trials, anti-drug and neutralizing antibodies were detected in 0.4% and 0.1% of ocrelizumab-treated patients, respectively (4). In ORATORIO, 1.9% and 0.2% of patients developed anti-drug and neutralizing antibodies, respectively (5). No neutralizing antibodies were detected after ofatumumab treatment, and 0.2% of patients developed anti-drug antibodies (6). Data show that levels of neutralizing antibodies are very low, and there is no robust proof of a clear pathogenicity induced by these antibodies.
The relatively lower CDC potency of ocrelizumab and ublituximab compared with rituximab and ofatumumab might also lower the IRR incidence. Premedication (corticoids, antihistamines, and/or antipyretics) is required/recommended prior to IV infusion of rituximab, ocrelizumab, and ublituximab to lessen the severity and/or reduce the number of these events. Ofatumumab IRRs should be reduced compared to other anti-CD20 mAbs because SC administration is thought to generate reduced injection-related adverse events compared with IV infusions.
5.1.2 Hypogammaglobulinemia
Although anti-CD20 mAbs do not affect plasma cells, B cell-depleting therapies may lead to a decline in serum Igs, increased infection risk, and lower response to vaccines. While MS clinical trials of rituximab, ocrelizumab, and ofatumumab have shown there to be a stronger decrease in IgM levels than in IgG and IgA levels over time, short-term follow-up results have indicated that there is no association with an increased risk of infection for patients (4–6, 63, 64). Serum levels of Ig were below the LLN in 7.9% of rituximab-treated patients (vs. 3% for the placebo group) (63). While the levels of IgM were low in 22.4% of patients who received rituximab (vs. 8.6% for the placebo group), median levels of IgM, IgG, and IgA across all patients stayed above the LLN for the duration of the trial.
The phase III trials and extended studies reported an association between the rate of serious infections and the reduction of Ig levels after prolonged ocrelizumab exposure (4, 5, 93). For most patients, Ig levels stayed above the LNN over five years (93). The percentages of patients with a decrease below the LLN at year 5 were 5.4% for IgG, 5.1% for IgA, and 29.5% for IgM. In phase III ASCLEPIOS trial, the mean levels of IgG did not decrease below the LLN with monthly ofatumumab treatment over 3.5 years compared with baseline values (95). A decrease in the mean IgM value was observed with ofatumumab, but this was not associated with the risk of infections, including serious infections (96). A reduction in serum IgM levels was observed over time, but for most patients, the levels remained above the LLN. The proportion of patients with IgM levels below the LLN at any time during the post-baseline visit was higher among patients who received ofatumumab (17.7%) vs. teriflunomide (6.6%). The proportion of patients with IgG below the LLN at any time during the post-baseline visit was lower in patients who received ofatumumab (14.2%) vs. teriflunomide (22.9%). In addition, a baseline quartile analysis from the extension study demonstrated that while the mean IgM levels decreased over time, they were maintained above the LLN from baseline to week 68, while the mean IgG levels remained stable over time (95).
Since CD20 is not expressed on plasma cells, IgG levels and existing humoral protection are maintained after treatment with anti-CD20 mAbs. It is essential to monitor IgG levels before, during, and after treatment to minimize the risks of serious infections.
5.1.3 Infections
As mentioned earlier, serum Ig decline may increase infection risk in anti-CD20-treated patients. Phase III clinical trials revealed a comparable incidence of infections between anti-CD20 mAbs and comparators. The most common infections reported with rituximab in the RIFUND-MS trial were upper respiratory tract, urinary tract, and sinusitis infections (65)(Table 4). Serious infections occurred in two (0.8%) patients treated with rituximab and one (0.7%) patient who received dimethyl fumarate.
The incidence of infection was 56.9% to 60.2% in the ocrelizumab group vs. 52.5% to 54.3% in the IFN-β-1a group in the OPERA I/II trial (4). The most common infections were upper respiratory tract infection, nasopharyngitis, and urinary tract infection. 5.9% of patients reported herpesvirus-associated infection in the ocrelizumab group (vs. 3.4% in the IFN-β-1a group). Serious infections were reported in 1.3% of ocrelizumab-treated patients vs. 2.9% of IFN-β-1a-treated patients. No opportunistic infections were recorded in any group (4). In the ORATORIO trial, the infection incidence was 71.4% in the ocrelizumab group vs. 69.9% in the placebo group (5). Upper respiratory tract infections and oral herpes infections were more frequent with ocrelizumab treatment than with placebo treatment (10.9% vs. 5.9%). The most common infections were nasopharyngitis, urinary tract infection, influenza, and upper respiratory tract infection. Serious infections occurred in 6.2% of patients treated with ocrelizumab vs. 5.9% treated with a placebo.
The percentage of patients with recorded infections was 51.6% in the ofatumumab group and 52.7% in the teriflunomide group in the ASCLEPIOS I/II trials (6). Similar results were obtained from the extension study, which reported an infection incidence of 54.3% in ofatumumab-treated patients after 3.5 years of treatment (95). The most common infections were nasopharyngitis, upper respiratory tract infection, and urinary tract infection. A herpesvirus-associated infection was reported in 4.9% of the ofatumumab group and 4.2% of the teriflunomide group (6). Serious infections occurred in 2.5% of patients in the ofatumumab group vs. 1.8% in the teriflunomide group (6). Faster B cell repletion and persistence of splenic B cells with SC treatment may decrease the risk of infections.
In the ULTIMATE I/II clinical trials, infections occurred in 55.8% of patients treated with ublituximab vs. 54.4% of patients who received teriflunomide. Serious infections were reported in 5% and 4.4% of ublituximab-treated patients vs. 2.9% of teriflunomide-treated patients (7). Grades 1 or 2 herpesvirus-associated infections were reported in 5.7% of patients in the ublituximab group vs. 4.6% in the teriflunomide group. The most frequent infections were related to the respiratory tract. No opportunistic infections were reported.
5.1.4 Risk of SARS-CoV-2 infection
Anti-CD20 therapies may expose patients with MS to SARS-CoV-2 infections. Evidence has shown that patients with MS present incidence, risk factors, and outcomes for SARS-CoV-2 that are similar to those of the general population (97–100). Risk factors for severe forms of SARS-CoV-2 include neurological disability, an older age, and comorbidities. A multi-center retrospective study conducted in France found no association between hospitalization for SARS-CoV-2 and anti-CD20 therapies (98). Most ocrelizumab-treated patients infected with severe SARS-CoV-2 developed a mild-to-moderate disease course without hospitalization. Recent work also reported SARS-CoV-2 infections of mostly mild-to-moderate severity in 245 ofatumumab-treated patients. Most patients recovered from SARS-CoV-2 infection without hospitalization or treatment discontinuation (101). However, an Italian cohort study in 844 patients with MS with SARS-CoV-2 infection reported an increased risk of severe SARS-CoV-2 in people treated with ocrelizumab or rituximab compared to untreated individuals (99). There was also a trend towards worse clinical outcomes with a longer duration of anti-CD20 therapies compared to other therapies. Patients treated with an anti-CD20 therapy for longer might be at a higher risk of SARS-CoV-2 due to decreased antibody responses (100).
5.1.5 Progressive multifocal leukoencephalopathy
Rare cases of progressive multifocal leukoencephalopathy (PML) caused by the John Cunningham virus have occurred in patients treated with anti-CD20 antibodies. Notably, no PML cases have been reported in those receiving rituximab treatment for MS (63–65). Ten cases of PML have been recorded in those receiving ocrelizumab for MS (102). However, 9 of these cases previously received natalizumab or fingolimod and were considered carry-over cases. Another study reported a case of PML in a 78-year-old patient with PPMS who was treated with ocrelizumab for two years (103). In this case, the patient did not receive previous disease-modifying therapy. However, his age and the presence of lymphopenia increased the risk of developing PML. No reported cases of PML associated with ofatumumab or ublituximab in patients with MS (6, 95). Taken together, these findings indicate a minimal risk of PML under anti-CD20 treatment for MS. However, long-term safety data are missing, and vigilance is necessary for the elderly or patients switching from other disease-modifying therapies.
5.1.6 Neoplasms
Neoplasms occurring after anti-CD20 therapy are rare events. Only one patient presented with a thyroid neoplasm after rituximab therapy in the HERMES trial (63). Furthermore, the incidence of neoplasms in patients with MS was similar to that of the general population in a retrospective study that evaluated cancer risk with disease-modifying therapies (104). Furthermore, long-term analysis from the rituximab global safety database indicated no increased risk of malignancy (rate of 4.2 per 1 000 patients) in patients with rheumatoid arthritis who received rituximab (105). Similar results were obtained from the Rheumatoid Arthritis Global Clinical Trial Program (106). Prolonged exposure to rituximab over eleven years did not increase the rate of neoplasms in these patients. A higher incidence of neoplasms (particularly in the breast) was found with ocrelizumab treatment in RMS and PPMS trials compared to comparator and placebo groups (4, 5). Neoplasms occurred in 0.5% of patients treated with ocrelizumab, in 0.2% of those treated with IFN-β-1a in the OPERA I/II trials, and in 2.3% of ocrelizumab-treated patients compared to 0.8% in the placebo group in the ORATORIO study. The incidence of neoplasms was comparable to that of the general population, but there was an imbalance in the occurrence of breast cancer, which should be further investigated. In the MIRROR study, one case of malignant melanoma was reported in the 60 mg ofatumumab group (68). In the ASCLEPIOS trials, neoplasms were reported in 0.5% of patients in the ofatumumab group and 0.4% in the teriflunomide group (6). Similarly, only rare cases of neoplasm occurred in ublituximab-treated patients (0.7%) compared to patients who received teriflunomide (0.4%) (7).
5.1.7 Late-onset neutropenia
Several studies have suggested that rituximab can cause late-onset neutropenia (LON). LON, defined as grade III-IV neutropenia, occurs at least 3-4 weeks after the last rituximab infusion and has no other identified cause (107–112). The OPERA I/II trials reported an incidence of mild neutropenia in 14.7% of patients treated with ocrelizumab vs. 40.9% of patients treated with IFN-β-1a (4). The ORATORIO trial reported an incidence of 13% in patients treated with ocrelizumab vs. 10% for those who received the placebo (5). Less than 1% of all patients exhibited grade 3 or 4 neutropenia. Only rare case reports have described LON in patients treated with ocrelizumab after the first infusion (113–115). Several mechanisms have been proposed to account for LON (112, 116–119): cell maturation arrest, potentially arising from defects in SDF-1 and preventing mature neutrophils from reaching the blood; IgG FcɣRIIIa158V/F polymorphism that leads to antibody-mediated elimination of neutrophils: or increase in BAFF levels during B cell.
Considering that LON is infrequent, not predictable, varies in terms of its onset and duration, and rarely causes significant infection, a blood count can be performed in the event of fever or infection in the months following anti-CD20 mAbs treatment.
5.2 Vaccination efficacy
Vaccination is critical in MS management because infections can aggravate MS symptoms. Many studies have evaluated the responses to vaccination in rituximab-treated patients and have shown reduced humoral responses, depending on the vaccines (120–124). The VELOCE study evaluated responses to selected vaccines in ocrelizumab-treated patients with RMS (125). The data indicated that ocrelizumab-treated patients had attenuated humoral responses to the tetanus toxoid vaccine, pneumovax, and the neo-antigens KHL vaccine. A recent study examined the hepatitis B seroconversion rate in 153 patients with MS who were receiving disease-modifying treatment (126). A switch to an anti-CD20 therapy during the series of vaccinations led to a decline in the seroprotection rate, from 66.7% at baseline to 18.2% to 52.2%. The seroprotection rate was higher in patients who had completed more of the scheduled vaccine doses before receiving anti-CD20 therapy. The decline in the seroconversion rate appeared to be relatively specific to anti-CD20 mAbs compared to other monoclonal antibodies like natalizumab.These studies indicate that vaccination should be carefully planned in patients treated with anti-CD20 mAbs. Patients should ideally complete their immunization at least four weeks prior to initiation of rituximab (127) and six weeks prior to initiation of ocrelizumab (67). Live vaccines should not be administrated until treatment cessation and B cell recovery (67). Ocrelizumab-treated patients should also receive inactivated seasonal influenza vaccines (67). The existing recommendations are to administer live attenuated vaccines (e.g., for chickenpox or measles) four weeks prior to the initiation of ofatumumab, and non-live and inactivated vaccines at least two weeks prior to treatment initiation (70).
5.2.1 A focus on SARS-CoV-2 vaccination
Many studies have investigated the cellular and humoral responses following SARS-CoV-2 vaccination in patients with MS. Treatment with anti-CD20 mAbs has been found to significantly reduce spike-specific and receptor-binding domain-specific antibody and memory B cell responses in most patients, and this effect is ameliorated with longer durations from the last treatment and the extent of B cell reconstitution (128). Although most patients showed poor antibody responses to the vaccine, all patients generated robust CD4 and CD8 T cell responses. Consistent with these data, another study reported that patients treated with ocrelizumab had a lower serology response than untreated patients and healthy controls but showed a preserved T cell response to the SARS-CoV-2 vaccine compared with healthy controls (129). Achiron and colleagues also stated that despite a normal absolute lymphocyte count, only 22.7% of treated patients with ocrelizumab developed a humoral IgG response (130). These results were confirmed in a large cohort study of 1339 patients with MS (treated with a disease-modifying therapy or untreated) who received two doses of a SARS-CoV-2 mRNA vaccine (131). Multivariate analysis revealed decreased antibody levels in patients treated with ocrelizumab (231-fold decrease) and rituximab (20-fold decrease) compared with untreated patients. Higher antibody levels were detected when the time to the last administration was longer. A large cohort study (555 patients with MS) characterized the occurrence of immediate relapses following SARS-CoV-2 vaccination (132). The results indicated that the risk of relapse was not changed after the first or the second vaccine doses (median follow-up of 20 days and 38 days). The proportion of patients experiencing acute relapses was similar to that of non-vaccinated patients. Finally, several real-world evidence studies aimed at evaluating vaccine efficacy comparing SARS-CoV-2 infection severity in vaccinated and non-vaccinated patients with MS. An Italian study did not reveal any significant reduction in the hospitalization rate of vaccinated ocrelizumab-treated patients (16.7% post-vaccination vs. 19.4% pre-vaccination) (133). However, results from the Italian CovaXiMS (Covid-19 vaccine in Multiple Sclerosis) study indicated a significant reduction (70%) in the rate of hospitalization after SARS-CoV-2 vaccination, including in patients treated with ocrelizumab (134). This correlated with a small cohort showing that SARS-CoV-2 infections were more severe in non-vaccinated (33.3%) vs. vaccinated patients (25%) (135).
6 Anti-CD20 and pregnancy
Pregnancy poses challenges for the management of MS, which is typically diagnosed between the ages of 20 and 40 years. Historically, clinicians discouraged women with MS from having children, but the PRIMS study challenged this view (136). Indeed, no significant difference in the annualized relapse rate was found when comparing the pregnancy with the pre-pregnancy year. Anti-CD20 mAbs induce prolonged B cell depletion and can cross the placenta from the second trimester. A recent observational study evaluated the risk of disease reactivation during pregnancy and in the post-partum period following rituximab discontinuation (137). The relapse rate remained the same in the post-partum period compared with the pre-pregnancy period in women who suspended rituximab treatment within 6 months before conception. These results suggested that rituximab might exert long-lasting effects on MS disease activity. Disease activity was also analyzed in a cohort of women treated with rituximab or ocrelizumab 12 months before or during pregnancy (138). All women with MS exposed to rituximab/ocrelizumab before the last menstrual period were relapse-free during pregnancy, and 17.2% experienced a relapse post-partum.
Despite counseling strategies, an unplanned pregnancy can occasionally occur during or after anti-CD20 treatment. Several studies have assessed the risk of maternal rituximab exposure for the fetus. The largest study evaluated 231 pregnancies associated with maternal rituximab exposure in lymphoma or autoimmune diseases (139). Of 153 pregnancies with known outcomes (including two patients with MS), nearly 60% resulted in live births, with 24% of preterm neonates and only 2.2% of neonates with congenital malformations. The preterm birth rates in this group were higher than in the general population (10% to 12%), but they were comparable to rates observed in women with chronic conditions (140, 141). One case series evaluated 11 pregnancies in women with MS and neuromyelitis optica spectrum disorder who received rituximab within six months of conception (142). None of the women experienced relapse before conception or during pregnancy, and all children were healthy at birth. However, larger sample size is required to evaluate the safety of rituximab before, and during pregnancy in women with MS. Although these findings are reassuring, the FDA and EMA both recommend that women use contraception during rituximab treatment and avoid pregnancy for 12 months after the last rituximab exposure.
Limited information is available on the use of ocrelizumab during pregnancy. Pregnancy outcomes were reported in women with MS, rheumatoid arthritis and systemic lupus treated with ocrelizumab (20 mg to 2000 mg) (143). A total of 362 pregnancies were reported, including 267 in women with MS. Preliminary outcomes did not suggest an increased risk of adverse pregnancy outcomes, including spontaneous abortions or malformations. Pregnancy outcomes analyzed in a cohort of women treated with rituximab or ocrelizumab 12 months before or during pregnancy indicated that most pregnancies resulted in live births (88.2%) and there were few congenital anomalies (3.2% of live births) (138). Despite exposure six months before the last menstrual period or during pregnancy, most newborns had normal B cell counts. Another large study (1223 pregnancies) reported pregnancy outcomes in women with MS who received ocrelizumab (144). 70.7% of the 604 pregnancies with known outcomes resulted in live births (11% preterm; 1.6% with major congenital malformations). There were 2.2% ectopic pregnancies, 8.9% elective abortions/therapeutic abortions, 17.4% spontaneous abortions, and 0.8% stillbirths. Of the 236 pregnancies with fetal exposure, 72.5% resulted in live births, 0.8% were ectopic pregnancies, 12.7% elective abortions/therapeutic abortions, 12.3% spontaneous abortions, and 1.7% stillbirths. Consistent with previous findings, there is no evidence of an increased risk of congenital anomalies with ocrelizumab. According to current FDA et EMA recommendations, ocrelizumab should be avoided during pregnancy, and women should consider pregnancy 6 to 12 months (US vs. Europe) after the last infusion. This delay could be reduced to 2 to 3 months for women with active disease as monoclonal antibodies do not cross the placental barrier during the first trimester (145).
Data on the use of ofatumumab during pregnancy are also limited. According to animal studies, ofatumumab can cross the placental barrier and cause the depletion of B cells in the fetus (70). In the ALITHIOS trial, fourteen pregnancies were reported in patients exposed to ofatumumab during the first trimester. Of these pregnancies, three resulted in live birth; all were full-term deliveries with no birth defects, congenital anomalies, or serious infections for the newborns. Four pregnancies were ongoing at the data collection cut-off, and six resulted in early termination (95). Long-term safety data are awaited to confirm these reassuring data.
IgGs are large molecules with low expected breast milk transfer after the colostrum phase. Rituximab concentration was evaluated in mature breast milk from women who received 500 mg or 1 000 mg IV rituximab while breastfeeding. Results indicated that the relative infant dose was 0.08%, well below acceptable levels of 10% (146). Another small-size study confirmed that rituximab concentrations in breast milk and infant’s serum were low, suggesting a minimal transfer to the milk and no absorption of rituximab by breastfed infants (147). There is no published data on the potential effect of ocrelizumab, ofatumumab, and ublituximab in nursing mothers. The available data suggest that treatment with anti-CD20 mAbs during lactation might be safe for breastfed infants, yet it is not generally recommended by clinicians.
7 Conclusion
Anti-CD20 mAbs have emerged as an essential treatment option for patients with relapsing MS. Clinicians must be aware that anti-CD20 mAbs differ in their structures, target epitopes, dosing regimens, route of administration, and mechanisms of B cell depletion. All four antibodies have proven efficacious in controlling disease activity and disability progression. Long-term safety data from extended trials and real-life studies are starting to emerge, and it will be interesting to see how long-term B cell depletion affects Ig levels and infection risk. Furthermore, it would be worthwhile to understand whether anti-CD20 mAbs could be used as induction therapy before switching to a less potent immunosuppressive drug. Similarly, sequential therapy or spacing interval (for example, one year for IV administered anti-CD20 or every two months for SC injections) should be evaluated, in particular in stabilized patients.
Author’s note
Authors had full control of the content and made the final decision for all aspects of this article.
Author contributions
All authors conceptualized, reviewed and edited the manuscript for intellectual content. All authors contributed to the article and approved the submitted version.
Funding
Novartis sponsored this expert’s review. The funder was not involved in the study design, collection, analysis, interpretation of data, the writing of this article, or the decision to submit it for publication.
Acknowledgments
Financial support for medical writing assistance was provided by Novartis Pharma SAS. We thank Amelie Griveau, IPG Health Paris, for her medical editorial assistance with this manuscript.
Conflict of interest
JS has received fees for serving on scientific advisory boards andconsulting, and research support from Novartis and Roche. EM has received research support from Fondation ARSEP and Biogen Idec, travel funding and/or consulting fees from Alexion, Biogen Idec, BMS, Merck, Novartis, Roche, Sanofi-Genzyme and Teva. AG has received personal compensation for consulting, lecturing and congress participation from Novartis, Alexon, AEI/Roche andNovartis. DL has received fees for board membership and consultancy and grants from Alexion, Actelion, BMS, Biogen,Merck, Novartis, Roche, Sanofi and Teva. LM has received consulting fees from Biogen, Novartis Pharma, Teva, BMS, Roche,Sanofi-Genzyme and Janssen Cilag. ET has received honoraria, travel grants, or research grants from the following pharmaceutical companies: Actelion, Biogen, Bristol Myers Squibb/Celgene, Merck, Novartis, Roche, Teva. HZ has received personal fees from Novartisrelated to this work and consulting fees from Biogen, Roche,Alexion, Roche, BMS, Novartis and Merck, unrelated to this work. DB has received personal compensation for consulting,serving on a scientific advisory board, speaking, or other activities with Biogen, Novartis, Merck, Sanofi-Genzyme, Roche, Celgene-BMS and Alexion. RL has received consultancy and speaker honoraria from Biogen, Sanofi-Genzyme, Merck-Serono,Novartis, Orion and GSK, and research grants from GSK, Population Bio and Roche.
The remaining author declares that the research was conducted in the absence of any commercial or financial relationships that could be construed as a potential conflict of interest.
Publisher’s note
All claims expressed in this article are solely those of the authors and do not necessarily represent those of their affiliated organizations, or those of the publisher, the editors and the reviewers. Any product that may be evaluated in this article, or claim that may be made by its manufacturer, is not guaranteed or endorsed by the publisher.
References
1. Lublin FD, Reingold SC, Cohen JA, Cutter GR, Sorensen PS, Thompson AJ, et al. Defining the clinical course of multiple sclerosis: The 2013 revisions. Neurology (2014) 83(3):278–86. doi: 10.1212/WNL.0000000000000560
2. Montalban X, Gold R, Thompson AJ, Otero-Romero S, Amato MP, Chandraratna D, et al. ECTRIMS/EAN guideline on the pharmacological treatment of people with multiple sclerosis. Mult Scler (2018) 24(2):96–120. doi: 10.1177/1352458517751049
3. Arneth BM. Impact of B cells to the pathophysiology of multiple sclerosis. J Neuroinflamm (2019) 16(1):128. doi: 10.1186/s12974-019-1517-1
4. Hauser SL, Bar-Or A, Comi G, Giovannoni G, Hartung HP, Hemmer B, et al. Ocrelizumab versus interferon beta-1a in relapsing multiple sclerosis. N Engl J Med (2017) 376(3):221–34. doi: 10.1056/NEJMoa1601277
5. Montalban X, Hauser SL, Kappos L, Arnold DL, Bar-Or A, Comi G, et al. Ocrelizumab versus placebo in primary progressive multiple sclerosis. N Engl J Med (2017) 376(3):209–20. doi: 10.1056/NEJMoa1606468
6. Hauser SL, Bar-Or A, Cohen JA, Comi G, Correale J, Coyle PK, et al. Ofatumumab versus teriflunomide in multiple sclerosis. N Engl J Med (2020) 383(6):546–57. doi: 10.1056/NEJMoa1917246
7. Steinman L, Fox E, Hartung HP, Alvarez E, Qian P, Wray S, et al. Ublituximab versus teriflunomide in relapsing multiple sclerosis. N Engl J Med (2022) 387(8):704–14. doi: 10.1056/NEJMoa2201904
8. Lucchinetti C, Bruck W, Parisi J, Scheithauer B, Rodriguez M, Lassmann H. Heterogeneity of multiple sclerosis lesions: Implications for the pathogenesis of demyelination. Ann Neurol (2000) 47(6):707–17. doi: 10.1002/1531-8249(200006)47:6<707::aid-ana3>3.0.co;2-q
9. van Nierop GP, van Luijn MM, Michels SS, Melief MJ, Janssen M, Langerak AW, et al. Phenotypic and functional characterization of T cells in white matter lesions of multiple sclerosis patients. Acta Neuropathol (2017) 134(3):383–401. doi: 10.1007/s00401-017-1744-4
10. Fransen NL, Hsiao CC, van der Poel M, Engelenburg HJ, Verdaasdonk K, Vincenten MCJ, et al. Tissue-resident memory T cells invade the brain parenchyma in multiple sclerosis white matter lesions. Brain (2020) 143(6):1714–30. doi: 10.1093/brain/awaa117
11. Machado-Santos J, Saji E, Troscher AR, Paunovic M, Liblau R, Gabriely G, et al. The compartmentalized inflammatory response in the multiple sclerosis brain is composed of tissue-resident CD8+ T lymphocytes and B cells. Brain (2018) 141(7):2066–82. doi: 10.1093/brain/awy151
12. Beltran E, Gerdes LA, Hansen J, Flierl-Hecht A, Krebs S, Blum H, et al. Early adaptive immune activation detected in monozygotic twins with prodromal multiple sclerosis. J Clin Invest (2019) 129(11):4758–68. doi: 10.1172/JCI128475
13. Pappalardo JL, Zhang L, Pecsok MK, Perlman K, Zografou C, Raddassi K, et al. Transcriptomic and clonal characterization of T cells in the human central nervous system. Sci Immunol (2020) 5(51):eabb8786. doi: 10.1126/sciimmunol.abb8786
14. Cao Y, Goods BA, Raddassi K, Nepom GT, Kwok WW, Love JC, et al. Functional inflammatory profiles distinguish myelin-reactive T cells from patients with multiple sclerosis. Sci Transl Med (2015) 7(287):287ra74. doi: 10.1126/scitranslmed.aaa8038
15. Ingelfinger F, Gerdes LA, Kavaka V, Krishnarajah S, Friebel E, Galli E, et al. Twin study reveals non-heritable immune perturbations in multiple sclerosis. Nature (2022) 603(7899):152–8. doi: 10.1038/s41586-022-04419-4
16. van Langelaar J, van der Vuurst de Vries RM, Janssen M, Wierenga-Wolf AF, Spilt IM, Siepman TA, et al. T helper 17.1 cells associate with multiple sclerosis disease activity: Perspectives for early intervention. Brain (2018) 141(5):1334–49. doi: 10.1093/brain/awy069
17. Frischer JM, Bramow S, Dal-Bianco A, Lucchinetti CF, Rauschka H, Schmidbauer M, et al. The relation between inflammation and neurodegeneration in multiple sclerosis brains. Brain (2009) 132(Pt 5):1175–89. doi: 10.1093/brain/awp070
18. Haider L, Zrzavy T, Hametner S, Hoftberger R, Bagnato F, Grabner G, et al. The topograpy of demyelination and neurodegeneration in the multiple sclerosis brain. Brain (2016) 139(Pt 3):807–15. doi: 10.1093/brain/awv398
19. Hsiao CC, Fransen NL, van den Bosch AMR, Brandwijk KIM, Huitinga I, Hamann J, et al. White matter lesions in multiple sclerosis are enriched for CD20(Dim) CD8+ tissue-resident memory T cells. Eur J Immunol (2021) 51(2):483–6. doi: 10.1002/eji.202048665
20. Frischer JM, Weigand SD, Guo Y, Kale N, Parisi JE, Pirko I, et al. Clinical and pathological insights into the dynamic nature of the white matter multiple sclerosis plaque. Ann Neurol (2015) 78(5):710–21. doi: 10.1002/ana.24497
21. Magliozzi R, Howell O, Vora A, Serafini B, Nicholas R, Puopolo M, et al. Meningeal B-cell follicles in secondary progressive multiple sclerosis associate with early onset of disease and severe cortical pathology. Brain (2007) 130(Pt 4):1089–104. doi: 10.1093/brain/awm038
22. Magliozzi R, Howell OW, Reeves C, Roncaroli F, Nicholas R, Serafini B, et al. A gradient of neuronal loss and meningeal inflammation in multiple sclerosis. Ann Neurol (2010) 68(4):477–93. doi: 10.1002/ana.22230
23. Choi SR, Howell OW, Carassiti D, Magliozzi R, Gveric D, Muraro PA, et al. Meningeal inflammation plays a role in the pathology of primary progressive multiple sclerosis. Brain (2012) 135(Pt 10):2925–37. doi: 10.1093/brain/aws189
24. Howell OW, Reeves CA, Nicholas R, Carassiti D, Radotra B, Gentleman SM, et al. Meningeal inflammation is widespread and linked to cortical pathology in multiple sclerosis. Brain (2011) 134(Pt 9):2755–71. doi: 10.1093/brain/awr182
25. Zhan J, Kipp M, Han W, Kaddatz H. Ectopic lymphoid follicles in progressive multiple sclerosis: From patients to animal models. Immunology (2021) 164(3):450–66. doi: 10.1111/imm.13395
26. Lanz TV, Brewer RC, Ho PP, Moon JS, Jude KM, Fernandez D, et al. Clonally expanded B cells in multiple sclerosis bind EBV EBNA1 and GlialCAM. Nature (2022) 603(7900):321–7. doi: 10.1038/s41586-022-04432-7
27. von Budingen HC, Kuo TC, Sirota M, van Belle CJ, Apeltsin L, Glanville J, et al. B cell exchange across the blood-brain barrier in multiple sclerosis. J Clin Invest (2012) 122(12):4533–43. doi: 10.1172/JCI63842
28. Bar-Or A, Pender MP, Khanna R, Steinman L, Hartung HP, Maniar T, et al. Epstein-Barr Virus in multiple sclerosis: Theory and emerging immunotherapies. Trends Mol Med (2020) 26(3):296–310. doi: 10.1016/j.molmed.2019.11.003
29. Serafini B, Rosicarelli B, Franciotta D, Magliozzi R, Reynolds R, Cinque P, et al. Dysregulated Epstein-Barr virus infection in the multiple sclerosis brain. J Exp Med (2007) 204(12):2899–912. doi: 10.1084/jem.20071030
30. Ramesh A, Schubert RD, Greenfield AL, Dandekar R, Loudermilk R, Sabatino JJ Jr, et al. A pathogenic and clonally expanded B cell transcriptome in active multiple sclerosis. Proc Natl Acad Sci USA (2020) 117(37):22932–43. doi: 10.1073/pnas.2008523117
31. Angelini DF, Serafini B, Piras E, Severa M, Coccia EM, Rosicarelli B, et al. Increased CD8+ T cell response to Epstein-Barr virus lytic antigens in the active phase of multiple sclerosis. PloS Pathog (2013) 9(4):e1003220. doi: 10.1371/journal.ppat.1003220
32. Schneider-Hohendorf T, Gerdes LA, Pignolet B, Gittelman R, Ostkamp P, Rubelt F, et al. Broader Epstein-Barr virus-specific T cell receptor repertoire in patients with multiple sclerosis. J Exp Med (2022) 219(11):e20220650. doi: 10.1084/jem.20220650
33. Lunemann JD, Tintore M, Messmer B, Strowig T, Rovira A, Perkal H, et al. Elevated Epstein-Barr virus-encoded nuclear antigen-1 immune responses predict conversion to multiple sclerosis. Ann Neurol (2010) 67(2):159–69. doi: 10.1002/ana.21886
34. Yea C, Tellier R, Chong P, Westmacott G, Marrie RA, Bar-Or A, et al. Epstein-Barr Virus in oral shedding of children with multiple sclerosis. Neurology (2013) 81(16):1392–9. doi: 10.1212/WNL.0b013e3182a841e4
35. Bjornevik K, Cortese M, Healy BC, Kuhle J, Mina MJ, Leng Y, et al. Longitudinal analysis reveals high prevalence of Epstein-Barr virus associated with multiple sclerosis. Science (2022) 375(6578):296–301. doi: 10.1126/science.abj8222
36. Baecher-Allan C, Kaskow BJ, Weiner HL. Multiple sclerosis: Mechanisms and immunotherapy. Neuron (2018) 97(4):742–68. doi: 10.1016/j.neuron.2018.01.021
37. El Behi M, Sanson C, Bachelin C, Guillot-Noel L, Fransson J, Stankoff B, et al. Adaptive human immunity drives remyelination in a mouse model of demyelination. Brain (2017) 140(4):967–80. doi: 10.1093/brain/awx008
38. Crickx E, Weill JC, Reynaud CA, Mahevas M. Anti-CD20-Mediated B-cell depletion in autoimmune diseases: Successes, failures and future perspectives. Kidney Int (2020) 97(5):885–93. doi: 10.1016/j.kint.2019.12.025
39. Dalakas MC. Invited article: Inhibition of B cell functions: Implications for neurology. Neurology (2008) 70(23):2252–60. doi: 10.1212/01.wnl.0000313840.27060.bf
40. van Langelaar J, Rijvers L, Smolders J, van Luijn MM. B and T cells driving multiple sclerosis: Identity, mechanisms and potential triggers. Front Immunol (2020) 11:760. doi: 10.3389/fimmu.2020.00760
41. Bubien JK, Zhou LJ, Bell PD, Frizzell RA, Tedder TF. Transfection of the CD20 cell surface molecule into ectopic cell types generates a Ca2+ conductance found constitutively in B lymphocytes. J Cell Biol (1993) 121(5):1121–32. doi: 10.1083/jcb.121.5.1121
42. Kuijpers TW, Bende RJ, Baars PA, Grummels A, Derks IA, Dolman KM, et al. CD20 deficiency in humans results in impaired T cell-independent antibody responses. J Clin Invest (2010) 120(1):214–22. doi: 10.1172/JCI40231
43. Walshe CA, Beers SA, French RR, Chan CH, Johnson PW, Packham GK, et al. Induction of cytosolic calcium flux by CD20 is dependent upon B cell antigen receptor signaling. J Biol Chem (2008) 283(25):16971–84. doi: 10.1074/jbc.M708459200
44. Rouge L, Chiang N, Steffek M, Kugel C, Croll TI, Tam C, et al. Structure of CD20 in complex with the therapeutic monoclonal antibody rituximab. Science (2020) 367(6483):1224–30. doi: 10.1126/science.aaz9356
45. Klein C, Lammens A, Schafer W, Georges G, Schwaiger M, Mossner E, et al. Epitope interactions of monoclonal antibodies targeting CD20 and their relationship to functional properties. MAbs (2013) 5(1):22–33. doi: 10.4161/mabs.22771
46. Fox E, Lovett-Racke AE, Gormley M, Liu Y, Petracca M, Cocozza S, et al. A phase 2 multicenter study of ublituximab, a novel glycoengineered anti-CD20 monoclonal antibody, in patients with relapsing forms of multiple sclerosis. Mult Scler (2021) 27(3):420–9. doi: 10.1177/1352458520918375
47. Babiker HM, Glode AE, Cooke LS, Mahadevan D. Ublituximab for the treatment of CD20 positive B-cell malignancies. Expert Opin Investig Drugs (2018) 27(4):407–12. doi: 10.1080/13543784.2018.1459560
48. Harding FA, Stickler MM, Razo J, DuBridge RB. The immunogenicity of humanized and fully human antibodies: Residual immunogenicity resides in the CDR regions. MAbs (2010) 2(3):256–65. doi: 10.4161/mabs.2.3.11641
49. Schuh E, Berer K, Mulazzani M, Feil K, Meinl I, Lahm H, et al. Features of human CD3+CD20+ T cells. J Immunol (2016) 197(4):1111–7. doi: 10.4049/jimmunol.1600089
50. von Essen MR, Ammitzboll C, Hansen RH, Petersen ERS, McWilliam O, Marquart HV, et al. Proinflammatory CD20+ T cells in the pathogenesis of multiple sclerosis. Brain (2019) 142(1):120–32. doi: 10.1093/brain/awy301
51. Boross P, Leusen JH. Mechanisms of action of CD20 antibodies. Am J Cancer Res (2012) 2(6):676–90.
52. Cotchett KR, Dittel BN, Obeidat AZ. Comparison of the efficacy and safety of anti-CD20 B cells depleting drugs in multiple sclerosis. Mult Scler Relat Disord (2021) 49:102787. doi: 10.1016/j.msard.2021.102787
53. Craigen JL, Mackus WJM, Engleberts P, Miller SR, Speller S, Chamberlain LC, et al. Ofatumumab, a human mAb targeting a membrane-proximal small-loop epitope on CD20, induces potent NK cell-mediated ADCC. Blood (2009) 114(22):1725. doi: 10.1182/blood.v114.22.1725.1725
54. Oflazoglu E, Audoly LP. Evolution of anti-CD20 monoclonal antibody therapeutics in oncology. MAbs (2010) 2(1):14–9. doi: 10.4161/mabs.2.1.10789
55. Du J, Yang H, Guo Y, Ding J. Structure of the Fab fragment of therapeutic antibody ofatumumab provides insights into the recognition mechanism with CD20. Mol Immunol (2009) 46(11-12):2419–23. doi: 10.1016/j.molimm.2009.04.009
56. Teeling JL, Mackus WJ, Wiegman LJ, van den Brakel JH, Beers SA, French RR, et al. The biological activity of human CD20 monoclonal antibodies is linked to unique epitopes on CD20. J Immunol (2006) 177(1):362–71. doi: 10.4049/jimmunol.177.1.362
57. Touil I, Perrot C, Elain G, Weckbecker G. Ofatumumab and ocrelizumab differentially induce human primary B cell lysis by complement dependent cytotoxicity. Mult Scler J (2019) 25(1 Suppl):157–65. doi: 10.1177/1352458519843084
58. Morschhauser F, Marlton P, Vitolo U, Linden O, Seymour JF, Crump M, et al. Results of a phase I/II study of ocrelizumab, a fully humanized anti-CD20 mAb, in patients with relapsed/refractory follicular lymphoma. Ann Oncol (2010) 21(9):1870–6. doi: 10.1093/annonc/mdq027
59. Le Garff-Tavernier M, Herbi L, de Romeuf C, Nguyen-Khac F, Davi F, Grelier A, et al. Antibody-dependent cellular cytotoxicity of the optimized anti-CD20 monoclonal antibody ublituximab on chronic lymphocytic leukemia cells with the 17p deletion. Leukemia (2014) 28(1):230–3. doi: 10.1038/leu.2013.240
60. Gelfand JM, Cree BAC, Hauser SL. Ocrelizumab and other CD20+ B-cell-Depleting therapies in multiple sclerosis. Neurotherapeutics (2017) 14(4):835–41. doi: 10.1007/s13311-017-0557-4
61. Richter WF, Jacobsen B. Subcutaneous absorption of biotherapeutics: Knowns and unknowns. Drug Metab Dispos (2014) 42(11):1881–9. doi: 10.1124/dmd.114.059238
62. Cataldi M, Vigliotti C, Mosca T, Cammarota M, Capone D. Emerging role of the spleen in the pharmacokinetics of monoclonal antibodies, nanoparticles and exosomes. Int J Mol Sci (2017) 18(6):1249. doi: 10.3390/ijms18061249
63. Hauser SL, Waubant E, Arnold DL, Vollmer T, Antel J, Fox RJ, et al. B-cell depletion with rituximab in relapsing-remitting multiple sclerosis. N Engl J Med (2008) 358(7):676–88. doi: 10.1056/NEJMoa0706383
64. Hawker K, O'Connor P, Freedman MS, Calabresi PA, Antel J, Simon J, et al. Rituximab in patients with primary progressive multiple sclerosis: Results of a randomized double-blind placebo-controlled multicenter trial. Ann Neurol (2009) 66(4):460–71. doi: 10.1002/ana.21867
65. Svenningsson A, Frisell T, Burman J, Salzer J, Fink K, Hallberg S, et al. Safety and efficacy of rituximab versus dimethyl fumarate in patients with relapsing-remitting multiple sclerosis or clinically isolated syndrome in Sweden: A rater-blinded, phase 3, randomised controlled trial. Lancet Neurol (2022) 21(8):693–703. doi: 10.1016/S1474-4422(22)00209-5
66. Wolinsky JS, Arnold DL, Brochet B, Hartung HP, Montalban X, Naismith RT, et al. Long-term follow-up from the ORATORIO trial of ocrelizumab for primary progressive multiple sclerosis: A post-hoc analysis from the ongoing open-label extension of the randomised, placebo-controlled, phase 3 trial. Lancet Neurol (2020) 19(12):998–1009. doi: 10.1016/S1474-4422(20)30342-2
67. Ocrevus® (Ocrelizumab) (2021). Available at: https://www.gene.com/download/pdf/ocrevus_prescribing.pdf (Accessed 23 May 2022).
68. Bar-Or A, Grove RA, Austin DJ, Tolson JM, VanMeter SA, Lewis EW, et al. Subcutaneous ofatumumab in patients with relapsing-remitting multiple sclerosis: The MIRROR study. Neurology (2018) 90(20):e1805–e14. doi: 10.1212/WNL.0000000000005516
69. Yu H, Graham G, David OJ, Kahn JM, Savelieva M, Pigeolet E, et al. Population pharmacokinetic-B cell modeling for ofatumumab in patients with relapsing multiple sclerosis. CNS Drugs (2022) 36(3):283–300. doi: 10.1007/s40263-021-00895-w
70. Kesimpta® (Ofatumumab) (2020). Available at: https://www.novartis.us/sites/www.novartis.us/files/kesimpta.pdf (Accessed 23 May 2022).
71. Lovett-Racke AE, Gormley M, Liu Y, Yang Y, Graham C, Wray S, et al. B cell depletion with ublituximab reshapes the T cell profile in multiple sclerosis patients. J Neuroimmunol (2019) 332:187–97. doi: 10.1016/j.jneuroim.2019.04.017
72. Cross AH, Stark JL, Lauber J, Ramsbottom MJ, Lyons JA. Rituximab reduces B cells and T cells in cerebrospinal fluid of multiple sclerosis patients. J Neuroimmunol (2006) 180(1-2):63–70. doi: 10.1016/j.jneuroim.2006.06.029
73. Bonnan M, Ferrari S, Bertandeau E, Demasles S, Krim E, Miquel M, et al. Intrathecal rituximab therapy in multiple sclerosis: Review of evidence supporting the need for future trials. Curr Drug Targets (2014) 15(13):1205–14. doi: 10.2174/1389450115666141029234644
74. Bar-Or A, Gelfand JM, Fiore D, Harp CT, Ma X, Herman A, et al. Interim analysis of the OBOE (Ocrelizumab Biomarker Outcome Evaluation) study in multiple sclerosis (MS) (S24.002). Neurology (2018) 90. doi: 10.1016/j.cell.2018.11.035
75. Stuve O, Cepok S, Elias B, Saleh A, Hartung HP, Hemmer B, et al. Clinical stabilization and effective B-lymphocyte depletion in the cerebrospinal fluid and peripheral blood of a patient with fulminant relapsing-remitting multiple sclerosis. Arch Neurol (2005) 62(10):1620–3. doi: 10.1001/archneur.62.10.1620
76. Hausler D, Hausser-Kinzel S, Feldmann L, Torke S, Lepennetier G, Bernard CCA, et al. Functional characterization of reappearing B cells after anti-CD20 treatment of CNS autoimmune disease. Proc Natl Acad Sci USA (2018) 115(39):9773–8. doi: 10.1073/pnas.1810470115
77. Theil D, Smith P, Huck C, Gilbart Y, Kakarieka A, Leppert D, et al. Imaging mass cytometry and single-cell genomics reveal differential depletion and repletion of B-cell populations following ofatumumab treatment in cynomolgus monkeys. Front Immunol (2019) 10:1340. doi: 10.3389/fimmu.2019.01340
78. Rojas OL, Probstel AK, Porfilio EA, Wang AA, Charabati M, Sun T, et al. Recirculating intestinal IgA-producing cells regulate neuroinflammation via IL-10. Cell (2019) 176(3):610–24.e18. doi: 10.1016/j.cell.2018.11.035
79. Nissimov N, Hajiyeva Z, Torke S, Grondey K, Bruck W, Hausser-Kinzel S, et al. B cells reappear less mature and more activated after their anti-CD20-Mediated depletion in multiple sclerosis. Proc Natl Acad Sci USA (2020) 117(41):25690–9. doi: 10.1073/pnas.2012249117
80. Lavie F, Miceli-Richard C, Ittah M, Sellam J, Gottenberg JE, Mariette X. Increase of B cell-activating factor of the TNF family (BAFF) after rituximab treatment: Insights into a new regulating system of BAFF production. Ann Rheum Dis (2007) 66(5):700–3. doi: 10.1136/ard.2006.060772
81. Steri M, Orru V, Idda ML, Pitzalis M, Pala M, Zara I, et al. Overexpression of the cytokine BAFF and autoimmunity risk. N Engl J Med (2017) 376(17):1615–26. doi: 10.1056/NEJMoa1610528
82. Bar-Or A, Fawaz L, Fan B, Darlington PJ, Rieger A, Ghorayeb C, et al. Abnormal B-cell cytokine responses a trigger of T-Cell-Mediated disease in MS? Ann Neurol (2010) 67(4):452–61. doi: 10.1002/ana.21939
83. Jelcic I, Al Nimer F, Wang J, Lentsch V, Planas R, Jelcic I, et al. Memory B cells activate brain-homing, autoreactive CD4+ T cells in multiple sclerosis. Cell (2018) 175(1):85–100.e23. doi: 10.1016/j.cell.2018.08.011
84. Sabatino JJ Jr, Wilson MR, Calabresi PA, Hauser SL, Schneck JP, Zamvil SS. Anti-CD20 therapy depletes activated myelin-specific CD8+ T cells in multiple sclerosis. Proc Natl Acad Sci USA (2019) 116(51):25800–7. doi: 10.1073/pnas.1915309116
85. von Essen MR, Hansen RH, Hojgaard C, Ammitzboll C, Wiendl H, Sellebjerg F. Ofatumumab modulates inflammatory T cell responses and migratory potential in patients with multiple sclerosis. Neurol Neuroimmunol Neuroinflamm (2022) 9(4):e200004. doi: 10.1212/NXI.0000000000200004
86. Wiendl H, Fox E, Goodyear A, Ludwig I, Bagger M, Kropshofer H, et al. Effect of subcutaneous ofatumumab on lymphocyte subsets in patients with RMS: Analysis from the APLIOS study. Eur J Neurol (2020) 27:1301. doi: 10.1016/S0140-6736(11)61649-8
87. Quendt C, Ochs J, Hausser-Kinzel S, Hausler D, Weber MS. Proinflammatory CD20+ T cells are differentially affected by multiple sclerosis therapeutics. Ann Neurol (2021) 90(5):834–9. doi: 10.1002/ana.26216
88. Palanichamy A, Jahn S, Nickles D, Derstine M, Abounasr A, Hauser SL, et al. Rituximab efficiently depletes increased CD20-expressing T cells in multiple sclerosis patients. J Immunol (2014) 193(2):580–6. doi: 10.4049/jimmunol.1400118
89. Gingele S, Jacobus TL, Konen FF, Hummert MW, Suhs KW, Schwenkenbecher P, et al. Ocrelizumab depletes CD20+ T cells in multiple sclerosis patients. Cells (2018) 8(1):12. doi: 10.3390/cells8010012
90. Granqvist M, Boremalm M, Poorghobad A, Svenningsson A, Salzer J, Frisell T, et al. Comparative effectiveness of rituximab and other initial treatment choices for multiple sclerosis. JAMA Neurol (2018) 75(3):320–7. doi: 10.1001/jamaneurol.2017.4011
91. Naegelin Y, Naegelin P, von Felten S, Lorscheider J, Sonder J, Uitdehaag BMJ, et al. Association of rituximab treatment with disability progression among patients with secondary progressive multiple sclerosis. JAMA Neurol (2019) 76(3):274–81. doi: 10.1001/jamaneurol.2018.4239
92. Kappos L, Li D, Calabresi PA, O'Connor P, Bar-Or A, Barkhof F, et al. Ocrelizumab in relapsing-remitting multiple sclerosis: A phase 2, randomised, placebo-controlled, multicentre trial. Lancet (2011) 378(9805):1779–87. doi: 10.1016/S0140-6736(11)61649-8
93. Hauser SL, Kappos L, Arnold DL, Bar-Or A, Brochet B, Naismith RT, et al. Five years of ocrelizumab in relapsing multiple sclerosis: OPERA studies open-label extension. Neurology (2020) 95(13):e1854–e67. doi: 10.1212/WNL.0000000000010376
94. Sorensen PS, Lisby S, Grove R, Derosier F, Shackelford S, Havrdova E, et al. Safety and efficacy of ofatumumab in relapsing-remitting multiple sclerosis: A phase 2 study. Neurology (2014) 82(7):573–81. doi: 10.1212/WNL.0000000000000125
95. Hauser SL, Cross AH, Winthrop K, Wiendl H, Nicholas J, Meuth SG, et al. Safety experience with continued exposure to ofatumumab in patients with relapsing forms of multiple sclerosis for up to 3.5 years. Mult Scler (2022) 28(10):1576–90. doi: 10.1177/13524585221079731
96. de Seze J, Bar-Or A, Correale J, Cross AH, Kappos L, Selmaj K, et al. Effect of ofatumumab on serum immunoglobulin levels and infection risk in relapsing multiple sclerosis patients from the phase 3 ASCLEPIOS I and II trials. Eur J Neurol (2020) 27:1295–6.
97. Hauser SL, Gold R, Cutter GR, Schneble H, Whitley L, Jessop N. COVID-19 risk factors in people with multiple sclerosis treated with ocrelizumab. Eur J Neurol (2021) 18:950–8.
98. Louapre C, Collongues N, Stankoff B, Giannesini C, Papeix C, Bensa C, et al. Clinical characteristics and outcomes in patients with coronavirus disease 2019 and multiple sclerosis. JAMA Neurol (2020) 77(9):1079–88. doi: 10.1001/jamaneurol.2020.2581
99. Sormani MP, De Rossi N, Schiavetti I, Carmisciano L, Cordioli C, Moiola L, et al. Disease-modifying therapies and coronavirus disease 2019 severity in multiple sclerosis. Ann Neurol (2021) 89(4):780–9. doi: 10.1002/ana.26028
100. Zabalza A, Cardenas-Robledo S, Tagliani P, Arrambide G, Otero-Romero S, Carbonell-Mirabent P, et al. COVID-19 in multiple sclerosis patients: Susceptibility, severity risk factors and serological response. Eur J Neurol (2021) 28(10):3384–95. doi: 10.1111/ene.14690
101. Cross AH, Delgado S, Habek M, Davydovskaya M, Ward BJ, Cree BAC, et al. COVID-19 outcomes and vaccination in people with relapsing multiple sclerosis treated with ofatumumab. Neurol Ther (2022) 11(2):741–58. doi: 10.1007/s40120-022-00341-z
102. Genentech. Ocrelizumab & pml (2020). Available at: https://www.ocrelizumabinfo.com/.
103. Patel A, Sul J, Gordon ML, Steinklein J, Sanguinetti S, Pramanik B, et al. Progressive multifocal leukoencephalopathy in a patient with progressive multiple sclerosis treated with ocrelizumab monotherapy. JAMA Neurol (2021) 78(6):736–40. doi: 10.1001/jamaneurol.2021.0627
104. Alping P, Askling J, Burman J, Fink K, Fogdell-Hahn A, Gunnarsson M, et al. Cancer risk for fingolimod, natalizumab, and rituximab in multiple sclerosis patients. Ann Neurol (2020) 87(5):688–99. doi: 10.1002/ana.25701
105. Emery P, Furst DE, Kirchner P, Melega S, Lacey S, Lehane PB. Risk of malignancies in patients with rheumatoid arthritis treated with rituximab: Analyses of global postmarketing safety data and long-term clinical trial data. Rheumatol Ther (2020) 7(1):121–31. doi: 10.1007/s40744-019-00183-6
106. van Vollenhoven RF, Fleischmann RM, Furst DE, Lacey S, Lehane PB. Longterm safety of rituximab: Final report of the rheumatoid arthritis global clinical trial program over 11 years. J Rheumatol (2015) 42(10):1761–6. doi: 10.3899/jrheum.150051
107. Biotti D, Lerebours F, Bonneville F, Ciron J, Clanet M, Brassat D. Late-onset neutropenia and neurological relapse, during long-term rituximab therapy in myelin oligodendrocyte glycoprotein-antibody spectrum disorder. Mult Scler (2018) 24(12):1645–7. doi: 10.1177/1352458518765677
108. Plate A, Havla J, Kumpfel T. Late-onset neutropenia during long-term rituximab therapy in neuromyelitis optica. Mult Scler Relat Disord (2014) 3(2):269–72. doi: 10.1016/j.msard.2013.08.001
109. Rigal J, Ciron J, Lepine Z, Biotti D. Late-onset neutropenia after rituximab therapy for multiple sclerosis, neuromyelitis optica spectrum disorders and MOG-Antibody-Associated diseases. Mult Scler Relat Disord (2020) 41:102019. doi: 10.1016/j.msard.2020.102019
110. Salmon JH, Cacoub P, Combe B, Sibilia J, Pallot-Prades B, Fain O, et al. Late-onset neutropenia after treatment with rituximab for rheumatoid arthritis and other autoimmune diseases: Data from the autoimmunity and rituximab registry. RMD Open (2015) 1(1):e000034. doi: 10.1136/rmdopen-2014-000034
111. Wolach O, Bairey O, Lahav M. Late-onset neutropenia after rituximab treatment: Case series and comprehensive review of the literature. Med (Baltimore) (2010) 89(5):308–18. doi: 10.1097/MD.0b013e3181f2caef
112. Zonozi R, Wallace ZS, Laliberte K, Huizenga NR, Rosenthal JM, Rhee EP, et al. Incidence, clinical features, and outcomes of late-onset neutropenia from rituximab for autoimmune disease. Arthritis Rheumatol (2021) 73(2):347–54. doi: 10.1002/art.41501
113. Auer M, Bsteh G, Hegen H, Wurth S, Zinganell A, Berger T, et al. Late-onset neutropenia in a multiple sclerosis patient after first dose ocrelizumab switched from rituximab. Mult Scler Relat Disord (2020) 43:102155. doi: 10.1016/j.msard.2020.102155
114. Cohen BA. Late-onset neutropenia following ocrelizumab therapy for multiple sclerosis. Neurology (2019) 92(9):435–6. doi: 10.1212/WNL.0000000000006924
115. Zanetta C, Robotti M, Nozzolillo A, Sangalli F, Liberatore G, Nobile-Orazio E, et al. Late onset absolute neutropenia associated with ocrelizumab treatment in multiple sclerosis: A case report and review of the literature. J Neurol Sci (2020) 409:116603. doi: 10.1016/j.jns.2019.116603
116. Abdulkader R, Dharmapalaiah C, Rose G, Shand LM, Clunie GP, Watts RA. Late-onset neutropenia in patients with rheumatoid arthritis after treatment with rituximab. J Rheumatol (2014) 41(5):858–61. doi: 10.3899/jrheum.130526
117. Breuer GS, Ehrenfeld M, Rosner I, Balbir-Gurman A, Zisman D, Oren S, et al. Late-onset neutropenia following rituximab treatment for rheumatologic conditions. Clin Rheumatol (2014) 33(9):1337–40. doi: 10.1007/s10067-014-2562-x
118. Monaco WE, Jones JD, Rigby WF. Rituximab associated late-onset neutropenia—a rheumatology case series and review of the literature. Clin Rheumatol (2016) 35(10):2457–62. doi: 10.1007/s10067-016-3313-y
119. Tesfa D, Palmblad J. Late-onset neutropenia following rituximab therapy: Incidence, clinical features and possible mechanisms. Expert Rev Hematol (2011) 4(6):619–25. doi: 10.1586/EHM.11.62
120. Bingham CO 3rd, Looney RJ, Deodhar A, Halsey N, Greenwald M. Codding C, et al. immunization responses in rheumatoid arthritis patients treated with rituximab: Results from a controlled clinical trial. Arthritis Rheum (2010) 62(1):64–74. doi: 10.1002/art.25034
121. Cho A, Bradley B, Kauffman R, Priyamvada L, Kovalenkov Y, Feldman R, et al. Robust memory responses against influenza vaccination in pemphigus patients previously treated with rituximab. JCI Insight (2017) 2(12):e93222. doi: 10.1172/jci.insight.93222
122. Hua C, Barnetche T, Combe B, Morel J. Effect of methotrexate, anti-tumor necrosis factor α, and rituximab on the immune response to influenza and pneumococcal vaccines in patients with rheumatoid arthritis: A systematic review and meta-analysis. Arthritis Care Res (Hoboken) (2014) 66(7):1016–26. doi: 10.1002/acr.22246
123. Kim W, Kim SH, Huh SY, Kong SY, Choi YJ, Cheong HJ, et al. Reduced antibody formation after influenza vaccination in patients with neuromyelitis optica spectrum disorder treated with rituximab. Eur J Neurol (2013) 20(6):975–80. doi: 10.1111/ene.12132
124. van Assen S, Holvast A, Benne CA, Posthumus MD, van Leeuwen MA, Voskuyl AE, et al. Humoral responses after influenza vaccination are severely reduced in patients with rheumatoid arthritis treated with rituximab. Arthritis Rheum (2010) 62(1):75–81. doi: 10.1002/art.25033
125. Bar-Or A, Calkwood JC, Chognot C, Evershed J, Fox EJ, Herman A, et al. Effect of ocrelizumab on vaccine responses in patients with multiple sclerosis: The VELOCE study. Neurology (2020) 95(14):e1999–2008. doi: 10.1212/WNL.0000000000010380
126. Otero-Romero S, Tintoré M, Martinez X, Rodriguez M, Rodrigo-Oendás J, et al. Susceptibility to vaccine-preventable infections in multiple sclerosis patients who are candidate to immunosuppressive therapies: The CEMCAT cohort seroprevalence study. ECTRIMS Online Libr (2019) 278240:1038.
127. Rituxan® (Rituximab). highlights of prescribing information (2021). Available at: https://www.accessdata.fda.gov/drugsatfda_docs/label/2021/103705s5464lbl.pdf (Accessed 09 January 2023).
128. Apostolidis SA, Kakara M, Painter MM, Goel RR, Mathew D, Lenzi K, et al. Cellular and humoral immune responses following SARS-Cov-2 mRNA vaccination in patients with multiple sclerosis on anti-CD20 therapy. Nat Med (2021) 27(11):1990–2001. doi: 10.1038/s41591-021-01507-2
129. Brill L, Rechtman A, Zveik O, Haham N, Oiknine-Djian E, Wolf DG, et al. Humoral and T-cell response to SARS-Cov-2 vaccination in patients with multiple sclerosis treated with ocrelizumab. JAMA Neurol (2021) 78(12):1510–4. doi: 10.1001/jamaneurol.2021.3599
130. Achiron A, Mandel M, Dreyer-Alster S, Harari G, Dolev M, Menascu S, et al. Humoral immune response in multiple sclerosis patients following PfizerBNT162b2 COVID19 vaccination: Up to 6 months cross-sectional study. J Neuroimmunol (2021) 361:577746. doi: 10.1016/j.jneuroim.2021.577746
131. Sormani MP, Inglese M, Schiavetti I, Carmisciano L, Laroni A, Lapucci C, et al. Effect of SARS-Cov-2 mRNA vaccination in MS patients treated with disease modifying therapies. EBioMedicine (2021) 72:103581. doi: 10.1016/j.ebiom.2021.103581
132. Achiron A, Dolev M, Menascu S, Zohar DN, Dreyer-Alster S, Miron S, et al. COVID-19 vaccination in patients with multiple sclerosis: What we have learnt by February 2021. Mult Scler (2021) 27(6):864–70. doi: 10.1177/13524585211003476
133. Schiavetti I, Cordioli C, Stromillo ML, Teresa Ferro M, Laroni A, Cocco E, et al. Breakthrough SARS-Cov-2 infections in MS patients on disease-modifying therapies. Mult Scler (2022) 28(13):2106–11. doi: 10.1177/13524585221102918
134. Sormani MP, Schiavetti I, Inglese M, Carmisciano L, Laroni A, Lapucci C, et al. Breakthrough SARS-Cov-2 infections after COVID-19 mRNA vaccination in MS patients on disease modifying therapies during the Delta and the Omicron waves in Italy. EBioMedicine (2022) 80:104042. doi: 10.1016/j.ebiom.2022.104042
135. Weberpals J, Roumpanis S, Barer Y, Ehrlich S, Jessop N, Pedotti R, et al. Clinical outcomes of COVID-19 in patients with multiple sclerosis treated with ocrelizumab in the pre- and post-SARS-Cov-2 vaccination periods: Insights from Israel. Mult Scler Relat Disord (2022) 68:104153. doi: 10.1016/j.msard.2022.104153
136. Vukusic S, Hutchinson M, Hours M, Moreau T, Cortinovis-Tourniaire P, Adeleine P, et al. Pregnancy and multiple sclerosis (the PRIMS study): Clinical predictors of post-partum relapse. Brain (2004) 127(Pt 6):1353–60. doi: 10.1093/brain/awh152
137. Razaz N, Piehl F, Frisell T, Langer-Gould AM, McKay KA, Fink K. Disease activity in pregnancy and postpartum in women with MS who suspended rituximab and natalizumab. Neurol Neuroimmunol Neuroinflamm (2020) 7(6):e903. doi: 10.1212/NXI.0000000000000903
138. Kumpfel T, Thiel S, Meinl I, Ciplea AI, Bayas A, Hoffmann F, et al. Anti-CD20 therapies and pregnancy in neuroimmunologic disorders: A cohort study from Germany. Neurol Neuroimmunol Neuroinflamm (2021) 8(1):e913. doi: 10.1212/NXI.0000000000000913
139. Chakravarty EF, Murray ER, Kelman A, Farmer P. Pregnancy outcomes after maternal exposure to rituximab. Blood (2011) 117(5):1499–506. doi: 10.1182/blood-2010-07-295444
140. Golding A, Haque UJ, Giles JT. Rheumatoid arthritis and reproduction. Rheum Dis Clin North Am (2007) 33(2):319–43,vi-vii. doi: 10.1016/j.rdc.2007.01.001
141. Muglia LJ, Katz M. The enigma of spontaneous preterm birth. N Engl J Med (2010) 362(6):529–35. doi: 10.1056/NEJMra0904308
142. Das G, Damotte V, Gelfand JM, Bevan C, Cree BAC, Do L, et al. Rituximab before and during pregnancy: A systematic review, and a case series in MS and NMOSD. Neurol Neuroimmunol Neuroinflamm (2018) 5(3):e453. doi: 10.1212/NXI.0000000000000453
143. Oreja-Guevara C, Wray S, Buffels S, Zecevic D, Vukusic S. Pregnancy outcomes in patients treated with ocrelizumab. ECTRIMS Online Libr (2019) 279140:780. doi: 10.1016/j.jns.2019.10.1408
144. Dobson R, Bove RM, Borriello F, Craveiro L, Ferreira G, Hellwig K, et al. Pregnancy and infant outcomes in women receiving ocrelizumab for the treatment of multiple sclerosis. Multiple Sclerosis J (2021) 27:554–5. p. 641.
145. Palmeira P, Quinello C, Silveira-Lessa AL, Zago CA, Carneiro-Sampaio M. IgG placental transfer in healthy and pathological pregnancies. Clin Dev Immunol (2012) 2012:985646. doi: 10.1155/2012/985646
146. Krysko KM, LaHue SC, Anderson A, Rutatangwa A, Rowles W, Schubert RD, et al. Minimal breast milk transfer of rituximab, a monoclonal antibody used in neurological conditions. Neurol Neuroimmunol Neuroinflamm (2020) 7(1):e637. doi: 10.1212/NXI.0000000000000637
Keywords: multiple sclerosis, rituximab, ocrelizumab, ofatumumab, ublituximab, anti-CD20
Citation: de Sèze J, Maillart E, Gueguen A, Laplaud DA, Michel L, Thouvenot E, Zephir H, Zimmer L, Biotti D and Liblau R (2023) Anti-CD20 therapies in multiple sclerosis: From pathology to the clinic. Front. Immunol. 14:1004795. doi: 10.3389/fimmu.2023.1004795
Received: 27 July 2022; Accepted: 13 February 2023;
Published: 23 March 2023.
Edited by:
Noel G. Carlson, The University of Utah, United StatesReviewed by:
Heinz Wiendl, University of Münster, GermanyRichard Alan Lundy Macdonell, University of Melbourne, Australia
Hamza Coban, University of Connecticut, United States
Copyright © 2023 de Sèze, Maillart, Gueguen, Laplaud, Michel, Thouvenot, Zephir, Zimmer, Biotti and Liblau. This is an open-access article distributed under the terms of the Creative Commons Attribution License (CC BY). The use, distribution or reproduction in other forums is permitted, provided the original author(s) and the copyright owner(s) are credited and that the original publication in this journal is cited, in accordance with accepted academic practice. No use, distribution or reproduction is permitted which does not comply with these terms.
*Correspondence: Jérôme de Sèze, SmVyb21lLmRlLnNlemVAY2hydS1zdHJhc2JvdXJnLmZy