 Alex Yashchenko1†
 Sarah J. Bland1†
 Cheng J. Song2
 Ummey Khalecha Bintha Ahmed1Rachel Sharp3
 Isabella G. Darby1
 Audrey M. Cordova1Morgan E. Smith1Jeremie M. Lever4,5Zhang Li2Ernald J. Aloria2
 Shuja Khan1
 Bibi Maryam1
 Shanrun Liu6
 Michael R. Crowley7Kenneth L. Jones3
 Lauren A. Zenewicz8James F. George5
 Michal Mrug4,9
 David K. Crossman7
 Katharina Hopp10
 Stavros Stavrakis11Mary B. Humphrey12,13
 Florent Ginhoux14
 Kurt A. Zimmerman1*
- 1Department of Internal Medicine, Division of Nephrology, University of Oklahoma Health Sciences Center, Oklahoma City, OK, United States
- 2Department of Cell, Developmental, and Integrative Biology, University of Alabama at Birmingham, Birmingham, AL, United States
- 3Department of Cell Biology, University of Oklahoma Health Sciences Center, Oklahoma City, OK, United States
- 4Department of Medicine, Division of Nephrology, University of Alabama at Birmingham, Birmingham, AL, United States
- 5Department of Surgery, Division of Cardiothoracic Surgery, University of Alabama at Birmingham, Birmingham, AL, United States
- 6Department of Biochemistry and Molecular Genetics, University of Alabama at Birmingham, Birmingham, AL, United States
- 7Department of Genetics, University of Alabama at Birmingham, Birmingham, AL, United States
- 8Department of Microbiology and Immunology, University of Oklahoma Health Sciences Center, Oklahoma City, OK, United States
- 9Department of Veterans Affairs Medical Center, Birmingham, AL, United States
- 10Department of Medicine, Division of Renal Diseases and Hypertension, Polycystic Kidney Disease Program, University of Colorado Anschutz Medical Campus, Aurora, CO, United States
- 11Department of Internal Medicine, Division of Cardiovascular Diseases, University of Oklahoma Health Sciences Center, Oklahoma City, OK, United States
- 12Department of Internal Medicine, Division of Rheumatology, Immunology, and Allergy, University of Oklahoma Health Sciences Center, Oklahoma City, OK, United States
- 13Department of Veterans Affairs Medical Center, Oklahoma City, OK, United States
- 14Singapore Immunology Network (SIgN), Agency for Science, Technology and Research (A*STAR), 8A Biomedical Grove, Immunos, Singapore, Singapore
Kidney macrophages are comprised of both monocyte-derived and tissue resident populations; however, the heterogeneity of kidney macrophages and factors that regulate their heterogeneity are poorly understood. Herein, we performed single cell RNA sequencing (scRNAseq), fate mapping, and parabiosis to define the cellular heterogeneity of kidney macrophages in healthy mice. Our data indicate that healthy mouse kidneys contain four major subsets of monocytes and two major subsets of kidney resident macrophages (KRM) including a population with enriched Ccr2 expression, suggesting monocyte origin. Surprisingly, fate mapping data using the newly developed Ms4a3Cre Rosa Stopf/f TdT model indicate that less than 50% of Ccr2+ KRM are derived from Ly6chi monocytes. Instead, we find that Ccr2 expression in KRM reflects their spatial distribution as this cell population is almost exclusively found in the kidney cortex. We also identified Cx3cr1 as a gene that governs cortex specific accumulation of Ccr2+ KRM and show that loss of Ccr2+ KRM reduces the severity of cystic kidney disease in a mouse model where cysts are mainly localized to the kidney cortex. Collectively, our data indicate that Cx3cr1 regulates KRM heterogeneity and niche-specific disease progression.
Introduction
It has recently become appreciated that macrophages in most tissues arise from two distinct origins. For example, monocyte-derived macrophages originate from adult hematopoietic stems cells, express high levels of CD11b and low levels of F4/80 (CD11bhi, F4/80lo), are dependent on the transcription factor Myb, and are rapidly turned over through bone marrow monocyte precursors (1). In contrast, tissue resident macrophages originate from embryonic precursors, express low levels of CD11b and high levels of F4/80 (CD11blo, F4/80hi), are Myb independent, and minimally rely on bone marrow monocytes for maintenance (1). Further adding to the complexity, it is now appreciated that resident macrophages can be derived from multiple sources including Myb-independent yolk-sac progenitors, erythro-myeloid progenitors (EMPs), fetal liver monocytes, and adult hematopoietic stem cell (HSC)-derived Ly6chi monocytes (2–4). These data, in addition to data showing that unique macrophage populations occupy distinct niches across tissues (5–7), led to the concept that resident macrophage diversity is driven by a combination of ontological origin, time spent in the tissue, niche-specific cues (i.e. localization), as well as exposure to environmental pathogens or inflammatory stimuli (8). Previous data suggest that ontological origin and spatial orientation may influence kidney resident macrophage (KRM) heterogeneity (9, 10); however, a thorough analysis of variables that dictate this heterogeneity has not been performed to date.
The ability of HSC-derived Ly6chi monocytes to differentiate into resident macrophages is well-established in the gut and skin where newly arrived monocytes upregulate macrophage markers upon entering the tissue (11–13). Ly6chi monocytes also have the ability to differentiate into macrophages during inflammation and tissue injury in the gut(13), skin(12, 14), and serous cavity(13). With the development of novel lineage tracing tools with increased specificity for monocyte-derived progeny, it is now possible to track these cells as they enter the tissue and differentiate into resident macrophages (15). In fact, recent studies using Ms4a3Cre Rosa Stopf/f TdT mice, which can be used to fate map Ly6chi monocytes, showed that a large number of resident macrophage populations received a significant contribution from Ly6chi monocytes, with the exception of the liver, epidermis, and brain (15). Previous data also indicate that the majority of recently arrived, Ly6chi monocyte-derived resident macrophages express the gene Ccr2, which is required for emigration of Ly6chi monocytes out of the bone marrow (16).
Cx3cr1 is a G-protein coupled receptor that serves as a chemoattractant and survival signal for monocytes, macrophages, dendritic cells, and T cells (17). In the kidney, Cx3cr1 regulates monocyte and macrophage accumulation following ischemia reperfusion injury (IRI); loss of Cx3cr1 is associated with improved kidney function and reduced macrophage accumulation following IRI (18, 19). The idea that Cx3cr1 promotes kidney disease is supported by studies from a hypertensive mouse model showing reduced macrophage infiltration and interstitial fibrosis in Cx3cr1 deficient kidneys compared to control kidneys (20). In contrast, Cx3cr1 plays a protective role in a unilateral ureteral obstruction (UUO) model of chronic kidney disease although loss of Cx3cr1 once again reduced the number of kidney macrophages and dendritic cells (21). Collectively, these data indicate that Cx3cr1 regulates macrophage and dendritic cell accumulation in the adult kidney; however, the role of Cx3cr1-dependent phagocytes in kidney disease is still controversial.
Chronic kidney disease (CKD) is a leading public health concern affecting ~15% of the adult population worldwide (22). Patients with CKD experience gradual loss of kidney function eventually resulting in end stage kidney disease (ESKD). Approximately 5-10% of all patients with ESKD have autosomal dominant polycystic kidney disease (ADPKD), making it the most common genetically inherited cause of ESKD (23, 24). ADPKD is caused by mutations in cilia related genes (PKD1, PKD2) and results in large fluid filled cysts scattered throughout the kidney. Mice with a mutation in Ift88, which is required for proper cilia formation (25), represent a ciliopathy mouse model of kidney cystic disease. Conditional deletion of Ift88 in adult mice leads to slowly progressing cystic disease, which can be greatly accelerated by kidney injury (26). Of note, ischemia reperfusion (IR) injury to conditional Ift88 mice results in rapid cyst expansion in the kidney cortex (10, 26), mainly due to the fact that ischemic injury predominantly affects the proximal tubular segments of the nephron (27).
To analyze the diversity of monocytes and tissue resident macrophages in the kidney, we performed scRNAseq on CD11b and F4/80 positive cells isolated from the kidney of 6-8-week-old control mice. Our scRNAseq data identified four subsets of infiltrating monocytes (IMs) and two subsets of kidney resident macrophages (KRM) including one KRM subset with enriched expression of the chemokine receptor Ccr2. Pseudotime analysis of scRNAseq data suggest that Ccr2+ KRM are derived from Ly6chi monocytes. Quite surprisingly, fate mapping data indicate that Ccr2 expression is only partially indicative of monocytic origin, but instead informs spatial localization as Ccr2+ KRM are almost exclusively found in the kidney cortex. Further, we found that Cx3cr1 regulated cortex specific accumulation of Ccr2+ KRM as loss of Cx3cr1 reduced the number of cortical Ccr2+ KRM and delayed cyst progression in a cortex-specific model of cystic kidney disease. Thus, our data indicate that KRM heterogeneity is driven by spatial distribution and identify a gene whose is expression is required for maintenance of the aforementioned spatial distribution.
Results
scRNAseq reveals the cellular diversity of monocytes and tissue resident macrophages in the kidney
To examine the diversity of kidney macrophages, we performed single cell RNA sequencing (scRNAseq) on all CD11b and F4/80 positive cells that were isolated from 6-8-week-old control mice (Figure 1A). The gating strategy used for sorting CD11b and F4/80 positive cells from the kidney is shown in Supplemental Figure 1A. After quality control and removal of low-quality cells (see methods), we analyzed 6,973 cells from two 6-8-week-old control mice (biological duplicates). Using top differentially expressed genes and previously published literature (28–30), we identified and manually annotated the 8 clusters of cells: Cluster 0 (Cd63+ KRM) expressed classical KRM genes (C1qa, Cd81) as well as Cd63 and Pf4; Cluster 1 (Ly6clo infiltrating monocytes [IMs]) expressed Ear2 and Cebpb; Cluster 2 (Nr4a1+ Ly6chi IMs) expressed classical monocyte markers (Ly6c2, Plac8, Chil3) as well as Nr4a1 and Plaur; Cluster 3 (Ccr2+ KRM) expressed classical KRM genes as well as Ccr2, Mmp12, and Clec12a; Cluster 4 (Tmcc1+ Ly6chi IMs) expressed classical monocyte markers as well as Tmcc1 and Lrp1; Cluster 5 (cDC2) expressed Cd209a and Clec10a; Cluster 6 (Ly6a+ Ly6chi IMs) expressed classical monocyte markers as well as Ly6a; Cluster 7 (cDC1) expressed Xcr1 and Snx22 (Figures 1B–D; Supplemental Figure 1B; Supplemental File 1). Of note, there was a significant number of type 2 dendritic cells located within the CD11b and F4/80 positive gates, something that is not well established in the kidney. We also confirmed the lack of neutrophils in our scRNAseq data using the mouse neutrophil marker S100a8 (29) as Ly6g transcripts were not detected in our data set (Supplemental Figure 1C).
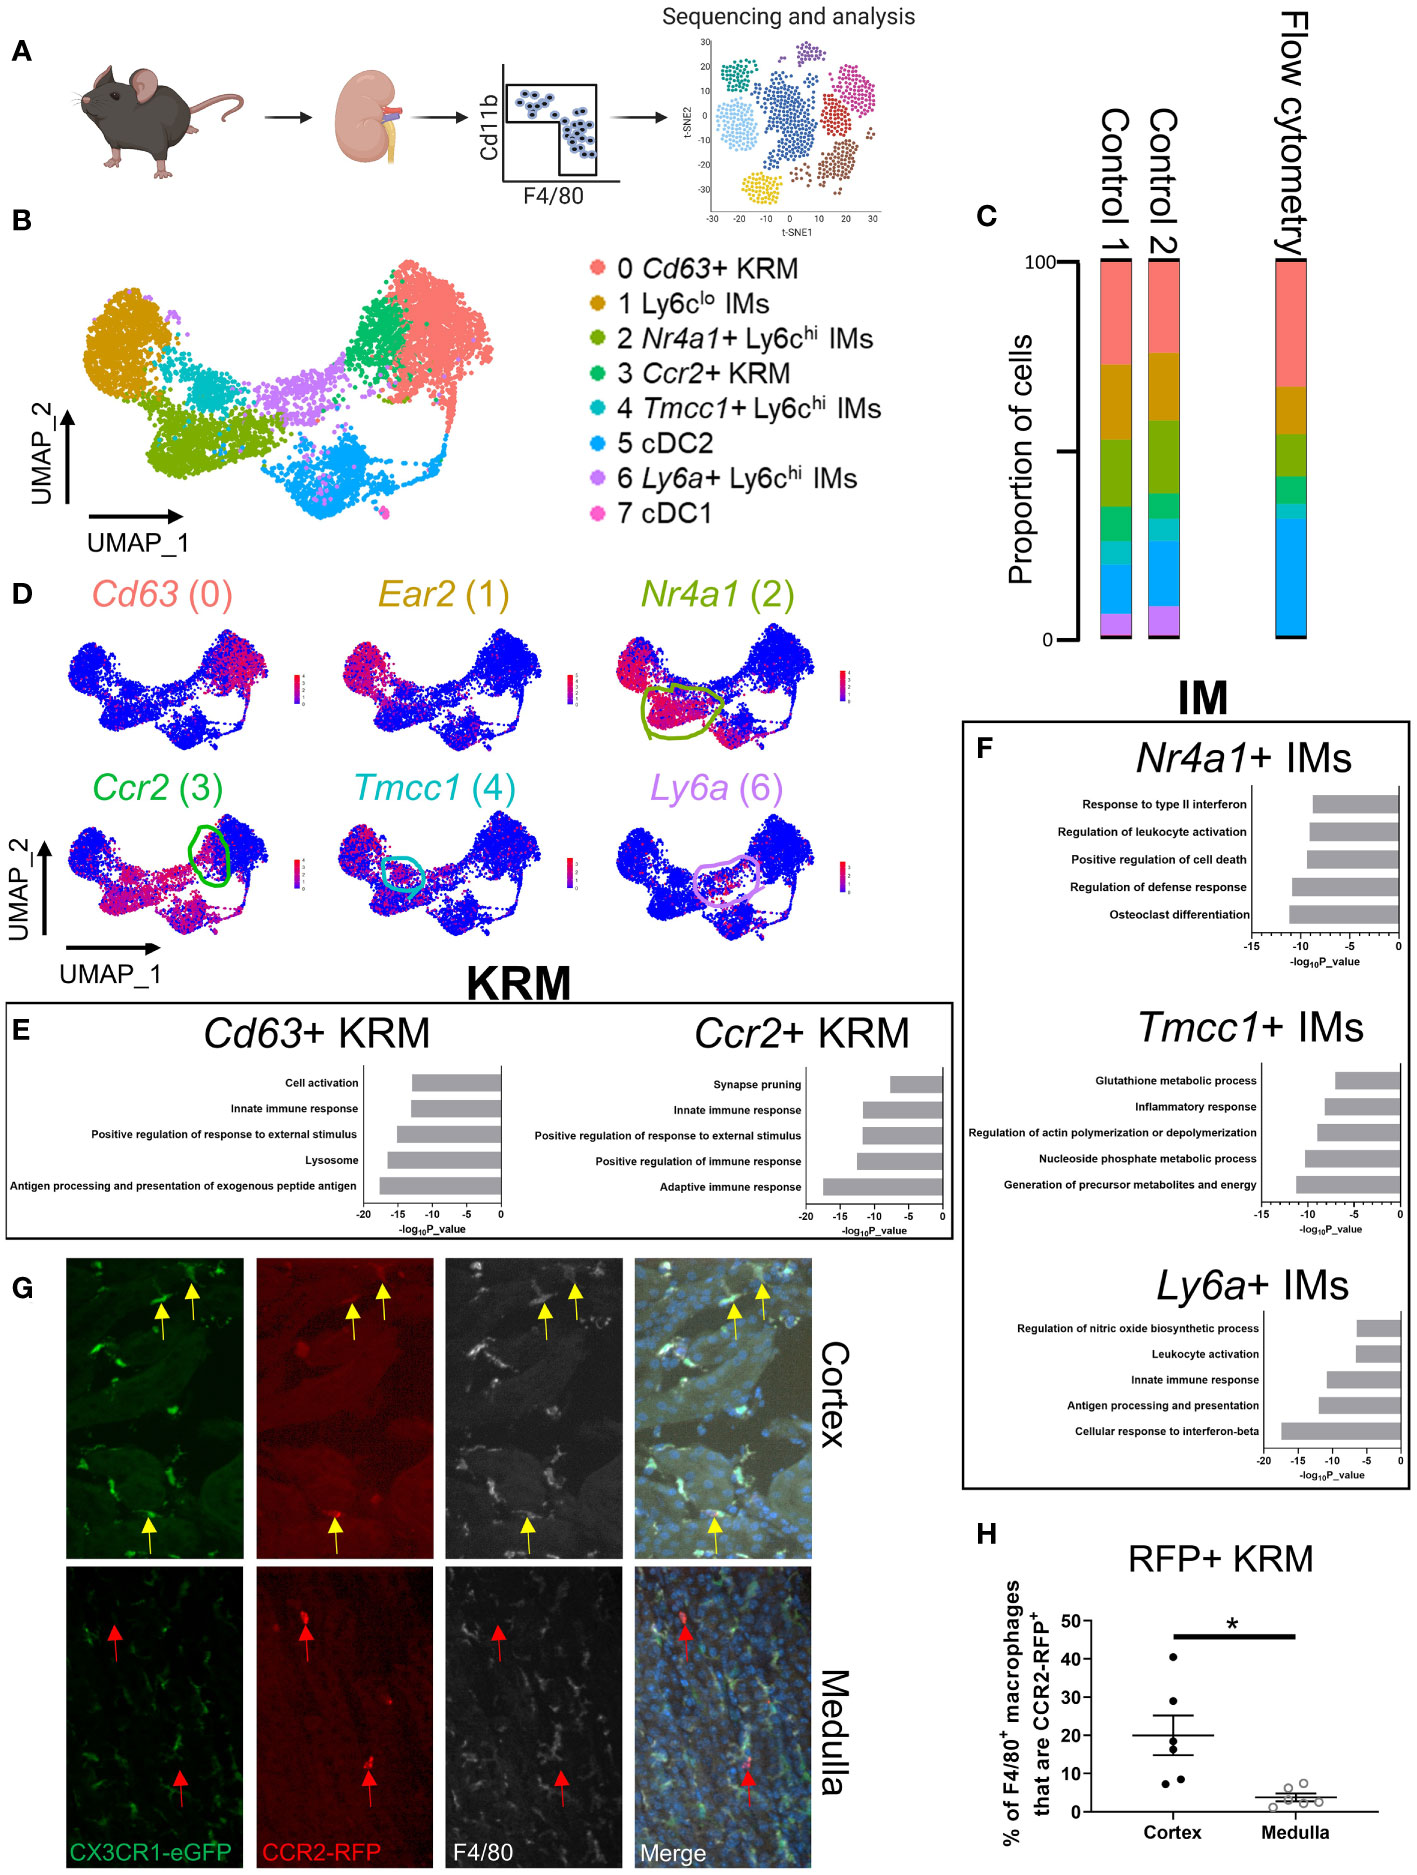
Figure 1 scRNAseq reveals the cellular diversity of monocytes and tissue resident macrophages in the kidney. (A) Schematic of the strategy used to perform scRNAseq on CD11b+ and F4/80+ immune cells isolated from control mice. The control mice for this study were littermates of the Cx3cr1gfp/gfp knockout mice shown in Figure 3. (B) UMAP of myeloid cells identified via single cell RNA sequencing. (C) Quantification of cluster abundance in scRNAseq and flow cytometry data. For flow cytometry, we used surrogate markers to identify Nr4a1+ IMs (UPAR), Tmcc1+ IMs (LRP1), and Ccr2+ KRM (Clec12a). N=5 mice. (D) Feature plot showing top DEGs in each cell cluster. (E, F) Metascape pathway analysis of genes that were significantly enriched (adjusted p value < 0.05) in (E) KRM or (F) IM subsets. (G) Representative confocal microscopy images of kidneys harvested from Ccr2rfp/wt Cx3cr1gfp/wt mice that were stained with a pan-macrophage marker, F4/80. Yellow arrows depict Ccr2+ KRM while red arrows depict Ccr2+ cells that lacked Cx3cr1 and F4/80 expression. Images from both the cortex and medulla are shown. Images were taken with a 20X objective. N=3 mice. (H) Quantification of RFP, F4/80 double positive macrophages in the cortex and medulla. T-test. *P< 0.05.
To confirm the cellular diversity identified via scRNAseq, we performed flow cytometry on immune cells isolated from kidneys of 6 to 8-week-old male and female wild type mice. Ly6chi monocyte subtypes were identified via surrogate markers found in scRNAseq data (UPAR [Plaur] for Nr4a1+ IMs; LRP1 for Tmcc1+ IMs). We chose to use surrogate markers to identify Nr4a1+ and Tmcc1+ IMs as Nr4a1 and Tmcc1 are intracellularly localized proteins and there is a lack of a well-established, commercially available antibody against Tmcc1. Surrogate markers were chosen based on the following criteria: 1) cell surface localization, 2) commercial availability, 3) strong enrichment in cluster of interest (Figure 1D; Supplemental Figure 1B). Ccr2+ KRM were identified using the C-Type Lectin Domain Family 12 Member A (Clec12a) surrogate marker as we were unable to identify bona fide CCR2+ KRM (using a CCR2 antibody; either clone:SA203G11 or clone:475301) via flow cytometry (Supplemental Figures 2A, B). Flow cytometry data confirmed the presence and proportion of each subset of IMs, dendritic cells, and KRM in healthy mouse kidneys (Figure 1C). We also performed a head to head comparison, using both flow cytometry and scRNAseq, of our new gating strategy and a commonly accepted gating strategy for monocytes and tissue resident macrophages to show how our approach captured previously unappreciated heterogeneity within the kidney macrophage niche. Based on the data, the major benefit of using scRNAseq to unbiasedly assess macrophages in the kidney was an increased appreciation for heterogeneity within the Ly6chi IM and KRM compartment (Supplemental Figures 2C, D; Supplemental Figures 3A, B). Of interest, we found both Nr4a1+ and Tmcc1+ Ly6chi monocytes in the blood; however, we were unable to detect Ly6a+ Ly6chi monocytes (SCA-1+) in the blood of healthy mice, similar to recent reports (Supplemental Figures 4A–C) (31, 32).
To further validate our scRNAseq findings, we harvested and analyzed KRM isolated from Ccr2rfp/wt Cx3cr1gfp/wt knock-in mice at 6-8 weeks of age. In these mice, insertion of RFP (Ccr2) or GFP (Cx3cr1) into a single Ccr2 or Cx3cr1 allele results in a phenotypically normal mouse with RFP or GFP reporter activity, respectively; insertion of RFP or GFP into both alleles results in a knockout mouse, which still retains reporter activity (33, 34). The Cx3cr1-GFP knock-in reporter was included as it can be used to identify KRM (35). In agreement with recent data (35), we found that the majority of KRM express Cx3cr1 although Cx3cr1 was also expressed to a similar degree in Ly6chi IMs (Supplemental Figure 5A). Analysis of RFP expression in Ccr2rfp/wt Cx3cr1gfp/wt mice via flow cytometry revealed that ~20% of KRM express Ccr2 (RFP+), in line with our scRNAseq and flow cytometry data using the Clec12a surrogate marker (Supplemental Figure 5B). Expression of Ccr2 in IMs and Ccr2+ KRM, but not Ccr2- KRM, was verified by fluorescence-activated cell sorting (FACS) and qRT-PCR (Supplemental Figure 5C).
To better explore possible functions of monocytes and tissue resident macrophages identified in Figure 1A, we performed a pathway analysis on genes that were enriched in each cluster of cells compared to all other cells in the UMAP. Pathway analysis data indicate that Cd63+ KRM have an enrichment of genes associated with antigen processing and presentation (H2-DMb1, H2-Dma, H2-Eb1), the lysosome (Ctsh, Ctsc, Ctsb), and cell activation (Zfp36l1, H2-DM1, Mafb) while Ccr2+ KRM have an enrichment of genes associated with adaptive immune response (H2-DMb1, H2-Aa, H2-Dma), positive regulation of immune response (Ighm, Lat2, Cd79b), and positive regulation of response to external stimulus (Unc93b1, Scimp, Cd74; Figure 1E). For IM subsets, Nr4a1+ IMs had an enrichment of genes associated with osteoclast differentiation (Il1b, Tnfrsf1a, Fos), regulation of defense response (Il1b, Tnfrsf1a, Ninj1), and positive regulation of cell death (Pmaip1, Tnfrsf1a, Lgals1); Tmcc1+ IMs had an enrichment of genes associated with generation of precursor metabolites and energy (Cox8a, Cox5b, Cox4i1), nucleoside phosphate metabolic process (Ndufb2, Atp5h, Atp5c1), and glutathione metabolic process (Gpx1, Arl6ip5, Mgst1); Ly6a+ IMs had an enrichment of genes associated with cellular response to interferon-beta (Ifi203, Ifi211, Ifi213), antigen processing and presentation (H2-DMb1, H2-Dma, Fcgr2b), and innate immune response (Klrk1, Irf8, Igtp; Figure 1F).
We also identified and analyzed genes that were unique to each IM or KRM subset compared to other IM or KRM clusters, respectively. For example, when we did a head to head comparison of Cd63+ and Ccr2+ KRM, we found that Cd63+ KRM had an enrichment of genes associated with the adaptive immune response, regulation of mononuclear cell migration, and positive regulation of endocytosis while Ccr2+ KRM had an enrichment of genes associated with cytoplasmic translocation, ribosome biogenesis, and translation elongation (Supplemental Figure 5D). Head to head comparison of IM subsets revealed that Nr4a1+ IMs had an enrichment of genes associated with the inflammatory response, regulation of cell activation, and positive regulation of cell death; Tmcc1+ IMs had an enrichment of genes associated with the inflammatory response, chemotaxis, and nucleoside phosphate metabolic process; Ly6a+ IMs had an enrichment of genes associated with antigen processing and presentation, innate immune response, and positive regulation of immune response (Supplemental Figure 5E). Thus, based on our collective data, we propose that in steady state kidneys, both subsets of KRM are involved in the inflammatory response and activating the adaptive immune system; however, our data suggest that Cd63+ KRM may be more involved in endocytosis/phagocytosis and mononuclear cell recruitment whereas Ccr2+ KRM may be the more active cytokine producers (due to enrichment of genes associated with transcription and translation). Our data also strongly suggest that Ly6a+ IMs are a transitionary monocyte due to enriched expression of genes associated with classical macrophage function such as antigen processing and presentation. Finally, we propose that Nr4a1+ IMs have a function that is typically associated with inflammatory monocytes while Tmcc1+ IMs appear to be highly metabolic cells; the function of these cells in steady state is not clear.
To determine the spatial distribution of Ccr2+ KRM, we performed confocal microscopy on kidney sections harvested from dual label (Ccr2rfp/wt, Cx3cr1gfp/wt) mice that had been stained with the pan-macrophage marker F4/80. Our data indicate that approximately 20% of F4/80+, GFP+ macrophages in the kidney cortex express Ccr2 (yellow arrows) whereas less than 5% of medullary macrophages express Ccr2 (Figures 1G, H; Supplemental Figure 5F). Of interest, a large proportion of RFP+ cells in the medulla lacked expression of Cx3cr1 and F4/80 (red arrows), suggesting that these may be bone marrow derived dendritic cells (Figure 1G; Supplemental Figure 5F), which are known to express Ccr2 (36). Unfortunately, we were unable to verify CD63+ KRM localization via IF due to poor antibody efficacy. Collectively, the data indicate that Ccr2+ KRM occupy a unique niche in the kidney cortex where they are primed to produce cytokines in response to challenge.
Ccr2+ KRM are only partially derived from bone marrow monocytes
To test the hypothesis that Ccr2+ KRM are monocyte-derived, similar to what has been reported in the heart (37, 38), we performed pseudotime analysis of single cell data using RNA velocity (scVelo). RNA velocity predicts the directionality of cell differentiation based on the ratio of spliced to unspliced messenger RNA (39). The directionality of arrows infers the direction of cell differentiation due to upregulation of gene expression. RNA velocity data predict that upon entering the kidney, Nr4a1+ and Tmcc1+ IMs upregulate a set of genes to become Ly6clo IMs, in agreement with literature (Figure 2A) (40). The data also suggest that Ly6a+ IMs upregulate a set of genes to become Ccr2+ KRM and, to a certain extent, Cd63+ KRM (Figure 2A). Because Ly6a+ monocytes were not detected in the blood (Supplementals Figure 4A–C) and express markers of both monocytes and mature macrophages (Supplemental Figure 1B), we propose that this cell population is a transitionary monocyte that is derived from Tmcc1+/Nr4a1+ blood monocytes and gives rise to Ccr2+/Cd63+ KRM. The hypothesis that Tmcc1+ and Nr4a1+ IMs give rise to Ccr2+/Cd63+ KRM via a Ly6a+ IM intermediate was further supported by data from Monocle (Figures 2C–F).
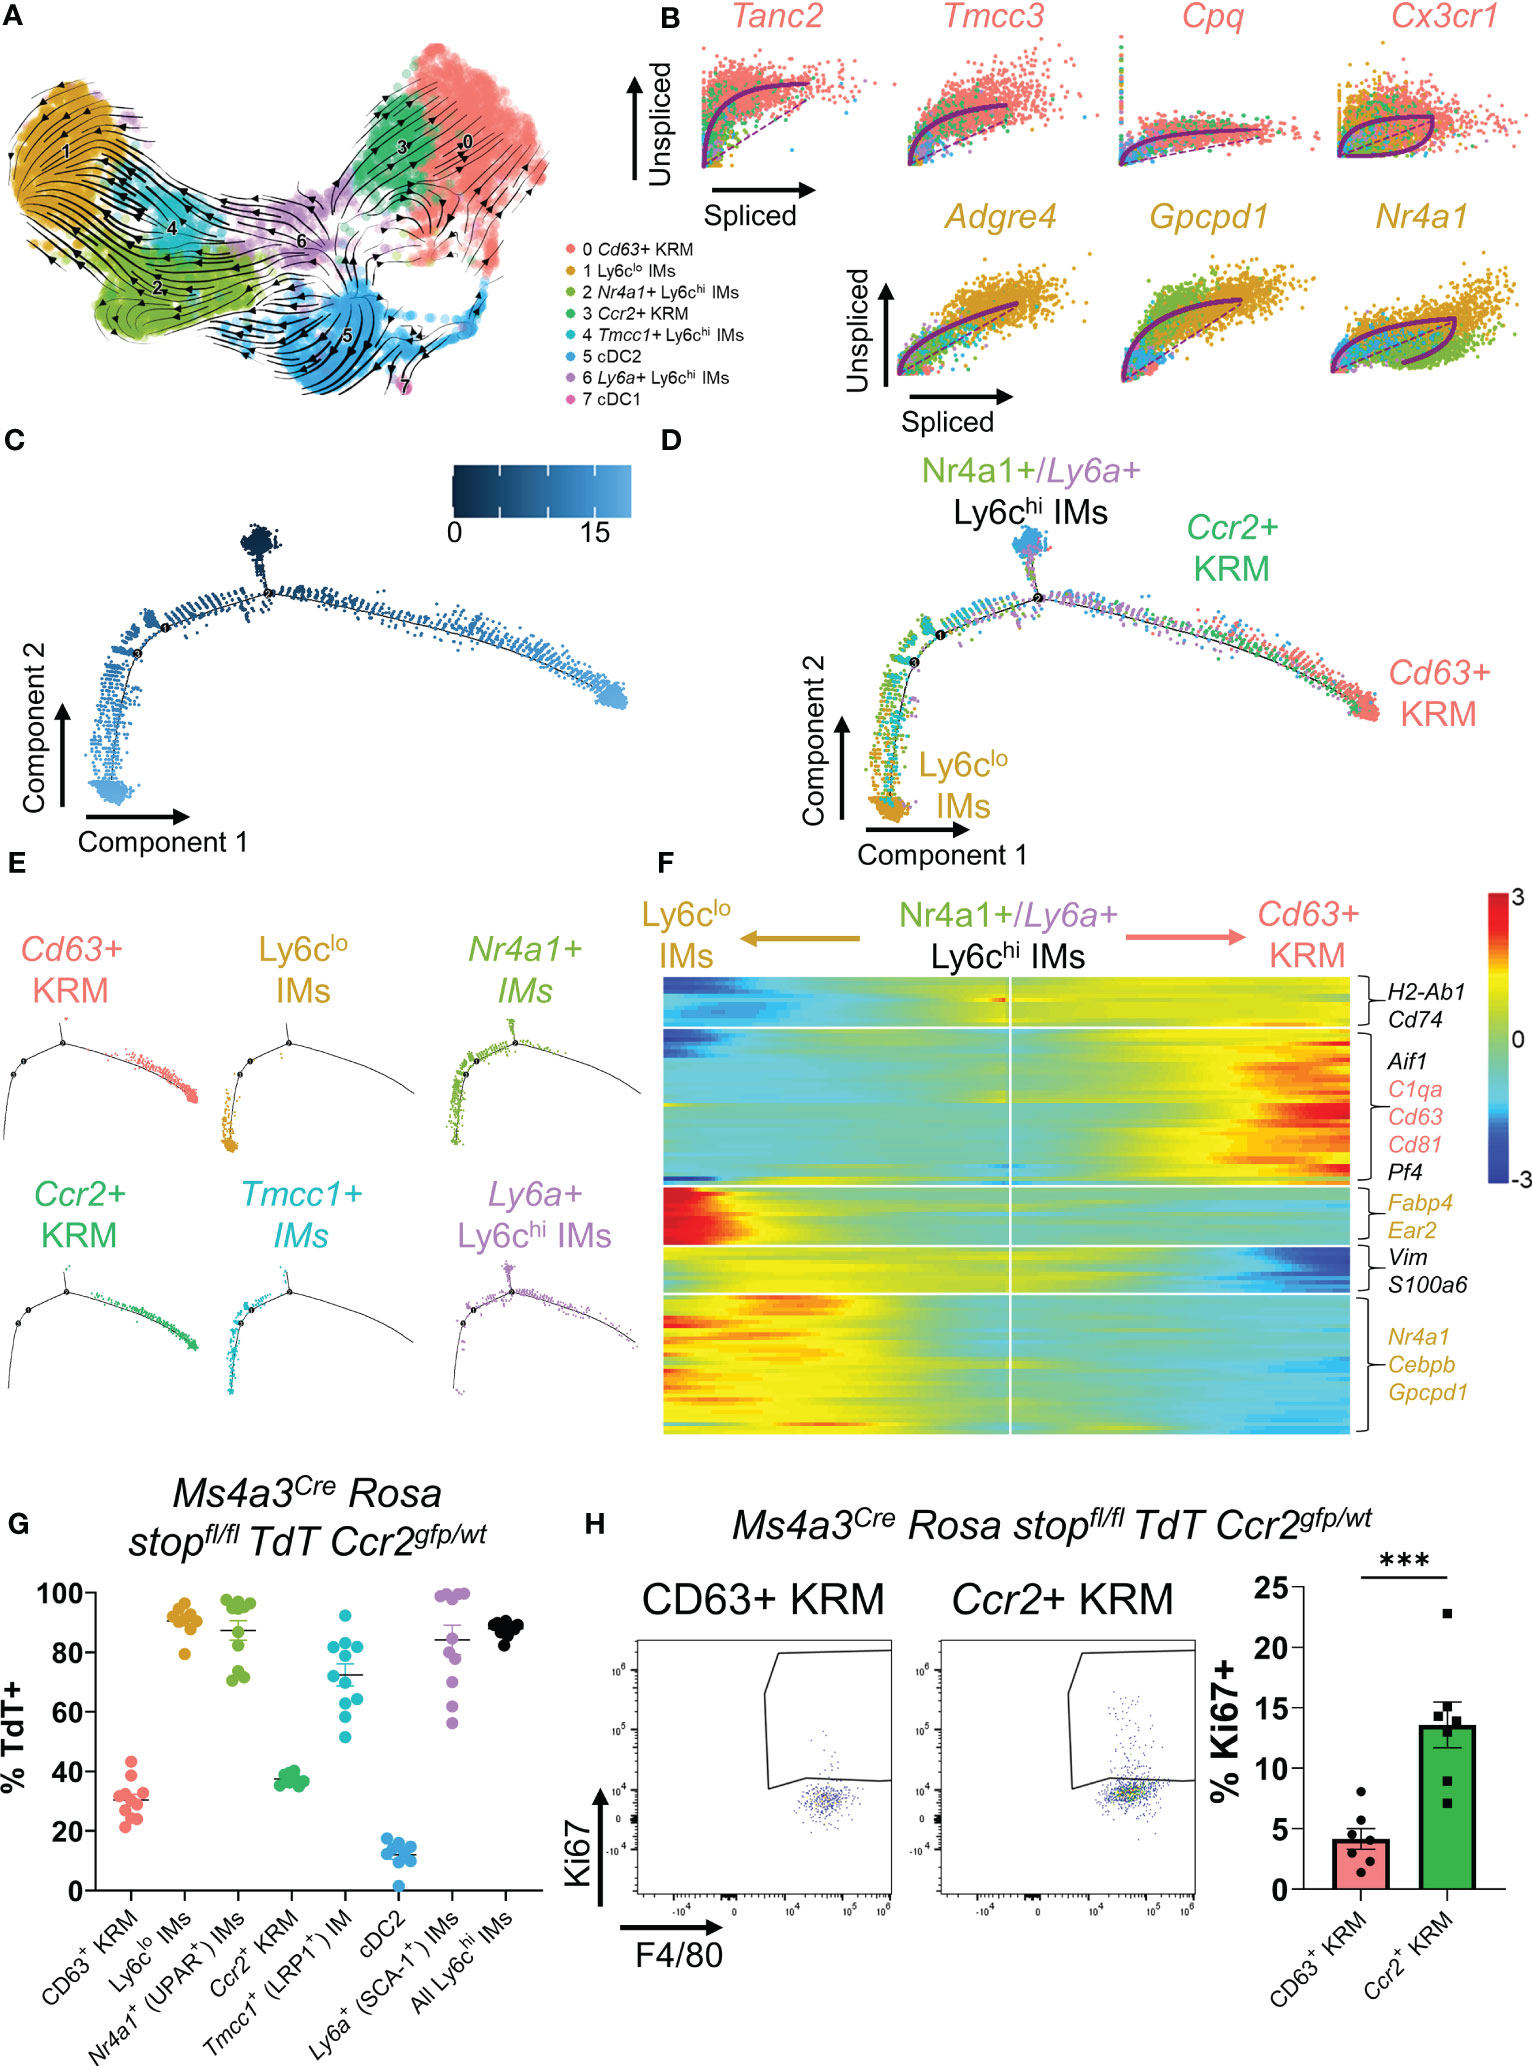
Figure 2 Ccr2+ KRM are partially derived from Ly6chi monocytes. (A) RNA velocity plot of myeloid cells from Figure 1. (B) List of the top predicted genes that are upregulated as IMs differentiate into Ccr2+/Cd63+ KRM (top) or Ly6clo IMs (bottom). Monocle data showing (C) pseudotime and (D) cluster composition of myeloid cells from Figure 1. (E) Branched Monocle2 data showing individual clusters of cells. (F) Heatmap showing a list of genes that change as a function of pseudotime (Monocle). (G) Quantification of the proportion of each IM and KRM subset that was TdT+ in Ms4a3Cre Rosa stopfl/fl TdT Ccr2gfp/wt knock-in fate mapping mice. N=8-11 mice. One-way ANOVA. (H) Representative FACS plots and quantification of the percentage of Ccr2+ or Cd63+ KRM that were Ki67 positive. T-test. ***P<0.001.
We also identified a list of genes that were upregulated as IMs transition to their terminally differentiated states (Ly6clo IMs or Ccr2+/Cd63+ KRM). In agreement with previous data, we identified Nr4a1 as a gene that was upregulated as Nr4a1+/Tmcc1+ IMs differentiated into Ly6clo IMs (Figures 2B, F) (40). Similarly, we found that Tanc2, Tmcc3, Cpq, and Cx3cr1 were all upregulated as Ly6a+ IMs differentiated into Ccr2+ KRM (Figure 2B). Collectively, these data suggest that upon entering the kidney, Nr4a1+ and Tmcc1+ monocytes have the ability to differentiate into either Ly6clo IMs or Ccr2+/Cd63+ KRM.
To directly test the hypothesis that Ccr2+ KRM are derived from Ly6chi monocytes, we crossed the recently developed Ms4a3Cre Rosa stopfl/fl TdT mouse (15) with a Ccr2gfp knock-in reporter mouse (41) and analyzed the percentage of cells expressing TdT in each cluster of cells identified via scRNAseq in Figure 1A. Quite surprisingly, and in contrast to our initial hypothesis, we found that approximately 30-35% of both subsets expressed TdT, although there was no significant difference between the percentage of CD63+ and Ccr2+ KRM that expressed TdT (Figure 2G). Our data also revealed reduced TdT labelling in Tmcc1+ IMs compared to Nr4a1+ IMs (Figure 2G). In agreement with published data (15), we found significant TdT labelling in Ly6chi IMs and a paucity of TdT labelling in cDC2, verifying the specificity of the model (Figure 2G). These data indicate that monocytes give rise to ~30-35% of KRM and that Ccr2 expression is not a definitive marker for KRM originating from bone marrow derived Ly6chi monocytes as described for Ccr2+ cardiac resident macrophages (42).
To test if Ly6chi monocytes were required for maintaining the KRM niche, we quantified the number of Ccr2+ KRM in control (Ccr2rfp/wt) and Ccr2 knockout mice (Ccr2rfp/rfp) via flow cytometry at 6 to 8 weeks of age. Prior to analyzing KRM number, we first confirmed that Ccr2 knockout mice had reduced blood and kidney Ly6chi monocytes (Supplemental Figures 6A, B). Analysis of flow cytometry data revealed that loss of Ccr2 did not significantly reduce Ccr2+ KRM number (Supplemental Figures 6C, D); however, when we aged the Ccr2 knockout mice to ~6 months, we found that loss of Ccr2 significantly reduced Ccr2+ KRM number (Supplemental Figure 6E). We also analyzed the turnover of KRM subsets via intracellular stain with Ki67. Our data indicate that Ccr2+ KRM have significantly increased levels of proliferation when compared to CD63+ KRM (Figure 2H). Thus, although monocyte input is similar between KRM subsets, it appears that Ccr2+ KRM are proliferating more rapidly and are partially reliant on Ly6chi monocyte input to maintain the niche.
Cx3cr1 is required for accumulation of Ccr2+ KRM in the kidney cortex
It has previously been reported that loss of Cx3cr1 greatly reduces the number of kidney mononuclear phagocytes, particularly in the kidney cortex (18, 21, 43, 44), suggesting that Cx3cr1 may control the seeding and/or maintenance of cortex localized Ccr2+ KRM. To understand how loss of Cx3cr1 impacts mononuclear phagocyte subsets in the kidney, we performed scRNAseq on CD11b and F4/80 positive myeloid cells isolated from the kidneys of Cx3cr1 knockout (Cx3cr1gfp/gfp) mice at 6 to 8 weeks of age and compared their transcriptional profile to CD11b and F4/80 positive cells isolated from Cx3cr1 control mice from Figure 1. For these experiments, we sorted an approximately equal number of CD11b and F4/80 positive cells from both genotypes. After removal of contaminating DCs, analysis of cluster composition revealed 7 clusters of cells; 6 of which were identical to the scRNAseq data presented in Figure 1 (Figures 3A, B; Supplemental Figure 7A). Interestingly, Cx3cr1 knockout mice had an additional cluster of cells that was nearly absent in control mice (Figures 3A, B). This cluster (Cluster 5; Mrc1+ KRM) expressed classical KRM genes (C1qa, Cd81) as well as Mrc1 (Supplemental Figure 7A). Analysis of cluster composition (as a proportion of CD11b and F4/80 positive cells) revealed that Cx3cr1 knockout mice had a significant reduction in the proportion of Ccr2+ KRM and Ly6clo IMs as well as a significant increase in the proportion of Mrc1+ KRM compared to control mice (Figure 3C). Monocyte subsets were unchanged between Cx3cr1 control and knockout mice (Figure 3C), which was confirmed via flow cytometry, both as a proportion of CD11b and F4/80 positive cells and as a frequency of live single cells in the kidney (Supplemental Figures 8A–C). We also confirmed that Cx3cr1gfp/gfp mice had reduced Ccr2+ KRM and increased Mrc1+ KRM compared to control mice (both as a percentage of CD11b and F4/80 positive cells in the kidney and as a frequency of live single cells in the kidney) by flow cytometry (Figure 3D; Supplemental Figure 8D) and confocal microscopy (Figures 3E–H). Of note, the loss of Ccr2+ KRM was restricted to the kidney cortex while we observed increased Mrc1+ KRM in both the cortex and medulla (Figures 3E–H).
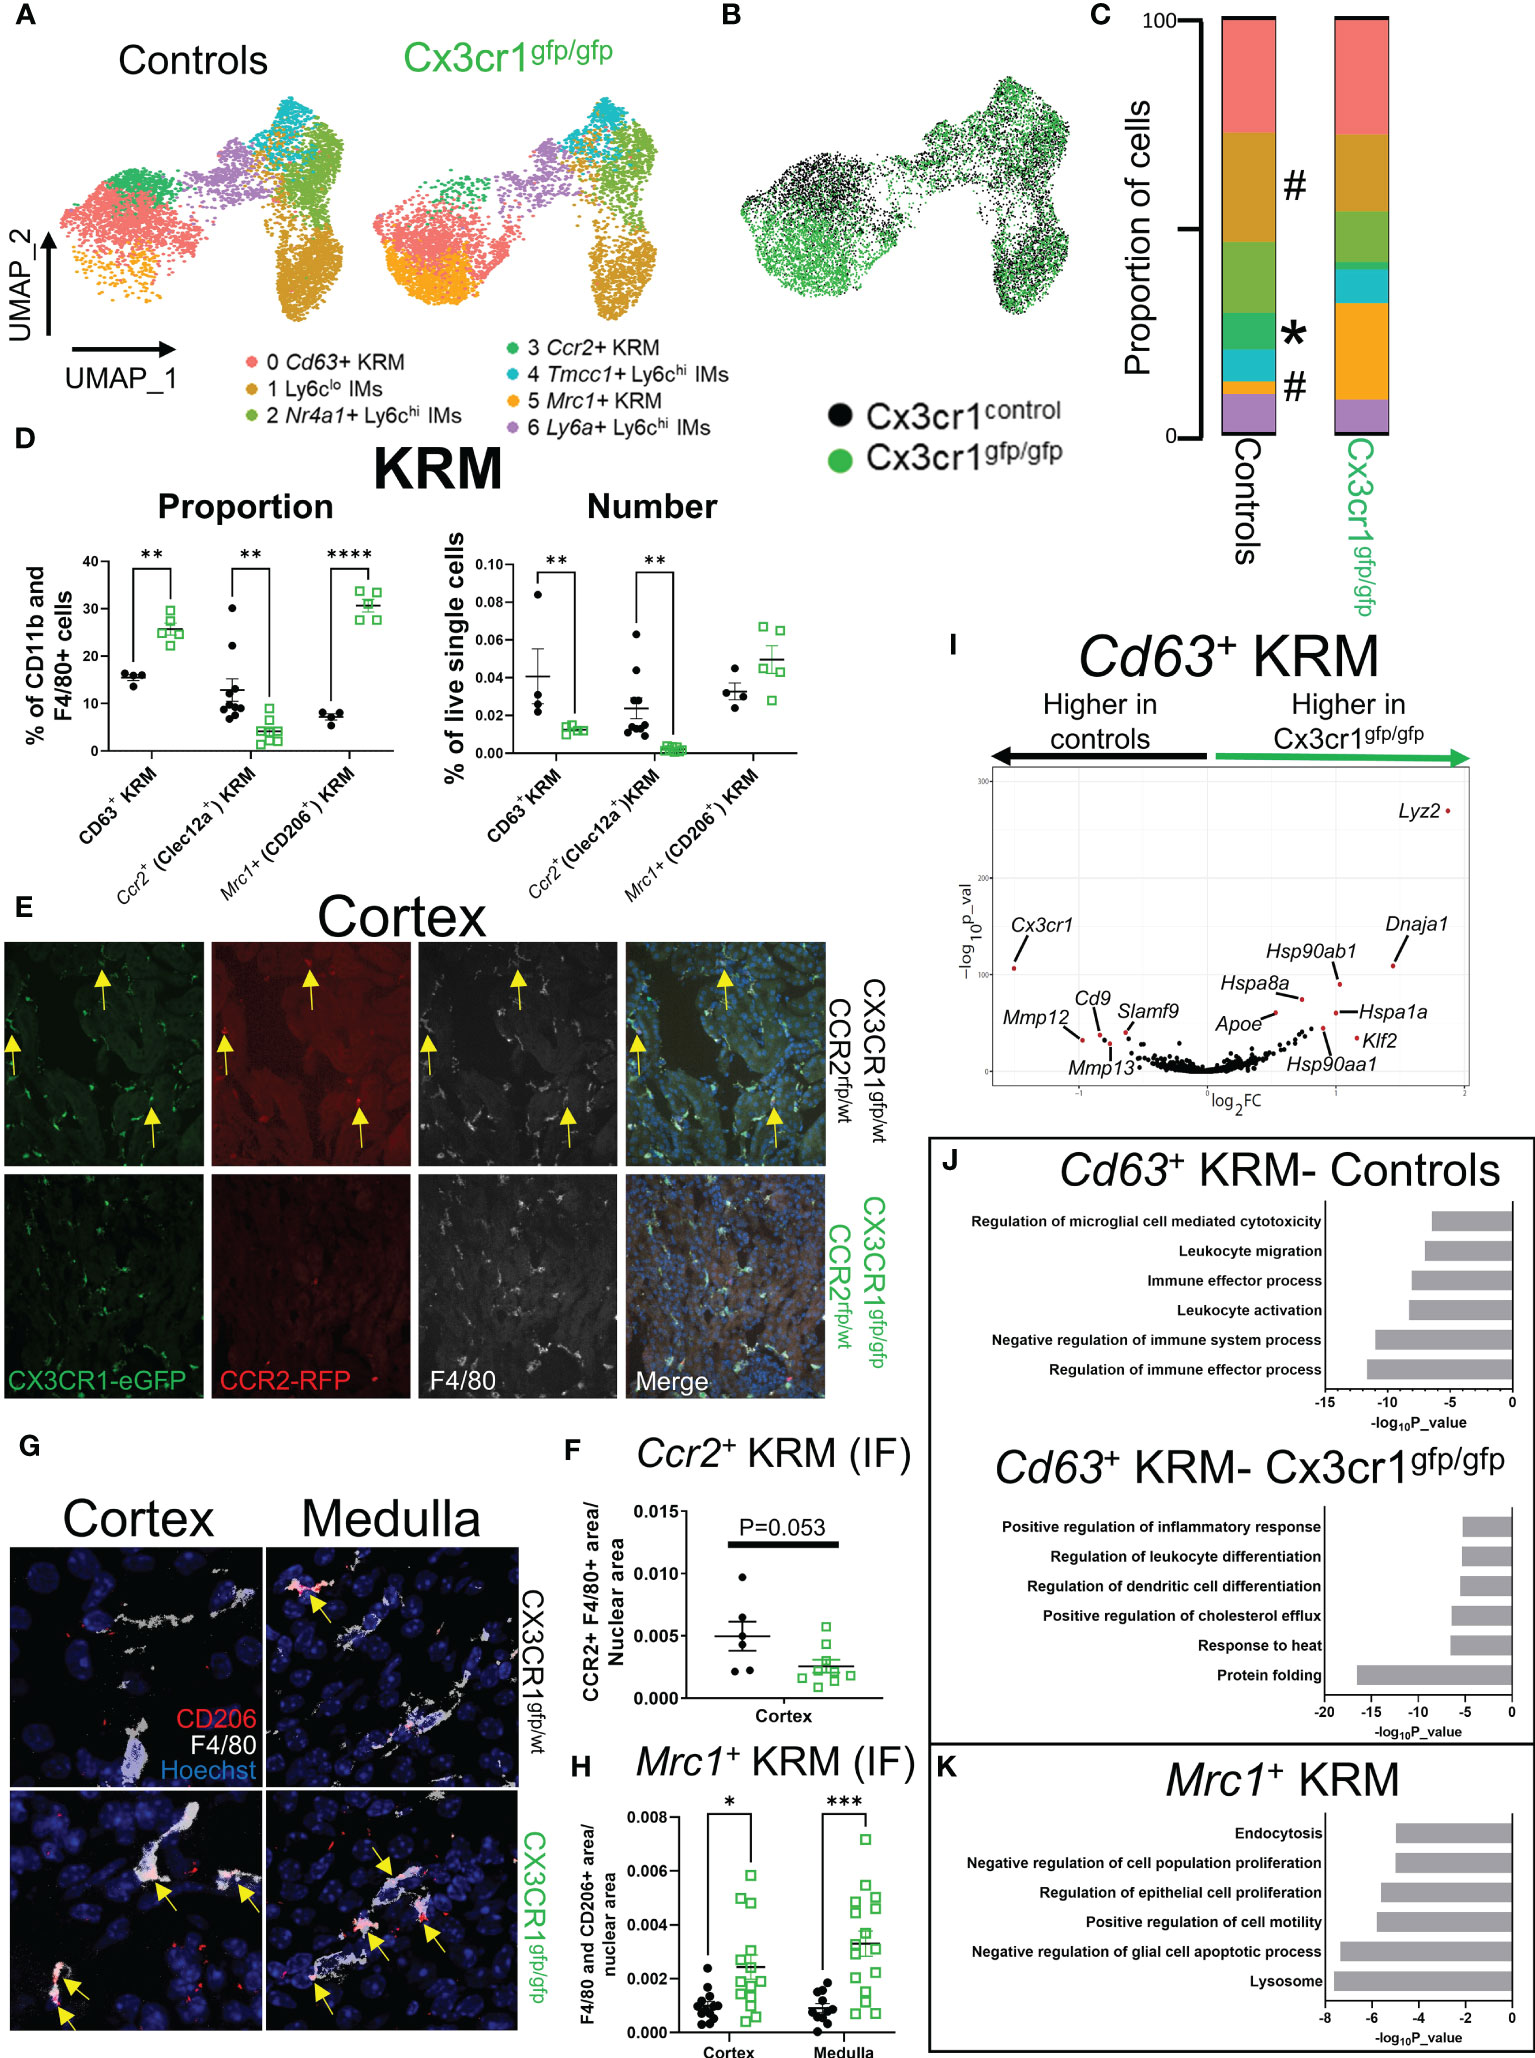
Figure 3 Cx3cr1 is required for accumulation of Ccr2+ KRM in the kidney cortex. (A) UMAP of cell clusters in control (N=2 mice; both female) and Cx3cr1gfp/gfp knockout (N=2 mice; both female) mice. The control group shown in this figure is the same as the data shown in Figure 1. (B) Composite UMAP of cells from control and Cx3cr1gfp/gfp mice. (C) Quantification of cluster composition. T-test. (D) Quantification of flow cytometry data analyzing KRM subsets as a percentage of CD11b and F4/80 positive cells or as a percentage of live single cells in the kidney. Two-way ANOVA. (E) Representative confocal microscopy images of kidney sections isolated from the cortex of Cx3cr1gfp/wt Ccr2rfp/wt (top) or Cx3cr1gfp/gfp Ccr2rfp/wt (bottom) stained with the pan macrophage marker F4/80. Mice were 6-8 weeks of age at harvest. N=2-4 mice per group. (F) Quantification of RFP+ F4/80+ area normalized to total nuclear area in Cx3cr1 control or knockout mice. Each dot represents an individual image that was quantified from a combined 2-4 mice per group. T-test. (G) Representative confocal microscopy images of kidney sections isolated from the cortex (left) or medulla (right) of Cx3cr1gfp/wt (top) or Cx3cr1gfp/gfp (bottom) mice stained with the pan macrophage marker F4/80 and CD206. Mice were 6-8 weeks of age at the time of harvest. N=3-4 mice per group. (H) Quantification of F4/80+ CD206+ area normalized to total nuclear area in the cortex or medulla of Cx3cr1 control or knockout mice. Each dot represents an individual image that was quantified from a combined 3-4 mice per group. Two-way ANOVA. (I) Volcano plot showing genes that were enriched in Cd63+ KRM isolated from control or Cx3cr1gfp/gfp kidneys. (J) Metascape pathway analysis of genes that were significantly enriched (adjusted p value < 0.05) in Cd63+ KRM isolated from control or Cx3cr1gfp/gfp kidneys. (K) Metascape pathway analysis of genes that were significantly enriched (adjusted p value < 0.05) in Mrc1+ KRM compared to Cd63+ KRM. #P <0.1, *P< 0.05, **P< 0.01, ***P< 0.001, ****P< 0.0001.
To better understand how Mrc1+ KRM were accumulating in Cx3cr1gfp/gfp mice, we performed RNA velocity analysis on the composite UMAP generated from Cx3cr1 control and knockout mice (Figure 3B). RNA velocity analysis indicates that in the absence of Cx3cr1, Mrc1+ KRM are likely derived from Cd63+ KRM (Supplemental Figure 8E). Whether Mrc1+ KRM accumulate through self-proliferation or monocyte recruitment and engraftment is unknown, although previous data indicate that CD11c+ mononuclear phagocytes (MNPs) from Cx3cr1gfp/gfp mice proliferate at a greater rate than CD11c+ MNPs from control mice (21). We also analyzed which cells express the only known ligand for CX3CR1, Cx3cl1, using previously published scRNAseq data (45). These data indicate that the majority of Cx3cl1 is expressed in the distal tubule, macula densa, and cells of the deep inner medullary collecting duct (Supplemental Figure 8F).
Next, we compared how loss of Cx3cr1 affected gene expression in Cd63+ KRM (Figure 3I), a cluster whose abundance was minimally impacted by loss of Cx3cr1 (Figure 3C). This analysis revealed that Cd63+ KRM from control mice had an enrichment of genes associated with regulation of immune effector process (Scimp1, Lacc1, Cd86), leukocyte activation (Cdk6, Mafb, Spi1), and leukocyte migration (Cx3cr1, C5ar1, Ccl12; Figures 3I, J). In contrast, Cd63+ KRM from Cx3cr1 knockout mice had an enrichment of genes associated with protein folding (Hspa1a, Hspa1b, Hspa8), response to heat (Hsp90aa1, Hsp90ab1, Nfkbia), and immune cell differentiation (Tmem176b, Cebpb, Tmem176a, H2-Dma, Cd83, Hsp90aa1; Figures 3I, J). We also confirmed that Cx3cr1 expression was significantly elevated in control mice compared to Cx3cr1gfp/gfp mice (Figure 3I). Overall, these data support the idea that Cx3cr1 is required for homeostatic maintenance of the KRM niche.
To understand the possible function of Mrc1+ KRM, which were almost exclusively present in Cx3cr1gfp/gfp mice (Figure 3C), we performed a pathway analysis on genes enriched in this cluster of cells compared to Cd63+ KRM. The data indicate that Mrc1+ KRM had an enrichment of genes associated with the lysosome (Ctsb, Ctsl, Comt), endocytosis (Cltc, Clta, Ap2a2), negative regulation of apoptotic cell processes (Igf1, Gas6, Trem2), and negative regulation of cell proliferation (Hmox1, Igf1, Ang; Figure 3K). Of note, several of the genes (i.e. Trem2, Igf1, Gas6) and pathways (lysosome, endocytosis, regulation of apoptotic cell processes) enriched in Mrc1+ KRM overlapped with signatures previously assigned to Trem2+ macrophages, a cell type that is believed to restrict disease progression in several tissues including the kidney (46–48).
Macrophage intrinsic Cx3cr1 expression is required for KRM niche filling
To test if intrinsic (i.e. within monocytes/macrophages) or extrinsic (i.e. within stromal cells) Cx3cr1 expression is required for maintaining the KRM niche, we employed a parabiosis model in which we joined a CD45.2 Cx3cr1gfp/gfp mouse, which lacks a majority of Ccr2+ KRM, with a congenic CD45.1 wild type mouse via parabiosis surgery (Figure 4A). Six weeks post parabiosis surgery, we harvested wild type (WT) CD45.1 and CD45.2 Cx3cr1gfp/gfp kidneys and analyzed chimerism percentage in IMs in the blood and kidney as well as KRM. Additionally, the percent chimerism of T cells was analyzed in order to validate an efficient exchange of blood cells between parabiosed animals. Our data indicate that the level of chimerism of T cells in the kidney of CD45.1 WT and CD45.2 Cx3cr1gfp/gfp mice was approximately equal (40%) indicating an efficient exchange of immune cells between mice, similar to previous reports (Figures 4B, C) (49). Of note, chimerism of Ly6chi blood monocytes in both CD45.1 WT and CD45.2 Cx3cr1gfp/gfp mice was ~10%, similar to recent reports (Supplemental Figure 9A)(49). Analysis of IMs and KRM in wild type CD45.1 mice revealed minimal chimerism in agreement with other reports(49); in contrast, chimerism of IMs and KRM in CD45.2 Cx3cr1gfp/gfp mice was ~70% and 50%, respectively (Figures 4B, C). We also confirmed that in parabiotic mice, wild type infiltrating monocytes filled the kidney cortex niche to compensate for the loss of Ccr2+ KRM that was observed in Cx3cr1gfp/gfp mice (Figure 4D). The reduced number of CD45.2 IMs in CD45.2 Cx3cr1gfp/gfp kidneys was not due to reduced numbers of CD45.2 Ly6chi monocytes in the blood of these mice (Supplemental Figure 9B). In fact, our data indicate that loss of Cx3cr1 did not impact the number of any subset of blood monocytes (Supplemental Figure 9C). These data indicate that monocytes, and not stromal cells, require Cx3cr1 to enter into the kidney and fill an open KRM niche.
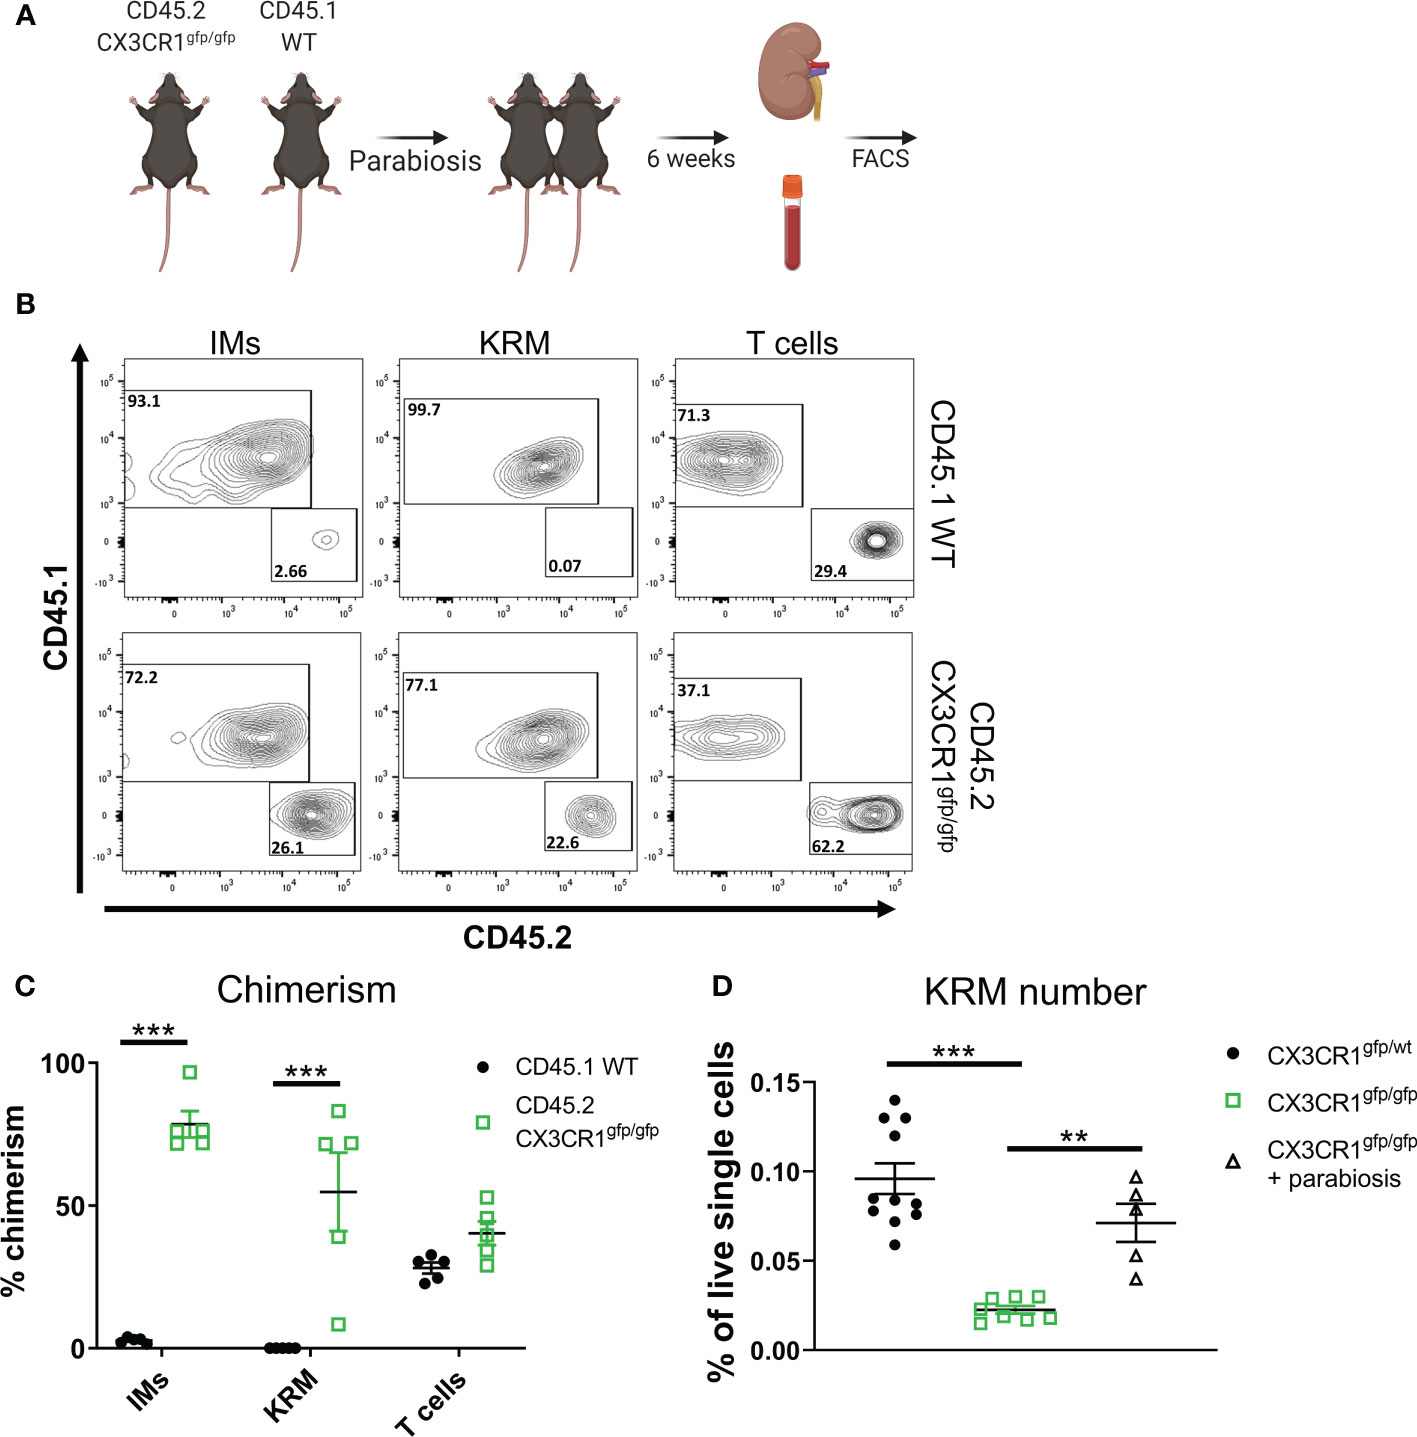
Figure 4 Monocyte intrinsic Cx3cr1 expression is required for KRM niche filling. (A) Schematic of parabiosis experiment. (B) Representative FACS plots of IMs, KRM, and T cells from wild type CD45.1 and CD45.2 Cx3cr1gfp/gfp knockout mice 6 weeks post hook-up. (C, D) Quantification of (C) chimerism and (D) KRM number (graphed as a % of live single cells) in wild type CD45.1 and CD45.2 Cx3cr1gfp/gfp knockout mice 6 weeks post parabiosis surgery. Significance was determined by a (C) Two-way ANOVA or (D) One-way ANOVA. **P< 0.01, ***P< 0.001.
Loss of Cx3cr1 prevents niche specific cystic kidney disease
Previous data indicate that IR injury accelerates cystic kidney disease in conditional Ift88f/f mice (26, 50). Our lab has also previously shown that KRM promote cyst progression in this model (10); however, these studies did not address the involvement of specific macrophage subsets in disease progression. To understand how IR injury impacts macrophage subsets in the kidney in the context of cilia dysfunction (i.e. Ift88 mutation), we re-analyzed our previously published scRNAseq data (GSE193528) and focused on CD11b and F4/80 positive cells isolated from control (cont) or Ift88 cilia mutant (CM) mice 8 weeks post IR injury (IR) or sham surgery (sham) (50). In agreement with earlier data, we were once again able to identify 3 clusters of Ly6chi IMs as well as cDC2, Ccr2+ KRM, and Cd63+ KRM (Figure 5A). As previously published, we were unable to detect Mrc1+ KRM in this model(50). Analysis of cluster composition showed no significant difference in the proportion of any cluster of cells when comparing cystic (IR injured cilia mutant mice; CM IR) and control mice (sham operated cilia mutant mice, CM sham; injured control mice, cont IR; Figure 5B). We also performed a pathway analysis on genes that were enriched in Ccr2+ and Cd63+ KRM isolated from cystic mice compared to control mice. Of interest, pathway analysis data indicate that Ccr2+ KRM from cystic mice (CM IR) had an enrichment of genes associated with aerobic respiration (ND1, Ndufs3, Ndufs6), extracellular vessel biogenesis (Arrdc1, Cops5, Atp13a2), and regulation of mitochondrial organization (Atpif1, Ier3, Chchd10; Figure 5C). In contrast, Cd63+ KRM isolated from cystic mice had an enrichment of genes associated with proximal tubule bicarbonate reclamation (Atp1b1, Atp1a1, Fxyd2), sodium ion homeostasis (Umod, Spp1, Slc12a1), and positive regulation of endocytosis (Igf1, Trem2, Lrp1; Figure 5D).
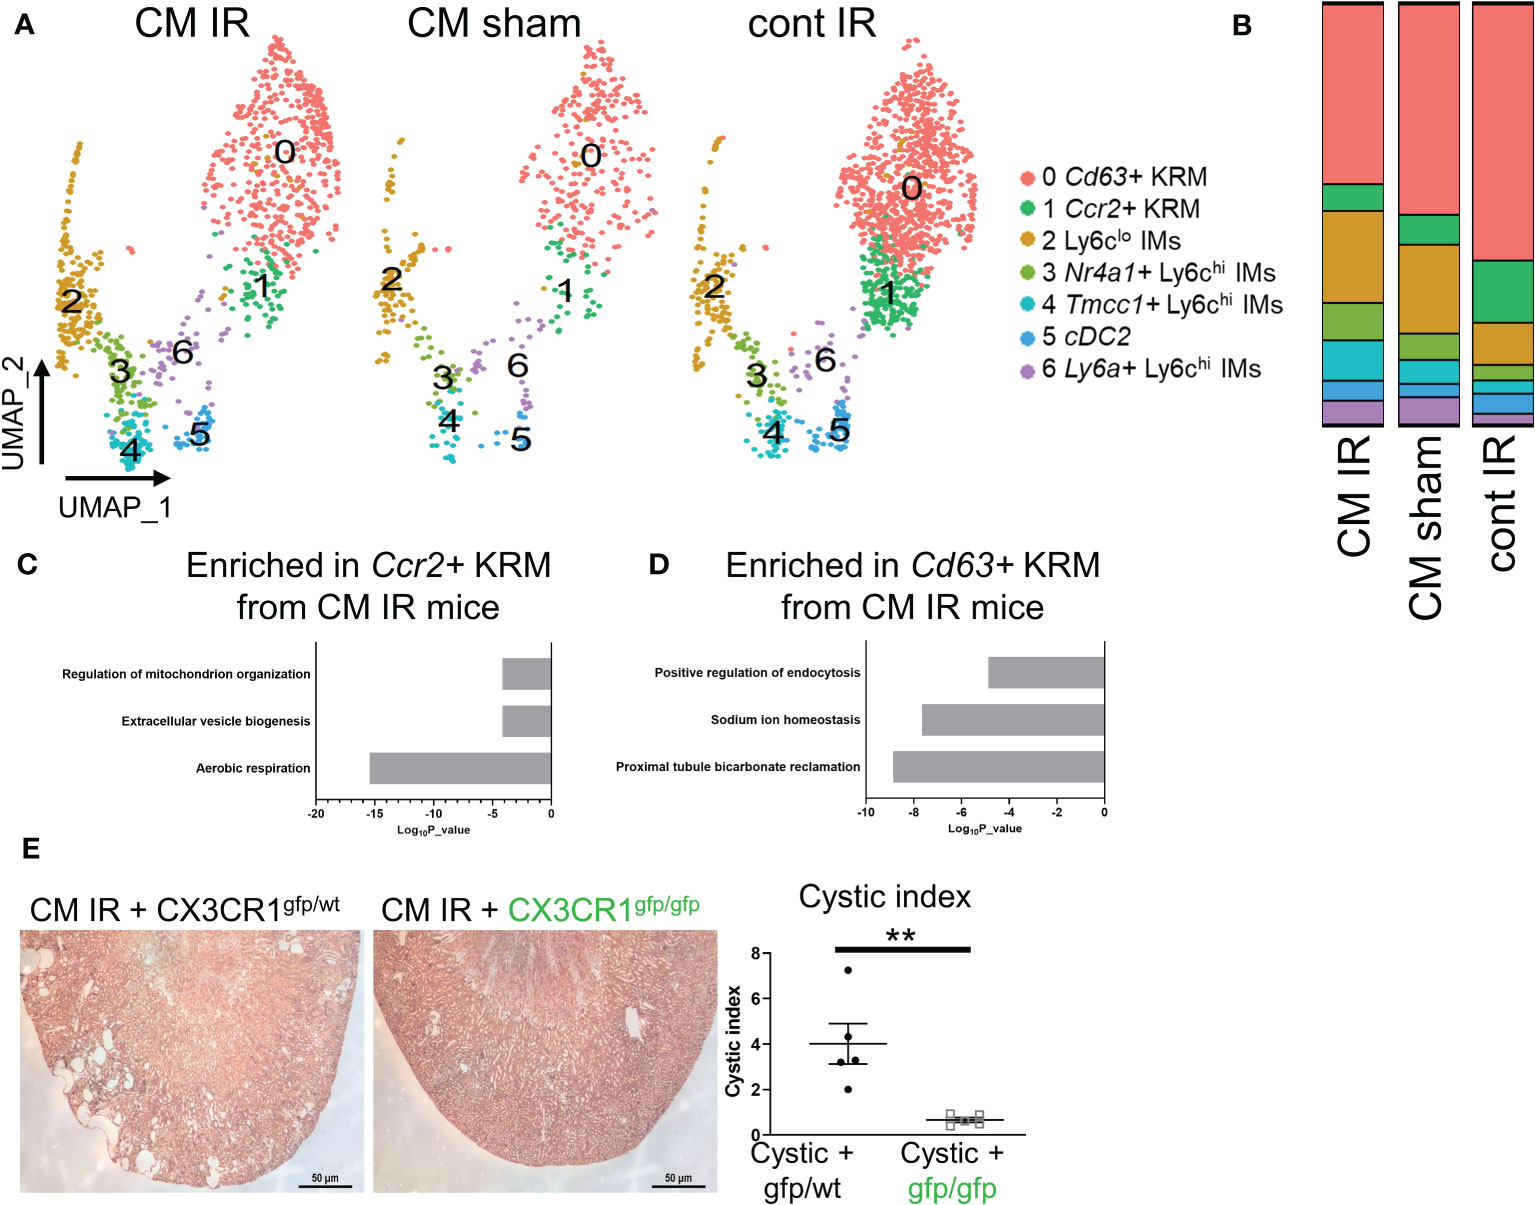
Figure 5 Loss of Cx3cr1 reduces injury accelerated cystic disease. (A) UMAP showing clusters of macrophages and dendritic cells in cystic (CM IR) and control mice (CM sham, cont IR) mice 56 days post IR injury or sham surgery. (B) Quantification of cluster composition in biological duplicates. (C, D) Pathway analysis of genes that were enriched (adjusted P value < 0.05) in (C) Ccr2+ KRM or (D) Cd63+ KRM from cystic mice compared to control mice (CM sham and cont IR). (E) Representative H&E images and quantification of cystic index in CM IR mice on the Cx3cr1gfp/wt or Cx3cr1gfp/gfp background 56 days post injury. **P< 0.01.
Importantly, IR injury mainly affects the proximal tubule region resulting in rapid cyst expansion in the kidney cortex (26, 27), thus providing us with a model to test the importance of cortex-localized, Ccr2+ KRM in a niche-specific model of disease. To test the hypothesis that Ccr2+ KRM promote cyst progression, we analyzed cyst severity in CM IR mice on the Cx3cr1gfp/wt and Cx3cr1gfp/gfp knockout background eight weeks post injury. In agreement with previous reports (26, 50), our data indicate cysts are mainly found in the cortex in CM IR mice on the Cx3cr1 control background whereas loss of Cx3cr1, and Ccr2+ KRM, significantly reduced cystic disease in the kidney cortex (Figure 5E). Thus, our data indicate that Cx3cr1 controls niche specific Ccr2+ KRM accumulation and, in turn, regulates cyst progression in a model that mainly impacts the kidney cortex.
Discussion
Recent literature has highlighted the ever-evolving heterogeneity of monocytes and macrophages across and within tissues. In this manuscript, we use scRNAseq to define the cellular diversity of monocytes and tissue resident macrophages in kidneys isolated from healthy mice. We found that healthy mouse kidneys contain two KRM subsets and four infiltrating monocyte (IM) subsets, which we verified via flow cytometry. One of the KRM subsets, which had increased Ccr2 transcripts, was found to preferentially localize to the kidney cortex. We also tested whether this population was exclusively monocyte-derived as recent data indicate that Ccr2+ resident macrophages in the heart are almost completely derived from bone marrow Ly6chi monocytes (42, 51). Surprisingly, and in contrast to data from the heart, we find that only ~35% of Ccr2+ KRM are monocyte-derived, a value similar to that observed in Cd63+ KRM. Thus, our unbiased approach (scRNAseq) to detail KRM diversity led us to the conclusion that KRM heterogeneity in steady state is driven by spatial distribution. The idea that KRM diversity is driven by spatial distribution is supported by recent data (9, 28).
In this manuscript, we also identified Cx3cr1 as a gene that was able to control the spatial and transcriptional diversity of KRM as loss of Cx3cr1 resulted in a significant reduction in the number of cortex localized Ccr2+ KRM. Corresponding to the loss of Ccr2+ KRM, we also found a new subset of KRM (Mrc1+ KRM) that was enriched in kidneys isolated from Cx3cr1 knockout mice. However, it is unknown how Mrc1+ KRM accumulate in Cx3cr1 knockout kidneys. Previous data indicate that Cd11c expressing mononuclear phagocytes isolated from Cx3cr1 knockout kidneys have increased proliferation compared to controls (21). Thus, it is possible that loss of Ccr2+ KRM is sensed by cells in the kidney cortex; these cells then upregulate expression of Cx3cl1 (CX3CR1 ligand), resulting in migration and proliferation of the remaining Cd63+ KRM to form the Mrc1+ KRM subset. It is also possible that loss of Ccr2+ KRM results in upregulation of chemoattractant cytokines, which facilitate monocyte recruitment and engraftment into Mrc1+ KRM. Similar processes have been described in the liver following loss of Kupffer cells (52–54). It is also interesting to note that the open KRM niche found in Cx3cr1gfp/gfp mice was filled by monocytes from CD45.1 wild type mice in our parabiosis experiment. This occurred despite the fact that CD45.2 Cx3cr1gfp/gfp mice had more CD45.2 monocytes in the blood and had an equal number of IM subsets in the kidney compared to control mice. These data suggest that intrinsic Cx3cr1 expression in monocytes is dispensable for their entry into the blood; rather, we propose that Cx3cr1 is specifically required for the engraftment and differentiation of precursor cells (i.e. HSC-derived monocytes, fetal liver monocytes, etc.) into cortex-localized Ccr2+ KRM.
Although our data indicate that Ly6chi monocytes give rise to ~35% of Ccr2+ KRM and we find that monocytes require Cx3cr1 to enter into the kidney and engraft into the open KRM niche (parabiosis data), we do not believe that loss of Cx3cr1 on monocytes is solely responsible for the observed reduction in Ccr2+ KRM in the Cx3cr1gfp/gfp mice. This conclusion is based on our flow cytometry showing that Ccr2+ KRM number is not impacted in 6-8-week-old Ccr2 knockout mice. This is important as the studies in Cx3cr1gfp/gfp mice were all done on mice aged 6-8 weeks. Rather, we propose that all precursor cells, including those from the yolk sac and fetal liver, require Cx3cr1 for seeding the KRM niche in the kidney cortex. The idea that Cx3cr1 is required for fetal precursors to seed the embryonic KRM niche is supported by the literature (55). Thus, while these data support the idea that the observed reduction of Ccr2+ KRM in 6-8-week-old Cx3cr1gfp/gfp mice was not solely due to defects in monocyte-dependent niche filling, the data also indicate that monocytes are required for maintaining Ccr2+ KRM throughout the animal’s lifespan.
One interesting observation from our scRNAseq studies was the presence of multiple subsets of Ly6chi IMs in the kidney, which we validated via flow cytometry using surrogate markers. Interestingly, when we used these surrogate markers in the blood, we were only able to identify Nr4a1+ monocytes and a minor fraction of Tmcc1+ monocytes. This is an interesting point as our RNA velocity data suggest that Ly6a+ IMs contain the most unspliced mRNA, suggesting they are the most de-differentiated cell type. Based on these collective data, we propose that Tmcc1+ and Nr4a1+ Ly6chi monocytes are the monocyte precursor cells that come from the blood. These cells then enter the kidney and either 1) differentiate to become Ly6clo IMs by converting unspliced mRNA into mature mRNA or 2) de-differentiate through upregulation of transcription resulting in more unspliced mRNA to become Ly6a+ IMs. The intermediate Ly6a+ IMs then undergo the standard differentiation process (i.e. cell maturation) resulting in Ccr2+ and Cd63+ KRM. Also of interest, analysis of TdT expression using the Ms4a3Cre Rosa stopfl/fl TdT mouse revealed lower levels of TdT labelling in the Tmcc1+ subset compared to the Nr4a1+ subset. Since the Ms4a3Cre Rosa stopfl/fl TdT mouse specifically labels monocytes of the granulocyte monocyte progenitor (GMP) lineage (15), our data suggest that Tmcc1+ monocytes may be descendants of the monocyte-dendritic cell progenitor (MDP) lineage (56) while Nr4a1+ IMs are derived from GMPs. Despite the fact that we were able to identify two distinct monocyte subsets with unique TdT labelling, pseudotime data indicate that both subsets are equally able to differentiate into Ly6clo IMs. Why multiple subsets of monocytes may exist in the blood and kidney as well as their function and location is unknown and warrants further investigation.
Recent data indicate that three predominant resident macrophage subsets (TLF+ [Timd4, Lyve1, Folr2], CCR2+, MHC2+) are present across tissues in mice and humans (51). Although all three populations of macrophages are found in each tissue, the predominance of these subsets differs depending on the tissue analyzed. For example, the liver is mainly comprised of TLF+ macrophages while the kidney contains mostly CCR2+ and MHC2+ macrophages. The data from this manuscript support that finding; however, it should be noted that the proportion of each population that we found in the kidney differed slightly from Dick et al. as we found that ~20-25% of KRM expressed Ccr2 while the remaining Cd63+ KRM subset (which is equivalent to the MHC2+ subset in Dick et al.) comprised the majority of remaining KRM. When we projected a TLF modular score onto our single cell data, we only found a few KRM that had a notable score (not enough to form a cluster), similar to Dick et al. Thus, at least in the kidney, the majority of KRM are either Ccr2+ KRM or Cd63+/MHC2+ KRM.
We were also unable to identify CCR2+ KRM using an antibody and standard flow cytometry procedures. This occurred despite our repeated efforts using multiple anti mouse CCR2 antibodies ((BioLegend, Clone: SA203G11) and (BD Biosciences, Clone: 475301)) and standard flow cytometry staining protocols as previously described (37, 38). To ensure the rigor of our experiment, we used the following controls: a CCR2-GFP knock-in reporter (Ccr2gfp/wt) and a Ccr2 knockout animal (Ccr2gfp/gfp). If the antibody is effective, we would expect to observe very few KRM that were CCR2+ in mice lacking Ccr2. Our analysis of the data indicate that loss of Ccr2 did not affect the number of CCR2+ KRM identified using the CCR2 antibody. Thus, we conclude that at least in the kidney, the antibody is not effective in detecting CCR2+ KRM.
Our data indicate that loss of Cx3cr1 significantly reduced cystic kidney disease in our IR injury accelerated model. While we speculate that this rescue is due to loss of Ccr2+ KRM, we recognize that we are also gaining another cluster of cells in this model (Mrc1+ KRM). Thus, it is difficult to determine whether the observed rescue of cystic disease is driven by loss of Ccr2+ KRM or gain of Mrc1+ KRM. We also noticed that Mrc1+ KRM had a very unique transcriptional signature including enriched expression of genes such as Trem2, Igf1, and Gas6. This is important as this signature has been ascribed to Trem2+ macrophages in other slowly progressing models of disease including Alzheimer’s disease (46, 47). In these reports, the authors showed that loss of Trem2+ macrophages worsened phenotypic outcome indicating a protective role for Trem2+ macrophages in disease (46, 47). The observed rescue of cystic disease in our injury accelerated cystic model is supported by another recent publication from our lab showing that loss of Cx3cr1 reduced cystic disease in non-injured conditional Pkd2 mice(57). Thus, it is possible that the observed rescue in both models of cystic disease on the Cx3cr1gfp/gfp background is driven by the accumulation of disease-restricting Trem2+ macrophages. This hypothesis warrants further investigation.
Our studies have several limitations. 1) The control mice that were used for single cell RNA sequencing studies came from Cx3cr1gfp/wt mice, meaning some heterozygous effects may be present in our data set. 2) The mice used for single cell RNA sequencing studies were all female. To address these limitations, we validated our scRNAseq findings in wild type mice via flow cytometry, using animals of both sexes, thereby strengthening the cogency of our findings. 3) The mice analyzed in this studied were 6-8 weeks old. It is possible that Ccr2 expression may more clearly identify resident macrophages of monocyte origin in younger or older mice. 4) We are unable to assess the turnover of monocyte-derived KRM as we used a constitutive Cre recombinase, as opposed to a tamoxifen inducible model, to study the fate of Ly6chi monocytes in the kidney. We also only analyzed one time point preventing us from dissecting how monocyte input into the KRM niche changes over time.
Materials and methods
Mice
Ms4a3Cre/Cre mice were the kind gift of Dr. Florent Ginhoux. Rosa stopfl/fl TdT mice (B6.Cg-Gt(ROSA)26Sortm14(CAG-tdTomato)Hze/J; Stock No: 007914), Ccr2rfp/rfp mice (B6.129(Cg)-Ccr2tm2.1Ifc/J; Stock No: 017586), Ccr2gfp/gfp mice (B6(C)-Ccr2tm1.1Cln/J; Stock No: 027619), and Cx3cr1gfp/gfp mice (B6.129P2(Cg)-Cx3cr1tm1Litt/J; Stock No: 005582) were purchased from Jackson Laboratories. CAGG-Cre/Esr1/5Amc/J IFT88f/f (Referred to as cilia mutant mice; CM) C57BL/6J male and female mice were bred in-house. Animals were maintained in Association for Assessment and Accreditation of Laboratory Animal Care International-accredited facilities in accordance with Institutional Animal Care and Use Committee (IACUC) regulations at the University of Alabama at Birmingham (UAB) and University of Oklahoma Health Sciences Center (OUHSC).
Immunofluorescence microscopy
Following overnight fixation in 4% PFA and cryopreservation in 30% sucrose, 8 µm thick OCT embedded kidney sections were fixed with 4% PFA for 10 minutes, permeabilized with 1% Triton X-100 for 8 min, and incubated in blocking solution (PBS with 1% BSA, 0.3% Triton X-100, 2% (vol/vol) donkey serum, and 0.02% sodium azide) for 30 minutes at room temperature. Sections were incubated in primary antibody overnight at 4°C, washed with PBS, and incubated with the appropriate secondary antibodies in blocking solution for 1 hour at room temperature. The primary antibodies were 1) rat anti-mouse F4/80 (ThermoFisher, Cat no: 14-4801-82, Clone: BM8, diluted 1:200 in blocking solution) and 2) rabbit anti-mouse CD206 (Abcam, Cat no: ab64693, Clone: EPR6868 (B), 1:200 dilution in blocking solution). The secondary antibodies were 1) an Alexa Fluor 647-conjugated anti-rat antibody (Catalog NO: 712-606-153, Jackson ImmunoResearch, 1:250 dilution in PBS) and 2) an Alexa Fluor 568-conjugated donkey anti-rabbit (ThermoFisher, Cat no: A-11011, diluted 1:1000 in blocking solution). Following addition of secondary antibody, nuclei were stained by Hoechst nuclear stain (Sigma-Aldrich) and samples mounted using IMMU-MOUNT (Thermo). All fluorescence images were captured on a Fluoview 1000/IX81 Laser Scanning Confocal microscope (Olympus) with an inverted configuration.
Flow cytometry
After perfusion of the mouse with PBS, kidneys were minced and digested in 1 ml of RPMI 1640 containing 1 mg/ml collagenase type I (Sigma-Aldrich) and 100 U/ml DNase I (Sigma-Aldrich) for 30 min at 37°C with agitation. Kidney fragments were passed through a 70-µm mesh (Falcon; BD Biosciences) yielding single-cell suspensions. Cells were centrifuged at 1300 rpm (330 X g) for 5 minutes and red blood cells lysed using ACK red blood cell lysis buffer (Quality Biological; 10128-802) at 37°C for 5 minutes. Cells were spun at 1300 rpm (330 X g), resuspended in 1 ml of 1% BSA containing Fc blocking solution (dilution 1:200) and incubated for 30 minutes on ice. Following cell counting with trypan blue, approximately 2 million cells were stained for 30 minutes at room temperature with the following direct conjugated primary antibodies: BV786 rat anti-mouse CD45 (Catalog #: 557659, 30-F11, BD Pharmigen), PerCP-Cy5.5 rat anti-mouse CD63 (Catalog #: 143911, Biolegend), APC rat anti-mouse Clec12a (Catalog #: 143405, Biolegend), FITC rat anti-mouse CD206 (Catalog #:141704, Biolegend), PE-Cy5 Armenian hamster anti-mouse CD11c (Catalog #: 117316, Biolegend), Alexa Fluor 488 rat anti-mouse UPAR (Catalog #: FAB531G, R&D Biosystems), Alexa Fluor 647 mouse anti-mouse LRP1 (Catalog #: NB100-64808, Novus Biologicals), PerCP-Cy5.5 rat anti-mouse Ly-6A/E (SCA-1; Catalog #: 45-5981-82, ThermoFisher), eFluor®450 rat anti-mouse F4/80 (Catalog #:48-4801, BM8, eBioscience), APC rat anti-mouse CD11b (Catalog #:17-0112, M1/70, eBioscience), APC-Cy7 rat anti-mouse Ly-6G (Catalog #:127624, Biolegend), and BV711 rat anti-mouse Ly6c (Catalog #:128037, Biolegend). Cells were washed with 1% BSA, spun at 1300 rpm (330 X g), and fixed with 2% PFA at room temperature for 30 minutes. Cells were washed with 1% BSA, spun at 1300 rpm (330 X g), and resuspended in 1X PBS. After immunostaining, cells were analyzed on a BD LSRII flow cytometer. Data analysis was performed using FlowJo v10.8.1 software.
RNA isolation and qRT-PCR
For qRT-PCR experiments, isolated single cells were sorted into tubes containing TRIzol using a BD FACSAriaII. RNA was isolated, transcribed into cDNA, and qRT-PCR performed using TaqMan real-time PCR. The following probes were used: CCR2 (Mm00438270_m1) and HPRT (Mm00446968_m1).
Isolation of cells for single cell sequencing
Cells were prepared as described in the flow cytometry section. After blocking, cells were spun and incubated with the following antibodies in 1% BSA for 30 minutes: BV786 rat anti-mouse CD45 (Catalog #: 557659, 30-F11, BD Pharmigen), eFluor®450 rat anti-mouse F4/80 (Catalog #:48-4801, BM8, eBioscience), APC rat anti-mouse CD11b (Catalog #:17-0112, M1/70, eBioscience), APC-Cy7 rat anti-mouse Gr-1 (Catalog #:557661, RB6-8C5, BD Pharmingen), and Fixable Aqua Dead Cell Stain (catalog no. L34957; Invitrogen). After staining for 30 minutes, cells were spun, washed with 1% BSA, and sorted using a Becton–Dickenson FACSAriaII. We sorted ~25,000 live CD11b+ and F4/80+ cells from individual animals (n=2 per group) into individual BSA coated tubes. Cells were counted and approximately 5,000 cells from each animal were subjected to 10X genomics. This was done for n=2 animals from each experimental group; all animals were female.
10X genomics
10xChromium single cell libraries were prepared according to the standard protocol outlined in the manual. Briefly, sorted single cell suspension, 10x barcoded gel beads, and oil were loaded into Chromium™ Single Cell A Chip to capture single cells in nanoliter-scale oil droplets by Chromium™ Controller and to generate Gel Bead-In-Emulsions (GEMs). Full length cDNA libraries were prepared by incubation of GEMs in a thermocycler machine. GEMs containing cDNAs were broken and all single cell cDNA libraries were pooled together, cleaned using DynaBeads MyOne™ Silane beads (Fisher PN 37002D), and pre-amplified by PCR to generate sufficient mass for sequencing library construction. Sequencing libraries were constructed by following the steps: cDNA fragmentation, end repair & A-tailing, size selection by SPRIselect beads (Beckman Coulter, PN B23318), adaptor ligation, sample index PCR amplification, and a repeat of SPRIselect beads size selection. The final constructed single cell libraries were sequenced by Illumina Nextseq machine with total reads per cell targeted for a minimum of 50,000.
Single cell sequencing data processing
For 10X Genomics single cells, the 10X Genomics Cellranger software (version 6.1.2), ‘mkfastq’, was used to create the fastq files from the sequencer. Following fastq file generation, Cellranger ‘count’ was used to align the raw sequence reads to the reference genome (mm10) using STAR. We also used –include-introns– so that downstream RNA velocity could be performed on spliced and unspliced transcripts. The ‘count’ software created 3 data files (barcodes.tsv, genes.tsv, matrix.mtx) from the ‘filtered_gene_bc_matrices’ folder that were loaded into the R package Seurat version 3.2 (58), which allows for selection and filtration of cells based on QC metrics, data normalization and scaling, and detection of highly variable genes. We followed the Seurat vignette (https://satijalab.org/seurat/pbmc3k_tutorial.html) to create the Seurat data matrix object. We then combined Seurat objects from each individual experiment using the ‘merge’ function. Following merging, we processed data to remove low quality cells by keeping all genes expressed in greater than 3 cells and cells with at least 200 detected copies. Cells with mitochondrial gene percentages over 5% and unique gene counts greater than 2,500 or fewer than 200 were discarded. The data were normalized using Seurat’s ‘NormalizeData’ function, which uses a global-scaling normalization method, LogNormalize, to normalize the gene expression measurements for each cell to the total gene expression. The result is multiplied by a scale factor of 1e4 and the result is log-transformed. Highly variable genes were then identified using the function ‘FindVariableGenes’ in Seurat. Genes were placed into 20 bins based on their average expression and removed using 0.0125 low cutoff, 3 high cutoff and a z-score cutoff of 0.5. We also regressed out the variation arising from library size and percentage of mitochondrial genes using the function ‘ScaleData’ in Seurat. We performed principal component analysis (PCA) of the variable genes as input and determined significant PCs based on the ‘JackStraw’ function in Seurat. The first 10 PCs were selected as input for Uniform Manifold Approximation and Projection (UMAP) dimension Reduction using the functions ‘FindClusters’ and ‘DimPlot’ in Seurat. To identify differentially expressed genes in each cell cluster, we used the function ‘FindAllMarkers’ in Seurat on the normalized gene expression data.
Parabiosis
The parabiosis protocol was modified from the procedure published by Kamran and colleagues(59). For this procedure, incisions were made through the skin and muscle layer starting from the elbow joint and extending down the flank to the knee joint. Non-absorbable 3-0 interrupted sutures were placed around the knee and elbow joints to prevent strain along the suture lines, with care paid not to obstruct blood flow to the distal extremities. Analgesia was maintained on all mice according to IACUC guidelines. For these experiments, we used eight to 10-week-old female Cx3cr1gfp/gfp and CD45.1 mice (all mice were female). Mice were conjoined for six weeks, a time point that allows efficient exchange of immune cells between mice(49). After 6 weeks, mice were administered anesthesia and separated for individual analysis. Single cells were analyzed by flow cytometry as described above.
Cystic mouse model
We induced cilia loss in six to ten-week-old conditional Ift88 mice (CM mice) by injecting mice with a single intraperitoneal (IP) injection of tamoxifen at 6 mg/40 g body weight once daily for 3 consecutive days. Deletion of Ift88 was confirmed by PCR using the following primers: 5`GCCTCCTGTTTCTTGACAACAGTG, GGTCCTAACAAGTAAGCCCAGTGTT3`, 5`CTGCACCAGCCATTTCCTCTAAGTCATGTA-3`.
Unilateral renal ischemia-reperfusion injury (IR)
Three weeks after tamoxifen induction, control or CM mice were subjected to unilateral ischemia reperfusion injury by clamping the left renal pedicle for 30 minutes followed by reperfusion. Mice were injected with buprenorphine (0.05 mg/kg) for pain relief and allowed to recover on a 37°C heating pad. Mice were sacrificed 8 weeks post injury and cystic index calculated as described in the fixation and tissue processing section below.
Fixation and tissue processing
Following harvesting, mouse kidneys were immersion fixed in 4% (wt/vol) paraformaldehyde overnight at 4°C, switched to 70% ethanol overnight, embedded in paraffin, sectioned at 5 µm, and stained using hematoxylin and eosin (H&E). Cystic index was quantified using Image J software and was calculated by determining the total cystic area divided by the total kidney area.
Pseudotime analysis
For pseudotime analysis, we used Monocle 2 (http://cole-trapnell-lab.github.io/monocle-release/docs/#constructing-single-cell-trajectories) or RNA velocity software (https://scvelo.readthedocs.io/) and followed the standard vignette for processing single cell data.
Pathway analysis
The Seurat function ‘FindAllMarkers’ was run to identify differentially expressed genes that distinguished one cluster from others as described in the text. A list of genes enriched in each cluster is shown in Supplemental File 1. Pathway analysis was performed on genes enriched in each cluster of cells (adjusted p value > 0.05) using Metascape software(60). The top 5-6 pathways that were enriched in each cluster of cells is shown.
Data availability
Raw single cell RNA sequencing data can be downloaded using the following GEO number: GSE193892.
Code availability
All code used for data analysis and visualization are included as Supplemental File 2.
Statistics and data analysis
Data were presented as mean ± SEM. ANOVA and Student T tests were used for statistical analysis, and differences were considered significant for P values less than 0.05.
Data availability statement
The datasets presented in this study can be found in online repositories. The names of the repository/repositories and accession number(s) can be found in the article/Supplementary Material.
Ethics statement
The animal study was reviewed and approved by Institutional Animal Care and Use Committee (IACUC) at the University of Alabama at Burmingham (UAB) and University of Oklahoma Health Sciences Center (OUHSC).
Author contributions
AY, SB, and KZ designed the research studies. AY, SB, CS, UA, RS, ID, AC, MS, JL, ZL, EA, SK, BM, SL, MC, KJ, LZ, and KZ conducted experiments and acquired data. AY, SB, CS, UA, RS, JL, ZL, NMG, DZR, EA, KJ, JG, DC, SS, MH, FG, and KZ analyzed data. JG, MM, DC, MH, FG, and KZ provided reagents. AY and KZ wrote the manuscript. All authors contributed to the article and approved the submitted version.
Funding
These studies were supported in part by the following research grants: Polycystic Kidney Disease Research Foundation grant 826369 (KZ); National Institutes of Health (NIH) R01DK097423 (MM), K01DK119375 (KZ), R01DK129255-01A1 (KZ), 1-I01-BX002298 and 1-I01-BX004232-01A2 from the Office of Research and Development, Medical Research Service, Department of Veterans Affairs (MM), by the Detraz Endowed Research Fund in Polycystic Kidney Disease (MM), by the National Institutes of Health T32 training grant in Basic Immunology and Immunologic disease 2T32AI007051-38 (KZ), a Pilot and Feasibility Grant from the Baltimore PKD Center 2P30DK090868 (KZ), a pilot grant from the UAB Hepato/Renal Fibrocystic Disease Core Center 5P30DK074038 (KZ), a seed grant from the Presbyterian Health Foundation (PHF; to KZ), a pilot grant from the Oklahoma Center for Microbial Pathogenesis and Immunity COBRE(1P20GM134973) to KZ, a research grant from the Oklahoma center for adult stem cell research (KZ), and a team science grant and bridge grant from the PHF (KZ). The following NIH-funded cores provided services for this project: UAB-UCSD O’Brien Center for Acute Kidney Injury Research P30-DK079337, and the UAB Comprehensive Flow Cytometry Core P30-AR048311 and P30-AI27667.
Acknowledgments
We would like to gratefully acknowledge Dr. Christopher Bottoms and Dr. David Stanford at Oklahoma Medical Research Foundation (OMRF) for help with scripts related to RNA velocity experiments.
Conflict of interest
The authors declare that the research was conducted in the absence of any commercial or financial relationships that could be construed as a potential conflict of interest.
Publisher’s note
All claims expressed in this article are solely those of the authors and do not necessarily represent those of their affiliated organizations, or those of the publisher, the editors and the reviewers. Any product that may be evaluated in this article, or claim that may be made by its manufacturer, is not guaranteed or endorsed by the publisher.
Supplementary material
The Supplementary Material for this article can be found online at: https://www.frontiersin.org/articles/10.3389/fimmu.2023.1082078/full#supplementary-material
Supplementary Figure 1 | Analysis of monocytes and tissue resident macrophages in the kidney. (A) Gating strategy used to sort CD11b and F4/80 double positive cells in the kidney. (B) Feature plots of key immune cell markers in clusters from. (C) Feature plot showing expression of the mouse neutrophil marker S100a8.
Supplementary Figure 2 | Traditional gating strategy used to identify monocytes, KRM, and dendritic cells (DCs) in the kidney in both flow cytometry and scRNAseq data. (A) Representative FACS plots showing Ccr2 reporter activity (Ccr2-GFP) and CCR2 antibody positive cells in KRM isolated from 6-8-week-old wild type mice. (B) Quantification of the number of CCR2 antibody positive KRM in Ccr2 control or knockout (Ccr2gfp/gfp) mice at 6 to 8 weeks of age. T-test. (C) FACS plots showing the classical gating strategy used to identify monocytes, KRM, and DCs in the kidney. (D) scRNAseq UMAPs showing the classical gating strategy used to identify monocytes, KRM, and DCs in the kidney.
Supplementary Figure 3 | New gating strategy used to identify monocytes, KRM, and dendritic cells (DCs) in the kidney in both flow cytometry and scRNAseq data. (A) FACS plots showing how we identified IM and KRM for further analysis in panel B. (B) FACS plots showing the new gating strategy used to identify monocyte, KRM, and DC heterogeneity in the kidney. For IM and KRM, an FMO control is included for each cell population. (C) scRNAseq UMAPs showing the IM and KRM marker genes that were used to identify cellular heterogeneity.
Supplementary Figure 4 | Gating strategy used to identify IM heterogeneity in the blood. (A) FACS plots showing the gating strategy used to identify blood monocytes. (B) FACS plots showing staining for UPAR, LRP1, and SCA-1 in Ly6chi blood monocytes. (C) Quantification of blood Ly6chi monocyte subsets as a fraction of all blood Ly6chi monocytes. SCA-1+ monocytes were not detected (ND).
Supplementary Figure 5 | Characteristics of Ccr2+ KRM. (A) Expression of Cx3cr1-GFP in KRM and IMs isolated from the kidney of Ccr2rfp/wt, Cx3cr1gfp/wt mice at 6-8 weeks of age. (B) Quantification of the Ccr2+ KRM abundance in scRNAseq or flow cytometry (both Clec12a+ or Ccr2-RFP+ approaches). (C) qRT-PCR data showing the level of expression of Ccr2 in flow sorted infiltrating monocytes (IMs), Ccr2- KRM, and Ccr2+ KRM. N=5 mice. (D,E) Metascape pathway analysis of genes that were significantly enriched (adjusted p value < 0.05) in (D) KRM or (E) IM subsets in the kidney. For this analysis, a list of genes enriched in each cluster was generated by doing a head-to-head comparison of KRM or IM subsets, respectively. (F) Representative images of the kidney cortex and medulla of Ccr2rfp/wt Cx3cr1gfp/wt mice stained with the pan macrophage marker F4/80. A zoomed in version is shown in Figure 1G.
Supplementary Figure 6 | Loss of Ccr2 only impacts Ccr2+ KRM numbers in aged animals. (A,B) Quantification of Ly6chi monocyte number in the (A) blood or (B) kidney of 6-8 week old control (Ccr2rfp/wt) or Ccr2 knockout (Ccr2rfp/rfp) mice. T-test. (C) Representative FACS plots showing Ccr2-RFP expression in KRM isolated from Ccr2rfp/wt or Ccr2rfp/rfp mice at 6-8 weeks of age. (D) Quantification of Ccr2+ KRM number in Ccr2rfp/wt or Ccr2rfp/rfp mice at 6-8 weeks of age. T-test. (E) Quantification of Ccr2+ KRM number in Ccr2rfp/wt or Ccr2rfp/rfp mice at 6 months of age. T-test. *P< 0.05
Supplementary Figure 7 | Analysis of monocytes and macrophages in the Cx3cr1gfp/gfp mice. (A) Feature plots showing expression of key IM and KRM genes in cells from Figure 3.
Supplementary Figure 8 | Analysis of IM and KRM subsets in control and Cx3cr1gfp/gfp mice. (A) FACS plots showing expression of UPAR, LRP1, or SCA-1 in IMs via flow cytometry. Mice were harvested at 6-8 weeks of age. (B,C) Quantification of flow cytometry data analyzing IM subsets as (B) a percentage of CD11b and F4/80 positive cells or (C) as a percentage of live single cells in the kidney. Two-way ANOVA. (D) FACS plots showing expression of CD63, Clec12a, and CD206 in KRM via flow cytometry. Mice were harvested at 6-8 weeks of age. Quantification of the data is shown in . (E) RNA velocity analysis on the composite UMAP shown in . (F) Plot showing expression of Cx3cl1 in different segments of the nephron. Data were obtained using the Kidney Cell Explorer (45).
Supplementary Figure 9 | Loss of Cx3cr1 does not result in a preferential accumulation of CD45.1 or CD45.2 monocytes, neutrophils, or T cells in the blood of CD45.2 Cx3cr1gfp/gfp mice. (A) Quantification of chimerism in blood Ly6chi monocytes isolated from CD45.1 WT and CD45.2 Cx3cr1gfp/gfp mice 6 weeks post hook-up. T-test. (B) Quantification of CD45.1 and CD45.2 monocyte, neutrophil, and T cell numbers in blood isolated from CD45.1 WT or CD45.2 Cx3cr1gfp/gfp mice. Two-way ANOVA. (C) Quantification of the number of blood Ly6chi monocytes in control (Cx3cr1gfp/wt) or Cx3cr1 knockout (Cx3cr1gfp/gfp) mice at 6-8 weeks of age. Two-way ANOVA.
References
1. Schulz C, Gomez Perdiguero E, Chorro L, Szabo-Rogers H, Cagnard N, Kierdorf K, et al. A lineage of myeloid cells independent of myb and hematopoietic stem cells. Science (2012) 336:86–90. doi: 10.1126/science.1219179
2. Gomez Perdiguero E, Klapproth K, Schulz C, Busch K, Azzoni E, Crozet L, et al. Tissue-resident macrophages originate from yolk-sac-derived erythro-myeloid progenitors. Nature (2015) 518:547–51. doi: 10.1038/nature13989
3. Hoeffel G, Chen J, Lavin Y, Low D, Almeida FF, See P, et al. C-myb(+) erythro-myeloid progenitor-derived fetal monocytes give rise to adult tissue-resident macrophages. Immunity (2015) 42:665–78. doi: 10.1016/j.immuni.2015.03.011
4. Munro D, Hughes J. The origins and functions of tissue-resident macrophages in kidney development. Front Physiol (2017) 8:837. doi: 10.3389/fphys.2017.00837
5. Yona S, Kim KW, Wolf Y, Mildner A, Varol D, Breker M, et al. Fate mapping reveals origins and dynamics of monocytes and tissue macrophages under homeostasis. Immunity (2013) 38:79–91. doi: 10.1016/j.immuni.2012.12.001
6. Chakarov S, Lim HY, Tan L, Lim SY, See P, Lum J, et al. Two distinct interstitial macrophage populations coexist across tissues in specific subtissular niches. Science (2019) 363. doi: 10.1126/science.aau0964
7. Guilliams M, Bonnardel J, Haest B, Vanderborght B, Wagner C, Remmerie A, et al. Spatial proteogenomics reveals distinct and evolutionarily conserved hepatic macrophage niches. Cell (2022) 185. doi: 10.1101/2021.10.15.464432
8. Bleriot C, Chakarov S, Ginhoux F. Determinants of resident tissue macrophage identity and function. Immunity (2020) 52:957–70. doi: 10.1016/j.immuni.2020.05.014
9. Berry MR, Mathews RJ, Ferdinand JR, Jing C, Loudon KW, Wlodek E, et al. Renal sodium gradient orchestrates a dynamic antibacterial defense zone. Cell (2017) 170:860–74.e819. doi: 10.1016/j.cell.2017.07.022
10. Zimmerman KA, Song CJ, Li Z, Lever JM, Crossman DK, Rains A, et al. Tissue-resident macrophages promote renal cystic disease. J Am Soc Nephrol (2019) 30:1841–56. doi: 10.1681/ASN.2018080810
11. Bain CC, Scott CL, Uronen-Hansson H, Gudjonsson S, Jansson O, Grip O, et al. Resident and pro-inflammatory macrophages in the colon represent alternative context-dependent fates of the same Ly6Chi monocyte precursors. Mucosal Immunol (2013) 6:498–510. doi: 10.1038/mi.2012.89
12. Tamoutounour S, Guilliams M, Montanana Sanchis F, Liu H, Terhorst D, Malosse C, et al. Origins and functional specialization of macrophages and of conventional and monocyte-derived dendritic cells in mouse skin. Immunity (2013) 39:925–38. doi: 10.1016/j.immuni.2013.10.004
13. Bain CC, Hawley CA, Garner H, Scott CL, Schridde A, Steers NJ, et al. Long-lived self-renewing bone marrow-derived macrophages displace embryo-derived cells to inhabit adult serous cavities. Nat Commun (2016) 7:ncomms11852. doi: 10.1038/ncomms11852
14. Hoeffel G, Debroas G, Roger A, Rossignol R, Gouilly J, Laprie C, et al. Sensory neuron-derived TAFA4 promotes macrophage tissue repair functions. Nature (2021) 594:94–9. doi: 10.1038/s41586-021-03563-7
15. Liu Z, Gu Y, Chakarov S, Bleriot C, Kwok I, Chen X, et al. Fate mapping via Ms4a3-expression history traces monocyte-derived cells. Cell (2019) 178:1509–25.e1519. doi: 10.1016/j.cell.2019.08.009
16. Serbina NV, Pamer EG. Monocyte emigration from bone marrow during bacterial infection requires signals mediated by chemokine receptor CCR2. Nat Immunol (2006) 7:311–7. doi: 10.1038/ni1309
17. Cormican S, Griffin MD. Fractalkine (CX3CL1) and its receptor CX3CR1: a promising therapeutic target in chronic kidney disease? Front Immunol (2021) 12:664202. doi: 10.3389/fimmu.2021.664202
18. Li L, Huang L, Sung SS, Vergis AL, Rosin DL, Rose CE Jr., et al. The chemokine receptors CCR2 and CX3CR1 mediate monocyte/macrophage trafficking in kidney ischemia-reperfusion injury. Kidney Int (2008) 74:1526–37. doi: 10.1038/ki.2008.500
19. Oh DJ, Dursun B, He Z, Lu L, Hoke TS, Ljubanovic D, et al. Fractalkine receptor (CX3CR1) inhibition is protective against ischemic acute renal failure in mice. Am J Physiol Renal Physiol (2008) 294:F264–271. doi: 10.1152/ajprenal.00204.2007
20. Shimizu K, Furuichi K, Sakai N, Kitagawa K, Matsushima K, Mukaida N, et al. Fractalkine and its receptor, CX3CR1, promote hypertensive interstitial fibrosis in the kidney. Hypertens Res (2011) 34:747–52. doi: 10.1038/hr.2011.23
21. Engel DR, Krause TA, Snelgrove SL, Thiebes S, Hickey MJ, Boor P, et al. CX3CR1 reduces kidney fibrosis by inhibiting local proliferation of profibrotic macrophages. J Immunol (2015) 194:1628–38. doi: 10.4049/jimmunol.1402149
22. Lv JC, Zhang LX. Prevalence and disease burden of chronic kidney disease. Adv Exp Med Biol (2019) 1165:3–15. doi: 10.1007/978-981-13-8871-2_1
23. Abbott KC, Agodoa LY. Polycystic kidney disease at end-stage renal disease in the united states: patient characteristics and survival. Clin Nephrol (2002) 57:208–14. doi: 10.5414/CNP57208
24. Spithoven EM, Kramer A, Meijer E, Orskov B, Wanner C, Caskey F, et al. Analysis of data from the ERA-EDTA registry indicates that conventional treatments for chronic kidney disease do not reduce the need for renal replacement therapy in autosomal dominant polycystic kidney disease. Kidney Int (2014) 86:1244–52. doi: 10.1038/ki.2014.120
25. Yoder BK, Tousson A, Millican L, Wu JH, Bugg CE Jr., Schafer JA, et al. Polaris, a protein disrupted in orpk mutant mice, is required for assembly of renal cilium. Am J Physiol Renal Physiol (2002) 282:F541–552. doi: 10.1152/ajprenal.00273.2001
26. Sharma N, Malarkey EB, Berbari NF, O'connor AK, Vanden Heuvel GB, Mrug M, et al. Proximal tubule proliferation is insufficient to induce rapid cyst formation after cilia disruption. J Am Soc Nephrol (2013) 24:456–64. doi: 10.1681/ASN.2012020154
27. Basile DP, Anderson MD, Sutton TA. Pathophysiology of acute kidney injury. Compr Physiol (2012) 2:1303–53. doi: 10.1002/cphy.c110041
28. Stewart BJ, Ferdinand JR, Young MD, Mitchell TJ, Loudon KW, Riding AM, et al. Spatiotemporal immune zonation of the human kidney. Science (2019) 365:1461–6. doi: 10.1126/science.aat5031
29. Zimmerman KA, Bentley MR, Lever JM, Li Z, Crossman DK, Song CJ, et al. Single-cell RNA sequencing identifies candidate renal resident macrophage gene expression signatures across species. J Am Soc Nephrol (2019) 30:767–81. doi: 10.1681/ASN.2018090931
30. Conway BR, O'sullivan ED, Cairns C, O'sullivan J, Simpson DJ, Salzano A, et al. Kidney single-cell atlas reveals myeloid heterogeneity in progression and regression of kidney disease. J Am Soc Nephrol (2020) 31. doi: 10.1101/2020.05.14.095166
31. Askenase MH, Han SJ, Byrd AL, Morais Da Fonseca D, Bouladoux N, Wilhelm C, et al. Bone-Marrow-Resident NK cells prime monocytes for regulatory function during infection. Immunity (2015) 42:1130–42. doi: 10.1016/j.immuni.2015.05.011
32. Park MY, Kim HS, Jeong YS, Kim HY, Bae YS. Novel sca-1(+) macrophages modulate the pathogenic progress of endotoxemia. Biochem Biophys Res Commun (2020) 533:83–9. doi: 10.1016/j.bbrc.2020.08.118
33. Jung S, Aliberti J, Graemmel P, Sunshine MJ, Kreutzberg GW, Sher A, et al. Analysis of fractalkine receptor CX(3)CR1 function by targeted deletion and green fluorescent protein reporter gene insertion. Mol Cell Biol (2000) 20:4106–14. doi: 10.1128/MCB.20.11.4106-4114.2000
34. Saederup N, Cardona AE, Croft K, Mizutani M, Cotleur AC, Tsou CL, et al. Selective chemokine receptor usage by central nervous system myeloid cells in CCR2-red fluorescent protein knock-in mice. PLoS One (2010) 5:e13693. doi: 10.1371/journal.pone.0013693
35. Liu F, Dai S, Feng D, Qin Z, Peng X, Sakamuri S, et al. Distinct fate, dynamics and niches of renal macrophages of bone marrow or embryonic origins. Nat Commun (2020) 11:2280. doi: 10.1038/s41467-020-16158-z
36. Xu L, Sharkey D, Cantley LG. Tubular GM-CSF promotes late MCP-1/CCR2-Mediated fibrosis and inflammation after Ischemia/Reperfusion injury. J Am Soc Nephrol (2019) 30:1825–40. doi: 10.1681/ASN.2019010068
37. Bajpai G, Bredemeyer A, Li W, Zaitsev K, Koenig AL, Lokshina I, et al. Tissue resident CCR2- and CCR2+ cardiac macrophages differentially orchestrate monocyte recruitment and fate specification following myocardial injury. Circ Res (2019) 124:263–78. doi: 10.1161/CIRCRESAHA.118.314028
38. Dick SA, Macklin JA, Nejat S, Momen A, Clemente-Casares X, Althagafi MG, et al. Self-renewing resident cardiac macrophages limit adverse remodeling following myocardial infarction. Nat Immunol (2019) 20:29–39. doi: 10.1038/s41590-018-0272-2
39. La Manno G, Soldatov R, Zeisel A, Braun E, Hochgerner H, Petukhov V, et al. RNA Velocity of single cells. Nature (2018) 560:494–8. doi: 10.1038/s41586-018-0414-6
40. Hanna RN, Carlin LM, Hubbeling HG, Nackiewicz D, Green AM, Punt JA, et al. The transcription factor NR4A1 (Nur77) controls bone marrow differentiation and the survival of Ly6C- monocytes. Nat Immunol (2011) 12:778–85. doi: 10.1038/ni.2063
41. Satpathy AT, Briseno CG, Lee JS, Ng D, Manieri NA, Kc W, et al. Notch2-dependent classical dendritic cells orchestrate intestinal immunity to attaching-and-effacing bacterial pathogens. Nat Immunol (2013) 14:937–48. doi: 10.1038/ni.2679
42. Epelman S, Lavine KJ, Beaudin AE, Sojka DK, Carrero JA, Calderon B, et al. Embryonic and adult-derived resident cardiac macrophages are maintained through distinct mechanisms at steady state and during inflammation. Immunity (2014) 40:91–104. doi: 10.1016/j.immuni.2013.11.019
43. Furuichi K, Gao JL, Murphy PM. Chemokine receptor CX3CR1 regulates renal interstitial fibrosis after ischemia-reperfusion injury. Am J Pathol (2006) 169:372–87. doi: 10.2353/ajpath.2006.060043
44. Hochheiser K, Heuser C, Krause TA, Teteris S, Ilias A, Weisheit C, et al. Exclusive CX3CR1 dependence of kidney DCs impacts glomerulonephritis progression. J Clin Invest (2013) 123:4242–54. doi: 10.1172/JCI70143
45. Ransick A, Lindstrom NO, Liu J, Zhu Q, Guo JJ, Alvarado GF, et al. Single-cell profiling reveals sex, lineage, and regional diversity in the mouse kidney. Dev Cell (2019) 51:399–413.e397. doi: 10.1016/j.devcel.2019.10.005
46. Keren-Shaul H, Spinrad A, Weiner A, Matcovitch-Natan O, Dvir-Szternfeld R, Ulland TK, et al. A unique microglia type associated with restricting development of alzheimer's disease. Cell (2017) 169:1276–90.e1217. doi: 10.1016/j.cell.2017.05.018
47. Jaitin DA, Adlung L, Thaiss CA, Weiner A, Li B, Descamps H, et al. Lipid-associated macrophages control metabolic homeostasis in a Trem2-dependent manner. Cell (2019) 178:686–98.e614. doi: 10.1016/j.cell.2019.05.054
48. Fu J, Sun Z, Wang X, Zhang T, Yuan W, Salem F, et al. The single-cell landscape of kidney immune cells reveals transcriptional heterogeneity in early diabetic kidney disease. Kidney Int (2022) 102:1291–304. doi: 10.1016/j.kint.2022.08.026
49. Lever JM, Yang Z, Boddu R, Adedoyin OO, Guo L, Joseph R, et al. Parabiosis reveals leukocyte dynamics in the kidney. Lab Invest (2018) 98:391–402. doi: 10.1038/labinvest.2017.130
50. Song C, Li Z, Ahmed UKB, Bland S, Yashchenko A, Liu S, et al. A comprehensive immune cell atlas of cystic kidney disease reveals the involvement of adaptive immune cells in injury-mediated cyst progression in mice. J Am Soc Nephrol (2022) 33. doi: 10.1681/ASN.2021030278
51. Dick SA, Wong A, Hamidzada H, Nejat S, Nechanitzky R, Vohra S, et al. Three tissue resident macrophage subsets coexist across organs with conserved origins and life cycles. Sci Immunol (2022) 7:eabf7777. doi: 10.1126/sciimmunol.abf7777
52. Scott CL, Zheng F, De Baetselier P, Martens L, Saeys Y, De Prijck S, et al. Bone marrow-derived monocytes give rise to self-renewing and fully differentiated kupffer cells. Nat Commun (2016) 7:10321. doi: 10.1038/ncomms10321
53. Bonnardel J, T'jonck W, Gaublomme D, Browaeys R, Scott CL, Martens L, et al. Stellate cells, hepatocytes, and endothelial cells imprint the kupffer cell identity on monocytes colonizing the liver macrophage niche. Immunity (2019) 51:638–54.e639. doi: 10.1016/j.immuni.2019.08.017
54. Guilliams M, Thierry GR, Bonnardel J, Bajenoff M. Establishment and maintenance of the macrophage niche. Immunity (2020) 52:434–51. doi: 10.1016/j.immuni.2020.02.015
55. Mass E, Ballesteros I, Farlik M, Halbritter F, Gunther P, Crozet L, et al. Specification of tissue-resident macrophages during organogenesis. Science (2016) 353:128–41. doi: 10.1126/science.aaf4238
56. Yanez A, Coetzee SG, Olsson A, Muench DE, Berman BP, Hazelett DJ, et al. Granulocyte-monocyte progenitors and monocyte-dendritic cell progenitors independently produce functionally distinct monocytes. Immunity (2017) 47:890–902.e894. doi: 10.1016/j.immuni.2017.10.021
57. Li Z, Zimmerman KA, Cherakara S, Chumley P, Collawn JF, Wang J, et al. A kidney resident macrophage subset is a candidate biomarker for renal cystic kidney disease in preclinical models. Dis Model Mech (2022) 16. doi: 10.1242/dmm.049810
58. Butler A, Hoffman P, Smibert P, Papalexi E, Satija R. Integrating single-cell transcriptomic data across different conditions, technologies, and species. Nat Biotechnol (2018) 36:411–20. doi: 10.1038/nbt.4096
59. Kamran P, Sereti KI, Zhao P, Ali SR, Weissman IL, Ardehali R. Parabiosis in mice: a detailed protocol. J Vis Exp (2013). doi: 10.3791/50556-v
Keywords: macrophage heterogeneity, kidney macrophages, CX3CR1, CCR2, fate mapping, single cell RNA sequencing (scRNAseq), cystic kidney disease, parabiosis
Citation: Yashchenko A, Bland SJ, Song CJ, Ahmed UKB, Sharp R, Darby IG, Cordova AM, Smith ME, Lever JM, Li Z, Aloria EJ, Khan S, Maryam B, Liu S, Crowley MR, Jones KL, Zenewicz LA, George JF, Mrug M, Crossman DK, Hopp K, Stavrakis S, Humphrey MB, Ginhoux F and Zimmerman KA (2023) Cx3cr1 controls kidney resident macrophage heterogeneity. Front. Immunol. 14:1082078. doi: 10.3389/fimmu.2023.1082078
Received: 27 October 2022; Accepted: 25 April 2023;
Published: 15 May 2023.
Edited by:
Marten A. Hoeksema, Amsterdam UMC, NetherlandsReviewed by:
Claudia Han, University of California, San Diego, United StatesChia-Lin Hsu, National Yang Ming Chiao Tung University, Taiwan
Guillaume Hoeffel, INSERM U1104 Centre d’immunologie de Marseille-Luminy (CIML), France
Copyright © 2023 Yashchenko, Bland, Song, Ahmed, Sharp, Darby, Cordova, Smith, Lever, Li, Aloria, Khan, Maryam, Liu, Crowley, Jones, Zenewicz, George, Mrug, Crossman, Hopp, Stavrakis, Humphrey, Ginhoux and Zimmerman. This is an open-access article distributed under the terms of the Creative Commons Attribution License (CC BY). The use, distribution or reproduction in other forums is permitted, provided the original author(s) and the copyright owner(s) are credited and that the original publication in this journal is cited, in accordance with accepted academic practice. No use, distribution or reproduction is permitted which does not comply with these terms.
*Correspondence: Kurt A. Zimmerman, a3VydC16aW1tZXJtYW5Ab3Voc2MuZWR1
†These authors have contributed equally to this work