 Ding-Ping Chen
 Ying-Hao Wen
 Wei-Tzu Lin
 Fang-Ping Hsu
 Kuang-Hui Yu
- 1Department of Laboratory Medicine, Linkou Chang Gung Memorial Hospital, Taoyuan, Taiwan
- 2Department of Medical Biotechnology and Laboratory Science, College of Medicine, Chang Gung University, Taoyuan, Taiwan
- 3School of Medicine, National Tsing Hua University, Hsinchu, Taiwan
- 4School of Medicine, Chang Gung University, Taoyuan, Taiwan
- 5Graduate Institute of Clinical Medical Sciences, College of Medicine, Chang Gung University, Taoyuan, Taiwan
- 6Division of Rheumatology, Allergy, and Immunology, Linkou Chang Gung University and Memorial Hospital, Taoyuan, Taiwan
Introduction: The human leukocyte antigen (HLA) has been linked to the majority of autoimmune diseases (ADs). However, non-HLA genes may be risk factors for ADs. A number of genes encoding proteins involved in regulating T-cell and B-cell function have been identified as rheumatoid arthritis (RA) susceptibility genes.
Methods: In this study, we investigated the association between RA and single-nucleotide polymorphisms (SNPs) of co-stimulatory or co-inhibitory molecules in 124 RA cases and 100 healthy controls without immune-related diseases [including tumor necrosis factor superfamily member 4 (TNFSF4), CD28, cytotoxic T-lymphocyte–associated protein 4 (CTLA4), and programmed cell death protein 1 (PDCD1)].
Results: The results showed that there were 13 SNPs associated with RA, including rs181758110 of TNFSF4 (CC vs. CT, p = 0.038); rs3181096 of CD28 (TT vs. CC + CT, p = 0.035; CC vs. TT, p = 0.047); rs11571315 (TT vs. CT, p = 0.045), rs733618 (CC vs. TT + CT, p = 0.043), rs4553808 (AA vs. AG vs. GG, p = 0.035), rs11571316 (GG vs. AG vs. AA, p = 0.048; GG vs. AG + AA, p = 0.026; GG vs. AG, p = 0.014), rs16840252 (CC vs. CT vs. TT, p = 0.007; CC vs. CT, p = 0.011), rs5742909 (CC vs. CT vs. TT, p = 0.040), and rs11571319 of CTLA4 (GG vs. AG vs. AA, p < 0.001; GG vs. AG + AA, p = 0.048; AA vs. GG + AG, p = 0.001; GG vs. AA, p = 0.008; GG vs. AG, p ≤ 0.001); and rs10204525 (TT vs. CT + CC, p = 0.024; TT vs. CT, p = 0.021), rs2227982 (AA vs. GG, p = 0.047), rs36084323 (TT vs. CT vs. CC, p = 0.022; TT vs. CT + CC, p = 0.013; CC vs. TT + CT, p = 0.048; TT vs. CC, p = 0.008), and rs5839828 of PDCD1 (DEL vs. DEL/G vs. GG, p = 0.014; DEL vs. DEL/G + GG, p = 0.014; GG vs. DEL + DEL/G, p = 0.025; DEL vs. GG, p = 0.007).
Discussion: Consequently, these SNPs may play an important role in immune regulation, and further research into the role of these SNPs of immune regulatory genes in the pathogenesis of RA is required.
Introduction
Rheumatoid arthritis (RA) is a chronic inflammatory autoimmune disease (AD) in which the immune system attacks the joints as a result of abnormal autoimmunity. The prevalence rate of RA ranges from 0.24% to 1% of the global population (1). Most patients’ hands, feet, joints, and jaw will be affected, potentially leading to joint deformation. Aside from joints, the skin, eyes, and blood vessels can also be affected.
RA is a genetic AD identified through previous family twin studies (2). Furthermore, Kurkó et al. (3) stated that genetics, environmental factors, and autoimmunity were the three major factors causing RA pathogenesis, with genetics accounting for 60% of the total. Although the pathogenesis of RA is still unknown, numerous studies have shown that the loss of immune tolerance caused by autoreactive T-cell overactivation is the primary cause of AD (4, 5). Human leukocyte antigen (HLA) genes have been found to have a strong correlation with AD (6). However, other genes found outside the HLA region may be risk factors for AD. Studies have shown that T-cell activation is strictly regulated by signals from co-stimulatory and co-inhibitory molecules (7). Therefore, we focus on the SNPs of the co-stimulatory system, including tumor necrosis factor superfamily member 4 (TNFSF4 and OX40L), CD28, cytotoxic T-lymphocyte–associated protein 4 (CTLA4 and CD152), and programmed cell death protein 1 (PDCD1 and CD279).
Both TNFSF4 and CD28 stimulate T-cell activation. TNFSF4 and its receptor, OX40, interact to promote T-cell survival, activation, and differentiation (8). TNFSF4 may also influence immune tolerance by activating OX40 (8). Immune tolerance loss is well known to cause autoimmune disorders (9). CD28 is an important co-stimulatory molecule. The CD28 signal generated by the CD28 and CD80/CD86 interaction plays a critical role in T-cell activation and differentiation, and it has been demonstrated that the CD28 signal plays a key role in regulating immune tolerance and autoimmunity in animal models demonstrated in an animal model (10). Furthermore, CTLA4 and PDCD1 inhibit T-cell activation by blocking CD28-mediated upregulation (11). These co-stimulatory and co-inhibitory molecules have also been used as immunotherapy targets (12–15), indicating that they play an important role in immune regulation and disease resolution.
A single-nucleotide polymorphism (SNP) is a common genetic variation that is often used as a genetic marker in the study of genetic diseases. Moreover, genetic polymorphisms can be used as prognostic markers for the prognosis of RA. However, SNP combinations in genomes differ from person to person, particularly among ethnic groups. Although foreign teams have investigated the association between ADs and immune regulatory genes, it is still unclear whether the susceptibility of SNPs applies to Taiwanese people. Therefore, studying disease SNPs for specific ethnic groups remains worthwhile.
Materials and methods
Study subjects
In this study, 124 patients with RA and 100 subjects without immune abnormalities were recruited. All patients and healthy subjects were asked to sign informed consent forms before we collected their peripheral blood samples, and all procedures were performed in accordance with the applicable guidelines and regulations. The study was approved by the Institutional Review Board (IRB) of Chang Gung Memorial Hospital (CGMH; IRB no. 202002097B0 and 202102018B0C601). The inclusion criteria of RA were based on the RA classification criteria (16). In addition, the healthy controls were recruited from the general population: those without ADs and immune abnormalities or those using immunosuppressive drugs.
Polymerase chain reaction and SNP analysis
The genomic DNA was first extracted from peripheral blood samples using the QIAamp DNA Blood Mini Kit (Qiagen, Valencia, CA). The concentration and purity of DNA were then determined using a NanoDrop ND-1000 UV–Vis Spectrophotometer (Thermo Fisher Scientific Inc., Waltham, MA) in preparartion for the subsequent PCR. This study focused on the TNFSF4 gene on chromosome 1 and the CTLA4, CD28, and PDCD1 genes on chromosome 2. Because ADs can result from abnormal co-stimulatory and co-inhibitory molecule expression levels (17) and SNP variation in the promoter region can affect gene expression (18), the promoter region of genes was included. In addition, previously studied hotspots, such as rs3087243 at the 3′ untranslated region (3′UTR) of CTLA4 gene, rs6705653 and rs41386349 at the exon 4 of PDCD1 gene, rs2227981 at the exon 5 of PDCD1 gene, and re10204525 at the 3′UTR of PDCD1 gene, were included. We obtained gene polymorphism data related to 37 SNPs of the above genes from the SNP database of NCBI and designed eight pairs of primers for detecting these genes (Table 1) to amplify genomic DNA fragments containing these 37 SNPs (Table 2). Because of poor quality genomic DNA and PCR failure, not all samples had complete SNP data.
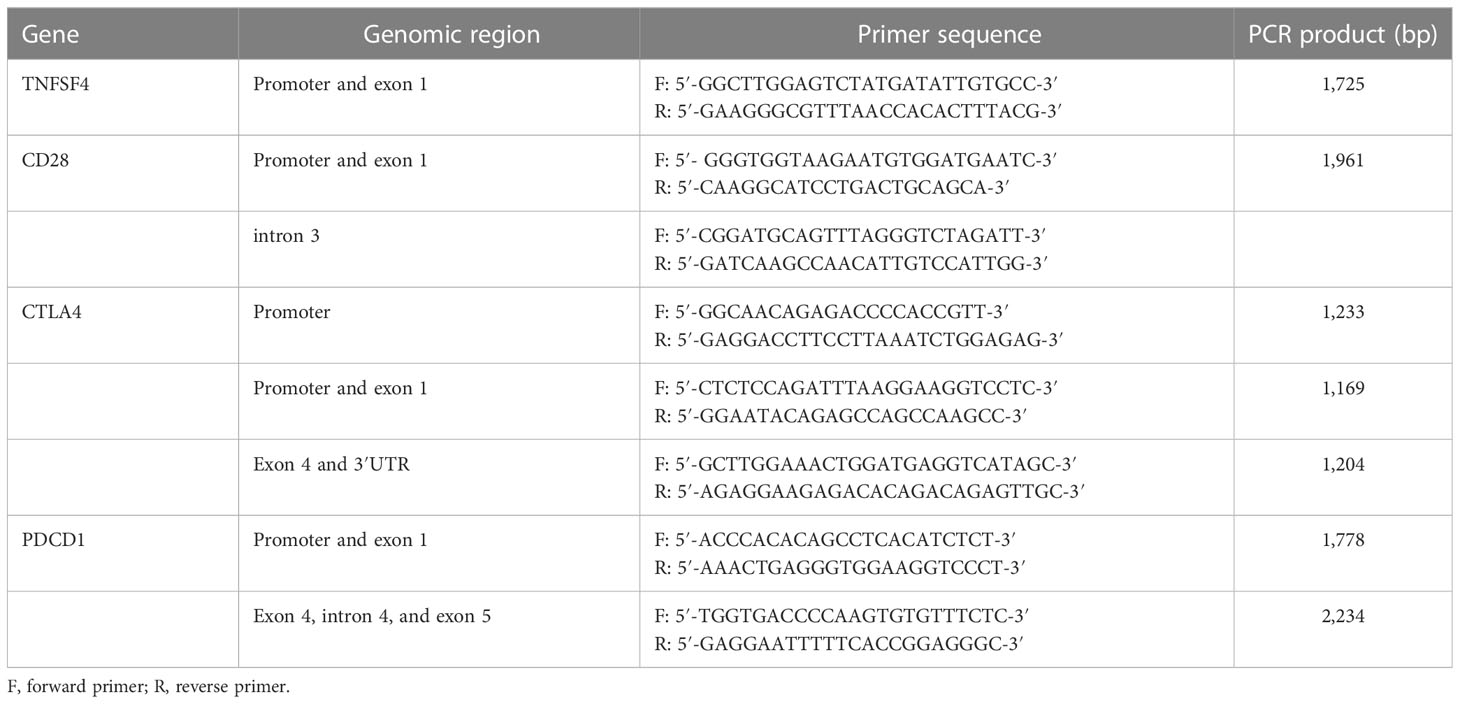
Table 1 The pairs of primers for amplifying the specific region of TNFSF4, CD28, CTLA4, and PDCD1 gene.
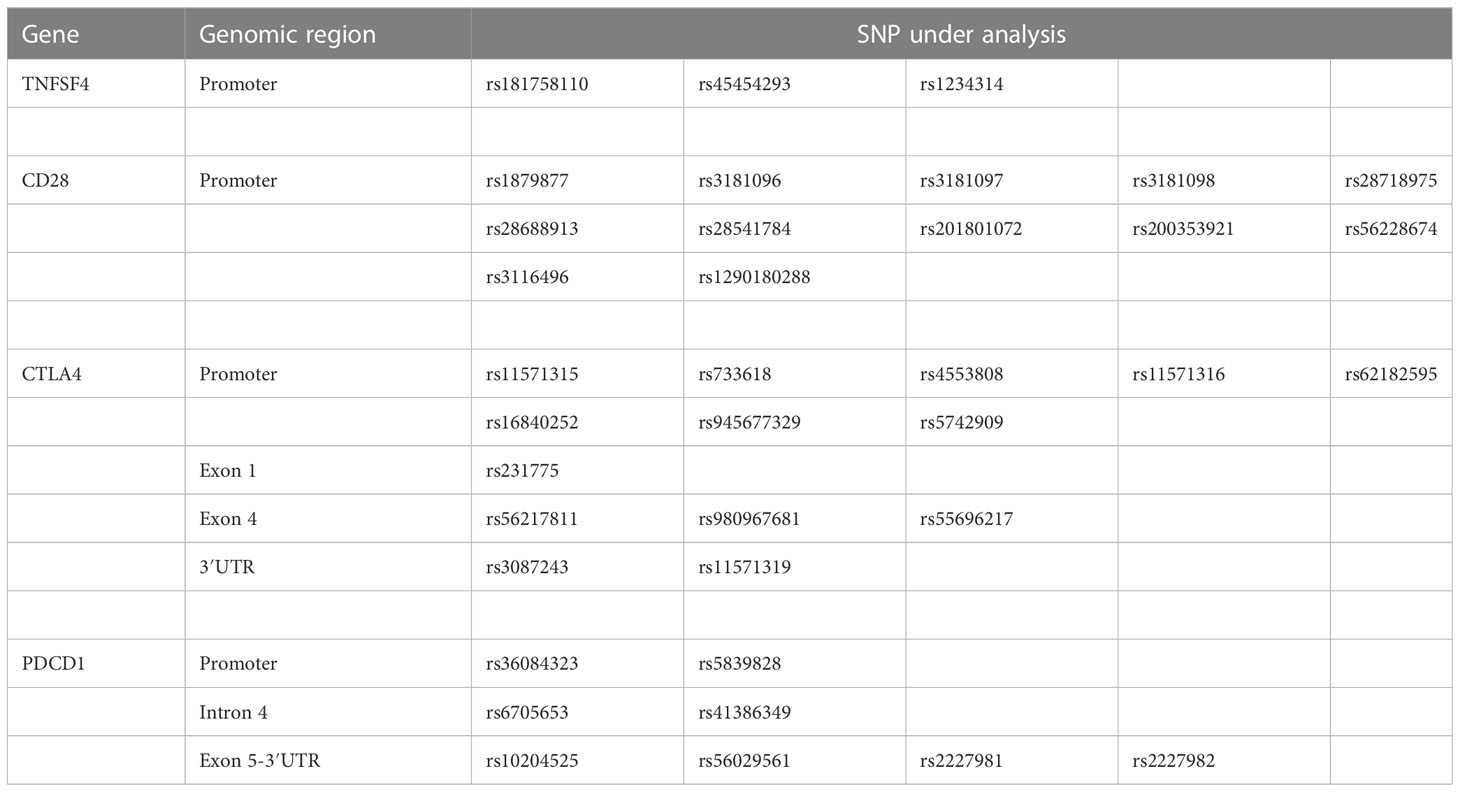
Table 2 The 37 target SNPs located in TNFSF4, CD28, CTLA4, and PDCD1 gene for analysis.
Statistical analysis
First, the Hardy–Weinberg equilibrium (HWE) was used to examine the allele frequencies of each SNP in the control group. For statistical analysis, the chi-square test and Fisher’s exact test were performed using SPSS17.0 software. The allele with the highest frequency in the population recruited for this study was designated as major allele “A” and the other as minor allele “a”. In genotype analysis, the homozygous of major allele (AA) was defined as reference, and the homozygous model (AA vs. aa), heterozygote model (AA vs. Aa), additive model (AA vs. Aa vs. aa), dominant model (AA vs. Aa + aa), and recessive model (AA + Aa vs. aa) were evaluated. The significance level was set at α = 0.05, and the odds ratio (OR) with 95% confidence interval (95% CI) was provided. D was used to estimate linkage disequilibrium (LD) by comparing the observed and expected frequency of a haplotype involved in alleles from different loci. Gabriel et al. (19) defined a haplotype block and ecluded haplotypes with a frequency of less than 1%. The figure of LD was generated using Haploview 4.2 (https://www.broadinstitute.org/haploview/haploview).
Results
In this study, 124 patients with RA were recruited, with 101 (81%) women and 23 men (19%). Their onset age was 45.69 ± 1.22 years old. Moreover, 100 people with no immune abnormalities were included in this study, with 74 (74%) women and 26 men (26%), and their average age was 32.1 ± 8.9 years old. The clinical characteristics of all patients are summarized in Table 3.
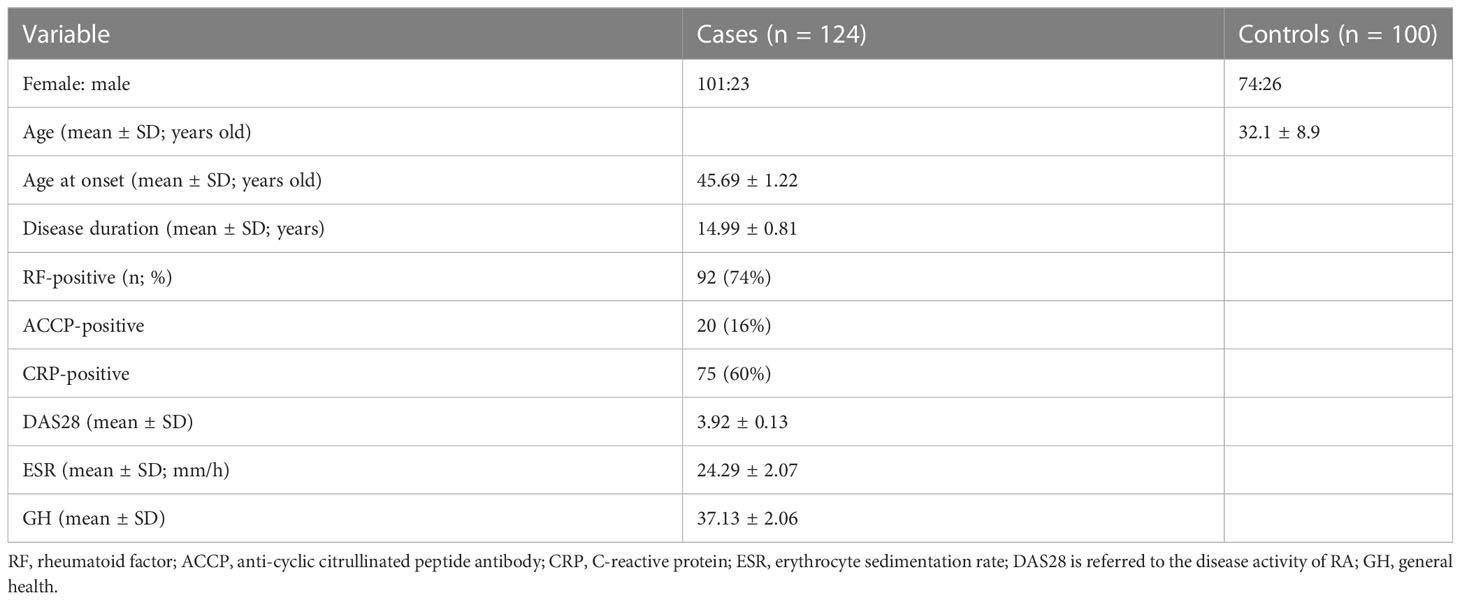
Table 3 The clinical characteristics of participants recruited in this study.
Hardy–Weinberg equilibrium
HWE equilibrium was used to determine whether the control group included could accurately represent the entire population. The findings revealed that rs28718975, rs28541784, rs201801072, rs200353921, and rs1290180288 of CD28 gene and rs945677329, rs56217811, rs980967681, and rs55696217 of CTLA4 gene deviated from HWE. Because subsequent analyses of these SNPs had low confidence, they were not analyzed and discussed (Table 4).
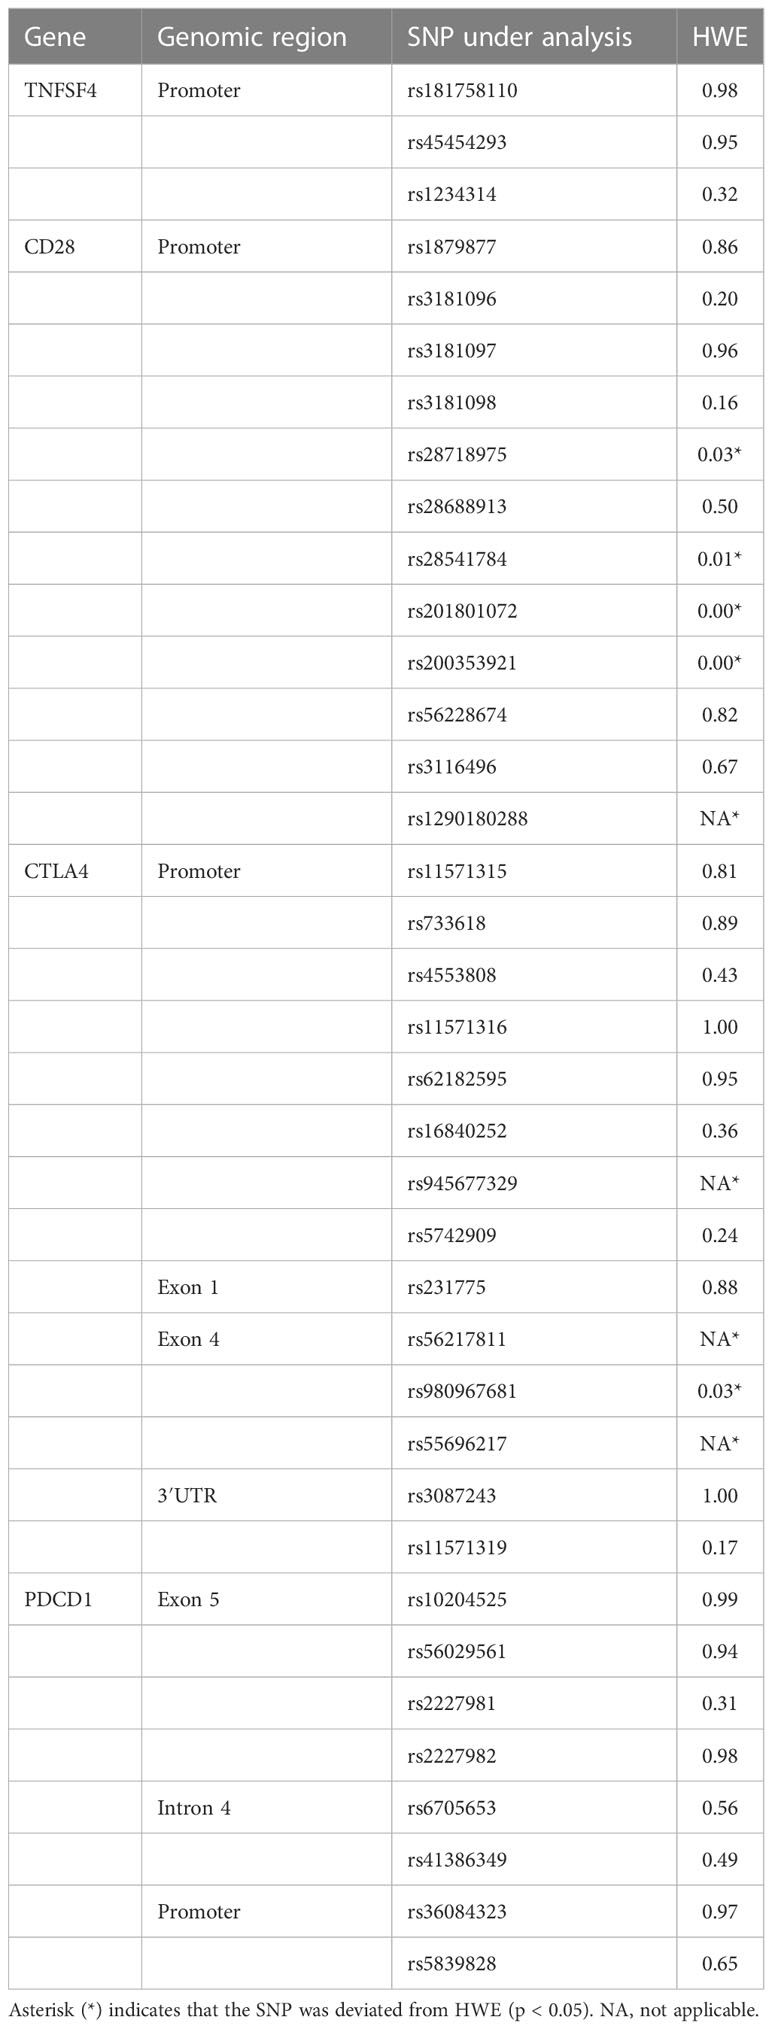
Table 4 The HWE analysis of each SNP from the control group.
The association between RA and SNPs
The genotype frequencies of SNPs located in four genes—TNFSF4, CD28, CTLA4, and PDCD1—were compared between patients with RA and healthy controls in this study. On the basis of the results, 13 SNPs were associated with RA. One was in the TNFSF4 gene, one in the CD28 gene, seven in the CTLA4 gene, and four in the PDCD1 gene (Table 5). The raw data are shown in Supplementary Tables 1–4.
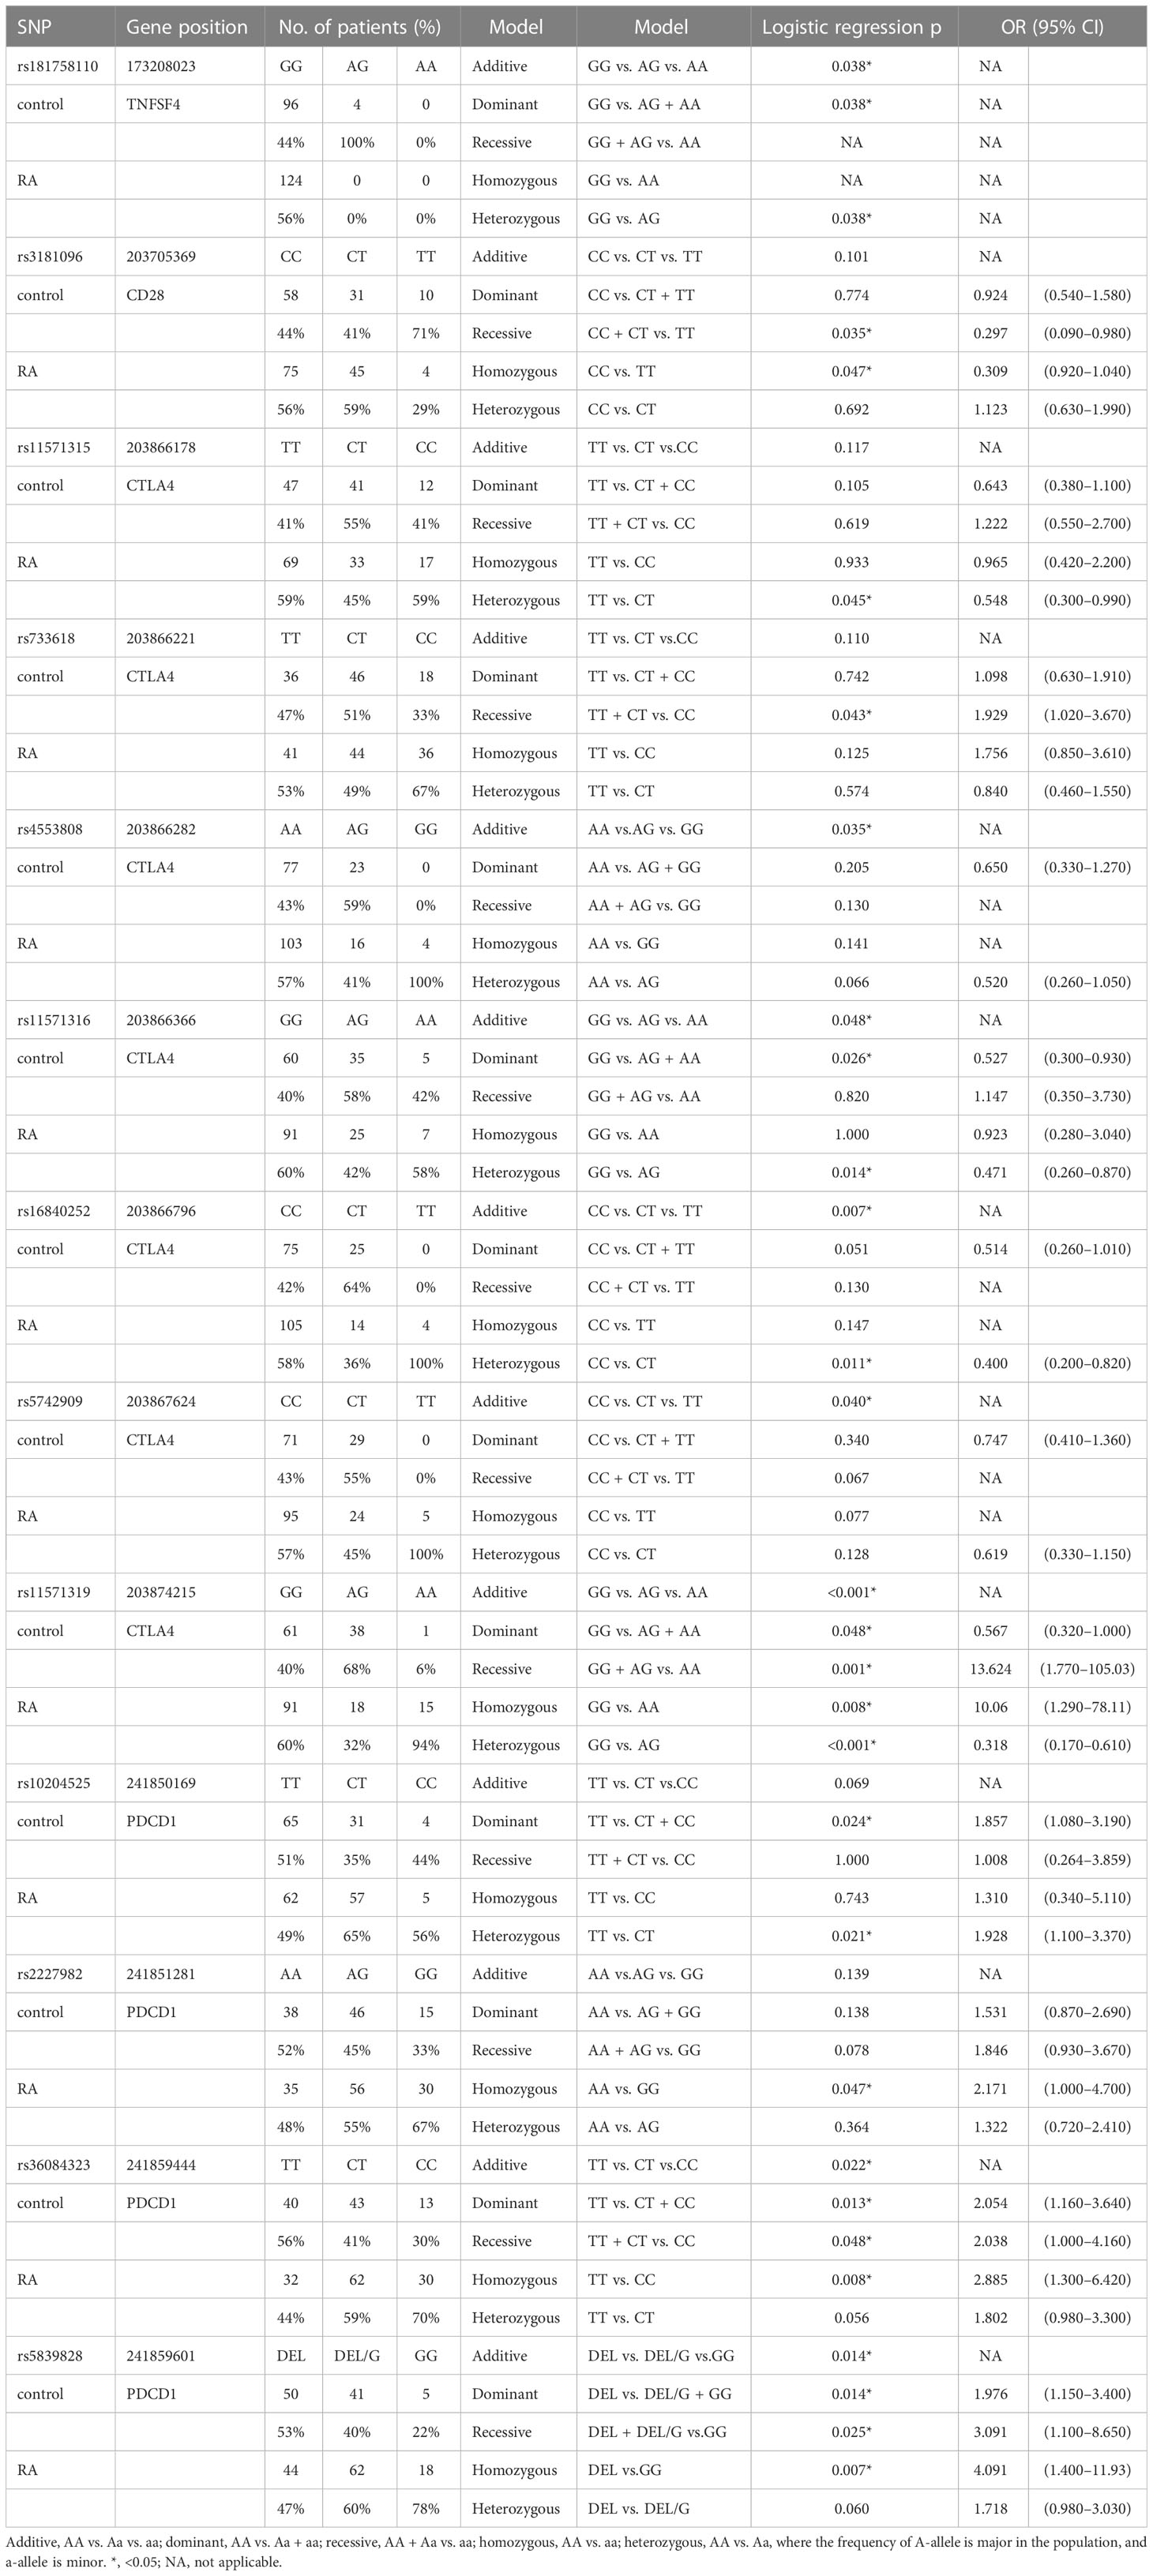
Table 5 The SNPs associated with RA.
The genotype frequency of rs181758110 in the TNFSF4 gene differed significantly between RA cases and healthy controls (CC vs. CT, p = 0.038). In rs181758110, all RA cases had the CC genotype. rs3181096 in the CD28 gene was associated with RA in the homozygous model (CC vs. TT, p = 0.047, OR = 0.309, 95% CI = 0.92–1.04) and recessive model (CC + CT vs. TT, p = 0.035, OR = 0.297, 95% CI = 0.09–0.98). This meant that people with TT genotype were less likely to develop RA than people with the CC genotype or at least one C allele (CC and CT). Thus, the C allele would be a risk allele for RA.
Only one of the seven significant SNPs in the CTLA4 gene, rs11571319, was in the 3′UTR, whereas the other six SNPs were in the promoter region. On the basis of the heterozygous model, rs11571315 was associated with RA (TT vs. CT, p = 0.045, OR = 0.548, 95% CI = 0.30–0.99). Subjects with the CT genotype in rs11571315 had a lower risk of developing RA. The rs733618 was associated with RA in a recessive model (TT + CT vs. CC, p = 0.043, OR = 1.929, 95% CI = 1.02–3.67), which meant that subjects carrying the CC genotype had a 1.929 times higher risk of developing RA than subjects carrying at least one T allele (CT and TT). The genotype frequency of rs4553808 was associated with RA based on the additive model (AA vs. AG vs. GG, p = 0.035). The rs11571316 was associated with RA based on the additive model (GG vs. AG vs. AA, p = 0.048), heterozygous model (GG vs. AG, p = 0.014, OR = 0.471, 95% CI = 0.26–0.87), and dominant model (GG vs. AG + AA, p = 0.026, OR = 0.527, 95% CI = 0.30–0.93). The rs16840252 was associated with RA based on the additive model (CC vs. CT vs. TT, p = 0.007) and heterozygous model (CC vs. CT, p = 0.011, OR = 0.400, 95% CI = 0.20–0.82). The genotype frequency of rs5742909 was associated with RA based on the additive model (CC vs. CT vs. TT, p = 0.040). rs11571319 in the 3′UTR was associated with RA based on all the analysis model. The genotypes of patients with RA and healthy controls differed significantly (GG vs. AG vs. AA, p < 0.001). In comparison with GG, subjects with AG had a lower risk of developing RA (OR = 0.318, 95% CI = 0.17–0.61, p < 0.001), whereas subjects with AA had a higher risk of developing RA (OR = 10.06, 95% CI = 1.29–78.11, p = 0.008). In addition, when compared with AG + GG, patients with AA had a higher risk of developing RA (OR = 13.624, 95% CI = 1.77–105.03, p = 0.001).
Four SNPs in the PDCD1 gene were associated with RA. rs10204525 was associated with RA based on the heterozygous model (TT vs. CT, OR = 1.928, 95% CI = 1.10–3.37, p = 0.021) and dominant model (TT vs. CT + CC, OR = 1.857, 95% CI = 1.08–3.19, p = 0.024). In comparison with the AA genotype, subjects with GG at rs2227982 had a 2.171 times increased risk of developing RA (95% CI = 1.00–4.70, p = 0.047). The genotype frequencies of rs36084323 were significantly different between RA cases and healthy controls based on the additive model (TT vs. CT vs. CC, p = 0.022), dominant model (TT vs. CT + CC, OR = 2.054, 95% CI = 1.16–3.64, p = 0.013), recessive model (TT + CT vs. CC, OR = 2.038, 95% CI = 1.00–4.16, p = 0.048), and homozygous model (TT vs. CC, OR = 2.885, 95% CI = 1.30–6.42, p = 0.008). Furthermore, the genotype frequencies of rs5839828 were significantly different between RA cases and healthy controls based on the additive model (DEL vs. DEL/G vs. GG, p = 0.014), dominant model (DEL vs. DEL/G + GG, OR = 1.976, 95% CI = 1.15–3.40, p = 0.014), recessive model (DEL + DEL/G vs. GG, OR = 3.091, 95% CI = 1.10–8.56, p = 0.025), and homozygous model (DEL vs. GG, OR = 4.091, 95% CI = 1.40–11.93, p = 0.007).
Linkage disequilibrium and haplotype analysis
RA may be associated with a specific haplotype because of the differences in prevalence and susceptible SNPs in different populations. Therefore, the haplotype analysis was performed after the SNP analysis.
In LD analysis, the red color in the box indicates that two SNPs have strong linkage, whereas the less the linkage, the closer to the white color of the box, and the light purple indicates no linkage. In addition, the high LD region is referred to as a haplotype block. According to Figure 1, there was one haplotype in the CD28 gene, composed of rs3181096, rs3181097, and rs3181098; one haplotype in the CTLA4 gene, composed of rs11571316, rs62182595, rs16840252, rs5742909, rs231775, and rs3087243; and one haplotype in the PDCD1 gene, composed of rs6705653 and rs41386349. After excluding the haplotypes with frequency less than 1%, it was found that 10 different types of haplotypes were statistically associated with RA (GATCAG—OR = 0.415, 95% CI = 0.197–0.874, p = 0.018; GATCGG and GATTGG—OR = 0.362, 95% CI = 0.148–0.885, p = 0.022; GGCCAG—OR = 0.547, 95% CI = 0.320–0.936, p = 0.027; GGCCGG—OR = 0.468, 95% CI = 0.224–0.976, p = 0.040; GGTCAG and GGTTAG—OR = 0.415, 95% CI = 0.197–0.874, p = 0.018; GGTTGG—OR = 0.337, 95% CI = 0.139–0.817, p = 0.013; AGCCAG—OR = 0.531, 95% CI = 0.285–0.991, p = 0.045; AGCCGG—OR = 0.416, 95% CI = 0.215–0.805, p = 0.008; Table 6).
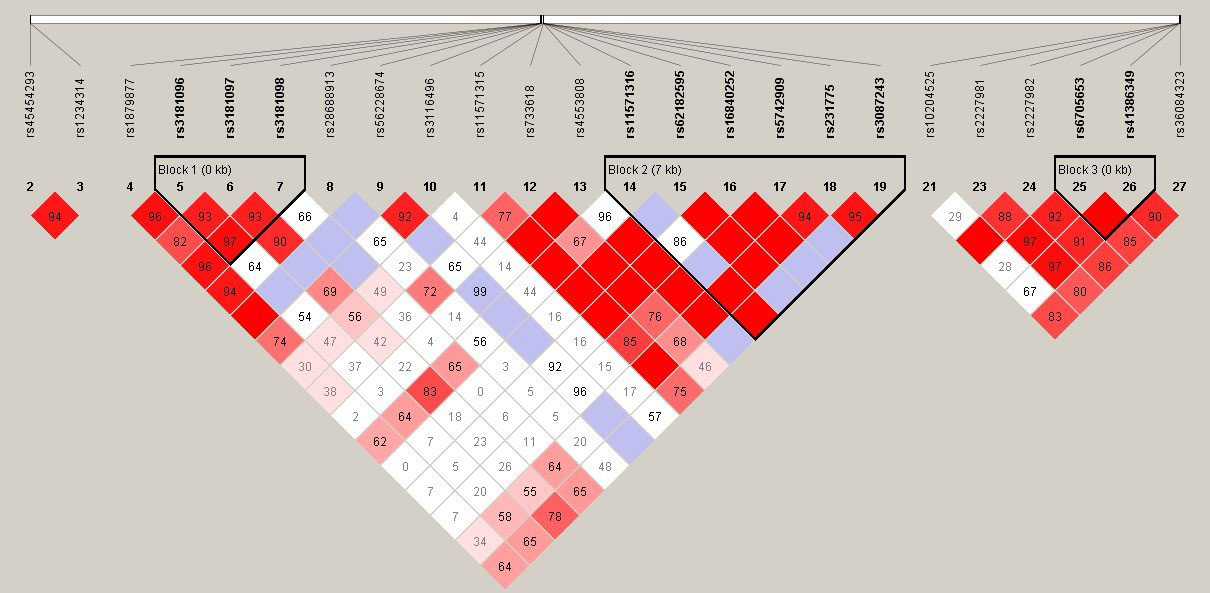
Figure 1 Linkage disequilibrium (LD) plot of TNFSF4, CD28, CTLA4, and PDCD1 gene. There was each one haplotype bolck in CD28, CTLA4, and PDCD1 gene. The CD28 haplotype contained rs3181096, rs3181097, and rs3181098. The CTLA4 haplotype contained rs11571316, rs62182595, rs16840252, rs5742909, rs231775, and rs3087243. The PDCD1 haplotype contained rs6705653and rs41386349.
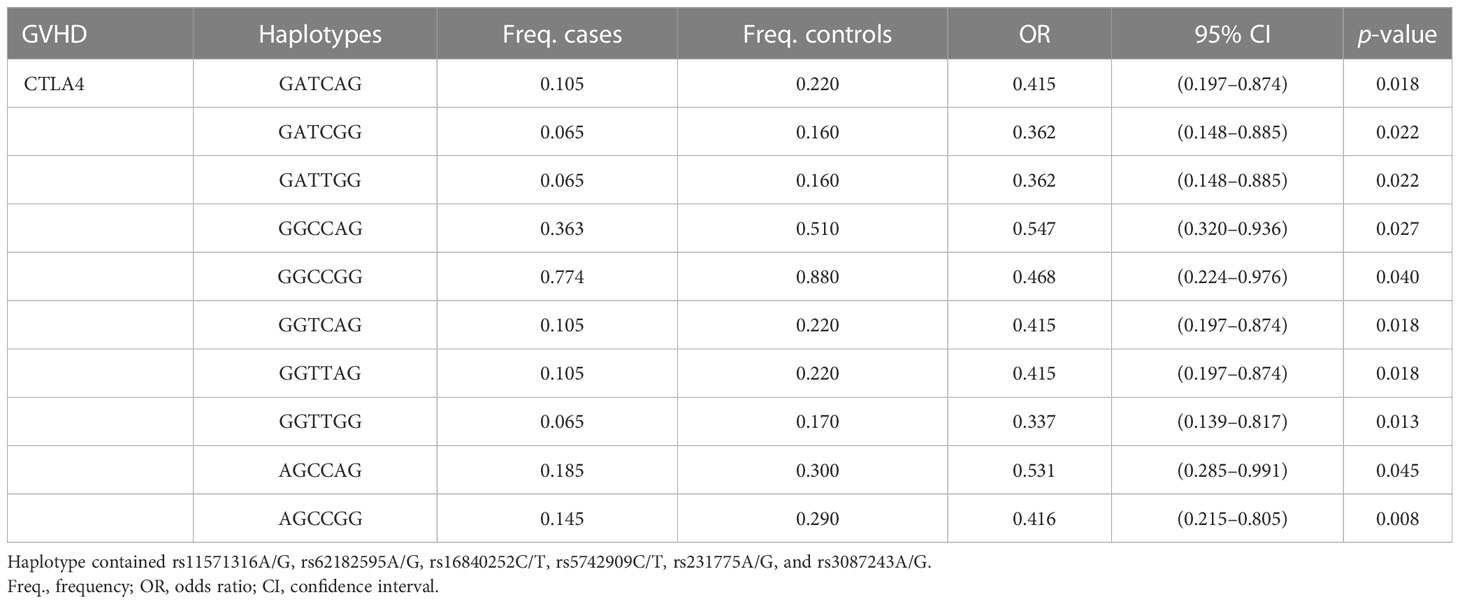
Table 6 The haplotypes associated with RA.
The association between antibodies and SNPs
In addition to investigating the association between SNPs and the development of RA, the association between SNPs and immunological parameters was also been explored. There were three SNPs associated with rheumatoid factor (RF), one SNP associated with anti-cyclic citrullinated peptide antibody (ACCP), and eight SNPs associated with C-reactive protein (CRP) (Table 7). The raw data are shown in Supplementary Tables 5–7.
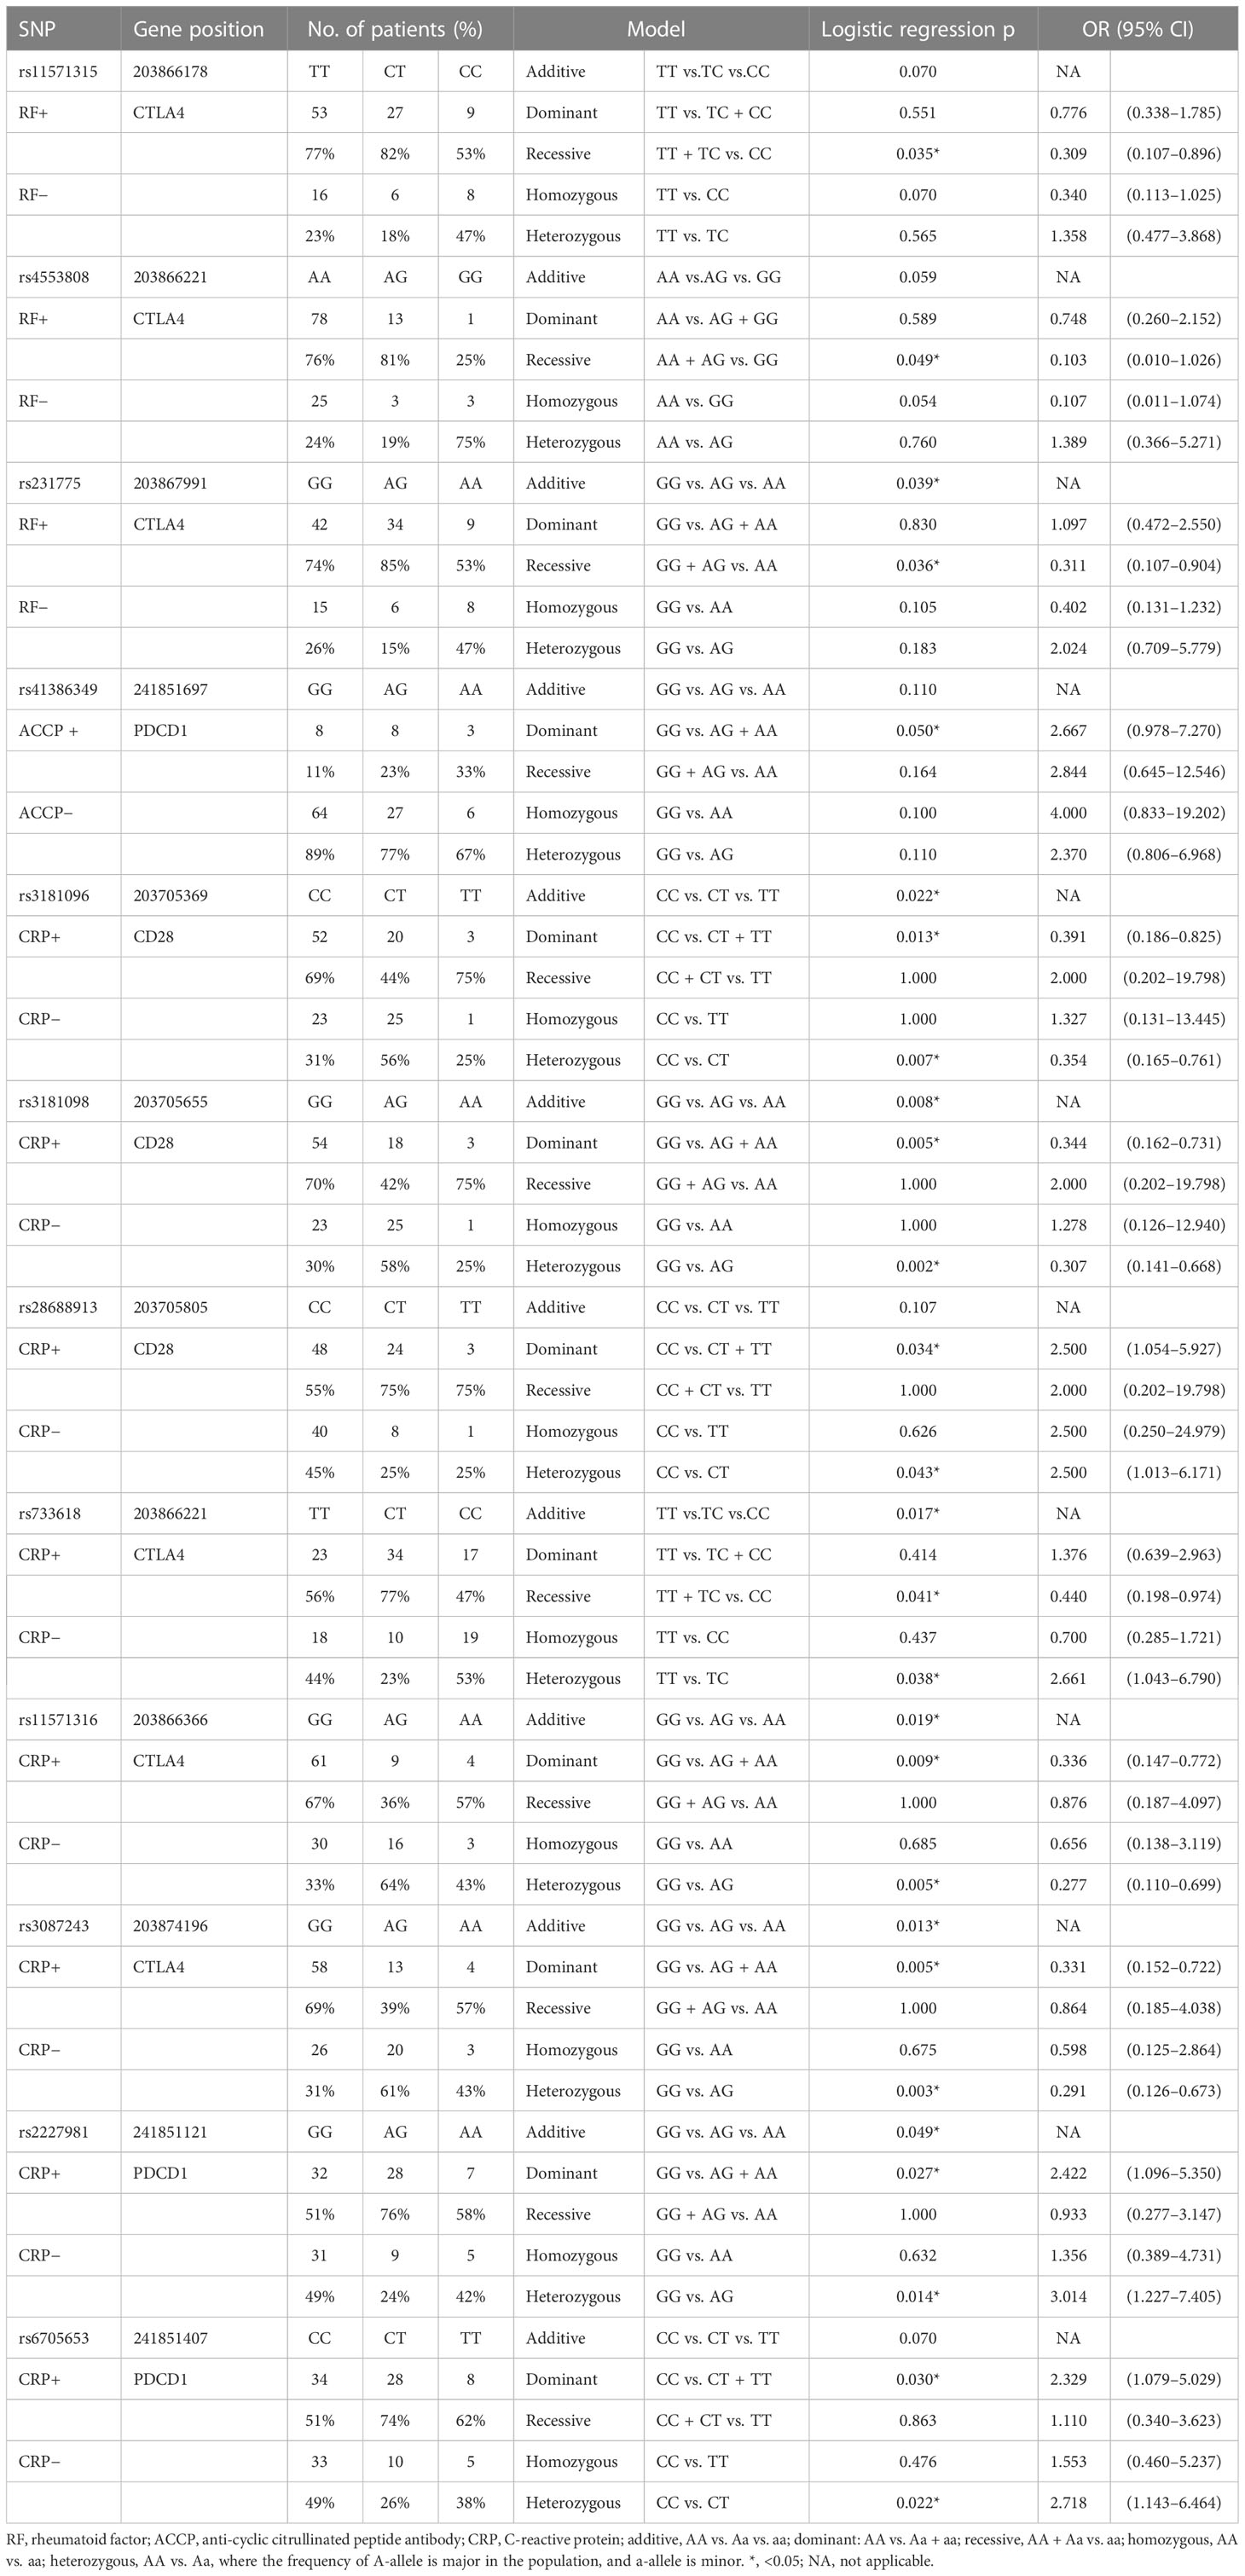
Table 7 The SNPs associated with the presence of RF, ACCP, and CRP.
The three SNPs associated with the presence of RA were in the CTLA4 gene. rs11571315 was associated with RF based on the recessive model (TT + TC vs. CC, OR = 0.309, 95% CI = 0.107–0.896, p = 0.035), which meant that the patients with CC genotype in rs11571315 had a lower odds of RF compared to the patients with at least one T-allele (TT and TC). rs4553808 was associated with RF based on the recessive model (AA + AG vs. GG, OR = 0.103, 95% CI = 0.010–1.026, p = 0.049). rs231775 was associated with RF based on the additive model (GG vs. AG vs. AA, p = 0.039) and recessive model (GG + AG vs. AA, OR = 0.311, 95% CI = 0.107–0.904, p = 0.036).
rs41386349 of the PDCD1 gene was associated with ACCP based on the dominant model (GG vs. AG + AA, OR = 2.667, 95% CI = 0.978–7.270, p = 0.05). Compared to the GG genotype, patients with RA with at least one A-allele in rs41386349 had 2.667 times of odds of ACCP.
There were three SNPs of the CD28 gene, three SNPs of the CTLA4 gene, and two SNPs of the PDCD1 gene associated with CRP. rs3181096 of the CD28 gene was associated with CRP based on the additive model (CC vs. CT vs. TT, p = 0.022), dominant model (CC vs. CT + TT, OR = 0.391; 95% CI = 0.186–0.825, p = 0.013), and heterozygous model (CC vs. CT, OR = 0.354; 95% CI = 0.165–0.761, p = 0.007). rs3181098 of the CD28 gene was associated with CRP based on the additive model (GG vs. AG vs. AA, p = 0.008), dominant model (GG vs. AG + AA, OR = 0.344; 95% CI = 0.162–0.731, p = 0.005), and heterozygous model (GG vs. AG, OR = 0.307; 95% CI = 0.141–0.668, p = 0.002). rs28688913 of the CD28 gene was associated with CRP based on the dominant model (CC vs. CT + TT, OR = 2.500; 95% CI = 1.054–5.927, p = 0.034), and heterozygous model (CC vs. CT, OR = 2.500, 95% CI = 1.013–6.171, p = 0.043). rs733618 of the CTLA4 gene was associated with CRP based on the additive model (TT vs. CT vs. CC, p = 0.017), recessive model (TT + CT vs. CC, OR = 0.440; 95% CI = 0.198–0.974, p = 0.041), and heterozygous model (TT vs. CT, OR = 2.661; 95% CI = 1.043–6.790, p = 0.038). rs11571316 of the CTLA4 gene was associated with CRP based on the additive model (GG vs. AG vs. AA, p = 0.019), dominant model (GG vs. AG + AA, OR = 0.336; 95% CI = 0.147–0.772, p = 0.009), and heterozygous model (GG vs. AG, OR = 0.277; 95% CI = 0.110–0.699, p = 0.005). rs3087243 of the CTLA4 gene was associated with CRP based on the additive model (GG vs. AG vs. AA, p = 0.013), dominant model (GG vs. AG + AA, OR = 0.331; 95% CI = 0.152–0.722, p = 0.005), and heterozygous model (GG vs. AG, OR = 0.291; 95% CI = 0.126–0.673, p = 0.003). rs2227981 of the PDCD1 gene was associated with CRP based on the additive model (GG vs. AG vs. AA, p = 0.049), dominant model (GG vs. AG + AA, OR = 2.422; 95% CI = 1.096–5.350, p = 0.027), and heterozygous model (GG vs. AG, OR = 3.014; 95% CI = 1.227–7.405, p = 0.014). rs6705653 of the PDCD1 gene was associated with CRP based on the dominant model (GG vs. AG + AA, OR = 2.329; 95% CI = 1.079–5.029, p = 0.030) and heterozygous model (GG vs. AG, OR = 2.718; 95% CI = 1.1143–66.464, p = 0.022).
Discussion
SNP analysis revealed that one SNP of the TNFSF4 gene, seven SNPs of the CTLA4 gene, one SNP of the CD28 gene, and four SNPs of the PDCD1 gene were associated with the onset of RA. We also investigated the association between the SNPs and immunological parameters of patients with RA. It is well known that RF and anti-citrullinated protein antibodies (ACPA) are the characteristic autoantibodies of RA. ACCP is a subset of ACPA, which has been demonstrated that it has 65%–80% sensitivity and up to 98% specificity for RA (20). CRP plays a vital role in inflammatory response. A study showed that it had a positive correlation with the severity of RA (21). Other clinical data, such as disease activity score, disease activity score by 28 joints (DAS28), and erythrocyte sedimentation rate (ESR), are dynamic according to the disease process; thus, they would not be analyzed.
We found that rs181758110 in the promoter region of the TNFSF4 gene was associated with RA, and no SNPs of the TNFSF4 gene were associated with the characteristic autoantibodies of RA, which denotes that rs181758110 of the TNFSF4 gene may not be a major SNP that contributed to the pathogenesis of RA. There is currently no relevant research on this SNP, and its function needs to be verified.
rs3181096 in the CD28 gene promoter region was associated with RA and CRP in our results. rs3181096 had been previously associated with other ADs and cancers, such as type 1 diabetes (22) and childhood acute lymphoblastic leukemia (23) in addition to RA (24), suggesting that it may play an important role in immune response. Furthermore, there were two SNPs of the CD28 gene were associated with CRP: rs3181098 and rs28688913. Our previous study showed that rs3181098 had association with graft-versus-host disease (GVHD) of post–hematopoietic stem cell transplantation (HSCT) in acute leukemia patients (25). Minculescu et al. (26) showed that CRP level could be a valid predictor of the development of steroid-refractory disease in patients who develop severe GVHD after HSCT. Thus, rs3181098 may influence the production of CRP, thereby developing GVHD.
Results showed that rs11571315 was not only associated with the onset of RA but also is RF-positive. However, after a thorough search of the literature, it was found that no other team has yet discovered the correlation between rs11571315 and RA, suggesting that rs11571315 was the RA-associated SNP specific to the Taiwan population. However, rs11571315 was susceptible to other immune disorders, such as transfusion reactions (27) and polycystic ovary syndrome (28). We found that rs733618 was associated with RA and CRP, indicating that it may involve in the inflammatory response of RA. In addition, rs733618 was recently found to be associated with the onset of RA (29) as well as Graves’ disease (30, 31) and non–small cell lung cancer (32). Similar to rs11571315, rs4553808 was associated with the onset of RA and was RF-positive. Furthermore, rs4553808 was associated with RA (29), several ADs (33–35), cancers (36, 37), and transplant prognosis (38, 39). Similar to rs733618, rs11571316 was associated with RA and CRP in our results. The literature showed that rs11571316 may increase the susceptibility of cervical cancer by increasing the expression level of the CTLA4 (40); we indicated that rs11571316 involved in RA pathogenesis and inflammatory response may result from upregulating the CTLA4 expression. rs5742909 was a common SNP in RA, which has been previously related RA in Spain, Korea, and Egypt populations (41). rs5742909 has already been reported as functional, and the SNP mutation in the rs5742909 loci would affect the expression level of CTLA4 mRNA and protein (42, 43). rs16840252 was associated with RA in our result, but it showed no association in Chinese Han population (44). Identically, the literature (44) showed that rs16840252 was related to RF, but it had no significance in our results. This may emphasize that RA is influenced by other factor, such as the environment. Recently, Aslam et al. (45) observed a novel correlation of rs11571319 to RA in the Pakistani popuation. Before that, rs11571319 has not been reported previously related to RA risk, and it had just been reported to be susceptible to primary biliary cirrhosis (46), asthma (47), and so on.Regarding the PDCD1 gene, there is currently no literature on the association between rs5839828 and diseases, but another significant SNP of this gene, rs36084323, was associated with the risk of RA (48) and cancers (49). These two SNPs were discovered in the PDCD1 gene promoter region. If the allele in rs36084323 was G, then the promoter activity of the PDCD1 gene would be significantly higher than if the allele was A (50) and GG genotype of rs36084323 would had higher mRNA level of PDCD1 compared to AA genotype (48), which indicates that rs36084323 may involve in the development of RA through affecting the transcription level of PDCD1. rs2227982 and rs10204525 were discovered in the exon 5 region. Although there was no literature about the association between these two SNPs and RA, the GG genotype of rs2227982 and the CC genotype of rs10204525 were protective factors for hepatitis B virus infection (51), and the CT genotype of rs10204525 was associated with juvenile idiopathic arthritis (52), suggesting that these SNPs may play a role in inflammation or infection.
Moreover, haplotype analysis revealed six SNPs with high LD in the CTLA4 gene, including rs11571316, rs62182595, rs16840252, rs5742909, rs23177, and rs3087243. These six SNPs were found to be significantly associated with RA in several haplotypes. Although rs62182595, rs231775, and rs3087243 did not show a statistically significant association in individual SNP analysis, they did in haplotype analysis. This suggested that there could be an interaction between these SNPs that cause RA. Thus, the function of the RA-predisposing CTLA4 haplotype needs to be investigated further.
Following a review of the literature, it was found that these RA-associated SNPs were also related to other ADs and cancers, suggesting that these SNPs play a vital role in the immune response. In addition, we found that the association of several SNPS with RA risk was dependent on RF, ACCP, and CRP status. These immune regulatory genes are involved in the regulation of T-cell activation (6), and most of the aforementioned SNPs were found in the promoter region and 3′UTR, suggesting that these significant SNPs may affect transcription factor binding sites or interfere with mRNA stability, resulting in gene expression alterations that lead to disease (53, 54). In the future, it should be investigated whether SNP variation directly affects gene expression or protein function and leads to abnormal CD4 T-cell function to determine the role of these SNPs of immune regulatory genes in the pathogenesis of RA.
Limitation
In this study, we did not thoroughly investigate the entire genome. Because T-cell activation is regulated by the additive effect of co-stimulatory and co-inhibitory molecules and promoter SNPs can affect gene expression, the promoter region of genes was extensively discussed in this paper. Furthermore, the hot SNPs from many kinds of literature about ADs or cancers were selected as candidate SNPs for discussion.
Data availability statement
The datasets presented in this study can be found in online repositories. The names of the repository/repositories and accession number(s) can be found in the article/Supplementary Material.
Ethics statement
The studies involving human participants were reviewed and approved by institutional review board (IRB) of Chang Gung Memorial Hospital (CGMH; IRB no. 202002097B0 and 202102018B0C601). The patients/participants provided their written informed consent to participate in this study.
Author contributions
D-PC conceived and designed the experiments. Y-HW reviewed and wrote the final draft. W-TL and FP-H performed the experiments and analyzed and interpreted data. K-HY wrote draft of the manuscript and provided samples. All authors read and approved the final manuscript.
Funding
This study was supported by grants to D-PC from the Ministry of Science and Technology (110-2320-B-182A-007) and Chang Gung Memorial Hospital (CMRPG3N0021). The funders had no role in study design, data collection and analysis, decision to publish, or preparation of the manuscript.
Conflict of interest
The authors declare that the research was conducted in the absence of any commercial or financial relationships that could be construed as a potential conflict of interest.
Publisher’s note
All claims expressed in this article are solely those of the authors and do not necessarily represent those of their affiliated organizations, or those of the publisher, the editors and the reviewers. Any product that may be evaluated in this article, or claim that may be made by its manufacturer, is not guaranteed or endorsed by the publisher.
Supplementary material
The Supplementary Material for this article can be found online at: https://www.frontiersin.org/articles/10.3389/fimmu.2023.1123832/full#supplementary-material
References
1. Cross M, Smith E, Hoy D, Carmona L, Wolfe F, Vos T, et al. The global burden of rheumatoid arthritis: estimates from the global burden of disease 2010 study. Ann Rheum Dis (2014) 73:1316–22. doi: 10.1136/annrheumdis-2013-204627
2. MacGregor AJ, Snieder H, Rigby AS, Koskenvuo M, Kaprio J, Aho K, et al. Characterizing the quantitative genetic contribution to rheumatoid arthritis using data from twins. Arthritis Rheumatol (2000) 43:30–7. doi: 10.1002/1529-0131(200001)43:1<30::AID-ANR5>3.0.CO;2-B
3. Kurkó J, Besenyei T, Laki J, Glant TT, Mikecz K, Szekanecz Z. Genetics of rheumatoid arthritis - a comprehensive review. Clin Rev Allergy Immunol (2013) 45:170–9. doi: 10.1007/s12016-012-8346-7
4. Bluestone JA, Bour-Jordan H, Cheng M, Anderson M. T Cells in the control of organ-specific autoimmunity. J Clin Invest (2015) 125:2250–60. doi: 10.1172/JCI78089
5. Dornmair K, Goebels N, Weltzien HU, Wekerle H, Hohlfeld R. T-Cell-mediated autoimmunity: novel techniques to characterize autoreactive T-cell receptors. Am J Pathol (2003) 163:1215–26. doi: 10.1016/S0002-9440(10)63481-5
6. Gough SC, Simmonds MJ. The HLA region and autoimmune disease: associations and mechanisms of action. Curr Genomics (2007) 8:453–65. doi: 10.2174/138920207783591690
7. Kobata T, Azuma M, Yagita H, Okumura K. Role of costimulatory molecules in autoimmunity. Rev Immunogenet (2000) 2:74–80.
8. Webb GJ, Hirschfield GM, Lane PJ. OX40, OX40L and autoimmunity: a comprehensive review. Clin Rev Allergy Immunol (2016) 50:312–32. doi: 10.1007/s12016-015-8498-3
9. Luo X, Miller SD, Shea LD. Immune tolerance for autoimmune disease and cell transplantation. Annu Rev BioMed Eng (2016) 18:181–205. doi: 10.1146/annurev-bioeng-110315-020137
10. Porciello N, Kunkl M, Tuosto L. CD28 between tolerance and autoimmunity: the side effects of animal models. F1000Res (2018) 7:682. doi: 10.12688/f1000research.14046.1
11. Parry RV, Chemnitz JM, Frauwirth KA, Lanfranco AR, Braunstein I, Kobayashi SV, et al. CTLA-4 and PD-1 receptors inhibit T-cell activation by distinct mechanisms. Mol Cell Biol (2005) 25:9543–53. doi: 10.1128/MCB.25.21.9543-9553.2005
12. Fu Y, Lin Q, Zhang Z, Zhang L. Therapeutic strategies for the costimulatory molecule OX40 in T-cell-mediated immunity. Acta Pharm Sin B (2020) 10:414–33. doi: 10.1016/j.apsb.2019.08.010
13. Esensten JH, Helou YA, Chopra G, Weiss A, Bluestone JA. CD28 costimulation: from mechanism to therapy. Immunity (2016) 44:973–88. doi: 10.1016/j.immuni.2016.04.020
14. Sobhani N, Tardiel-Cyril DR, Davtyan A, Generali D, Roudi R, Li Y. CTLA-4 in regulatory T cells for cancer immunotherapy. Cancers (Basel) (2021) 13(6):1440. doi: 10.3390/cancers13061440
15. Yu X, Gao R, Li Y, Zeng C. Regulation of PD-1 in T cells for cancer immunotherapy. Eur J Pharmacol (2020) 881:173240. doi: 10.1016/j.ejphar.2020.173240
16. Aletaha D, Neogi T, Silman AJ, Funovits J, Felson DT, Bingham CO, et al. Rheumatoid arthritis classification criteria: an American college of Rheumatology/European league against rheumatism collaborative initiative. Arthritis Rheum (2010) 62:2569–81. doi: 10.1002/art.27584
17. Edner NM, Carlesso G, Rush JS, Walker LSK. Targeting co-stimulatory molecules in autoimmune disease. Nat Rev Drug Discovery (2020) 19:860–83. doi: 10.1038/s41573-020-0081-9
18. Robert F, Pelletier J. Exploring the impact of single-nucleotide polymorphisms on translation. Front Genet (2018) 9:507. doi: 10.3389/fgene.2018.00507
19. Gabriel SB, Schaffner SF, Nguyen H, Moore JM, Roy J, Blumenstiel B, et al. The structure of haplotype blocks in the human genome. Science (2002) 296:2225–9. doi: 10.1126/science.1069424
20. Avouac J, Gossec L, Dougados M. Diagnostic and predictive value of anti-cyclic citrullinated protein antibodies in rheumatoid arthritis: a systematic literature review. Ann Rheum Dis (2006) 65:845–51. doi: 10.1136/ard.2006.051391
21. Orr CK, Najm A, Young F, McGarry T, Biniecka M, Fearon U, et al. The utility and limitations of CRP, ESR and DAS28-CRP in appraising disease activity in rheumatoid arthritis. Front Med (Lausanne) (2018) 5:185. doi: 10.3389/fmed.2018.00185
22. Ferjeni Z, Bouzid D, Fourati H, Stayoussef M, Abida O, Kammoun T, et al. Association of TCR/CD3, PTPN22, CD28 and ZAP70 gene polymorphisms with type 1 diabetes risk in Tunisian population: family based association study. Immunol Lett (2015) 163(1):1–7. doi: 10.1016/j.imlet.2014.11.005
23. Chang JS, Wiemels JL, Chokkalingam AP, Metayer C, Barcellos LF, Hansen HM, et al. Genetic polymorphisms in adaptive immunity genes and childhood acute lymphoblastic leukemia. Cancer Epidemiol Biomarkers Prev (2010) 19:2152–63. doi: 10.1158/1055-9965.EPI-10-0389
24. González-Recio O, de Maturana EL, Vega AT, Engelman CD, Broman KW. Detecting single-nucleotide polymorphism by single-nucleotide polymorphism interactions in rheumatoid arthritis using a two-step approach with machine learning and a Bayesian threshold least absolute shrinkage and selection operator (LASSO) model. BMC Proc (2009) 3:S63. doi: 10.1186/1753-6561-3-s7-s63
25. Chen DP, Chang SW, Wang PN, Lin WT, Hsu FP, Wang WT, et al. The association between single-nucleotide polymorphisms of co-stimulatory genes within non-HLA region and the prognosis of leukemia patients with hematopoietic stem cell transplantation. Front Immunol (2021) 12:730507. doi: 10.3389/fimmu.2021.730507
26. Minculescu L, Kornblit BT, Friis LS, Schiødt I, Petersen SL, Andersen NS, et al. C-reactive protein levels at diagnosis of acute graft-versus-host disease predict steroid-refractory disease, treatment-related mortality, and overall survival after allogeneic hematopoietic stem cell transplantation. Biol Blood Marrow Transplant (2018) 24(3):600–7. doi: 10.1016/j.bbmt.2017.10.025
27. Wen YH, Lin WT, Wang WT, Chiueh TS, Chen DP. Association of CTLA4 gene polymorphism with transfusion reaction after infusion of leukoreduced blood component. J Clin Med (2019) 8:1961. doi: 10.3390/jcm8111961
28. Abdul-Jabbar RAA. Significance of CTL4 gene polymorphisms in susceptibility to polycystic ovary syndrome of Iraqi women. Ann RSCB (2021) 25:6624–32.
29. Mukhtar M, Sheikh N, Suqaina SK, Saleem T, Mehmood R, Khawar MB. Genetic susceptibility of cytotoxic T lymphocyte-associated antigen 4 gene polymorphism in the onset of arthritis. medRxiv (2021) 04:27 :21255970. doi: 10.1101/2021.04.27.21255970
30. Chen DP, Chu YC, Wen YH, Lin WT, Hour AL, Wang WT. Investigation of the correlation between graves' ophthalmopathy and CTLA4 gene polymorphism. J Clin Med (2019) 8:1842. doi: 10.3390/jcm8111842
31. Chen PL, Fann CS, Chang CC, Wu IL, Chiu WY, Lin CY, et al. Family-based association study of cytotoxic T-lymphocyte antigen-4 with susceptibility to graves' disease in han population of Taiwan. Genes Immun (2008) 9:87–92. doi: 10.1038/sj.gene.6364445
32. Chen S, Wang Y, Chen Y, Lin J, Liu C, Kang M, et al. Investigation of cytotoxic T-lymphocyte antigen-4 polymorphisms in non-small cell lung cancer: a case-control study. Oncotarget (2017) 8:76634–43. doi: 10.18632/oncotarget.20638
33. Kaykhaeia M, Moghadamb H, Dabiric S, Salimidg S, Jahantighb D, Tamandani DMK, et al. Association of CTLA4 (rs4553808) and PTPN22 (rs2476601) gene polymorphisms with hashimoto's thyroiditis disease: a case-control study and an in-silico analysis. Meta Gene (2020) 24:100693. doi: 10.1016/j.mgene.2020.100693
34. Yousefipour G, Erfani N, Momtahan M, Moghaddasi H, Ghaderi A. CTLA4 exon 1 and promoter polymorphisms in patients with multiple sclerosis. Acta Neurol Scand (2009) 120:424–9. doi: 10.1111/j.1600-0404.2009.01177.x
35. Bouqbis L, Izaabel H, Akhayat O, Pérez-Lezaun A, Calafell F, Bertranpetit J, et al. Association of the CTLA4 promoter region (-1661G allele) with type 1 diabetes in the south Moroccan population. Genes Immun (2003) 4:132–7. doi: 10.1038/sj.gene.6363933
36. Fang M, Huang W, Mo D, Zhao W, Huang R. Association of five SNPs in cytotoxic T-lymphocyte antigen 4 and cancer susceptibility: evidence from 67 studies. Cell Physiol Biochem (2018) 47:414–27. doi: 10.1159/000489953
37. Li J, Wang W, Sun Y, Zhu Y. CTLA-4 polymorphisms and predisposition to digestive system malignancies: a meta-analysis of 31 published studies. World J Surg Oncol (2020) 18:55. doi: 10.1186/s12957-020-1806-2
38. Guo Y, Guo F, Wei C, Qiu J, Liu Y, Fang Y, et al. CTLA4 gene polymorphisms influence the incidence of infection after renal transplantation in Chinese recipients. PloS One (2013) 8:e70824. doi: 10.1371/journal.pone.0070824
39. Jagasia M, Clark WB, Brown-Gentry KD, Crawford DC, Fan KH, Chen H, et al. Genetic variation in donor CTLA-4 regulatory region is a strong predictor of outcome after allogeneic hematopoietic cell transplantation for hematologic malignancies. Biol Blood Marrow Transplant (2012) 18:1069–75. doi: 10.1016/j.bbmt.2011.12.518
40. Jiang L, Luo RY, Zhang W, Wang LR, Wang F, Cheng YX. Single nucleotide polymorphisms of CTLA4 gene and their association with human cervical cancer. Zhonghua Yi Xue Yi Chuan Xue Za Zhi (2011) 28:313–7. doi: 10.3760/cma.j.issn.1003-9406.2011.03.017
41. Mousavi MJ, Shayesteh MRH, Jamalzehi S, Alimohammadi R, Rahimi A, Aslani S, et al. Association of the genetic polymorphisms in inhibiting and activating molecules of immune system with rheumatoid arthritis: a systematic review and meta-analysis. J Res Med Sci (2021) 26:22. doi: 10.4103/jrms.JRMS_567_20
42. Wang XB, Zhao X, Giscombe R, Lefvert AK. A CTLA-4 gene polymorphism at position -318 in the promoter region affects the expression of protein. Genes Immun (2002) 3(4):233–4. doi: 10.1038/sj.gene.6363869
43. Chen DP, Lin WT, Wen YH, Wang WT. Investigation of the correlation between immune thrombocytopenia and T cell activity-regulated gene polymorphism using functional study. Sci Rep (2022) 12(1):6601. doi: 10.1038/s41598-022-10631-z
44. Liu W, Yang Z, Chen Y, Yang H, Wan X, Zhou X, et al. The association between CTLA-4, CD80/86, and CD28 gene polymorphisms and rheumatoid arthritis: an original study and meta-analysis. Front Med (2021) 8:598076. doi: 10.3389/fmed.2021.598076
45. Aslam MM, Jalil F, John P, Fan KH, Bhatti A, Feingold E, et al. A sequencing study of CTLA4 in Pakistani rheumatoid arthritis cases. PloS One (2020) 15:e0239426. doi: 10.1371/journal.pone.0239426
46. Juran BD, Atkinson EJ, Schlicht EM, Fridley BL, Lazaridis KN. Primary biliary cirrhosis is associated with a genetic variant in the 3' flanking region of the CTLA4 gene. Gastroenterology (2008) 135:1200–6. doi: 10.1053/j.gastro.2008.06.077
47. Choi H, Tabashidze N, Rossner P Jr., Dostal M, Pastorkova A, Kong SW, et al. Altered vulnerability to asthma at various levels of ambient Benzo[a]Pyrene by CTLA4, STAT4 and CYP2E1 polymorphisms. Environ pollut (2017) 231:1134–44. doi: 10.1016/j.envpol.2017.07.057
48. Liu C, Jiang J, Gao L, Hu X, Wang F, Shen Y, et al. A promoter region polymorphism in PDCD-1 gene is associated with risk of rheumatoid arthritis in the han Chinese population of southeastern China. Int J Genomics (2014) 2014:247637. doi: 10.1155/2014/247637
49. Da LS, Zhang Y, Zhang CJ, Bu LJ, Zhu YZ, Ma T, et al. The PD-1 rs36084323 A > G polymorphism decrease cancer risk in Asian: a meta-analysis. Pathol Res Pract (2018) 214:1758–64. doi: 10.1016/j.prp.2018.09.015
50. Ishizaki Y, Yukaya N, Kusuhara K, Kira R, Torisu H, Ihara K, et al. PD1 as a common candidate susceptibility gene of subacute sclerosing panencephalitis. Hum Genet (2010) 127:411–9. doi: 10.1007/s00439-009-0781-z
51. Huang C, Ge T, Xia C, Zhu W, Xu L, Wang Y, et al. Association of rs10204525 genotype GG and rs2227982 CC combination in programmed cell death 1 with hepatitis b virus infection risk. Medicine (2019) 98:e16972. doi: 10.1097/MD.0000000000016972
52. Ali MA, Abdelaziz A, Ali M, Abonar A, Hanafy M, Hussein H, et al. PADI4 (rs2240340), PDCD1 (rs10204525), and CTLA4 (231775) gene polymorphisms and polyarticular juvenile idiopathic arthritis. Br J BioMed Sci (2020) 77:123–8. doi: 10.1080/09674845.2020.1730626
53. Mayr C. What are 3' UTRs doing? Cold Spring Harb Perspect Biol (2019) 11:a034728. doi: 10.1101/cshperspect.a034728
Keywords: rheumatoid arthritis (RA), co-stimulatory system, single nucleotide polymorphism (SNP), autoimmune disease (AD), association
Citation: Chen D-P, Wen Y-H, Lin W-T, Hsu F-P and Yu K-H (2023) Exploration of the association between the single-nucleotide polymorphism of co-stimulatory system and rheumatoid arthritis. Front. Immunol. 14:1123832. doi: 10.3389/fimmu.2023.1123832
Received: 14 December 2022; Accepted: 01 June 2023;
Published: 29 June 2023.
Edited by:
Giuseppe Murdaca, University of Genoa, ItalyReviewed by:
Francesco Puppo, University of Genoa, ItalyMario Salazar-Paramo, University of Guadalajara, Mexico
Copyright © 2023 Chen, Wen, Lin, Hsu and Yu. This is an open-access article distributed under the terms of the Creative Commons Attribution License (CC BY). The use, distribution or reproduction in other forums is permitted, provided the original author(s) and the copyright owner(s) are credited and that the original publication in this journal is cited, in accordance with accepted academic practice. No use, distribution or reproduction is permitted which does not comply with these terms.
*Correspondence: Kuang-Hui Yu, Z291dEBhZG0uY2dtaC5vcmcudHc=
†These authors have contributed equally to this work