 Habib Sadeghirad1
 Ning Liu2,3
 James Monkman1
 Ning Ma4Bassem Ben Cheikh4Niyati Jhaveri4
 Chin Wee Tan2,3
 Majid Ebrahimi Warkiani5
 Mark N. Adams6,7Quan Nguyen8Rahul Ladwa1,9Oliver Braubach4
 Ken O’Byrne6,7,9Melissa Davis2,3,10,11Brett G. M. Hughes12,13
 Arutha Kulasinghe1*
- 1Frazer Institute, Faculty of Medicine, The University of Queensland, Brisbane, QLD, Australia
- 2Department of Bioinformatics Devision, The Walter and Eliza Hall Institute, Melbourne, VIC, Australia
- 3Department of Medical Biology, Faculty of Medicine, Dentistry and Health Sciences, University of Melbourne, Melbourne, VIC, Australia
- 4Akoya Biosciences, Menlo Park, California, CA, United States
- 5School of Biomedical Engineering, University of Technology, Sydney, NSW, Australia
- 6School of Biomedical Science, Faculty of Health, Queensland University of Technology, Brisbane, QLD, Australia
- 7Centre for Genomics and Personalised Health, Queensland University of Technology, Brisbane, QLD, Australia
- 8Institute of Molecular Biosciences, The University of Queensland, Brisbane, QLD, Australia
- 9The Princess Alexandra Hospital, Brisbane, QLD, Australia
- 10Department of Clinical Pathology, Faculty of Medicine, Dentistry and Health Sciences, University of Melbourne, Melbourne, VIC, Australia
- 11South Australian immunoGENomics Cancer Institute, The University of Adelaide, Adelaide, SA, Australia
- 12The Royal Brisbane and Women’s Hospital, Brisbane, QLD, Australia
- 13Faculty of Medicine, The University of Queensland, Brisbane, QLD, Australia
Mucosal head and neck squamous cell carcinoma (HNSCC) are the seventh most common cancer, with approximately 50% of patients living beyond 5 years. Immune checkpoint inhibitors (ICIs) have shown promising results in patients with recurrent or metastatic (R/M) disease, however, only a subset of patients benefit from immunotherapy. Studies have implicated the tumor microenvironment (TME) of HNSCC as a major factor in therapy response, highlighting the need to better understand the TME, particularly by spatially resolved means to determine cellular and molecular components. Here, we employed targeted spatial profiling of proteins on a cohort of pre-treatment tissues from patients with R/M disease to identify novel biomarkers of response within the tumor and stromal margins. By grouping patient outcome categories into response or non-response, based on Response Evaluation Criteria in Solid Tumors (RECIST) we show that immune checkpoint molecules, including PD-L1, B7-H3, and VISTA, were differentially expressed. Patient responders possessed significantly higher tumor expression of PD-L1 and B7-H3, but lower expression of VISTA. Analysis of response subgroups indicated that tumor necrosis factor receptor (TNFR) superfamily members including OX40L, CD27, 4-1BB, CD40, and CD95/Fas, were associated with immunotherapy outcome. CD40 expression was higher in patient-responders than non responders, while CD95/Fas expression was lower in patients with partial response (PR) relative to those with stable disease (SD) and progressive disease (PD). Furthermore, we found that high 4-1BB expression in the tumor compartment, but not in the stroma, was associated with better overall survival (OS) (HR= 0.28, p-adjusted= 0.040). Moreover, high CD40 expression in tumor regions (HR= 0.27, p-adjusted= 0.035), and high CD27 expression in the stroma (HR= 0.2, p-adjusted=0.032) were associated with better survival outcomes. Taken together, this study supports the role of immune checkpoint molecules and implicates the TNFR superfamily as key players in immunotherapy response in our cohort of HNSCC. Validation of these findings in a prospective study is required to determine the robustness of these tissue signatures.
Introduction
Mucosal head and neck squamous cell carcinoma (HNSCC) is one of the cancers that severely impact patients’ quality of life and causes complications such as pain, psychosocial distress, and dysfunction (1, 2). Tobacco and alcohol consumption are common risk factors for the development of SCC in the oral cavity, oropharynx, hypopharynx, and larynx (1, 3). Human Papilloma Virus (HPV) is also implicated in the pathogenesis of oropharyngeal SCC. Late diagnosis is common, with most HNSCC patients presenting with advanced disease (3). In the absence of distant metastasis, patients with advanced HNSCC are often treated with multimodality therapy such as surgery and radiotherapy and/or chemotherapy (3, 4). With recurrent disease in a previously irradiated site not amenable to salvage surgery, immunotherapy has shown modest benefits for patients with recurrent or metastatic (R/M) disease. Immune checkpoint inhibitors (ICIs) Pembrolizumab and Nivolumab are the FDA-approved treatments for HNSCC, particularly in patients with cisplatin-refractory R/M disease in the second line setting (3–7). More recently, Keynote 048 has shown a survival advantage of Pembrolizumab alone or with chemotherapy in the first-line setting depending on PD-L1 status. Nonetheless, it should be noted that only a minority of patients benefit from ICIs, making treatment of R/M HNSCC challenging (4).
Studies have shown that the composition of the HNSCC tumor microenvironment (TME) and the interactions of immune cell types within the TME may be important determinants of treatment outcomes (2, 8). As a result, investigation of the HNSCC TME could lead to the identification of mechanisms underlying therapy response/resistance, paving the way for more personalized medicine (8). Expression profiling of immune biomarkers and the spatial phenotyping of cell types within the stroma and tumor compartments of HNSCCs can be accomplished using novel spatial profiling technologies (9), with the location and distance of immune cells, specifically cytotoxic T cells, to tumor cells found to be key factors for predicting treatment outcomes (10). In this study, we used the Nanostring Technologies GeoMx Digital Spatial Profiler (DSP) and the Akoya PhenoCycler-Fusion®, to explore the TME of HNSCC patients who received immunotherapy (Figure 1). Our goal was to identify protein biomarkers that are informative of immunotherapy outcomes.
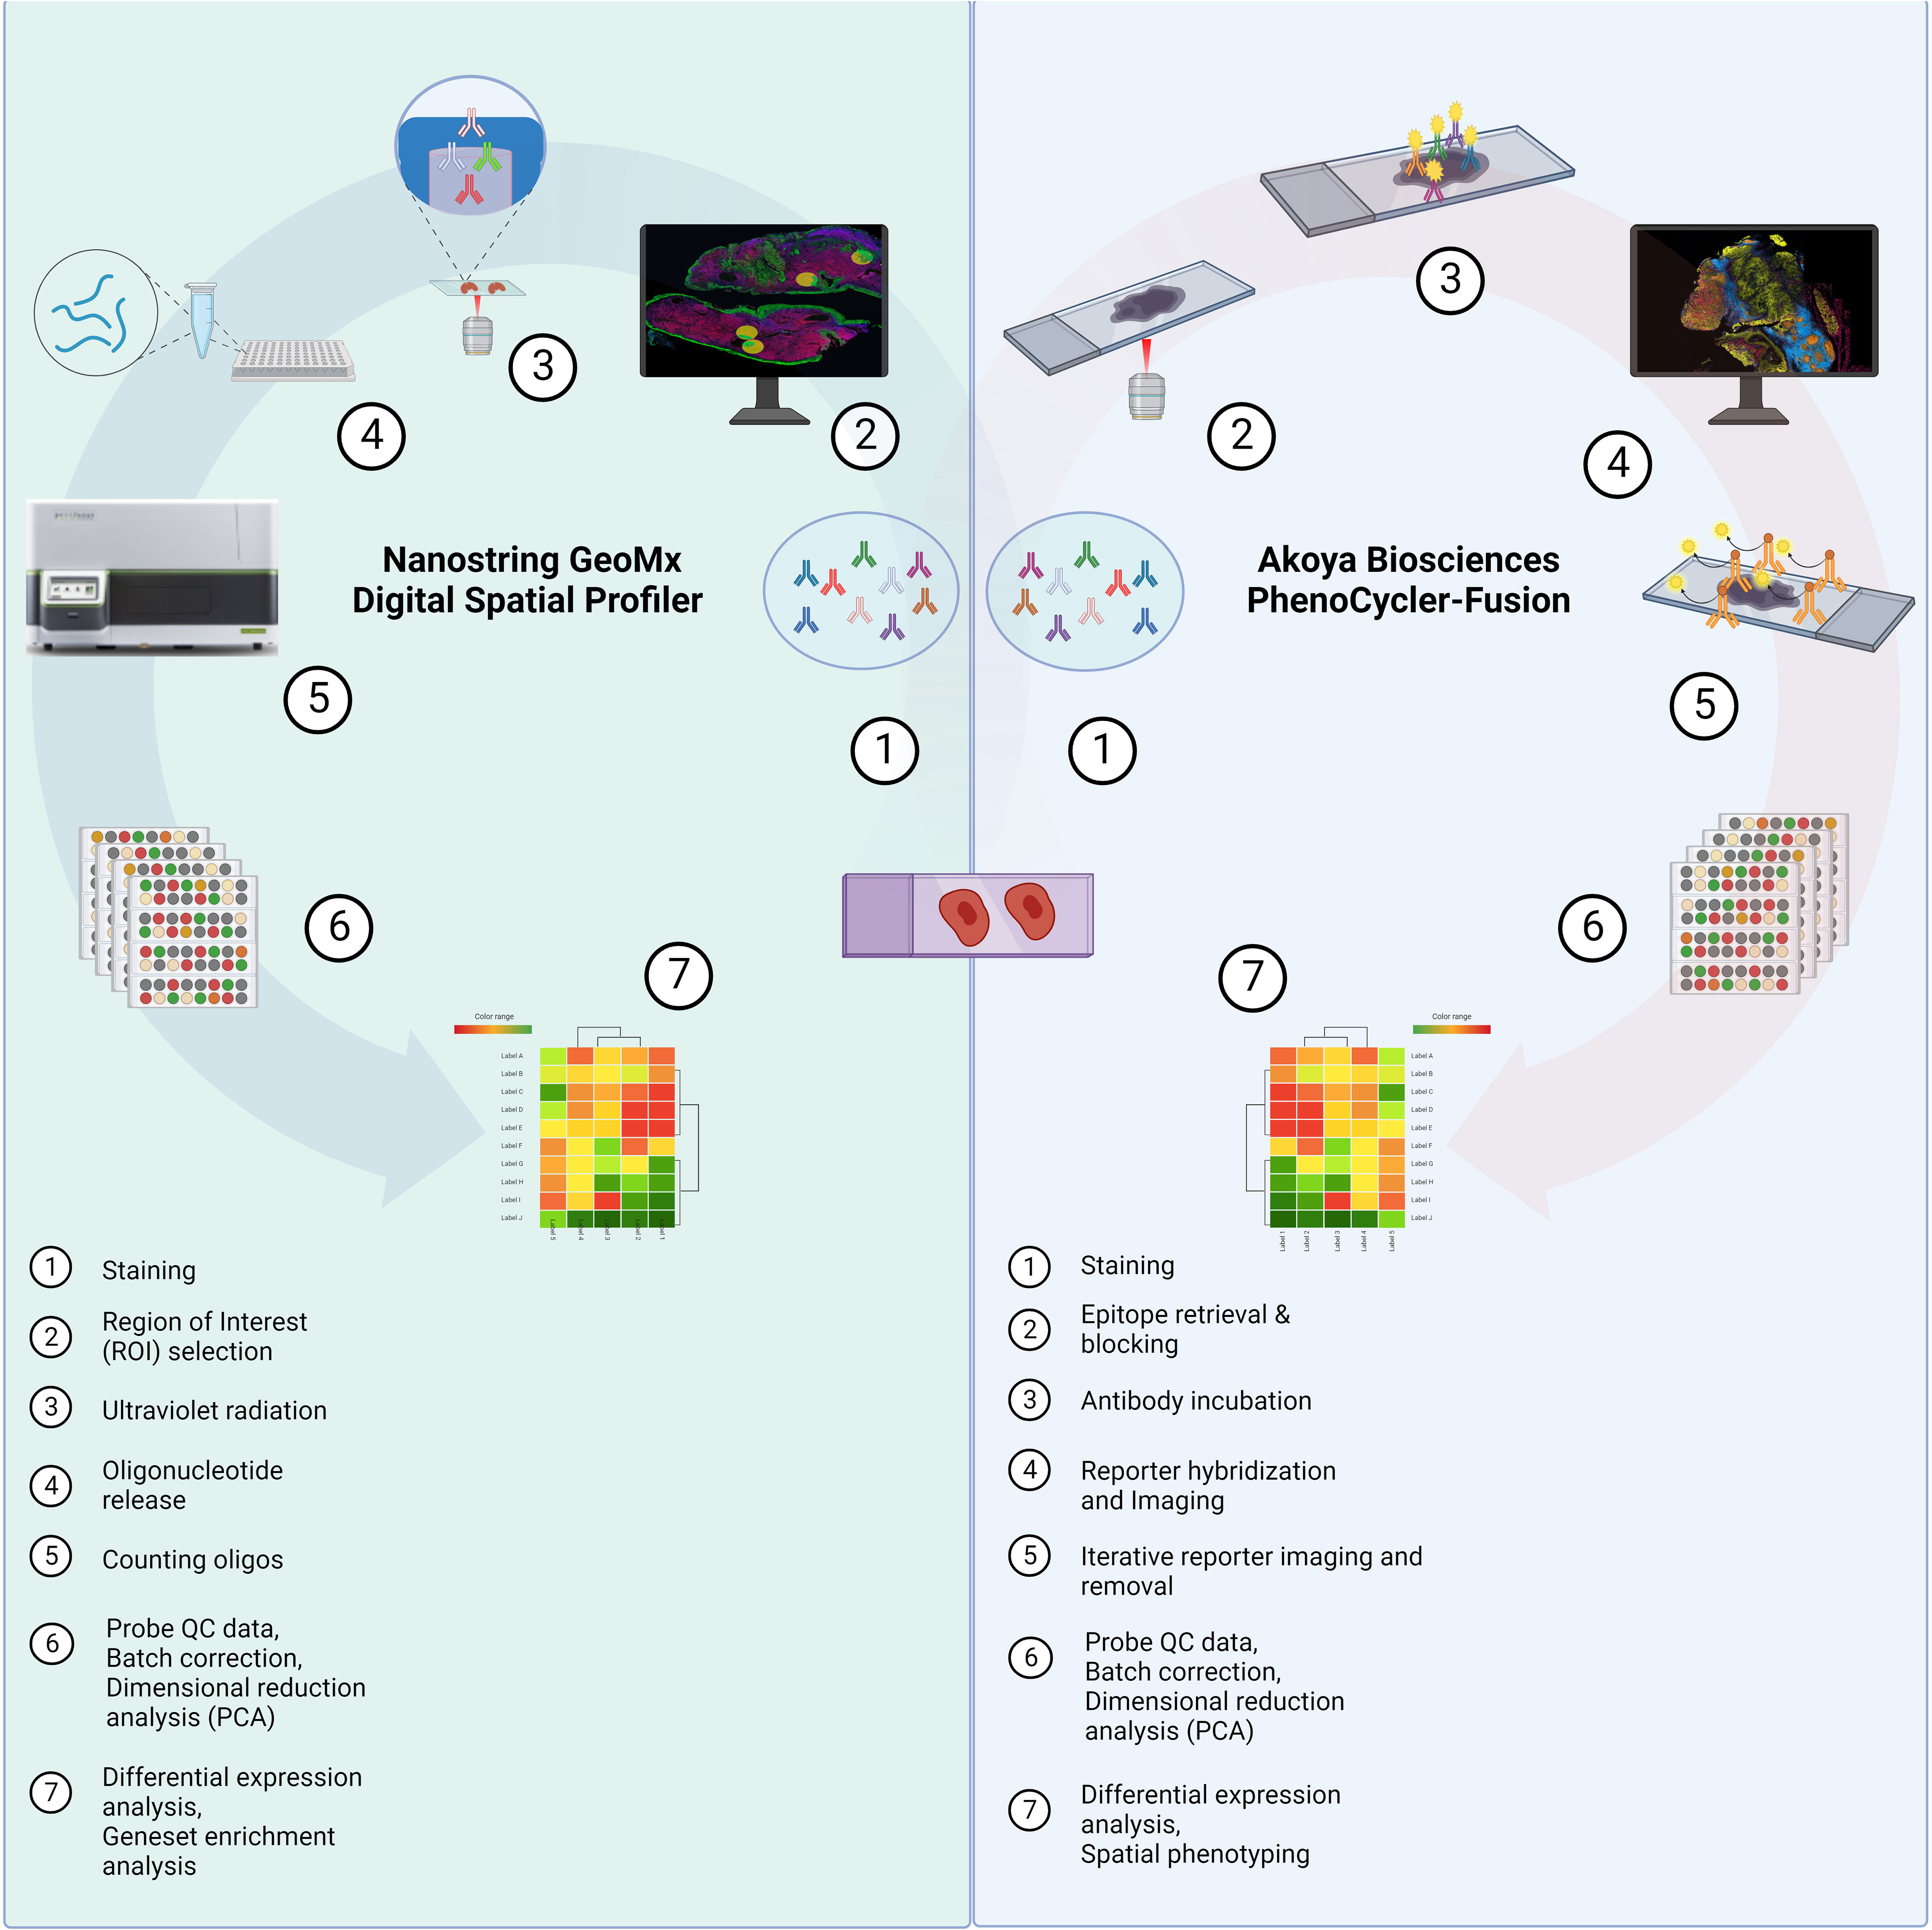
Figure 1 Study Schema. Formalin-fixed paraffin-embedded (FFPE) tissue samples were collected from HNSCC patients prior to immunotherapy from the Royal Brisbane and Women’s Hospital (RBWH). Targeted spatial proteomics across the cohort was performed with the Nanostring GeoMx Digital Spatial Profiler (DSP) and a sub-cohort analysis using the Akoya PhenoCycler-Fusion platform. Data analysis consisted of probe quality control (QC), principal component analysis (PCA), differential expression, and Cox proportional hazards (COXPH) and Kaplan-Meier models for survival analysis. Created by BioRender.com.
Material and methods
Patient cohort
This retrospective study has Human Research Ethics (HREC) approval from the Royal Brisbane and Women’s Hospital (RBWH) (LNR/2020/QRBW/66744) and The University of Queensland ratification. We identified n=41 HNSCC patients eligible for our study from the RWBH. Of the 41 patients, 20 had no available tissues, with 21 tissue blocks available for analysis. We collected formalin-fixed paraffin-embedded (FFPE) tissue samples from these 21 HNSCC patients, with samples collected prior to immunotherapy. Pathology Queensland prepared serial sections and hematoxylin and eosin (H&E) staining, while pathology reviews provided demarcation of tumour/stromal regions so that non-neoplastic epithelium could be avoided. Of the 21 tissues collected, n=17 were deemed of appropriate quality and tissue integrity for subsequent spatial analysis. Patients were treated with Pembrolizumab or Nivolumab and categorized based on response to therapy according to RECIST 1.1., including complete response (CR), partial response (PR), stable disease (SD), and progressive disease (PD). The clinicopathological findings are shown in Table 1.
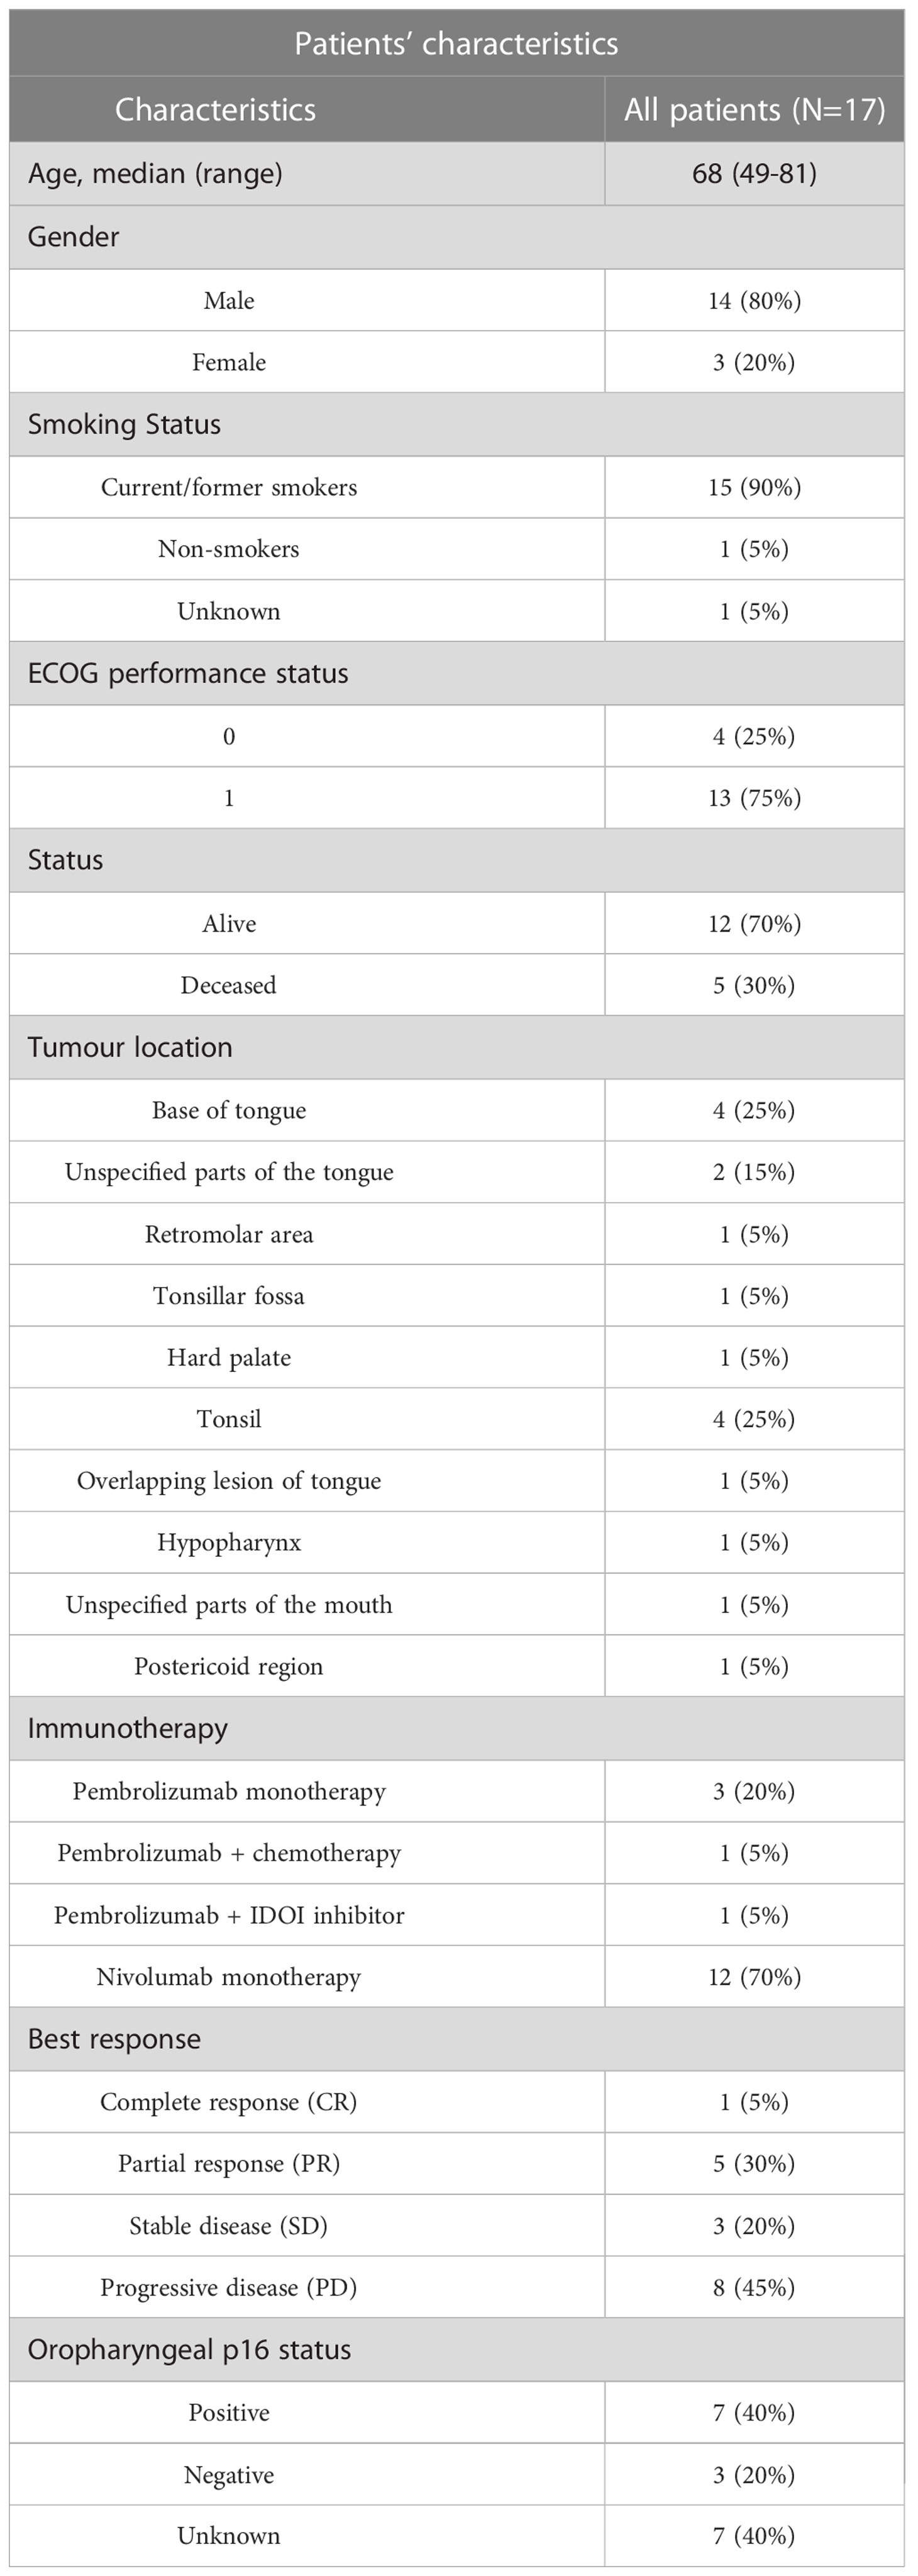
Table 1 HNSCC cohort characteristics.
Nanostring GeoMx digital spatial profiler (DSP)
The FFPE tissue slides were processed and analyzed by the Nanostring GeoMx Digital Spatial Profiler (DSP) technology at Queensland University of Technology (QUT), Brisbane, Australia. Fluorescent morphology markers, including CD45, pan-cytokeratin (panCK), and SYTO-13 were used to visualize lymphocytes, tumor regions, and the nucleus, respectively. The slides were prepared and processed, using an immune-oncology panel (Table 2), according to the manufacturer’s instructions. Tumor and stromal compartments were distinguished and defined by gating panCK regions and non-panCK regions, respectively (Figure 2). An immune-oncology panel of 68 oligonucleotide-conjugated primary antibodies, including the human immune cell core, immune cell typing, pan-tumor, immune activation status, immune-oncology (IO) drug target, cell death, and PI3K/AKT signaling panels, was employed to unravel protein expression of immune biomarkers (Table 2). Antibody barcodes were counted using the Nanostring nCounter platform according to the manufacturer’s instructions. External RNA Controls Consortium (ERCC) normalization and QC were applied in the DSP analysis suite, prior to data output for bioinformatics analysis.
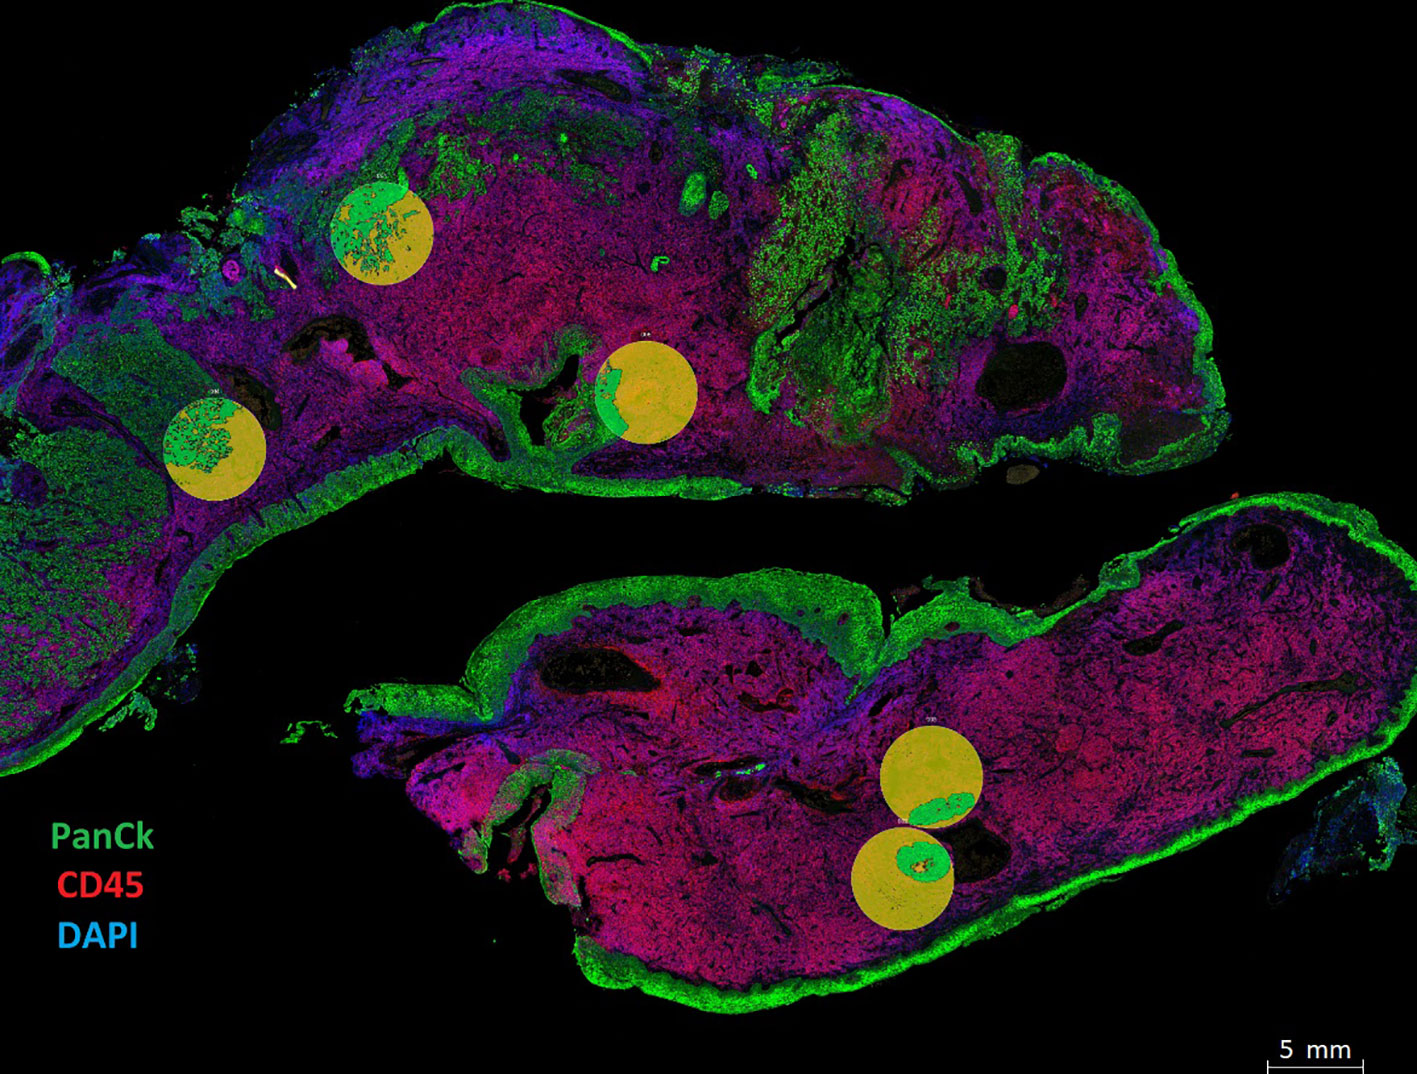
Figure 2 Spatial phenotyping on HNSCC tumor samples. Tissue compartmentalization was performed by masking panCK+ (Tumor) and panCK- (Stroma). The morphology markers included panCK (green) for tumor cells, CD45 (red) for immune cells, and SYTO 13 (blue) for the nucleus. Tumor segmentation on regions of interest (ROIs) was done to capture Tumor masks in green and Stromal regions in yellow. Masks were created using the panCK+/- feature to liberate barcodes for digital counting by the Nanostring nCounter platform.
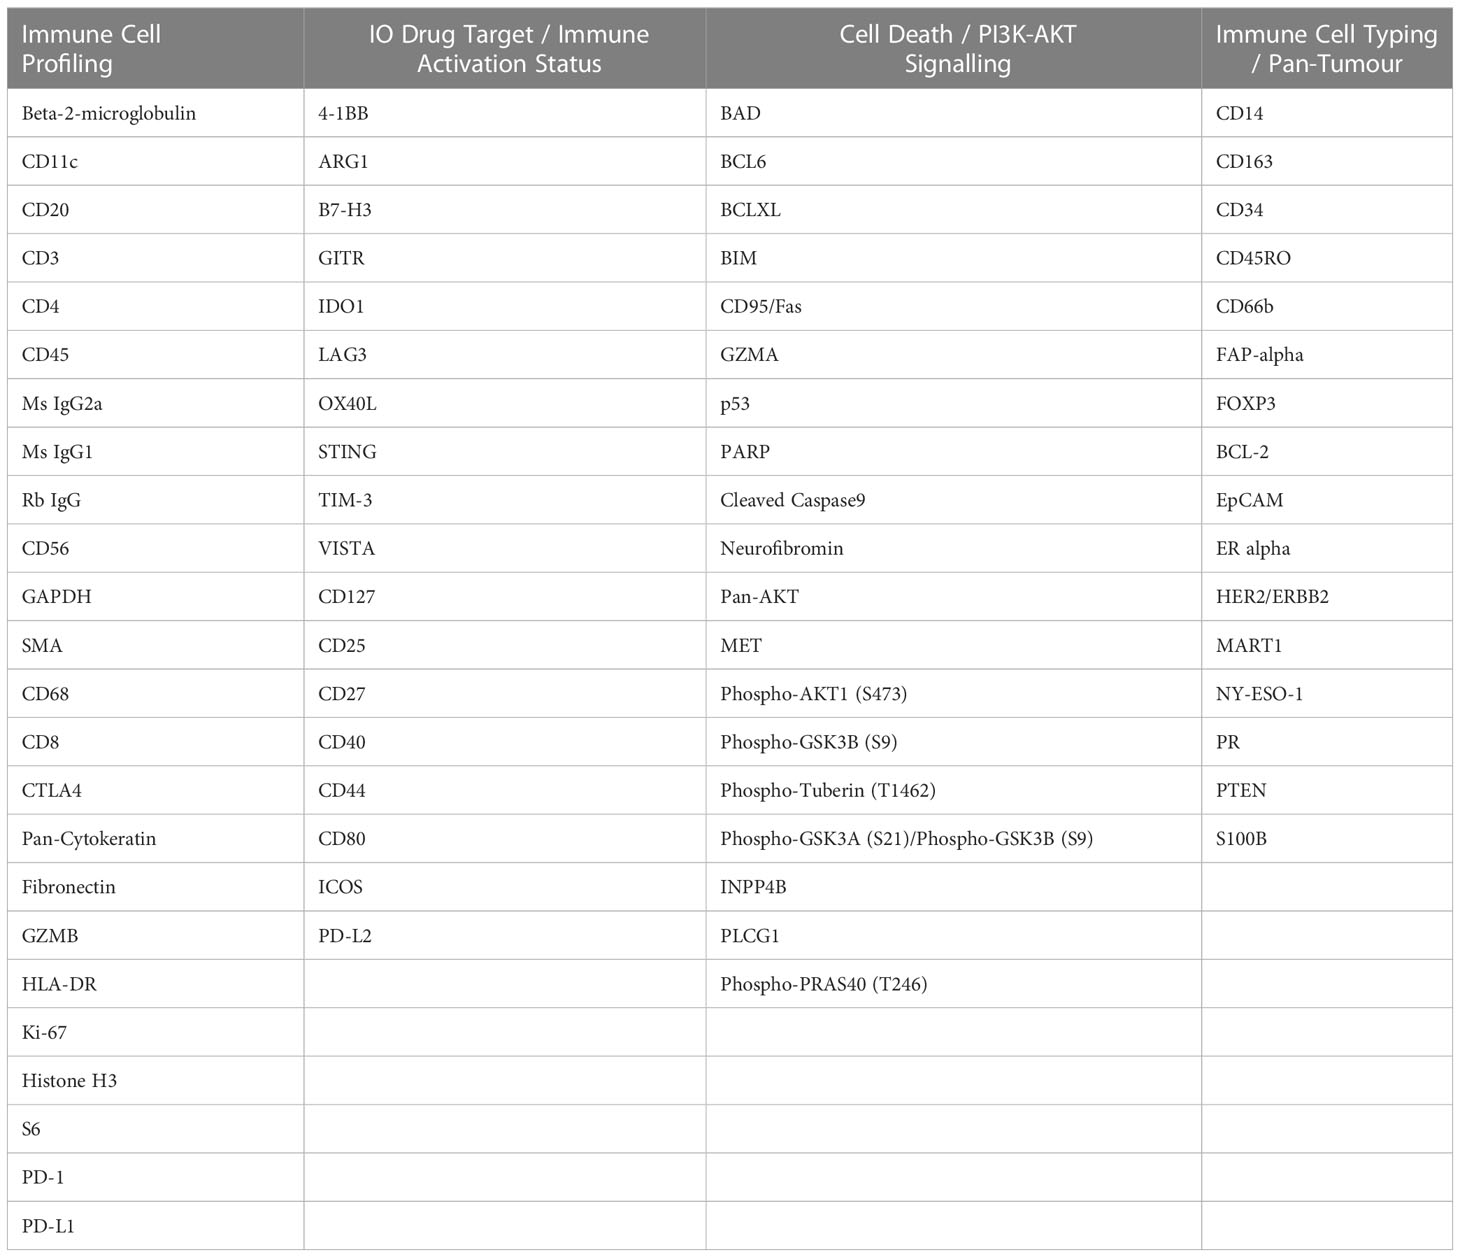
Table 2 Nanostring Technologies GeoMx DSP Immuno-oncology panel.
Data analysis (Nanostring GeoMx data)
Quality control (QC) of the data was performed using Bioconductor R package standR (v1.1.5). Filtering was first conducted to exclude slides and regions of interest (ROIs) with poor tissue quality due to poor staining or detachment. This resulted in having 17 patients tissue samples and 187 ROIs used for further analyses. Then, by using the function addPerROIQC from the standR package, marker LAG3 was filtered for being lowly expressed in over 90% of the ROIs. For data analysis, the log2-transformed count per million (logCPM) data were used to account for variation in library size. The relative log expression (RLE) and principal components analysis (PCA) of the logCPM data were used to assess the overall distribution, to identify any confounding factors from the experimental design and the detect presence of batch effects within the data. To remove unwanted technical variations observed in the RLE analysis, the data was normalized using size factor normalization methods in standR (v1.1.5).
Differential expression (DE) analysis was performed using R packages edgeR (v3.34.0) (11) and limma (3.48.0) (12). Briefly, DE was modelled using linear models with experimental factors as predictors. The variations in marker expressions were modelled as a combination of the common dispersion that applies to all genes and a marker-specific dispersion. To estimate the common and marker-specific variations, the variation of each marker was modelled by borrowing information from all other markers using an empirical Bayes approach (13). The linear model was then fitted to a given experimental design containing the biological factors of interest, patient variation and clinical information as covariates. DE was performed for specific contrasts of interest. The resulting statistic was an empirical Bayes moderated t-statistic. Multiple hypothesis testing adjustment was carried out with the Benjamini Hochberg procedure with an adjusted p-value < 0.05 used as the threshold to identify significant DE markers.
Survival analysis was performed by both Kaplan-Meier estimates using median protein expression for cohort stratification, and Cox proportional hazards model using continuous protein expression. Normalized replicate measurements in tumor/stroma compartment were averaged per patient for survival analysis. Survival analysis was performed using R package Survival (14) with the assistance of Queensland Cyber Infrastructure Foundation (QCIF, University of Queensland, Australia).
PhenoCycler-Fusion (Akoya Biosciences)
Single-cell spatial phenotyping of the HNSCC FFPE slides was performed in collaboration with Akoya Biosciences (Massachusetts, US) on the PhenoCycler-Fusion platform. Four tissue slides from four different patients were stained with a 45-plex antibody panel, including immune checkpoints, immune cell lineage, activation states, general tissue structure in a single step (Table 3). Multiple combinations of three antibodies were visualized on the PhenoCycler-Fusion, by utilizing iterative fluorescent-reporter addition and image cycles. All experiments were performed according to manufacturer's instructions. Quality control of the data was performed qualitatively on each individual marker image and filtering was conducted to exclude markers and tissue regions with poor quality. Computational image analysis was used to identify cell types and characterize their spatial distribution in the tissue. The first step of image analysis consists of cell segmentation which is the step of identifying individual cells in the tissue, their surface, and their locations. Nuclear segmentation was first performed using StarDist (15) method applied to the DAPI channel, then cytoplasm segmentation was established by nuclear expansion using morphological dilation applied to the labelled nuclear mask, and the centroid of each cell was defined by the x-y coordinates in the image. The average intensity of each marker was then calculated for each cell from the corresponding expression compartment, e.g., nuclear surface, cytoplasmic surface, to produce an expression table where cells are listed with their protein expressions and locations in the tissue. Each protein expression was then z-scored across all the cells in the slide such that each protein has a mean equal to 0 and a standard deviation equal to 1. Then, the data from all slides were combined, resulting in a total of 3,106,317 cells. Batch correction was then performed using Harmony (16) based on 17 lineage markers (CD163, CD68, CD19, CD20, CD21, CD3e, CD8, CD4, CD45RO, ICOS, FOXP3, E-CAD, Pan-Cytokeratin, Beta-Catenin, CD31, CD34, SMA) in order to minimize batch effects between the tissue slides. The feature matrix returned by Harmony was then used for unsupervised clustering using Leiden algorithm (17) and the GPU-accelerated package, Rapids (18). Leiden resolution equals to 1-6 were tested and the resolution of 4 was chosen for manual cluster annotation as it presents a sufficient number of clusters that separate the cells into smaller groups (N = 70) differentiated by protein expression variability over the technical variability. Cell phenotypes were then assigned based on protein expression patterns on a hierarchical clustering heatmap. Clusters with similar expression profiles were combined into one phenotype and a new heatmap with 10 cell phenotypes was generated. Furthermore, tissue segmentation into 3 compartments was performed semi-automatically based on the Pan-Cytokeratin image. First, the tumor compartment was segmented by thresholding the image and applying morphological filters. Then, the tumor mask was dilated by 100um to delineate the “tumor front” compartment. The rest of the tissue was then labelled as stroma.
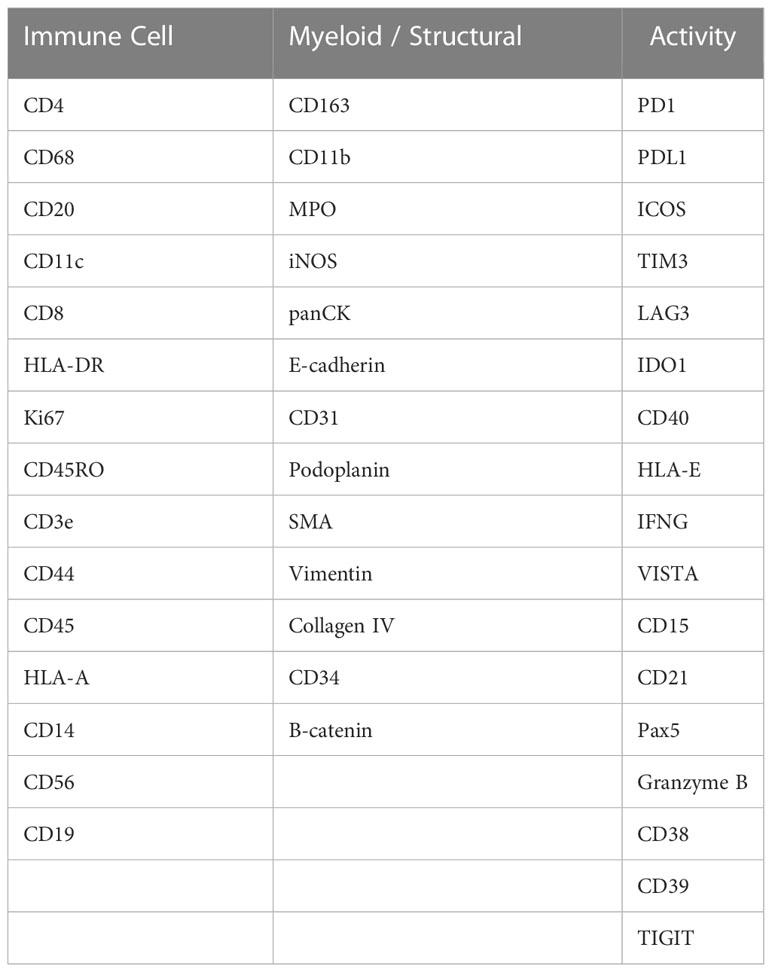
Table 3 Akoya Biosciences PhenoCycler-Fusion custom Immuno-oncology panel.
Results
HNSCC cohort characteristics
This retrospective study spatially profiled HNSCC FFPE tissue samples from patients with metastatic HNSCC. The patients’ response to immunotherapy was categorized according to RECIST criteria. The study included patients with progressive disease (PD, n=8), stable disease (SD, n=3), partial response (PR, n=5), and complete response (CR, n=1). In terms of HPV status, n=7 patients were oropharyngeal p16 positive, n=3 patients were p16 negative, and n=7 patients were unknown (Table 1). FFPE tissues were pathology reviewed for tumor and stroma demarcation on H&E images.
Identification of differentially expressed proteins using Nanostring GeoMx DSP
Using the Nanostring GeoMx DSP, we investigated the protein expression levels of 17 FFPE tissue samples from HNSCC patients. The tumor and stromal compartments were defined by masking high and low - panCK regions, measured against pathology H&E annotations, and the protein expression of each compartment was measured (Figure 2, circles defined by masking).
Expression matrix was evaluated by relative log expression (RLE) plots and PCA to identify confounding experimental effects. Technical variation was captured by RLE plot (Supplementary Figure 1), while in the PCA analysis, top 6 principal components explain 62.12% variation of the expression matrix (Supplementary Figure 2), and variations of both tumor stroma labelling and library size were observed on PC2 (Supplementary Figure 2). Normalization was then performed to remove unwanted technical variation such as library size with the assessment using RLE and PCA plots (Supplementary Figures 1, 2B). The comparisons between Differential expression (DE) analysis were conducted on normalized protein counts to determine compartment-specific proteins associated with patient response groups.
Differentially expressed proteins detected by the Digital Spatial Profiler (DSP)
Differential expression was initially performed by grouping patients into those who responded to ICI treatment (CR, PR, SD) (n=9) and those who did not (PD) (n=8). This analysis indicated higher expression of PD-L1, B7-H3, Bcl-2, BCLX, and BIM in regions of tumors that responded to ICI. VISTA, CD45RO, CD66b, and FOXP3 were identified to have lower expression levels in regions of ICI responsive tumors (Figure 3A). In addition, the stromal compartment of patient-responders indicated increased expression of CD40, B7-H3, SMA, CD163, and ICOS, but decreased levels of PARP, NY-ESO-1, and S100B (Figure 3B).
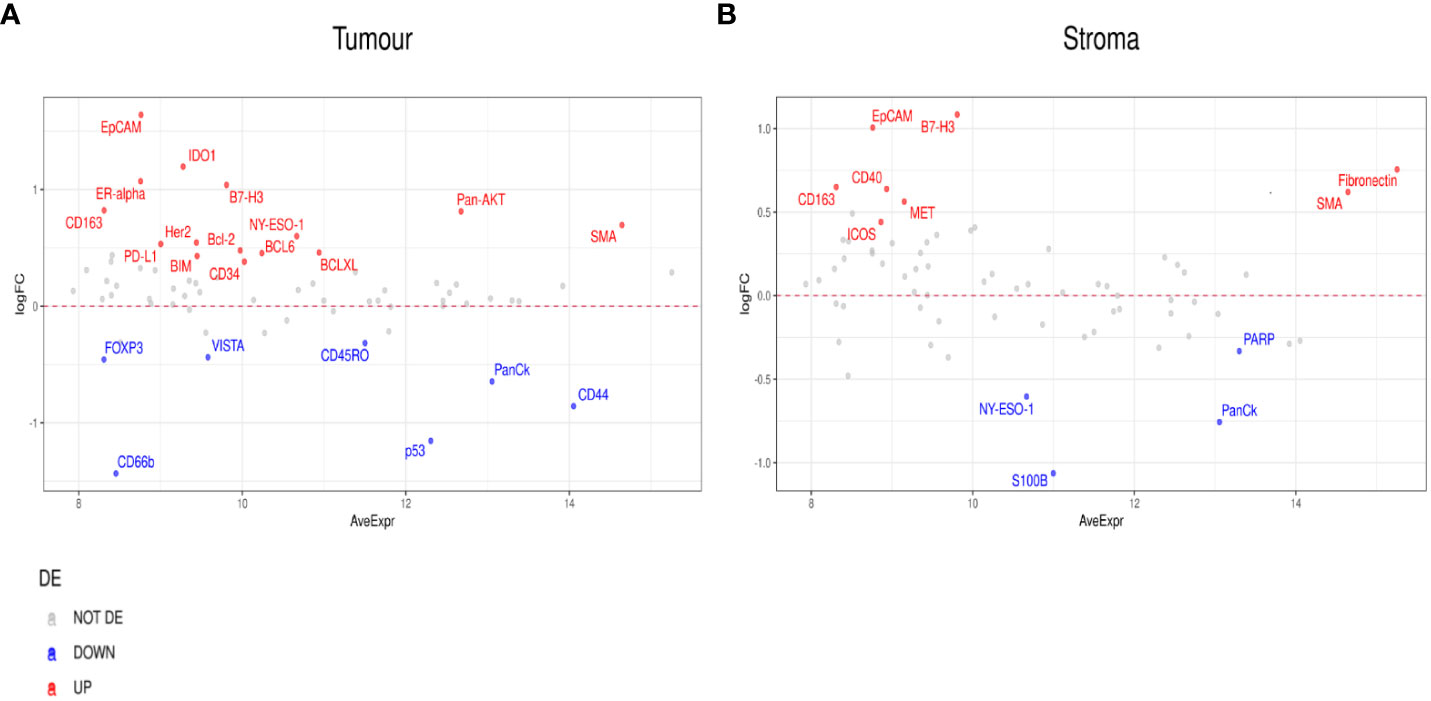
Figure 3 Differential protein expression between patient responders (n=9) and non-responders (n=8). (A, B) MA plots of Mean Expression (AveExpr) vs fold change (logFC) visualizing expression of protein biomarkers in responders compared to non-responders for either (A) tumor samples or (B) stroma samples. Colors denote not differentially expressed markers (gray), significantly up- (red) and down-regulated (blue) markers based on false discovery rate (FDR) < 0.05 after multiple comparison testing.
To further probe the factors associated with ICI response, we evaluated differential expression between RECIST subgroups, CR, PR, SD, PD. When we compared PR to PD, we found a number of significant differences. In the tumor compartment, patients with PR had higher expression of ER-alpha, PD-L1, Pan-AKT, CD68, Ki-67, and Fibronectin, but lower expression of CD44, CD127, CD34, and VISTA (Figure 4A). In the stromal compartment, patients with PR showed an increased expression of PD-L1, HLA-DR, and CD68, but decreased CD44, BIM, BAD, FAP-alpha, and VISTA expression levels when compared to patients with PD (Figure 4B).
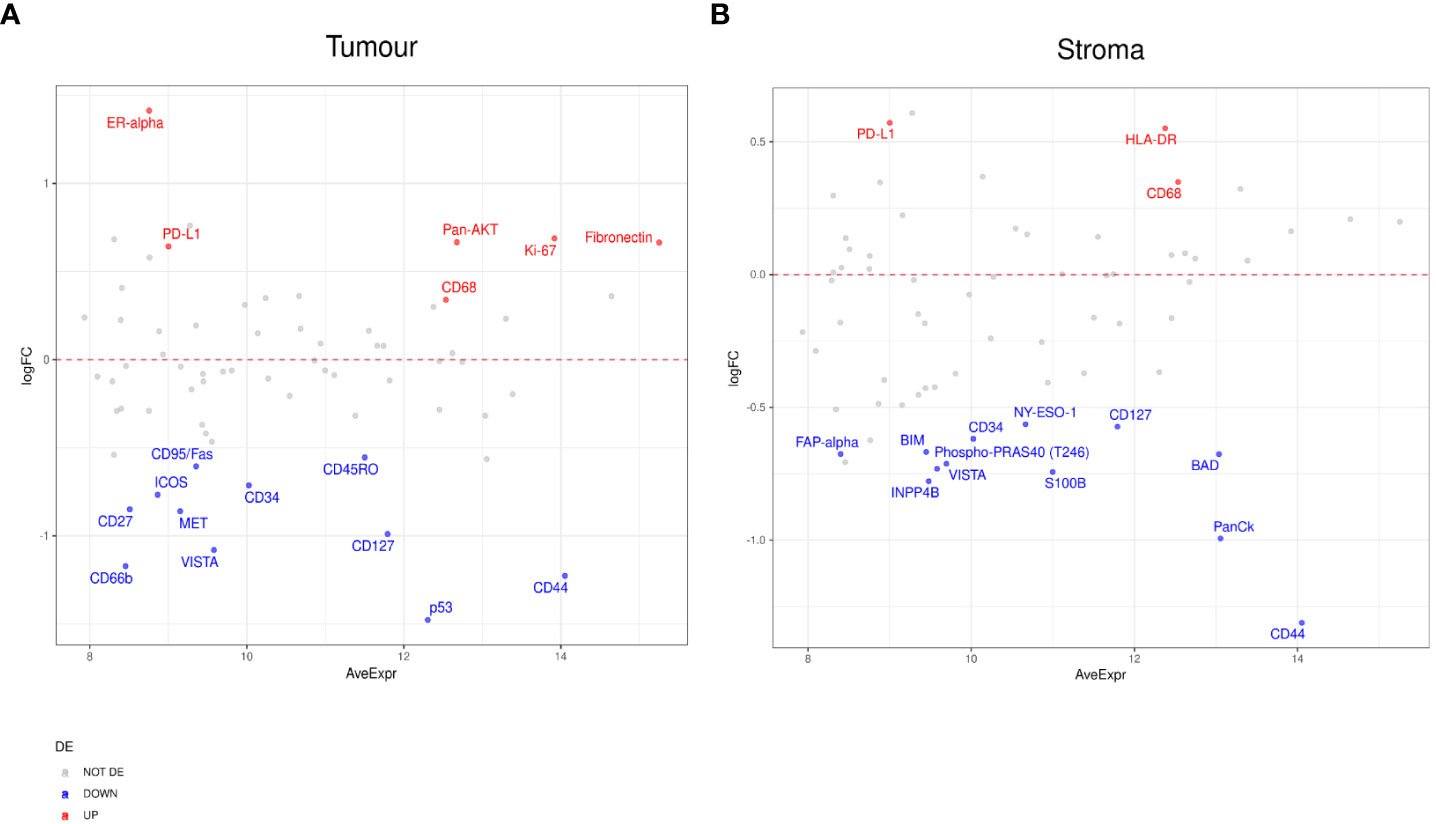
Figure 4 Differential protein expression between patients with partial response (PR) (n=5) and progressive disease (PD) (n=8). (A, B) MA plots of Mean Expression (AveExpr) vs fold change (logFC) visualizing expression of protein biomarkers in patients with PR compared to patients with PD for (A) tumor samples or (B) stromal samples. Colors denote not differentially expressed markers (gray), significantly up- (red) and down-regulated (blue) markers based on false discovery rate (FDR) < 0.05 after multiple comparison testing.
In patients with SD compared to those with PD, we found markers including CD163, EpCAM, PR, and B7-H3, enriched in the tumor compartment of patients with SD (Figure 5A). In the stromal compartment, NY-ESO-1 was found to be the only DE protein between patients with SD and those with PD (Figure 5B). Differential expression analysis in the tumor compartment between patients with PR versus patients with SD, showed higher PTEN and Ki-67 expression in the former group, while the expression of immune markers, such as Fap-alpha, CD127, CD45RO, and CD27, were found to be decreased (Figure 6A). In the stroma, PR patients had higher levels of CD11c, but lower levels of proteins involved in cell death, such as BIM, CD95/Fas, and BCLXL (Figure 6B). The patient cohort included one patient with CR, which we compared to all the other response groups combined. Despite low statistical power due to a small sample size, a similar set of DE proteins were found in both the tumor and stroma of the patient with CR. The tumor region of the CR patient indicated higher levels of VISTA, CD45, IDO1, and S100B while S473 expression was found to be decreased. In the stroma, CD45, Bcl2, CD20, CD45RO, CD3, CD4, and HLA-DR were found to be higher, while the expression of Ki-67 was found to be lower (Supplementary Figures 3A–F).
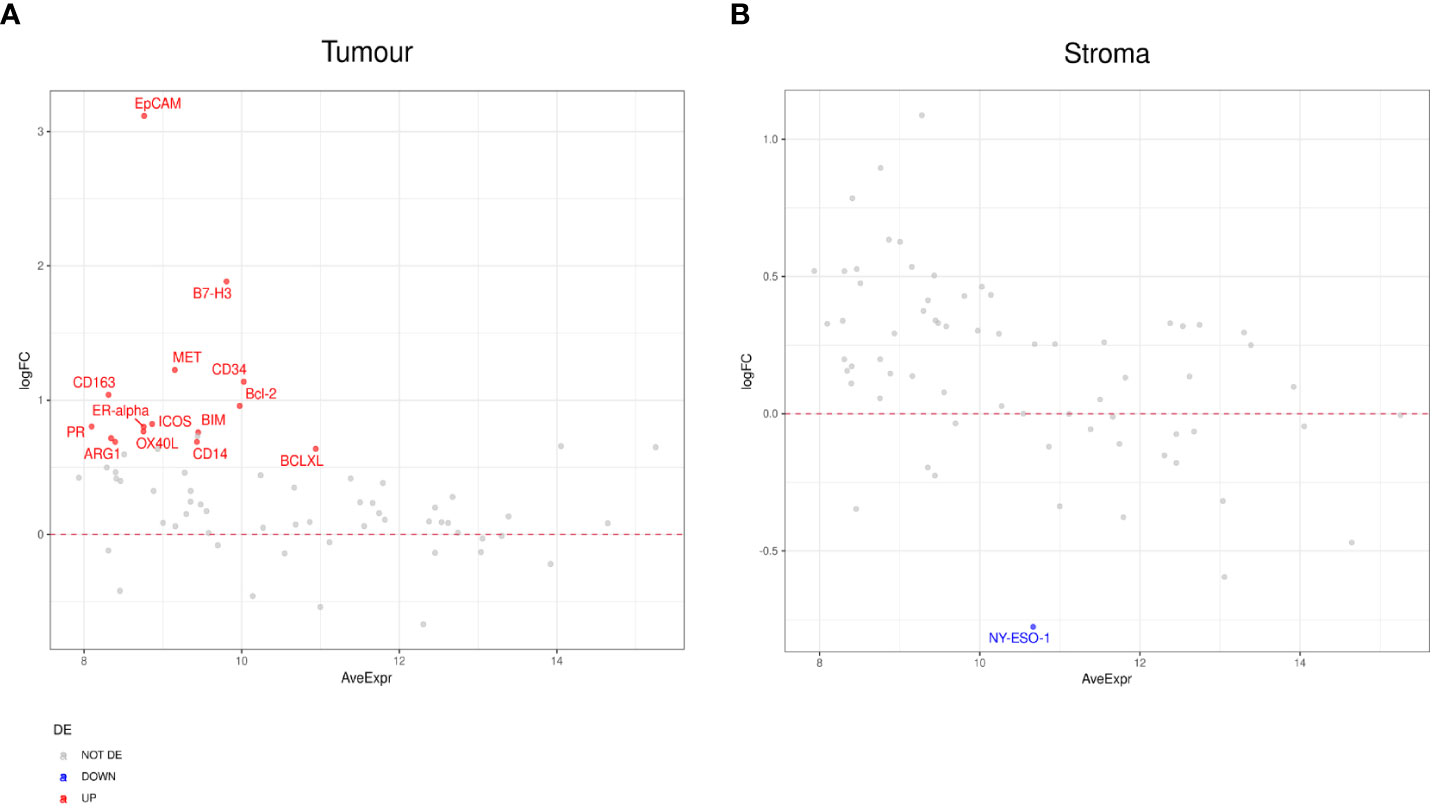
Figure 5 Differential protein expression between patients with stable disease (SD) (n=3) and progressive disease (PD) (n=8). (A, B) MA plots of Mean Expression (AveExpr) vs fold change (logFC) visualizing expression of protein biomarkers in patients with SD compared to patients with PD for (A) tumor samples or (B) stromal samples. Colors denote not differentially expressed markers (gray), significantly up- (red) and down-regulated (blue) markers based on false discover rate (FDR) < 0.05 after multiple comparison testing.
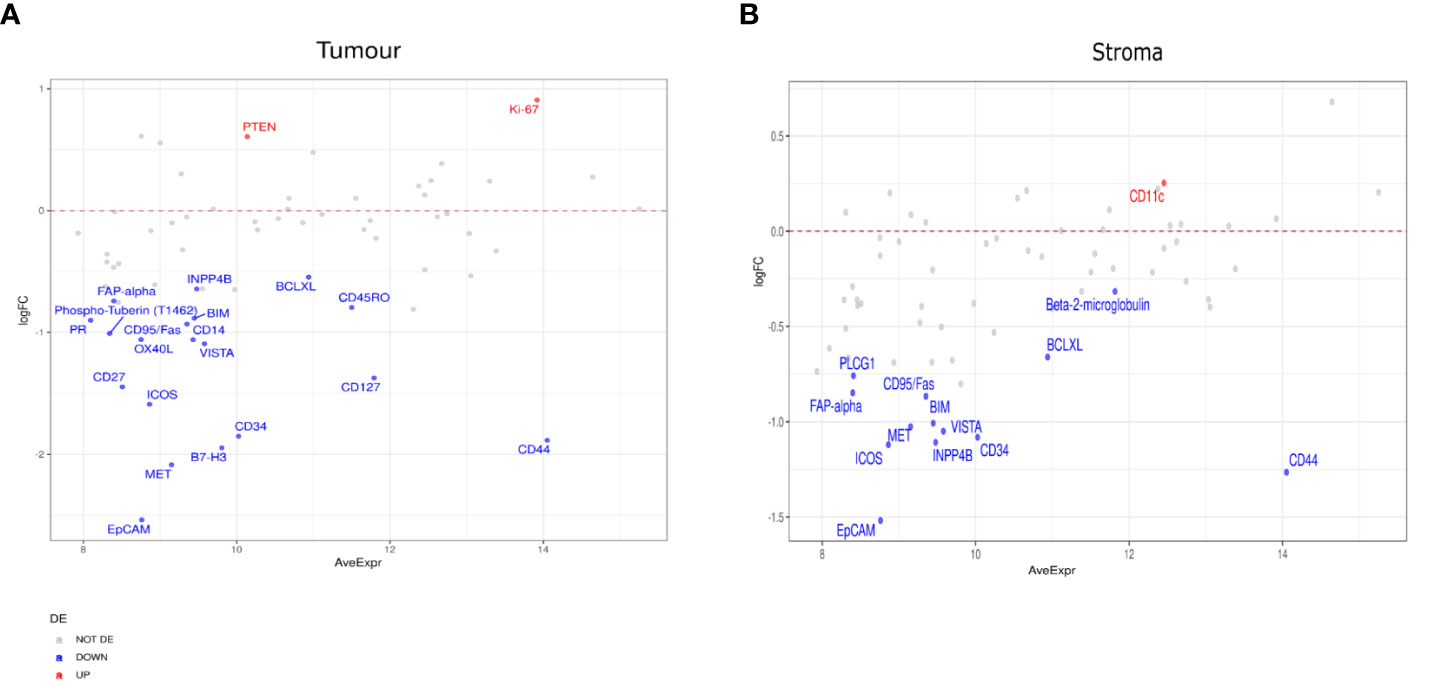
Figure 6 Differential protein expression between patients with partial response (PR) (n=5) and stable disease (SD) (n=3). (A, B) MA plots of Mean Expression (AveExpr) vs fold change (logFC) visualizing expression of protein biomarkers in patients with PR compared to patients with SD for (A) tumor samples or (B) stromal samples. Colors denote not differentially expressed markers (gray), significantly up- (red) and down-regulated (blue) markers based on false discovery rate (FDR) < 0.05 after multiple comparison testing.
Furthermore, to investigate differentially expressed protein markers between the tumor and stromal margins, we performed a DE analysis in both patient responders and non-responders (Figure 7). We found that several protein biomarkers, most notably panCK, IDO1, CD44, and Ki-67, were expressed at higher levels in responders’ tumor compartments; however, in the stroma, SMA, Fibronectin, CD4, and CD27 were the most differentially expressed (Figure 7A). In the non-responder group, panCK, CD44 and CD66b were found to be the most differentially expressed proteins in the tumor compartment, while SMA and Fibronectin, and Pan-AKT were more highly expressed in the stroma (Figure 7B).
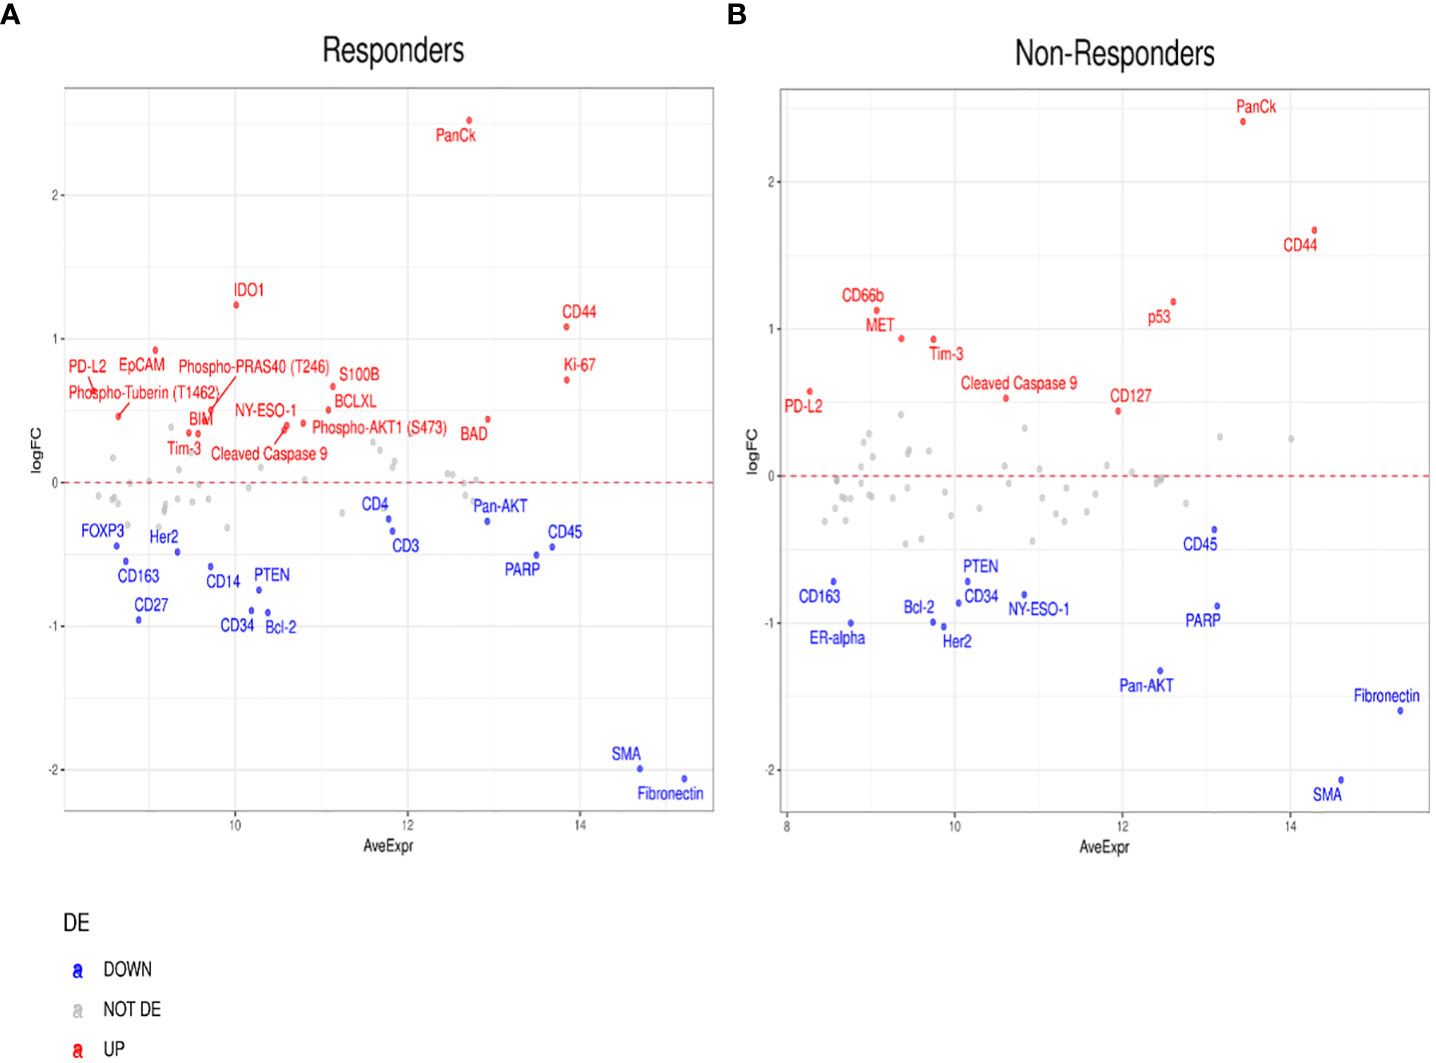
Figure 7 Differential protein expression between tumor and stromal compartments in different treatment outcomes. (A, B) MA plots of Mean Expression (AveExpr) vs fold change (logFC) visualizing expression of protein biomarkers in tumor compartment compared to stromal compartments in (A) responders or (B) non-responders. Colors denote not differentially expressed markers (gray), significantly up- (red) and down-regulated (blue) markers based on false discovery rate (FDR) < 0.05 after multiple comparison testing.
Survival analysis
Compartmentalized protein expression was tested for associations with overall survival (OS). Protein expression was used to stratify the patient cohort into groups above and below the median threshold (Figure 8 and Supplementary Table 2). This indicated that within tumor regions, high 4-1BB expression was associated with better survival (Log rank p= 0.04, Cox HR= 0.28) (Figure 8A), and high CD40 expression resulted in better survival (Log rank p= 0.035, Cox HR= 0.27) (Figure 8B). Additionally, within stromal regions, high 4-1BB expression was associated with poorer survival (Log rank p= 0.032, Cox HR= 2.24) (Figure 8C), while high CD27 expression was associated with better survival (Log rank p=0.032, Cox HR= 0.2) (Figure 8D).
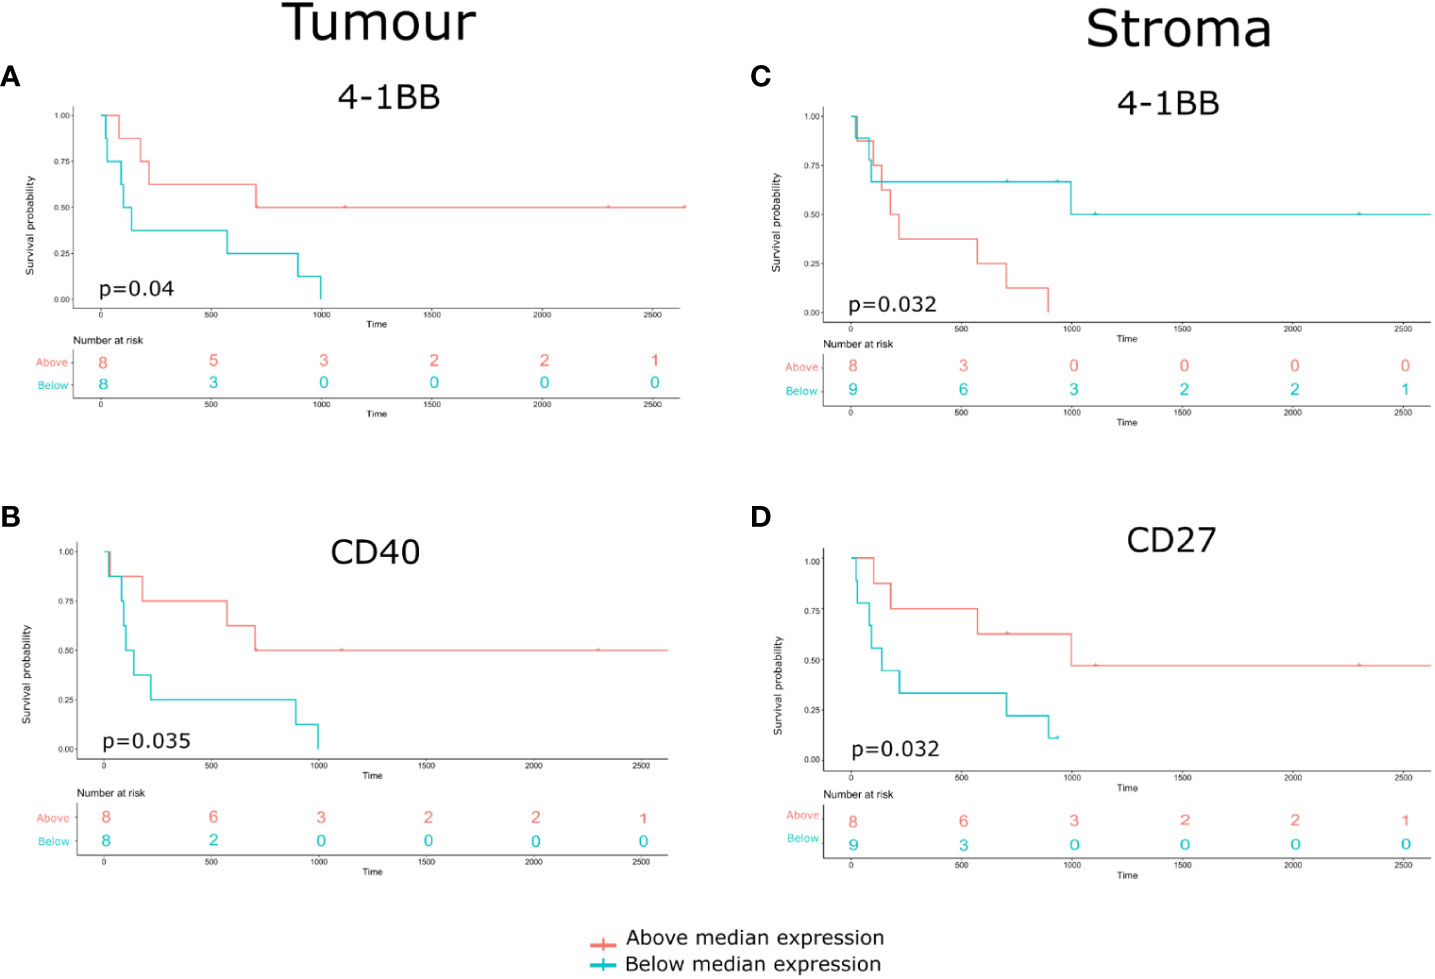
Figure 8 Identification of Compartmentalized protein enrichment with survival associations. (A, B) The Kaplan-Meier survival analyses conducted on the tumor protein biomarker expression. (C, D) The Kaplan-Meier survival analyses conducted on the stromal protein biomarker expression. The p-value of the curves is calculated using the log-rank test.
Additionally, we performed a Kaplan-Meier survival analysis to look into the relationship between CD20 and overall survival. Despite a trend towards improved survival with higher CD20 expression, the result was not statistically significant due to the sample size limitation (Supplementary Figure 4). To investigate the association between patient subgroups and overall survival (OS), we conducted a COX proportional hazard model. We found that p16 positive status (a surrogate marker for HPV infection) was associated with a better survival (Supplementary Figure 5). Furthermore, a dendrogram heatmap to visualise the association between biomarker expression and patients’ clinical-pathological characteristics was constructed (Supplementary Figure 6).
Single cell phenotyping of tissue samples with the Akoya PhenoCycler-Fusion
Ultra-high plex immunofluorescence (IF) whole slide tissue images were obtained using the Akoya PhenoCycler-Fusion platform. The morphology markers included panCK (red), CD45 (green), DAPI (blue), and E-cadherin (pink) (Figures 9A–D). Cell type across different samples from patients with CR, PR, SD, and PD were generated (Figures 9E–H). Pie charts were constructed to reveal the abundance of distinct phenotype clusters across patients’ tissue samples (Figures 9I–L). A heatmap was created in order to show biomarker expression of different cell types (Figure 9M). To reveal the intra-tumor heterogeneity, a stacked bar graph indicating cell type composition was generated across patients’ tissue samples (Figure 9N). Additionally, tissue segmentation of the individual cases composed of clinical responses of CR, PR, SD, and PD was created to demonstrate the spatially resolved distribution of the tumor, tumor front, and stroma. (Figures 10A–D). Stacked bar graphs displaying cell type composition in various compartments was generated in these patients samples (Figures 10E–G). Most notably, the proportion of B-cells and CD8+ T-cells were highly enriched in the CR and PR groups compared to SD and PD, emphasizing a greater proportion of tumor B- and T-cell infiltration in the response groups.
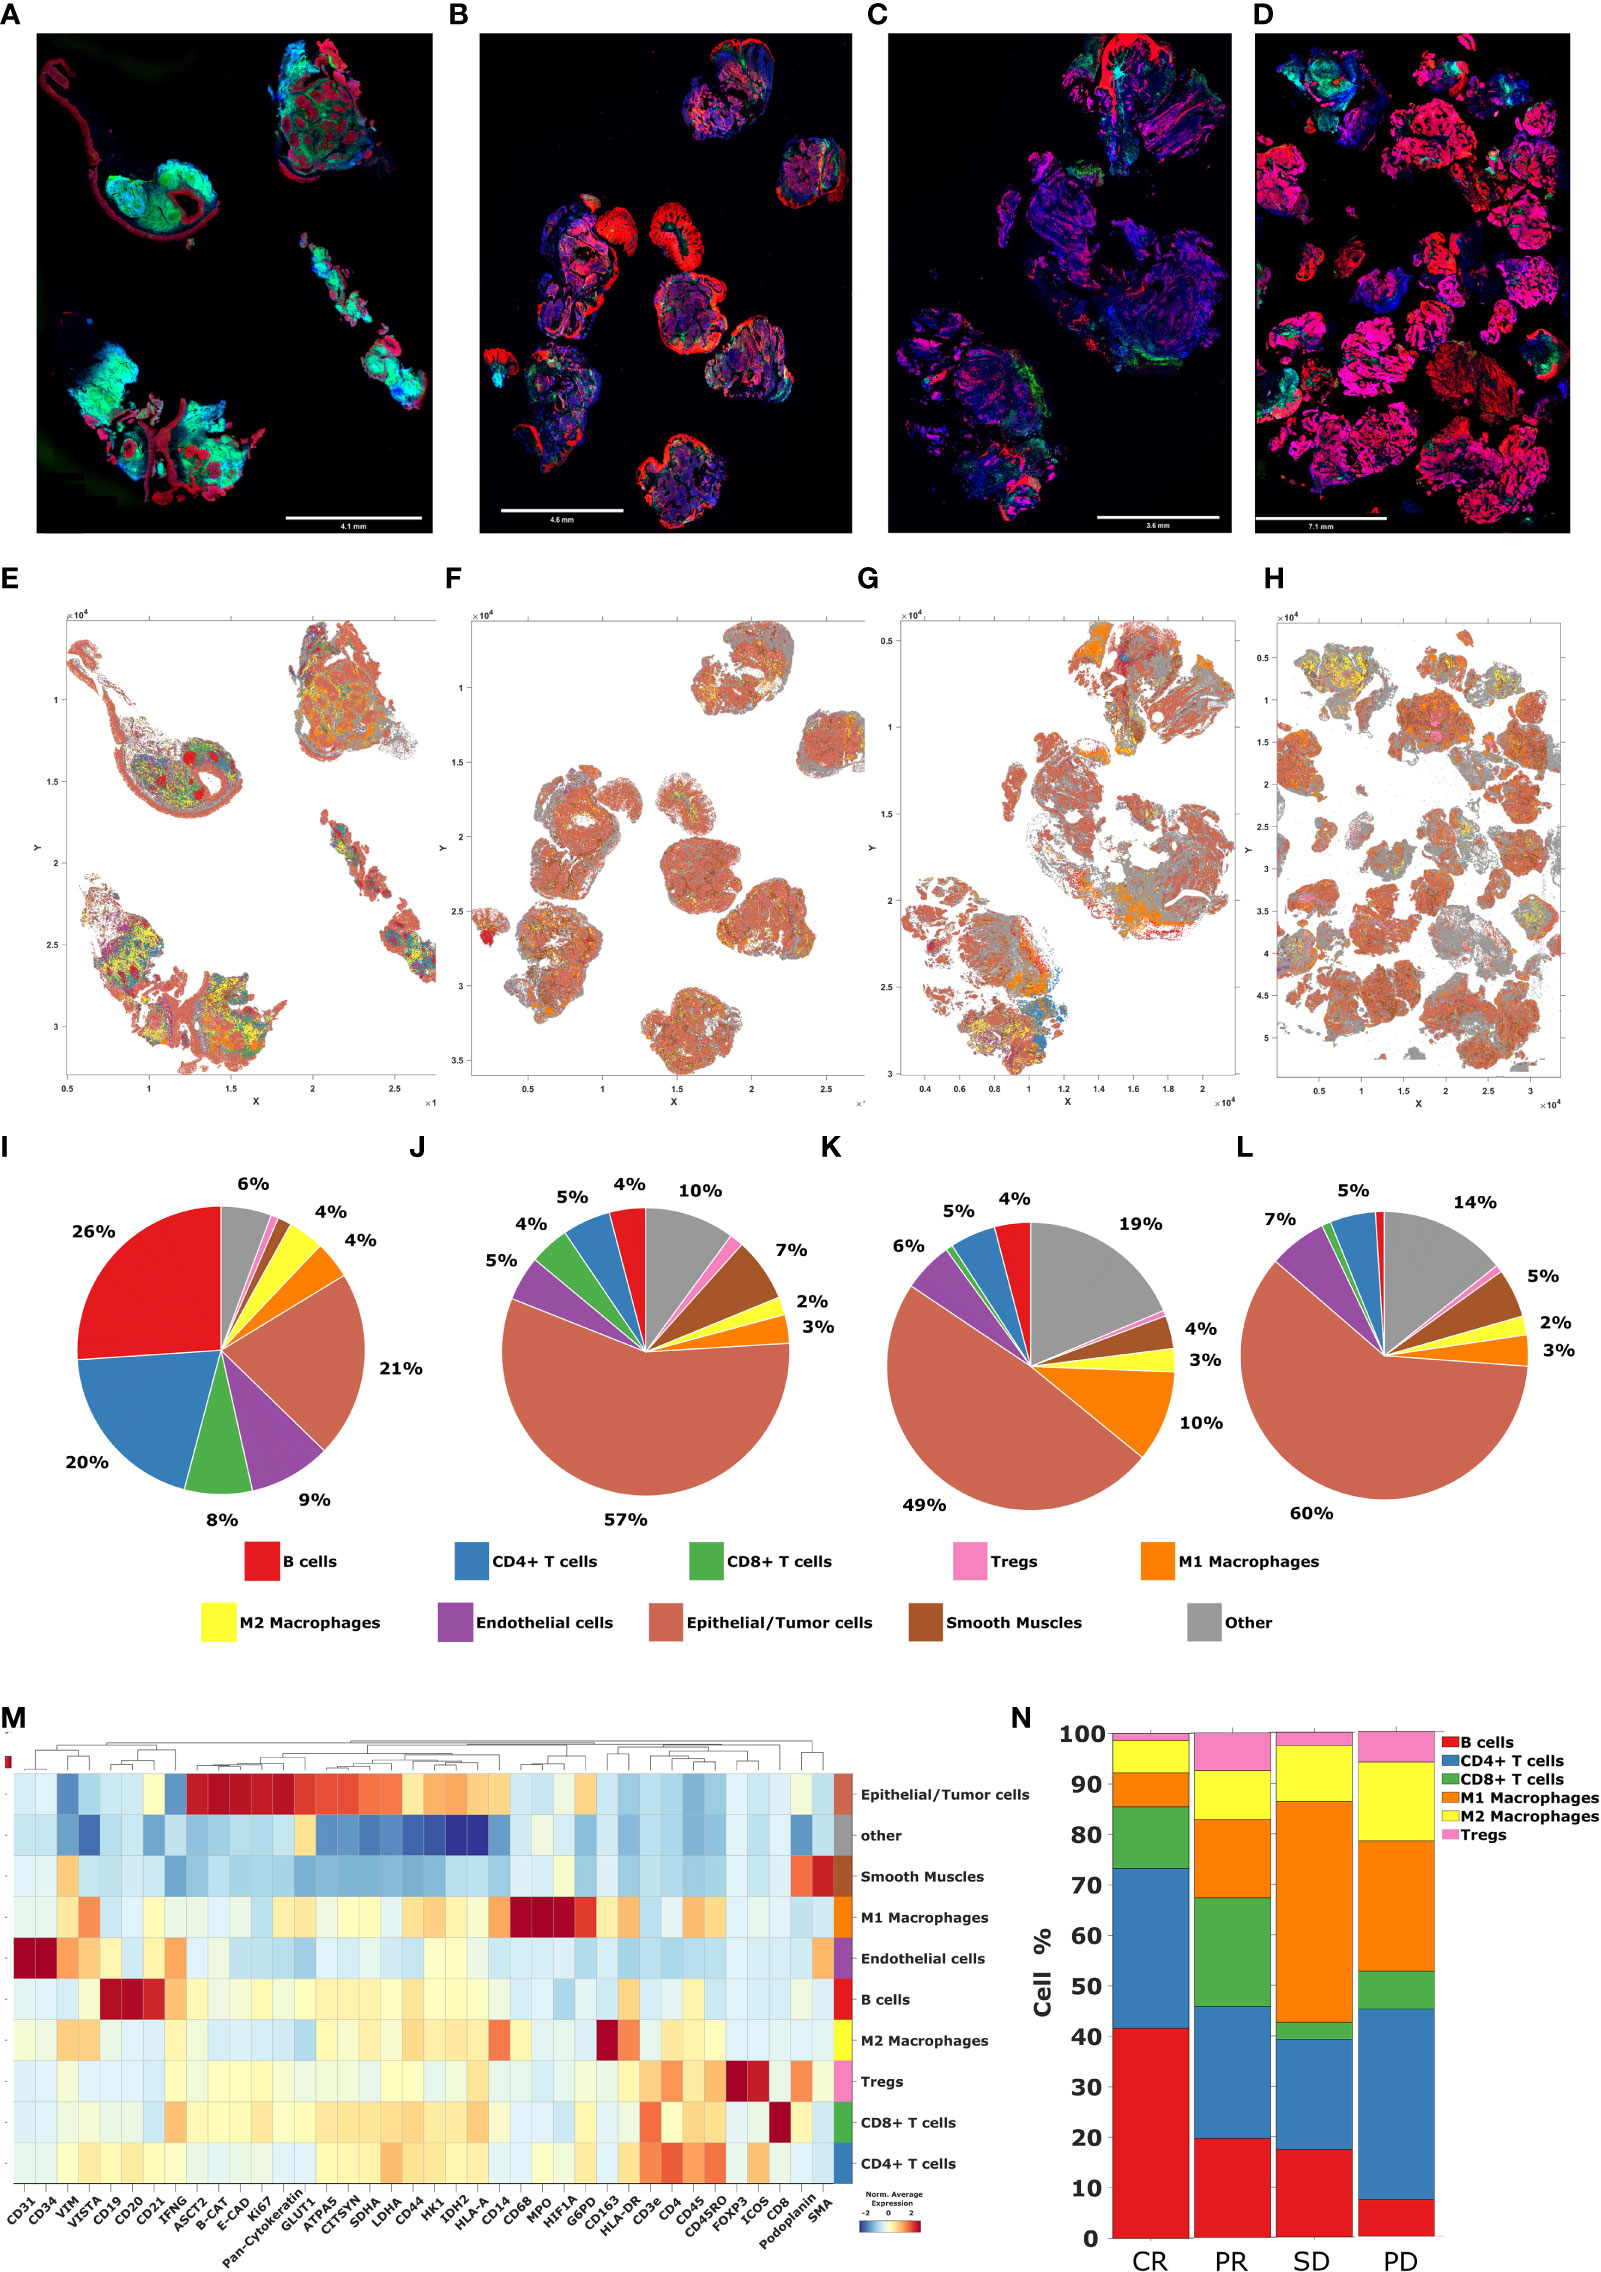
Figure 9 Cell phenotyping by Akoya PhenoCycler-Fusion. (A–D) High plex immunofluorescence (mIF) whole slide tissue images of patients with CR, PR, SD, and PD, from left to right respectively. Blue = DAPI, Green = CD45, Pink = E-cadherin, Red = panCK (E–H) Tissue maps of patients with CR, PR, SD, and PD, from left to right respectively. (I–L) The pie charts representing the abundance of distinct phenotype clusters sorted by color across tissue samples from patients with CR, PR, SD, and PD, from left to right respectively. (M) The heatmap including a curated clustering dendogram with cell types. (N) The bar chart representing cell type composition as well as the intra-tumor heterogeneity across tissue samples from patients with CR, PR, SD, and PD, from left to right respectively.
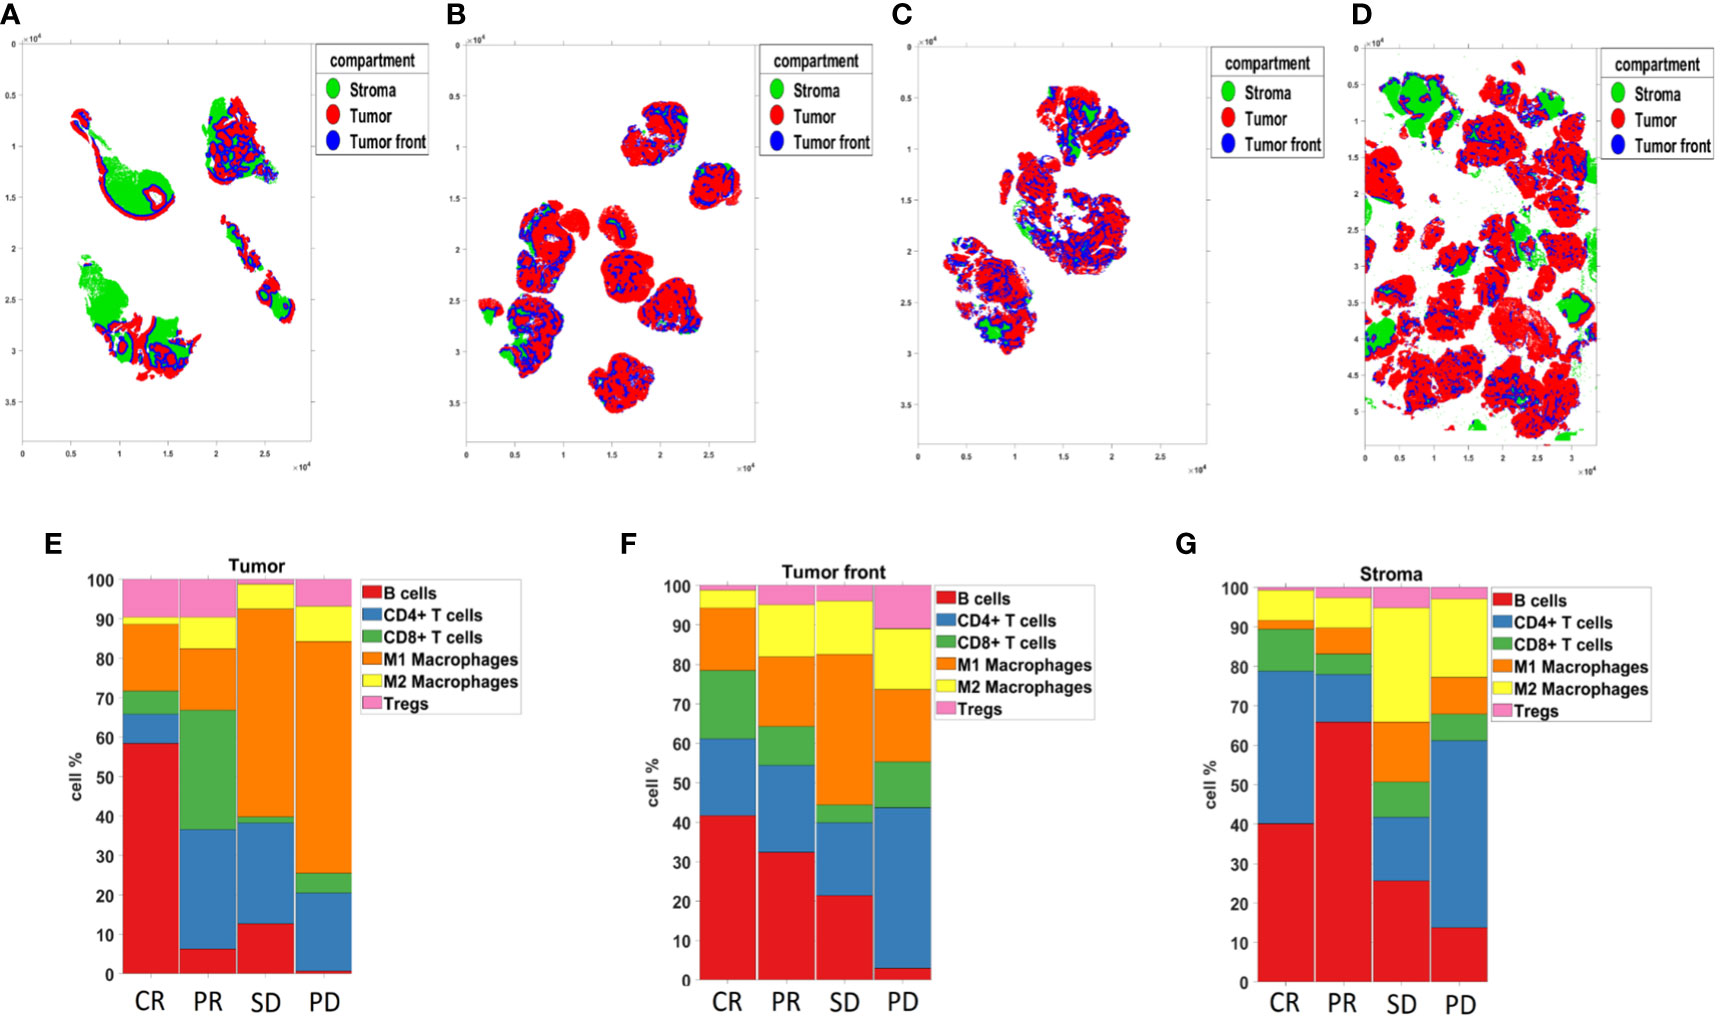
Figure 10 Compartmentalized analysis. (A–D) Tissue segmentation of patients with CR, PR, SD, and PD, from left to right respectively. (E–G) The bar chart representing Compartmentalized cell type composition across tissue samples from patients with CR, PR, SD, and PD, from left to right respectively.
Discussion
Immune checkpoint inhibitors (ICIs), including anti-PD-1 antibodies Pembrolizumab and Nivolumab, have shown promising results in patients with R/M HNSCC However, only 15 to 20% of patients benefit from single-agent ICI (19). The immune characteristics of the TME play an important role in immunotherapy response, and include the cell types, densities, and their locations which influence the cell-cell communication involved in immune cell activity, and are therefore indicated as significant predictors of outcome to ICIs (20). Spatial analysis of the TME could help characterize the cellular and molecular interactions across tumor, immune, and non-immune cells. Watson et al., 2022 showed that the distance and proximity of immune cells, particularly CD8+ T cells, to tumor cells can influence immunotherapy response outcomes, supporting the significance of spatially resolved TME interrogation (10). In this study, we used two spatial profiling technologies to characterize HNSCC TME, the Nanostring GeoMx Digital Spatial Profiler (DSP) and the Akoya PhenoCycler-Fusion, to dissect the cellular architecture of ICI-treated patients to identify potential biomarkers or prognostic features from immunotherapy response groups. We first broadly grouped patients into Disease responders (CR, PR, SD) and non-responders (PD), and performed sub-analysis of these individual groups. We found that immune checkpoint molecules and tumor necrosis factor receptor (TNFR) superfamily members were indicative of response to immunotherapy.
It is well established that after T cell activation, T cells express inhibitory cell surface receptors, known as immune checkpoint proteins, such as program cell death-1 (PD-1), to prevent further activation. However, tumor cells exploit this process by expressing ligands for these receptors, for example programmed death-ligand 1 (PD-L1 or B7-H1) to bind PD-1, in order to cause T cell exhaustion, which results in T cell inactivation and reduced effector function (21). Studies have shown that PD-L1 expression on tumors or immune cells such as macrophages could be a predictive biomarker of immunotherapy response (6, 22). Similarly, we found PD-L1 higher expression in the tumor regions of responders relative to non-responders. In addition, we found that patients with PR had higher levels of PD-1 and PD-L1 expression in tumor regions than those with PD, supporting the role and benefit of PD-1/PD-L1 axis blockade in HNSCC. Another member of B7 ligand family B7-H3, also known as CD276, is an immune checkpoint inhibitor molecule that regulates the immune system (23). B7-H3 is found to impair natural killer (NK) cell, CD4 T, and CD8 T cell effector functions by releasing a variety of cytokines (23). B7-H3 expression may be linked to immune suppression, which promotes tumor cell growth. Recent studies have found that in a number of solid tumors, including breast, ovarian, brain, and gastric cancer, as well as Merkel cell carcinoma, showed that high expression of B7-H3 increased tumor size, invasion, and proliferation, which were linked to worse prognosis and overall survival (24). However, we found higher levels of B7-H3 expression in both the tumor and stromal compartments of responders compared to non-responders. This finding is consistent with our previous published work on oropharyngeal squamous cell carcinoma (OPSCC), in which we demonstrated that B7-H3 expression in the stroma of nodal metastatic samples was associated with improved overall survival (OS) in patients (25). Here, we show that V-domain immunoglobulin suppressor of T cell activation (VISTA) was enriched in non-responders. VISTA is an inhibitory checkpoint protein belongs to the B7 family that impedes T cell activation and proliferation (26). By being expressed as a ligand on the antigen presenting cells (APCs) or as an inhibitory receptor on T cells, VISTA could play the inhibitory roles (27). Recent studies show that VISTA expression on tumor cells, such as ovarian and endometrial cells, suppress T cell cytokine production and also infiltration (28). In animal immunotherapy studies, therapies targeting both VISTA and PD-L1 proteins could lead to tumor regression and improved survival (29, 30). Furthermore, VISTA was reported to be highly expressed in FOXP3 Tregs and associated with the suppression of the immune system (31, 32). Accordingly, in our study, the expression of VISTA, as well as FOXP3, was lower in tumor regions of responders relative to non-responders.
TNFR superfamily consists of 30 receptors and 19 ligands, all of which have been shown to be involved in cell signaling pathways, influencing the differentiation, proliferation, and survival of immune and non-immune cells (33, 34). In this study, we discovered several TNFR superfamily members, including CD40, OX40L, CD27, 4-1BB, and CD95/Fas, which were differentially expressed by response groups and also associated with overall survival (OS) (35). CD40 (TNFRSF5) is a co-stimulatory cell surface receptor expressed in both hematopoietic and non-hematopoietic cells, where it can activate DCs, prime tumor-specific CD8 T cells, and finally stimulate antitumor immunity (36). CD40 was also shown to promote tumor regression by directing macrophages to infiltrate tumors and increasing the expression of matrix metalloproteinases (37). Accordingly, here we found that CD40 had higher expression in the stroma of responders relative to non-responders. Furthermore, survival analysis revealed that higher CD40 expression was associated with better survival.
OX40L (also known as CD252) is a type II glycoprotein that is expressed in a variety of cell types, including B cells, macrophages, and dendritic cells (DCs), and is involved in multiple T cell subtype activation (38). Studies have shown that targeting OX40-OX40L interactions may increase CD4 and CD8 T cell survival, resulting in a better response to immunotherapy and a better patient prognosis (39, 40). Here, we showed that patients with SD had higher levels of tumor OX40L expression than those with progression. Cluster of differentiation 27 (CD27) is a costimulatory T cell receptor that plays a role in T cell proliferation and differentiation into memory and effector T cells (41). CD27 is known to have immune suppressive effects by increasing Treg survival and inducing effector T cell apoptosis (42, 43). Similarly, we found that patients with PR had lower levels of CD27 in the tumor compartment relative to those with PD. However, CD27 expression in the stroma was associated with better survival. In addition, when we compared protein biomarker expression between tumor and stromal compartments, we found that CD27 had a higher expression level in the stromal margins of patient responders. Taking together, we found that the expression of CD27 in the stroma, but not in the tumor, might be associated with a better prognosis in patients with HNSCC.
4-1BB (CD137), a surface glycoprotein and costimulatory receptor expressed on activated T cells, was found to boost cytokine secretion, antiapoptotic molecule upregulation, and T cell effector function (44). Published work indicates that therapies containing 4-1BB result in tumor regression (45). In our study, we showed that higher expression of 4-1BB in the tumor compartment, but not in the stroma, was associated with better survival in HNSCC patients. CD95/Fas is a death receptor that binds to its ligand CD95L/FasL to initiate a death signaling pathway (46). Aside from apoptotic functions, CD95/Fas has been shown to activate anti-apoptotic signaling pathways such as JNK, MAPKs and NF-kβ, resulting in cell survival, proliferation, and migration (47). Qadir et al, have reported that tumor cells express CD95/Fas in order to support their growth (48). Here, we found that patients with PR had lower expression levels of CD95/Fas in the tumor compartment compared to patients with progression. However, in a comparison of CD95/Fas protein expression in the patient with CR versus those with PR, this protein was found to be more abundant in the stromal compartment of CR, despite low statistical power.
Co-stimulatory molecules, such as CD40 or 4-1BB, have positive impact on immune cell functions, but co-inhibitory molecules, such as PD-1/PD-L1 or CTLA-4, have the opposite effect (49, 50). Therefore, targeting these signaling molecules together, which means agonistic antibodies for TNFR molecules along with antagonistic antibodies for ICIs, could improve immune activation and anti-tumor immune responses (49, 51). It was found that the combination of CTLA-4 blockade and 4-1BB co-stimulation could increase tumor infiltrating lymphocytes, such as CD4+ and CD8+ T cells, contributing to further tumor eradication and, eventually, survival improvement (51–53). Also, the combination of agonistic anti-4-1BB antibodies and anti-PD-1 plus radiotherapy demonstrated promising antitumor activity (51, 54, 55).
Due to the limitations of ROI-based data generation, which collects protein expression only in ROI selected areas rather than resolved singe-cell resolution, we employed the Akoya PhenoCycler-Fusion on a representative whole section tissue sample for each response group. The PhenoCycler-Fusion data identified an increased presence of B-cells and CD8+ T-cells in patients with CR/PR compared to SD/PD (Figures 9, 10). A similar trend of an increased CD20 (B-lymphocyte antigen) was found using the Nanostring GeoMx ROI based approach in the CR group. The presence of B-cells, and mature tertiary lymphoid structures in the tumor microenvironment has been reported to be favorable for immunotherapy treatment (56, 57). In this approach, high-plex single-cell based approaches have been used to validate the ROI selection strategy.
Conclusion
In this study of patients with R/M HNSCC, we found that Compartmentalized expression of immune checkpoint molecules may stratify patient responders from non-responders to immunotherapy. Moreover, when we further performed sub-analysis of the clinical groupings, we found that TNFR superfamily of molecules were important factors of response to immunotherapy. These proteins drive a wide range of functions, including dichotomous roles of T cell activation and cell death signaling. Taken together, our study demonstrates how targeted spatial proteomic approaches may provide new cues to identify biomarkers of ICI therapy in HNSCC. Moreover, these data may aid in the identification of new Compartmentalized biomarkers for routine clinical use by standard pathology immunohistochemistry staining.
Data availability statement
The datasets presented in this study can be found in online repositories. The names of the repository/repositories and accession number(s) can be found below: GSE217640 (GEO).
Ethics statement
This study has Human Research Ethics (HREC) approval from the Royal Brisbane and Women’s Hospital (RBWH) (LNR/2020/QRBW/66744) and The University of Queensland. The patients/participants provided their written informed consent to participate in this study.
Author contributions
Idea concept, BH, KO’B, and AK. Methodology/experimental, HS, JM, NM, MW, MA, QN, RL, OB, BH, and AK. Data analysis, NL, JM, BC, NJ, CT, OB, and MD. Writing and critical review, all authors. All authors contributed to the article and approved the submitted version.
Funding
NHMRC Fellowship for AK (1157741). Advance Queensland Industry Research Fellowship to MA. The authors thank the Passe and Williams Foundation conjoint grant for AK and BH.
Acknowledgments
The authors thank the Queensland University of Technology CARF facilities (Dr. Christina Theodoropoulos, Kyle Upton), Dr. Caroline Cooper (Pathology Queensland) and Mr. Tony Blick (Clinical-oMx lab, University of Queensland).
Conflict of interest
NM, BC, NJ, and OB are employees of Akoya Biosciences. BH, advisory board member of Merck Sharpe and Dohme, Bristol Myers Squibb, Astra Zeneca, Pfizer, Takeda, Sanofi, Eisai.
The remaining authors declare that the research was conducted in the absence of any commercial or financial relationships that could be construed as a potential conflict of interest.
Publisher’s note
All claims expressed in this article are solely those of the authors and do not necessarily represent those of their affiliated organizations, or those of the publisher, the editors and the reviewers. Any product that may be evaluated in this article, or claim that may be made by its manufacturer, is not guaranteed or endorsed by the publisher.
Supplementary material
The Supplementary Material for this article can be found online at: https://www.frontiersin.org/articles/10.3389/fimmu.2023.1135489/full#supplementary-material
Supplementary Figure 1 | Data normalization by relative log expression (RLE). (A, B) Relative log expression (RLE) per regions of interest (ROIs) were constructed before and after normalization to evaluate confounding experimental effects.
Supplementary Figure 2 | Dimensional reduction analysis using principal component analysis (PCA). (A, B) Principal component analysis (PCA) plots were constructed to visualize batch effects before and after normalization. (C) Scree plot visualizing the number of the principal component against its corresponding eigenvalue.
Supplementary Figure 3 | Differential protein expression between patients with complete response (CR) compared to all other response groups. (A) Limma-voom MA plot demonstrating tumor expression of protein biomarkers in patients with CR compared to patients with PR, ranked by fold change (logFC). (B) Limma-voom MA plot demonstrating stromal expression of protein biomarkers in patients with CR compared to patients with PR, ranked by fold change (logFC). (C) Limma-voom MA plot demonstrating tumor expression of protein biomarkers in patients with CR compared to patients with SD, ranked by fold change (logFC). (D) Limma-voom MA plot demonstrating stromal expression of protein biomarkers in patients with CR compared to patients with SD, ranked by fold change (logFC). (E) Limma-voom MA plot demonstrating tumor expression of protein biomarkers in patients with CR compared to patients with PD, ranked by fold change (logFC). (F) Limma-voom MA plot demonstrating stromal expression of protein biomarkers in patients with CR compared to patients with PD, ranked by fold change (logFC).
Supplementary Figure 4 | CD20 expression and association with survival. Kaplan-Meier survival curve visualizing the relationship between CD20 expression of patients’ survival.
Supplementary Figure 5 | Identification of patients’ subgroup with overall survival associations. Multivariate COX proportional hazard analysis is conducted to show the hazard ratio with 95% confidence interval for different subgroup of patients. HR>1 indicates association with poorer outcomes.
Supplementary Figure 6 | Dendrogram heatmap of patients grouped by best responses in columns and protein expression in rows. (A) Dendrogram of tumor protein expression. (B) Dendrogram of stromal protein expression. Complete Response (green), Partial response (orange), stable disease (purple), progressive disease (blue).
References
1. Peltanova B, Raudenska M, Masarik M. Effect of tumor microenvironment on pathogenesis of the head and neck squamous cell carcinoma: A systematic review. Mol Cancer (2019) 18(1):1–24. doi: 10.1186/s12943-019-0983-5
3. Johnson DE, Burtness B, Leemans CR, Lui VWY, Bauman JE, Grandis JR. Head and neck squamous cell carcinoma. Nat Rev Dis Primers (2020) 6(1):92. doi: 10.1038/s41572-020-00224-3
4. Rad HS, Shiravand Y, Radfar P, Ladwa R, Perry C, Han X, et al. Understanding the tumor microenvironment in head and neck squamous cell carcinoma. Clin Transl Immunol (2022) 11(6):e1397. doi: 10.1002/cti2.1397
5. Seiwert TY, Burtness B, Mehra R, Weiss J, Berger R, Eder JP, et al. Safety and clinical activity of pembrolizumab for treatment of recurrent or metastatic squamous cell carcinoma of the head and neck (KEYNOTE-012): An open-label, multicentre, phase 1b trial. Lancet Oncol (2016) 17(7):956–65. doi: 10.1016/S1470-2045(16)30066-3
6. Ferris RL, Blumenschein G Jr, Fayette J, Guigay J, Colevas AD, Licitra L, et al. Nivolumab for recurrent squamous-cell carcinoma of the head and neck. N Engl J Med (2016) 375(19):1856–67. doi: 10.1056/NEJMoa1602252
7. Burtness B, Harrington KJ, Greil R, Soulières D, Tahara M, de Castro G Jr, et al. Pembrolizumab alone or with chemotherapy versus cetuximab with chemotherapy for recurrent or metastatic squamous cell carcinoma of the head and neck (KEYNOTE-048): A randomised, open-label, phase 3 study. Lancet (2019) 394(10212):1915–28. doi: 10.1016/S0140-6736(19)32591-7
8. Sadeghi Rad H, Monkman J, Warkiani ME, Ladwa R, O'Byrne K, Rezaei N, et al. Understanding the tumor microenvironment for effective immunotherapy. Med Res Rev (2021) 41(3):1474–98. doi: 10.1002/med.21765
9. Sadeghi Rad H, Bazaz SR, Monkman J, Ebrahimi Warkiani M, Rezaei N, O'Byrne K, et al. The evolving landscape of predictive biomarkers in immuno-oncology with a focus on spatial technologies. Clin Transl Immunol (2020) 9(11):e1215. doi: 10.1002/cti2.1215
10. Moldoveanu D, Ramsay L, Lajoie M, Anderson-Trocme L, Lingrand M, Berry D, et al. Spatially mapping the immune landscape of melanoma using imaging mass cytometry. Sci Immunol (2022) 7(70):eabi5072. doi: 10.1126/sciimmunol.abi5072
11. Robinson MD, McCarthy DJ, Smyth GK. edgeR: a bioconductor package for differential expression analysis of digital gene expression data. Bioinformatics (2010) 26(1):139–40. doi: 10.1093/bioinformatics/btp616
12. Ritchie ME, Phipson B, Wu D, Hu Y, Law CW, Shi W, et al. Limma powers differential expression analyses for RNA-sequencing and microarray studies. Nucleic Acids Res (2015) 43(7):e47–7. doi: 10.1093/nar/gkv007
13. Smyth GK. Limma: Linear models for microarray data. In: Bioinformatics and computational biology solutions using r and bioconductor. New York, NY: Springer (2005). p. 397–420.
15. Schmidt U, Weigert M, Broaddus C, Myers G. Cell detection with star-convex polygons. In: Medical image computing and computer assisted intervention – MICCAI 2018. Cham: Springer International Publishing (2018).
16. Korsunsky I, Millard N, Fan J, Slowikowski K, Zhang F, Wei K, et al. Fast, sensitive and accurate integration of single-cell data with harmony. Nat Methods (2019) 16(12):1289–96. doi: 10.1038/s41592-019-0619-0
17. Wolf FA, Angerer P, Theis FJ. SCANPY: large-scale single-cell gene expression data analysis. Genome Biol (2018) 19(1):15. doi: 10.1186/s13059-017-1382-0
18. Nolet C, Lal A, Ilango R, Dyer T, Movva R, Zedlewski J, et al. Accelerating single-cell genomic analysis with GPUs. bioRxiv (2022), 493607. doi: 10.1101/2022.05.26.493607
19. Tosi A, Parisatto B, Menegaldo A, Spinato G, Guido M, Del Mistro A, et al. The immune microenvironment of HPV-positive and HPV-negative oropharyngeal squamous cell carcinoma: A multiparametric quantitative and spatial analysis unveils a rationale to target treatment-naïve tumors with immune checkpoint inhibitors. J Exp Clin Cancer Res (2022) 41(1):279. doi: 10.1186/s13046-022-02481-4
20. Bhat AA, Yousuf P, Wani NA, Rizwan A, Chauhan SS, Siddiqi MA, et al. Tumor microenvironment: an evil nexus promoting aggressive head and neck squamous cell carcinoma and avenue for targeted therapy. Signal Transduct Target Ther (2021) 6(1):12. doi: 10.1038/s41392-020-00419-w
21. Havel JJ, Chowell D, Chan TA. The evolving landscape of biomarkers for checkpoint inhibitor immunotherapy. Nat Rev Cancer (2019) 19(3):133–50. doi: 10.1038/s41568-019-0116-x
22. Cohen EEW, Soulières D, Le Tourneau C, Dinis J, Licitra L, Ahn MJ, et al. Pembrolizumab versus methotrexate, docetaxel, or cetuximab for recurrent or metastatic head-and-neck squamous cell carcinoma (KEYNOTE-040): A randomised, open-label, phase 3 study. Lancet (2019) 393(10167):156–67. doi: 10.1016/S0140-6736(18)31999-8
23. Kontos F, Michelakos T, Kurokawa T, Sadagopan A, Schwab JH. B7-H3: An attractive target for antibody-based immunotherapy. Clin Cancer Res (2021) 27(5):1227–35. doi: 10.1158/1078-0432.CCR-20-2584
24. Zhou WT, Jin WL. B7-H3/CD276: An emerging cancer immunotherapy. Front Immunol (2021) 12:701006. doi: 10.3389/fimmu.2021.701006
25. Sadeghirad H, Monkman J, Mehdi AM, Ladwa R, O'Byrne K, Hughes BGM, et al. Dissecting tissue compartment-specific protein signatures in primary and metastatic oropharyngeal squamous cell carcinomas. Front Immunol (2022) 13. doi: 10.3389/fimmu.2022.895513
26. Xu W, Dong J, Zheng Y, Zhou J, Yuan Y, Ta HM, et al. Immune-checkpoint protein VISTA regulates antitumor immunity by controlling myeloid cell–mediated inflammation and ImmunosuppressionImmune-checkpoint protein VISTA regulates myeloid cells. Cancer Immunol Res (2019) 7(9):1497–510. doi: 10.1158/2326-6066.CIR-18-0489
27. Rosenbaum SR, Knecht M, Mollaee M, Zhong Z, Erkes DA, McCue PA, et al. FOXD3 regulates VISTA expression in melanoma. Cell Rep (2020) 30(2):510–524.e6. doi: 10.1016/j.celrep.2019.12.036
28. Mulati K, Hamanishi J, Matsumura N, Chamoto K, Mise N, Abiko K, et al. VISTA expressed in tumour cells regulates T cell function. Br J Cancer (2019) 120(1):115–27. doi: 10.1038/s41416-018-0313-5
29. Liu J, Yuan Y, Chen W, Putra J, Suriawinata AA, Schenk AD, et al. Immune-checkpoint proteins VISTA and PD-1 nonredundantly regulate murine T-cell responses. Proc Natl Acad Sci U.S.A. (2015) 112(21):6682–7. doi: 10.1073/pnas.1420370112
30. Yuan L, Tatineni J, Mahoney KM, Freeman GJ. VISTA: A mediator of quiescence and a promising target in cancer immunotherapy. Trends Immunol (2021) 42(3):209–27. doi: 10.1016/j.it.2020.12.008
31. ElTanbouly MA, Croteau W, Noelle RJ, Lines JL. VISTA: a novel immunotherapy target for normalizing innate and adaptive immunity. Semin Immunol (2019) 42:101308. doi: 10.1016/j.smim.2019.101308
32. ElTanbouly MA, Schaafsma E, Noelle RJ, Lines JL. VISTA: Coming of age as a multi-lineage immune checkpoint. Clin Exp Immunol (2020) 200(2):120–30. doi: 10.1111/cei.13415
33. Micheau O, Rizzi M, Smulski CR. Editorial: TNFR superfamily oligomerization and signaling. Front Cell Dev Biol (2021) 9:682472. doi: 10.3389/fcell.2021.682472
34. Dostert C, Grusdat M, Letellier E, Brenner D. The TNF family of ligands and receptors: Communication modules in the immune system and beyond. Physiol Rev (2019) 99(1):115–60. doi: 10.1152/physrev.00045.2017
35. Hewitt SL, Bai A, Bailey D, Ichikawa K, Zielinski J, Karp R, et al. Durable anticancer immunity from intratumoral administration of IL-23, IL-36γ, and OX40L mRNAs. Sci Transl Med (2019) 11(477):eaat9143. doi: 10.1126/scitranslmed.aat9143
36. Vonderheide RH. CD40 agonist antibodies in cancer immunotherapy. Annu Rev Med (2020) 71:47–58. doi: 10.1146/annurev-med-062518-045435
37. Long KB, Gladney WL, Tooker GM, Graham K, Fraietta JA, Beatty GL, et al. IFNγ and CCL2 cooperate to redirect tumor-infiltrating monocytes to degrade fibrosis and enhance chemotherapy efficacy in pancreatic carcinoma. Cancer Discovery (2016) 6(4):400–13. doi: 10.1158/2159-8290.CD-15-1032
38. Fu Y, Lin Q, Zhang Z, Zhang L. Therapeutic strategies for the costimulatory molecule OX40 in T-cell-mediated immunity. Acta Pharm Sin B (2020) 10(3):414–33. doi: 10.1016/j.apsb.2019.08.010
39. Ishii N, Takahashi T, Soroosh P, Sugamura K. OX40-OX40 ligand interaction in T-cell-mediated immunity and immunopathology. Adv Immunol (2010) 105:63–98. doi: 10.1016/S0065-2776(10)05003-0
40. Linch SN, McNamara MJ, Redmond WL. OX40 agonists and combination immunotherapy: Putting the pedal to the metal. Front Oncol (2015) 5:34. doi: 10.3389/fonc.2015.00034
41. Starzer AM, Berghoff AS. New emerging targets in cancer immunotherapy: CD27 (TNFRSF7). ESMO Open (2020) 4(Suppl 3):e000629. doi: 10.1136/esmoopen-2019-000629
42. Claus C, Riether C, Schürch C, Matter MS, Hilmenyuk T, Ochsenbein AF, et al. CD27 signaling increases the frequency of regulatory T cells and promotes tumor growth. Cancer Res (2012) 72(14):3664–76. doi: 10.1158/0008-5472.CAN-11-2791
43. Tesselaar K, Arens R, van Schijndel GM, Baars PA, van der Valk MA, Borst J, et al. Lethal T cell immunodeficiency induced by chronic costimulation via CD27-CD70 interactions. Nat Immunol (2003) 4(1):49–54. doi: 10.1038/ni869
44. Chester C, Sanmamed MF, Wang J, Melero I. Immunotherapy targeting 4-1BB: Mechanistic rationale, clinical results, and future strategies. Blood (2018) 131(1):49–57. doi: 10.1182/blood-2017-06-741041
45. Bartkowiak T, Curran MA. 4-1BB agonists: Multi-potent potentiators of tumor immunity. Front Oncol (2015) 5:117. doi: 10.3389/fonc.2015.00117
46. Guégan JP, Ginestier C, Charafe-Jauffret E, Ducret T, Quignard JF, Vacher P, et al. CD95/Fas and metastatic disease: What does not kill you makes you stronger. Semin Cancer Biol (2020) 60:121–31. doi: 10.1016/j.semcancer.2019.06.004
47. Barnhart BC, Legembre P, Pietras E, Bubici C, Franzoso G, Peter ME, et al. CD95 ligand induces motility and invasiveness of apoptosis-resistant tumor cells. EMBO J (2004) 23(15):3175–85. doi: 10.1038/sj.emboj.7600325
48. Qadir AS, Guégan JP, Ginestier C, Chaibi A, Bessede A, Charafe-Jauffret E, et al. CD95/Fas protects triple negative breast cancer from anti-tumor activity of NK cells. iScience (2021) 24(11):103348. doi: 10.1016/j.isci.2021.103348
49. Kumar P, Bhattacharya P, Prabhakar BS. A comprehensive review on the role of co-signaling receptors and treg homeostasis in autoimmunity and tumor immunity. J Autoimmun (2018) 95:77–99. doi: 10.1016/j.jaut.2018.08.007
50. Chen L, Flies DB. Molecular mechanisms of T cell co-stimulation and co-inhibition. Nat Rev Immunol (2013) 13(4):227–42. doi: 10.1038/nri3405
51. Schaer DA, Hirschhorn-Cymerman D, Wolchok JD. Targeting tumor-necrosis factor receptor pathways for tumor immunotherapy. J immunother Cancer (2014) 2(1):1–9. doi: 10.1186/2051-1426-2-7
52. Curran MA, Kim M, Montalvo W, Al-Shamkhani A, Allison JP. Combination CTLA-4 blockade and 4-1BB activation enhances tumor rejection by increasing T-cell infiltration, proliferation, and cytokine production. PloS One (2011) 6(4):e19499. doi: 10.1371/journal.pone.0019499
53. Youlin K, Li Z, Xiaodong W, Xiuheng L, Hengchen Z. Combination immunotherapy with 4-1BBL and CTLA-4 blockade for the treatment of prostate cancer. Clin Dev Immunol (2012) 2012:439235. doi: 10.1155/2012/439235
54. Shi W, Siemann DW. Augmented antitumor effects of radiation therapy by 4-1BB antibody (BMS-469492) treatment. Anticancer Res (2006) 26(5A):3445–53.
55. Verbrugge I, Hagekyriakou J, Sharp LL, Galli M, West A, McLaughlin NM, et al. Radiotherapy increases the permissiveness of established mammary tumors to rejection by immunomodulatory antibodies. Cancer Res (2012) 72(13):3163–74. doi: 10.1158/0008-5472.CAN-12-0210
56. Wu Z, Zhou J, Xiao Y, Ming J, Zhou J, Dong F, et al. CD20(+)CD22(+)ADAM28(+) b cells in tertiary lymphoid structures promote immunotherapy response. Front Immunol (2022) 13:865596. doi: 10.3389/fimmu.2022.865596
Keywords: spatial proteomics, head and neck cancer, tumor microenvironment, immunotherapy, head and neck squamous cell carcinoma (HNSCC)
Citation: Sadeghirad H, Liu N, Monkman J, Ma N, Cheikh BB, Jhaveri N, Tan CW, Warkiani ME, Adams MN, Nguyen Q, Ladwa R, Braubach O, O’Byrne K, Davis M, Hughes BGM and Kulasinghe A (2023) Compartmentalized spatial profiling of the tumor microenvironment in head and neck squamous cell carcinoma identifies immune checkpoint molecules and tumor necrosis factor receptor superfamily members as biomarkers of response to immunotherapy. Front. Immunol. 14:1135489. doi: 10.3389/fimmu.2023.1135489
Received: 31 December 2022; Accepted: 08 March 2023;
Published: 03 April 2023.
Edited by:
Tianyi Zhao, Harbin Institute of Technology, ChinaReviewed by:
Bo Xu, Guangzhou First People’s Hospital, ChinaMing Zheng, Academy of Military Medical Sciences, China
Copyright © 2023 Sadeghirad, Liu, Monkman, Ma, Cheikh, Jhaveri, Tan, Warkiani, Adams, Nguyen, Ladwa, Braubach, O’Byrne, Davis, Hughes and Kulasinghe. This is an open-access article distributed under the terms of the Creative Commons Attribution License (CC BY). The use, distribution or reproduction in other forums is permitted, provided the original author(s) and the copyright owner(s) are credited and that the original publication in this journal is cited, in accordance with accepted academic practice. No use, distribution or reproduction is permitted which does not comply with these terms.
*Correspondence: Arutha Kulasinghe, QXJ1dGhhLmt1bGFzaW5naGVAdXEuZWR1LmF1