 Dezheng Sun
 Zhiping Huang2†
 Wenyan Dong
 Chaoqian Liu
- 1Department of Thyroid and Breast Surgery, Changhai Hospital Affiliated to Naval Medical University, Shanghai, China
- 2Department of Hepatobiliary Surgery and Organ Transplantation, General Hospital of Southern Theater Command of People's Liberation Army of China (PLA), Guangzhou, China
Introduction: Bariatric surgery is one of the most effective methods for treating obesity. It can effectively reduce body weight and reduce the incidence of obesity-related breast cancer. However, there are different conclusions about how bariatric surgery changes breast density. The purpose of this study was to clarify the changes in breast density from before to after bariatric surgery.
Methods: The relevant literature was searched through PubMed and Embase to screen for studies. Meta-analysis was used to clarify the changes in breast density from before to after bariatric surgery.
Results: A total of seven studies were included in this systematic review and meta-analysis, including a total of 535 people. The average body mass index decreased from 45.3 kg/m2 before surgery to 34.4 kg/m2 after surgery. By the Breast Imaging Reporting and Data System score, the proportion of grade A breast density from before to after bariatric surgery decreased by 3.83% (183 vs. 176), grade B (248 vs. 263) increased by 6.05%, grade C (94 vs. 89) decreased by 5.32%, and grade D (1 vs. 4) increased by 300%. There was no significant change in breast density from before to after bariatric surgery (OR=1.27, 95% confidence interval (CI) [0.74, 2.20], P=0.38). By the Volpara density grade score, postoperative volumetric breast density increased (standardized mean difference = -0.68, 95% CI [-1.08, -0.27], P = 0.001).
Discussions: Breast density increased significantly after bariatric surgery, but this depended on the method of detecting breast density. Further randomized controlled studies are needed to validate our conclusions.
Introduction
Obesity is a chronic metabolic disease whose global prevalence is rapidly increasing (1). The American Institute for Cancer Research found that obesity was linked to an increased risk of 13 types of cancers (2). Bariatric surgery is currently one of the most effective treatments for obesity, which can reduce body weight by an average of at least 15% (3). It is effective at reducing weight while also reducing the risk of obesity-related cancers, especially postmenopausal breast cancer, endometrial cancer, and colon cancer (4).
Breast density is an indicator of the number of dense and nondense areas in the breast and can be expressed as the ratio of dense areas to the total breast area (5). At present, breast density can be assessed as qualitative breast density and quantitative breast density. Qualitative breast density is primarily assessed by the Breast Imaging Reporting and Data System (BI-RADS) scoring system (6). Quantitative breast density is measured by mammography computer-aided detection (CAD) diagnostic system software, such as the Laboratory for Individualized Breast Radiodensity Assessment (LIBRA), Quantra, and Volpara (7–9). Volpara software uses fibroglandular volume, total breast volume, and the ratio of the two, called volumetric breast density (VBD), to quantitatively assess breast density (9). Volpara’s quantitative breast density score, Volpara density grade (VDG), can be translated to a BI-RADS score as follows: VDG 1: VBD<4.5%; VDG 2: 4.5%≤VBD<7.5%; VDG 3: 7.5%≤VBD ≤ 15.5%; and VDG 4: VBD>15.5%.
Although bariatric surgery can reduce the risk of breast cancer (4), there are inconsistent conclusions about the changes in breast density from before to after bariatric surgery. In this study, we searched the published literature to investigate changes in breast density from before to after bariatric surgery by means of systematic review and meta-analysis.
Methods
Data sources and search strategy
A systematic search of literature on changes in breast density from before to after bariatric surgery was conducted in PubMed and Embase. The last search was on 6 April 2023. Key search terms included “bariatric surgery”, “Sleeve gastrectomy”, “Roux-en-Y”, “ Gastric banding”, and “breast”. The search statements were refined by finding synonyms and hyponyms for these key search terms (Supplementary Material 1).
This study was conducted in accordance with the Preferred Reporting Items for Systematic Reviews and Meta-Analyses (PRISMA) guidelines from 2020 (Supplementary Material 2).
Eligibility criteria
Inclusion criteria: (1) follow-up > 1 year, (2) P: adult obese female, (3) I: bariatric surgery for weight loss, (4) sample size ≥ 10, (5) C: preoperative and postoperative mammography, (6)O: changes in breast density, and (7)S: cohort study. Exclusion criteria: (1) lack of preoperative or postoperative mammography, (2) subjects younger than 18 years, (3) combination of bariatric surgery and other interventions for weight loss, and(4)conference abstract.
Study selection
After importing the retrieved literature into Note Express 3.7.0.9296, duplicate studies were removed, and articles with topics irrelevant to this study were removed by reading the title and abstract. Then, by reading the full text, two independent reviewers (Dezheng Sun and Zhiping Huang) further screened the remaining papers based on the inclusion and exclusion criteria. In case of disagreement, consensus was reached through discussion. If disagreements persisted, an independent reviewer (Chaoqian Liu) made the final decision.
Data extraction and quality assessment
The following information was extracted from the included papers: definition of breast density, method of evaluating breast density, evaluation index of breast density, type of bariatric surgery, type of study, sample size of study, preoperative and postoperative body mass index (BMI), preoperative follow-up time from preoperative X-ray to postoperative X-ray, number of cases of each grade of breast density, publication year, country, and number of citations.The quality of the literature was evaluated according to the Newcastle−Ottawa scale (10), which was scored from the three aspects of selection of cohort studies, comparability, and outcomes. Each article can be given up to nine stars: 7-9 stars are high-quality articles, 4-6 stars are medium-quality articles, and ≤3 stars are low-quality articles.
Statistical analysis
The effect of bariatric surgery on breast density was comprehensively evaluated by the OR value, SMD value, and P value, and the results are displayed in forest plots. Heterogeneity of studies was assessed by the I² value and Cochran Q test. In the Cochran Q test, P<0.05 indicated significant heterogeneity. By I², there was heterogeneity when I²>50% (11). If there was a contradiction between the two, I² was the priority criterion for heterogeneity evaluation. If there was heterogeneity, sensitivity analysis and meta-regression analysis were performed to explore the source of the heterogeneity. In addition, publication bias was evaluated by funnel plot and eggers test. When conducting data analysis, the median can be used to estimate the mean when the sample size of the study is greater than 25. If the sample size of the study is large and the data distribution is close to a normal distribution, the interquartile range is approximately equal to 1.35 times the standard deviation (12). Ratios were compared by Fisher’s exact method. Statistical analysis was performed in Review Manager 5.4, IBM SPSS Statistics 26 and Stata14.
Results
Study retrieval
A total of 1551 documents were retrieved from PubMed search (N=813) and Embase search (N=738). After screening, 78 duplicates were deleted, 1428 were excluded by reading titles and abstracts, and 38 were excluded after full-text reading, leaving seven studies for this systematic review and meta-analysis (Supplementary Material 1). The reasons for exclusion and the screening process are shown in Figure 1.
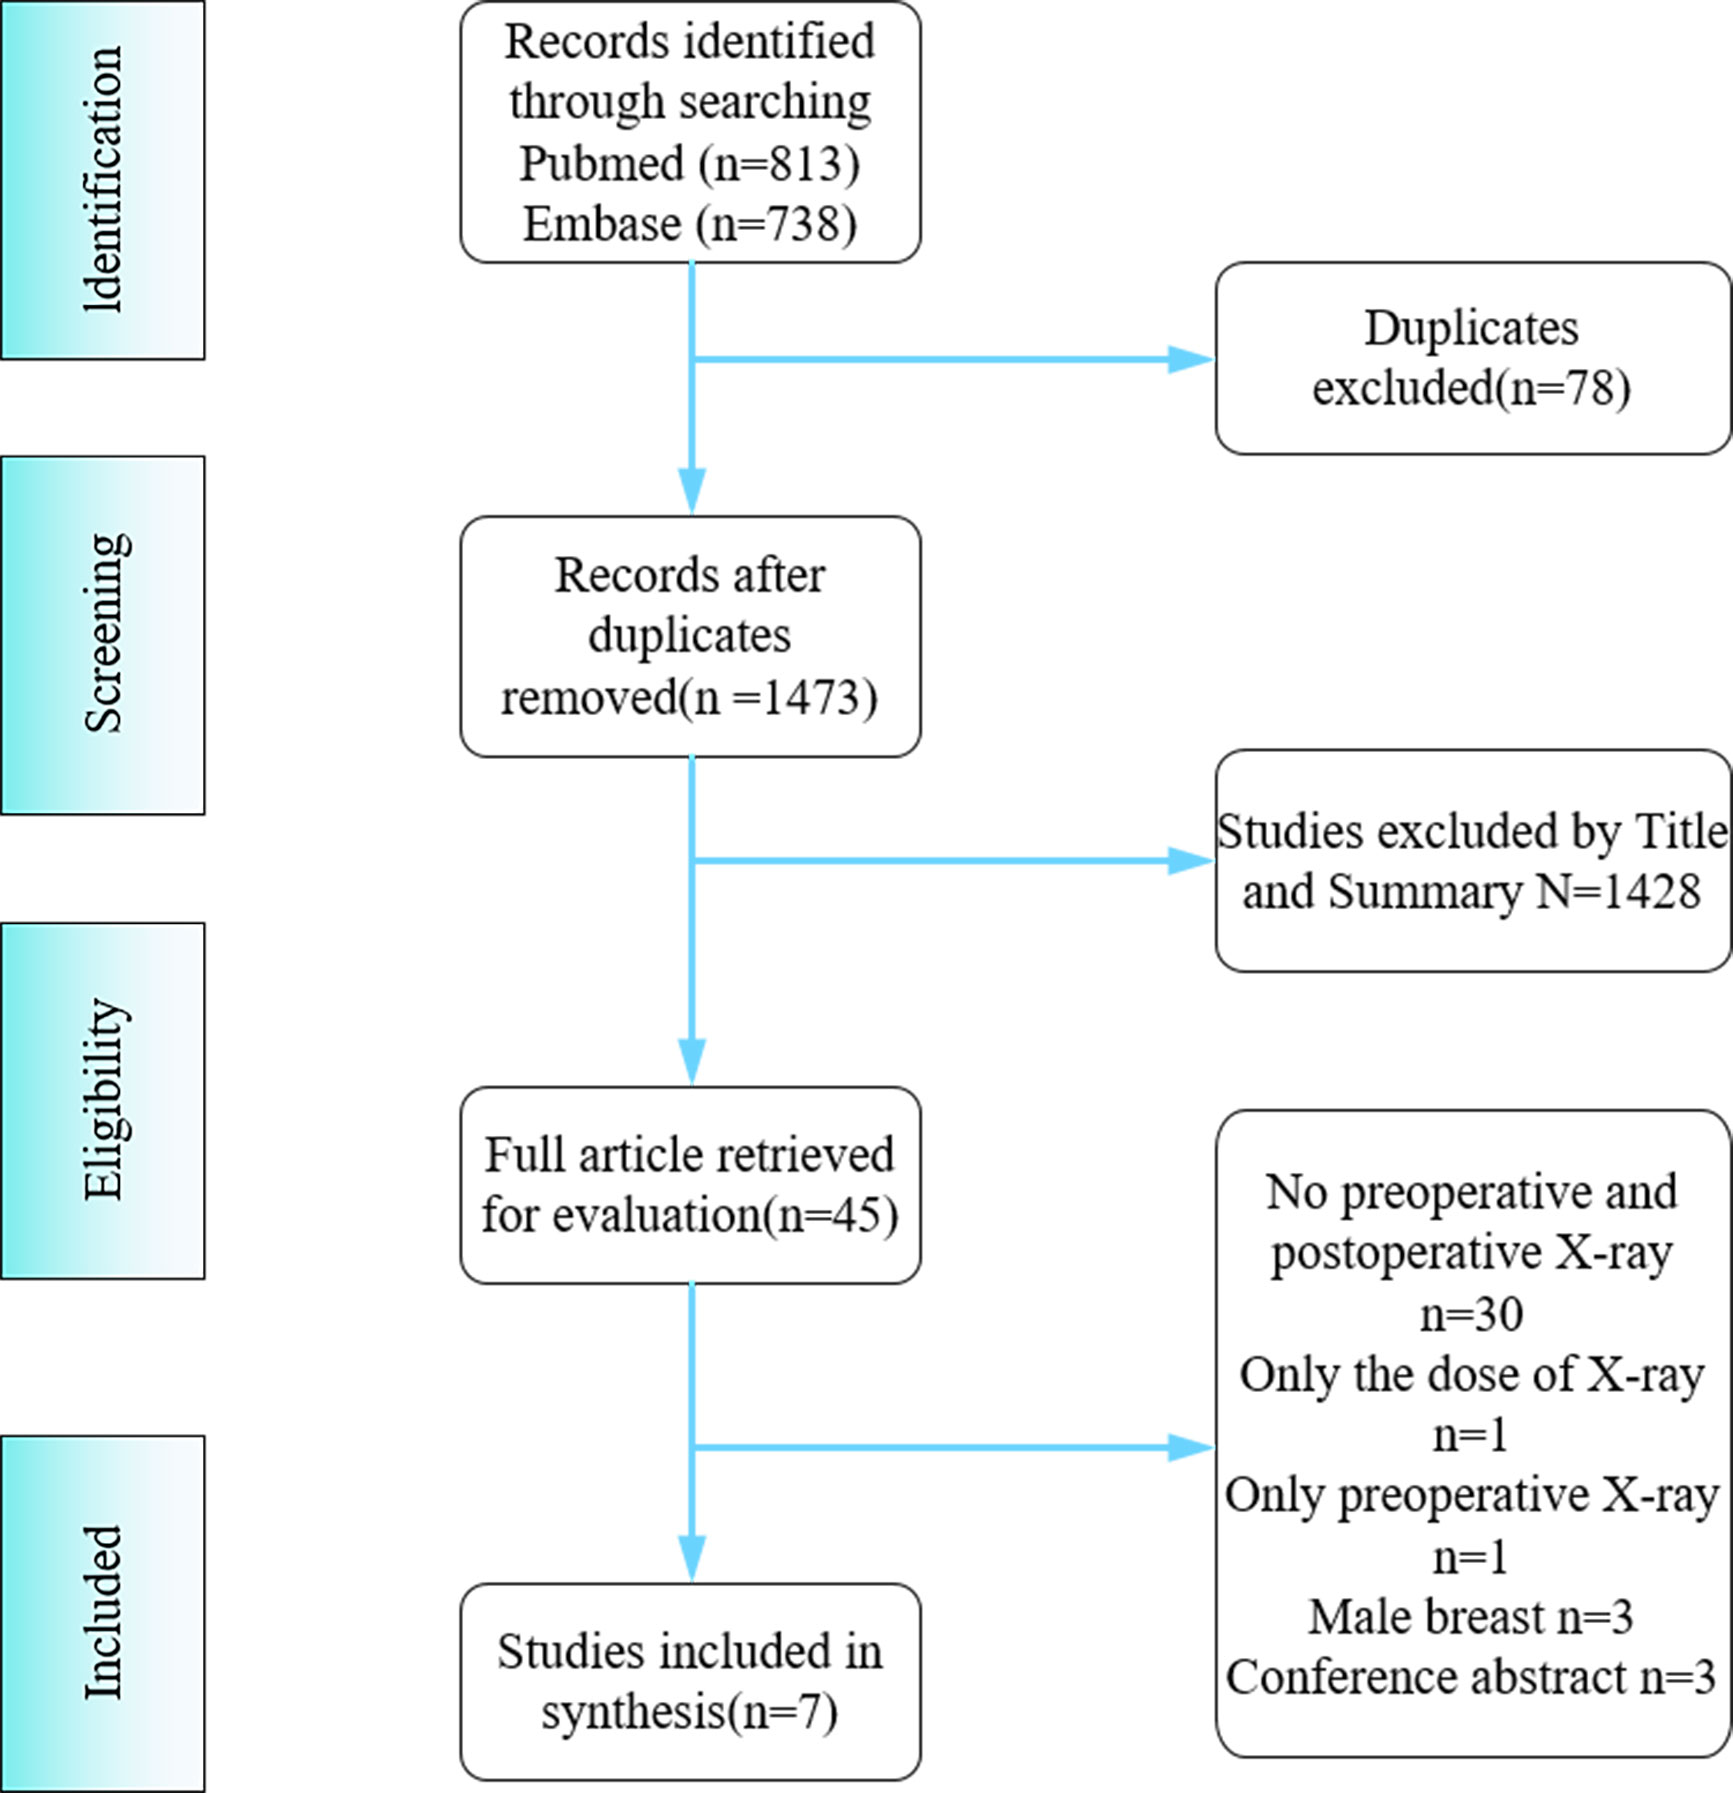
Figure 1 Flow chart of the literature search.
Study characteristics
All seven studies were retrospective studies. They included a total of 535 people. Among them, 302 (56.4%) received Roux-en-Y gastric bypass, 196 (36.6%) received sleeve gastrectomy, and 37 (6.9%) received laparoscopic adjustable gastric banding. The mean BMI decreased from 45.3 kg/m2 preoperatively to 34.4 kg/m2 after surgery. The mean follow-up period was 3.5 years. All seven studies used the BI-RADS scale (6, 13–19). Four (13, 15, 17, 19) used two density scoring methods and evaluation criteria (Table 1). When we compared the BI-RADS scores before and after bariatric surgery (Table 2), we found the following changes: grade A: 183 vs. 176; grade B: 248 vs. 263; grade C: 94 vs. 89; and grade D: 1 vs. 4. BI-RADS grade B was the most common density type, being found in 248 (47.1%) patients preoperatively and 263 (49.4%) patients postoperatively (P=0.509).
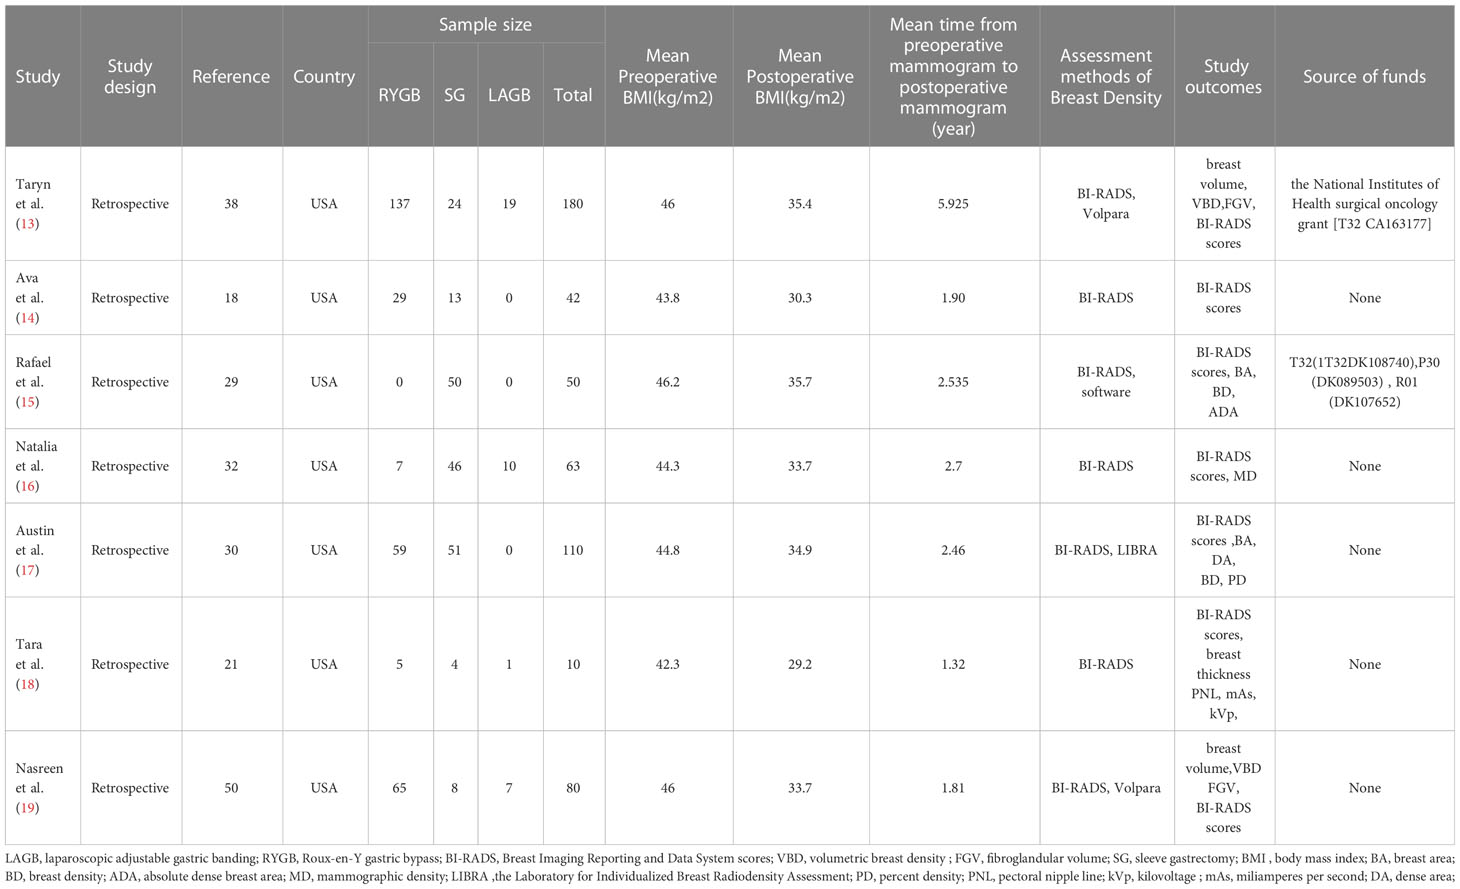
Table 1 Study characteristics of included studies
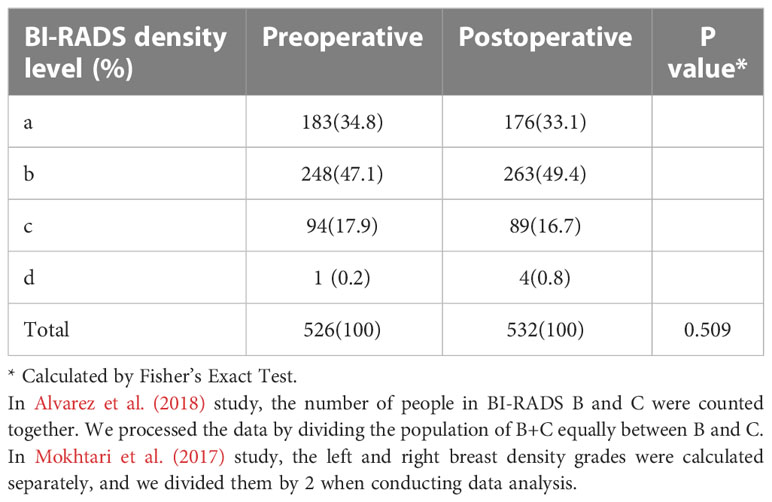
Table 2 Change of BI-RADS density level of Mammary glands.
Quality assessment
In Table 3, the seven included articles are evaluated according to the Newcastle−Ottawa Scale (10). Five were high-quality studies and two were medium-quality. The specific scoring points were set as follows: In the selection of cohort studies, we decided that the exposure cohort was representative when the sample size was >100. In terms of comparability, we considered that the most important variables could be controlled for only if the effect of different surgical modalities on breast density was considered or if only one surgical modality was used. In terms of outcomes, we considered ≥1 year and ≤3 years of postoperative follow-up was adequate.
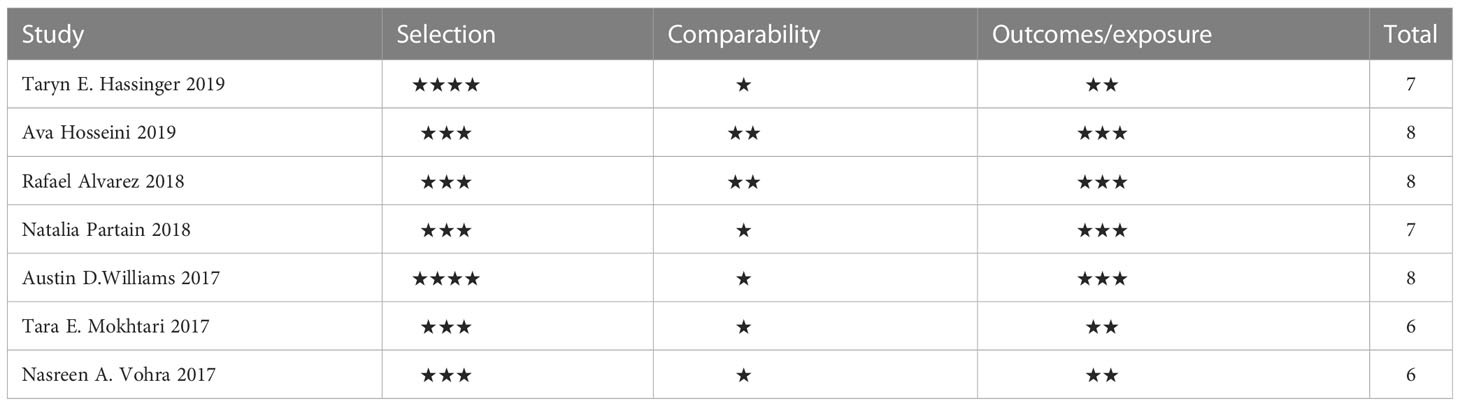
Table 3 Quality assessment of eligible studies.
Meta-analysis of breast density by BI-RADS system
In this study, a meta-analysis was performed on the seven included studies (13–19) using the BI-RADS score as the evaluation standard. The analysis was conducted with dichotomous variables (Figure 2). The results showed that the density grade A from before to after bariatric surgery (183 vs. 176) decreased by 3.83%; heterogeneity: χ² = 16.81, I² = 64%, OR=1.27, 95% confidence interval (CI) [0.74, 2.20]. There was no significant change in breast density from before to after bariatric surgery (P=0.38).
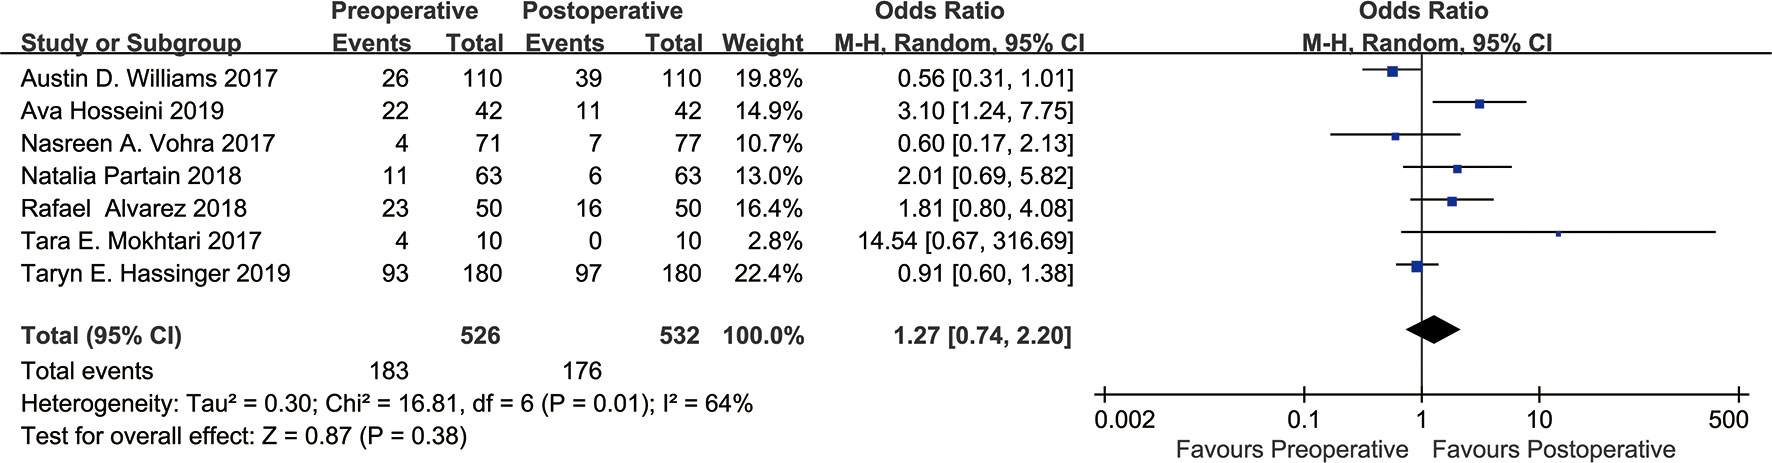
Figure 2 Forest plot of BI-RADS scores BI-RADS grade A was grouped into one category, and grades B, C, D were grouped into one category. Meta-analyses were performed according to dichotomous variables. Since grade D occurred only five times in the seven studies either before or after bariatric surgery, we tried grouping grade D with grades B, C into one group, and this had no significant effect on the results.
Meta-analysis of breast density by the VDG system
Two of the seven included studies used the VDG score (13, 19). We set the VDG score as a continuous variable and performed a meta-analysis of these two studies (Figure 3). The results revealed heterogeneity: χ² = 2.35, I² = 57%, SMD=-0.68, 95% CI [-1.08, -0.27]. According to the VDG score, VBD was significantly increased after bariatric surgery (P=0.001).

Figure 3 Forest plot of VDG score.
Evaluation of heterogeneity and bias
As shown in Figure 2, there was heterogeneity between the studies (I²=64%, Cochran’s Q-test P=0.01), so a random-effect model was used for meta-analysis. Sensitivity analysis showed (Figure 4) that there was no significant heterogeneity in our study. In addition, we conducted regression analysis with the published time, type of surgery, follow-up time and BMI decline as covariables, and the results showed that RYGB (P=0.018) had a certain effect on heterogeneity, while other variables had no significant effect on heterogeneity (Supplementary Material 1). In Figure 3, I²=57%, Cochran Q test P=0.13, meaning there was heterogeneity, and a random-effect model was used. Since only two studies were included in Figure 3, regression analysis and sensitivity analysis were not performed.
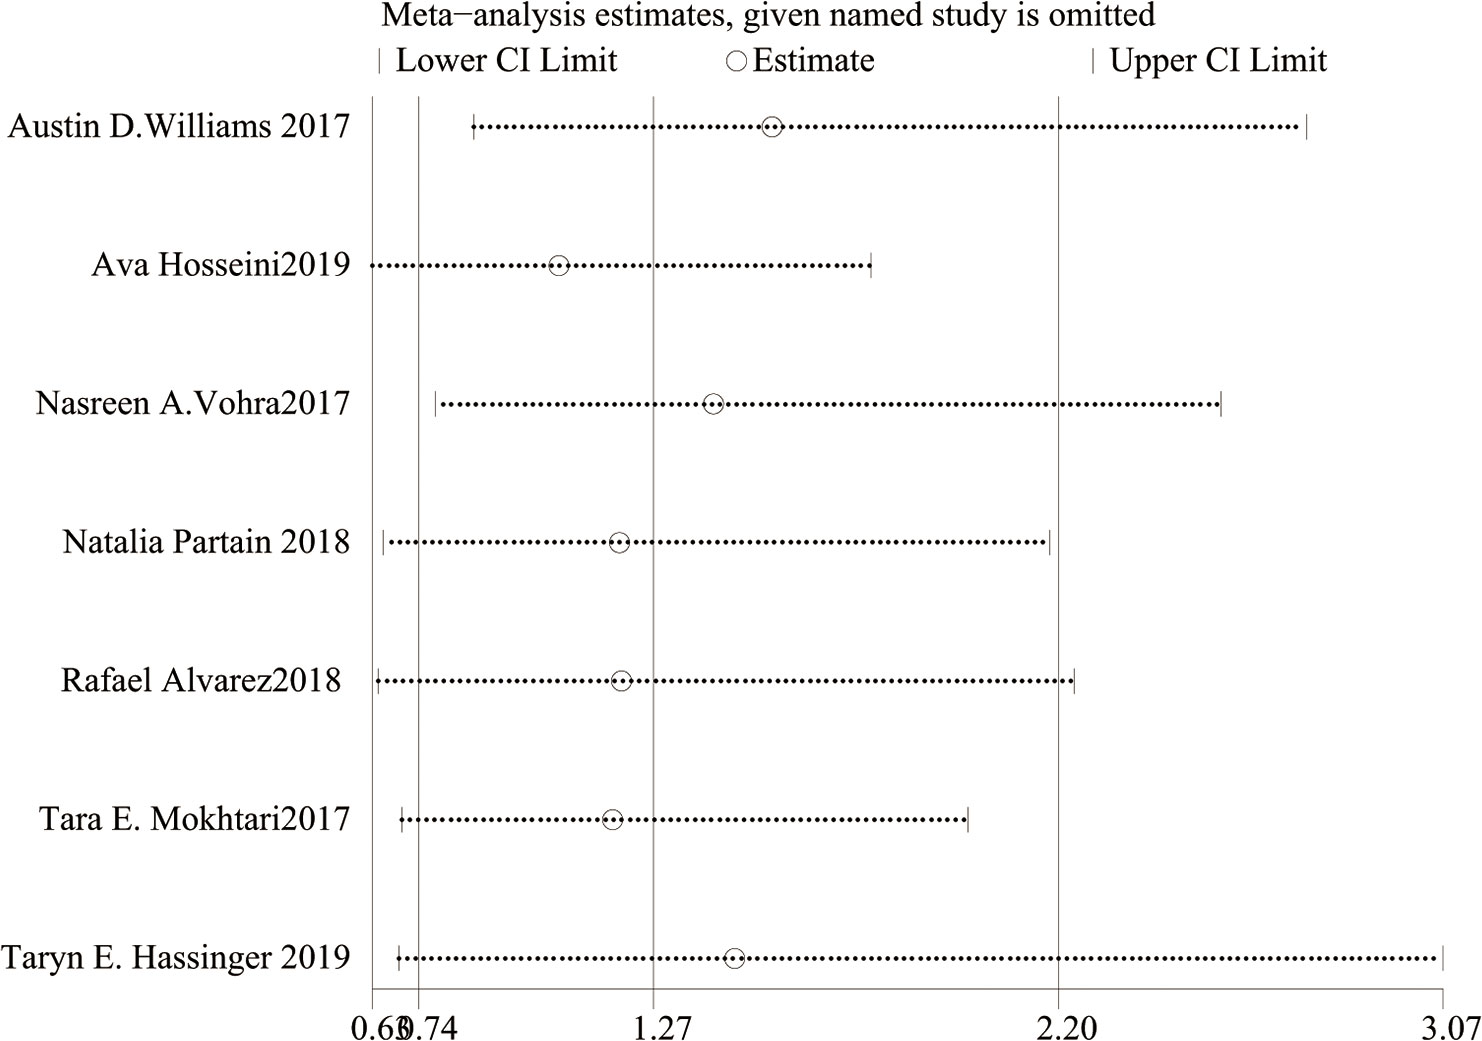
Figure 4 Sensitivity analysis plot of BI-RADS score.
Figure 5 is the funnel plot of the BI-RADS scores of all seven studies. Except for 1 study, there was rough symmetry between the two sides, indicating that there was a certain bias in the statistical results, but the bias was not large (20). To further evaluate publication bias, eggers tests were performed, which showed no significant publication bias (P=0.170).
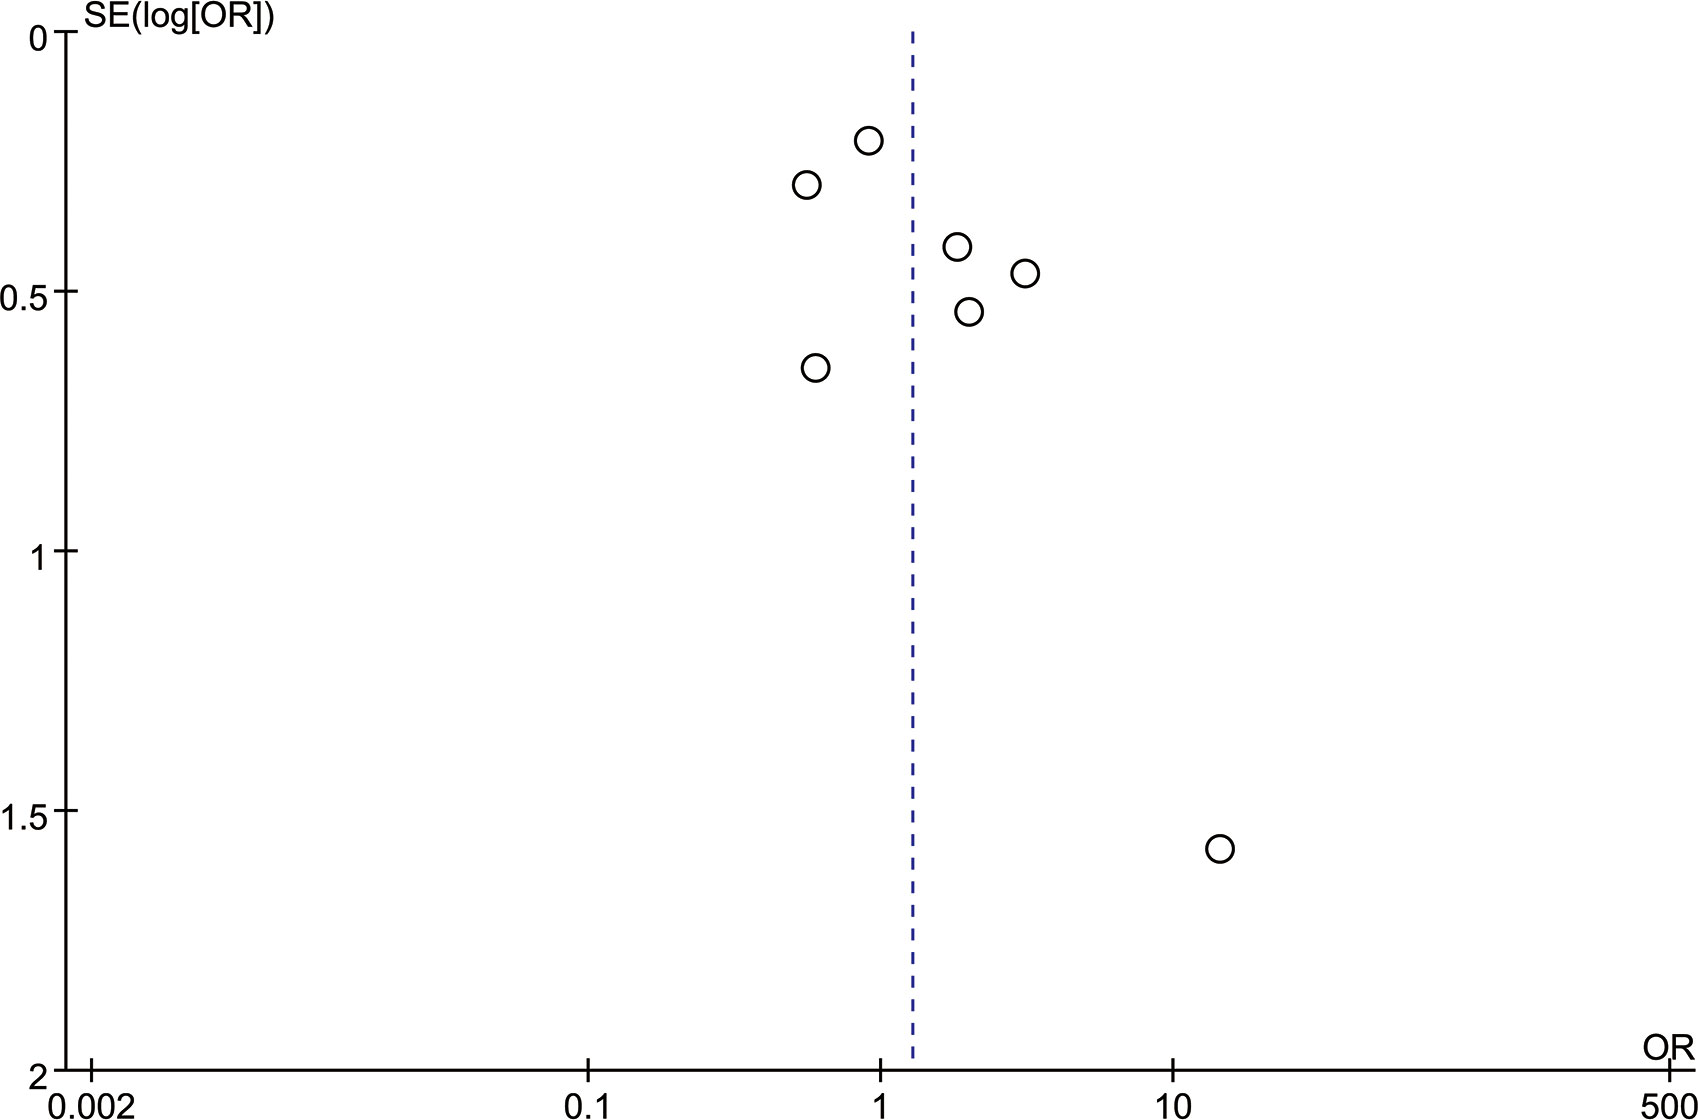
Figure 5 Funnel plot of BI-RADS score.
Figure 6 shows the funnel plot of the two studies that reported VDG scores. The two sides were roughly symmetrical, so there was no bias (20).
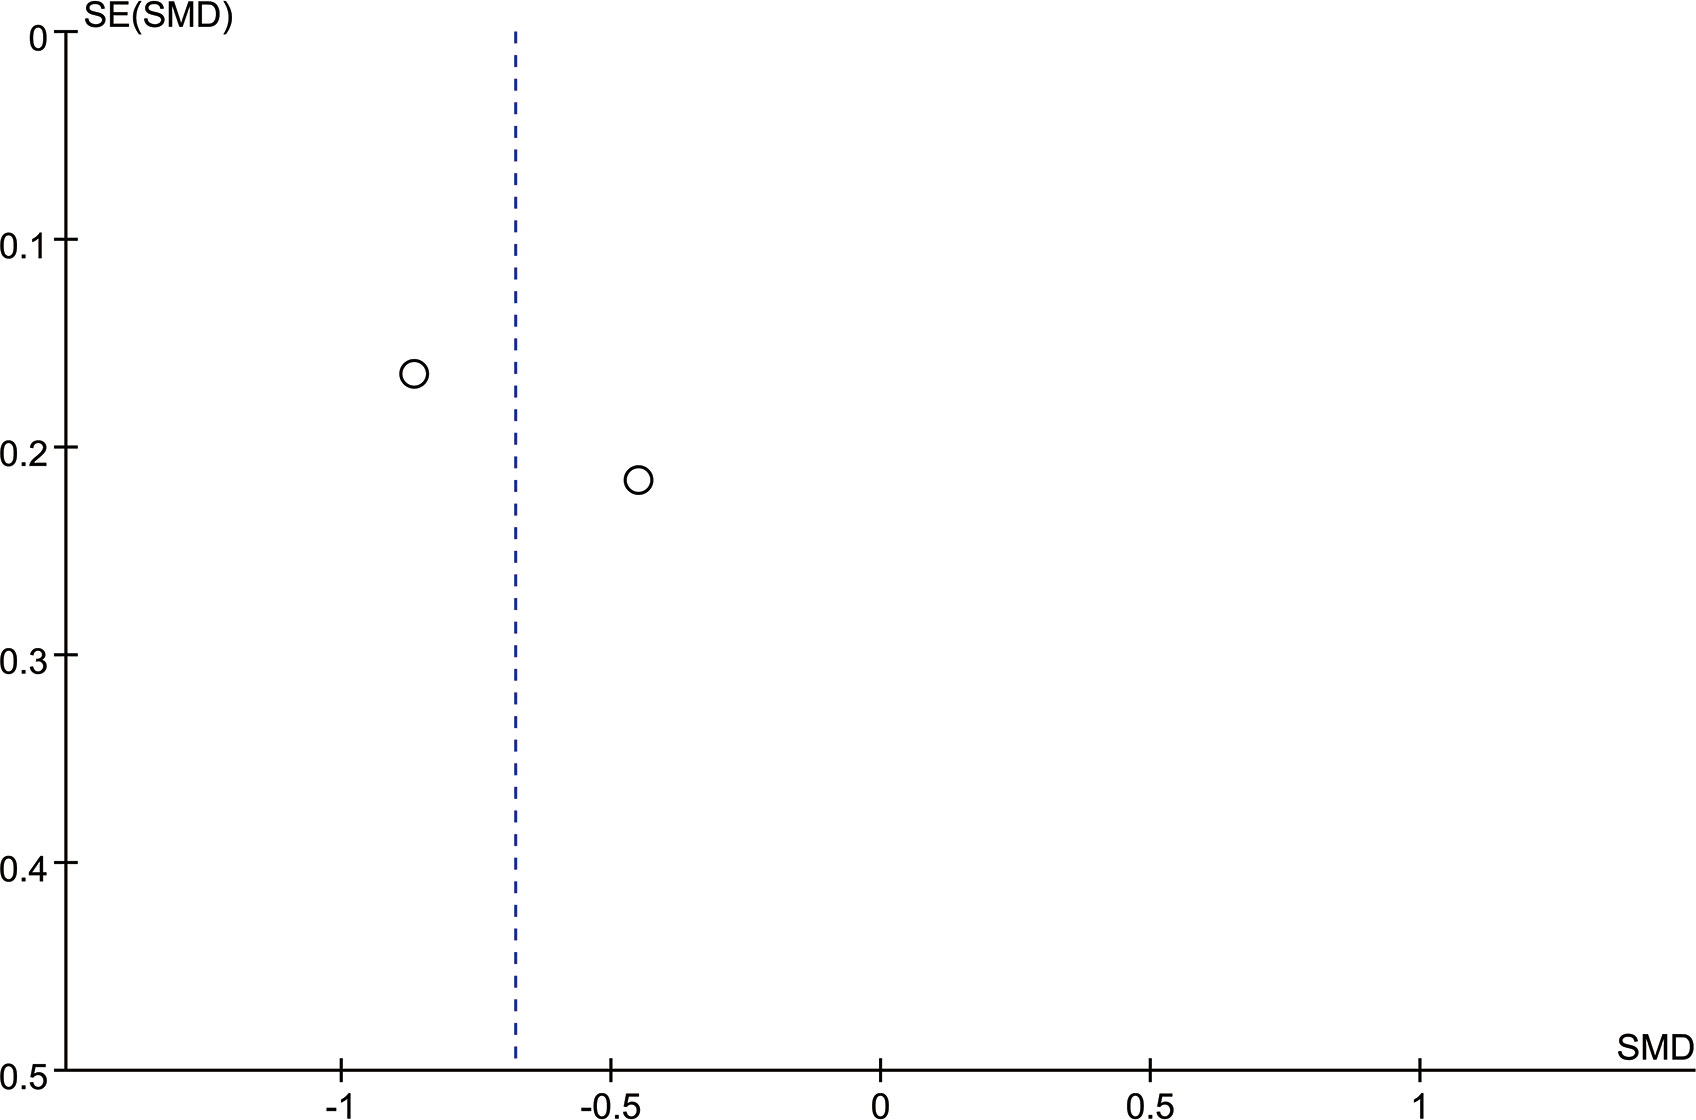
Figure 6 Funnel plot of VDG score.
Discussion
Our study included 535 people and used qualitative breast densitometry (BI-RADS) and quantitative breast densitometry (LIBRA and Volpara). The results of the meta-analysis showed that after bariatric surgery, VBD increased (P = 0.001), while BI-RADS grade A decreased by 3.83% (183 vs. 176) (P = 0.38). However, methods for quantifying breast density from before to after bariatric surgery by other software all yielded positive results (15, 17). This discrepancy in results was due to differences in breast density evaluation software and evaluation methods. The qualitative breast densitometry of BI-RADS refers to the radiologist’s grading of the breast based on the proportion of dense tissue areas on radiographs (6), but this classification method, based on the radiologist’s visual inspection, has a certain degree of subjectivity and wide variability (21). In contrast with the qualitative evaluation of BI-RADS, Volpara’s quantitative breast density is calculated from total breast volume and fibroglandular tissue volume in three dimensions, and VBD is calculated through a specific algorithm (9). Its accuracy and repeatability are better than those of the qualitative measurement through BI-RADS (22).
Breast density is affected by many factors, such as age, BMI, diet, lifestyle, chronic inflammation, medications, and reproductive history (23–32). Breast density declines with age begin before menopause, continue after menopause, and decline is most pronounced during the menopausal transition (23). People who ate a diet high in protein, carbohydrates and meat had higher breast density, while fat and vitamin intake had no effect on breast density. Some studies have shown that carotenoids and fibre can also reduce breast density (24, 25). Poor lifestyle habits such as alcohol consumption can increase breast density, while smoking can decrease breast density (26, 27). For a woman’s reproductive history, breast density was higher in women who did not give birth, and lower in women who gave birth early and often (30).In addition, both obesity and dense breasts are important risk factors for breast cancer (33), but obese patients have lower breast density, so we cannot simply use breast density to evaluate the risk of breast cancer in obese people at this time (32). Mechanistically, these factors may affect breast density by affecting oestrogen production, aromatase activity, and the growth hormone–insulin-like growth factor axis (23–32, 34).
Mammography plays an irreplaceable role in the clinical detection of changes in breast density and early breast cancer. From early screen-film mammography to digital mammography (full-field digital mammography) to the emerging technology of digital breast tomosynthesis (DBT), imaging has improved from two-dimensional to three-dimensional, and image quality has been continuously improved (35–37) DBT is a 3D image set reconstructed by collecting 2D raw projection images within a certain angle on an arc. Unlike full-field digital mammography and screen-film mammography, DBT quantifies dense breast tissue out of a volume of 3D space, resulting in more accurate identification and differentiation between dense and adipose tissue (38, 39), while the determination of breast density is based on mammography. Breast densitometry can be divided into qualitative and quantitative methods. Martin et al. (2006) (40) have shown that there is a significant difference between qualitative and quantitative measurement results. Morrish et al. (2015) (41) showed that compared with qualitative breast density, quantitative breast density can more accurately reflect changes in breast density. Density measurement methods are divided into breast-based classification methods, such as BI-RADS; area-based measurement methods, such as LIBRA and Cumulus; and volume-based measurement methods, such as Quantra and Volpara (42). BI-RADS is currently the most widely used clinically, but it is subjective (21). The area-based classification method measures breast density from the perspective of two-dimensional space, it cannot capture the volume of dense tissue, and it ignores the effect of tissue thickness on breast density, so it is inaccurate for breast density calculation (43, 44). The volume-based measurement methods measure breast density from the perspective of three-dimensional space volume, and its results are more accurate. The results obtained by different breast densitometry methods are quite different. The differences are as high as 14% in the classification of women with dense breasts (45). Alonzo et al. (2015) (46) and Duffy et al. (2018) (47) showed that Volpara is the most reliable, as it can more accurately reflect the changes in breast density than other breast density measurement methods. Lovrics et al. (2021) (48) showed that the increase in breast density and the decrease in breast volume after bariatric surgery respectively increased and decreased the effectiveness of mammography, which may ultimately make the results of mammography unchanged. This study ignored changes in breast parenchymal composition after bariatric surgery, and the reduction of breast volume may not offset the effect of changes in parenchymal components such as fibrous glands on mammographic performance. As the number of breast cancer patients increase, finding a way to accurately reflect changes in breast density becomes critical. Gastounioti et al. (2021) (49) combined DBT with Volpara to obtain excellent results. It could be that with the popularity and price decline of DBT and Volpara, clinicians will more accurately capture subtle changes in breast tissue and better predict breast cancer risk.
Limitations of this review
First, our study was retrospective. Second, in our study, Caucasians were predominant, followed by Black people and Asian races, and the changes in breast density from before to after bariatric surgery in different races may affect our results. We plan to carry out a series of studies in Asian populations in the future. Last, since our study did not clarify the changes in breast density of different bariatric surgery methods, the results obtained by different surgical methods may also be different. In the future, with the gradual unification of surgical methods, this problem should be solved.
Conclusion
Regarding the changes in breast density from before to after bariatric surgery, the volumetric VDG score increased after bariatric surgery, but there was no significant change in breast density by the BI-RADS score. Overall, breast density increased significantly in patients after bariatric surgery, but this depended on the method of breast densitometry. More randomized controlled studies are needed to validate our conclusions.
Data availability statement
The datasets presented in this study can be found in online repositories. The names of the repository/repositories and accession number(s) can be found in the article/Supplementary Material.
Author contributions
YS and CL designed the research; DS conducted the research; DS, ZH, and WD conducted data analysis; DS drafted the manuscript; CL, ZH, and XZ made revisions to the manuscript. All authors contributed to the article and approved the submitted version.
Funding
This work was supported by the National Natural Science Foundation of China (81700745) and the Shanghai Natural Science Foundation (20ZR1456600).
Conflict of interest
The authors declare that this study was conducted in the absence of any commercial or financial relationships that could be construed as potential conflicts of interest.
Publisher’s note
All claims expressed in this article are solely those of the authors and do not necessarily represent those of their affiliated organizations, or those of the publisher, the editors and the reviewers. Any product that may be evaluated in this article, or claim that may be made by its manufacturer, is not guaranteed or endorsed by the publisher.
Supplementary material
The Supplementary Material for this article can be found online at: https://www.frontiersin.org/articles/10.3389/fimmu.2023.1160809/full#supplementary-material
References
1. Kelly T, Yang W, Chen C, Reynolds K, He J. Global burden of obesity in 2005 and projections to 2030. Int J Obes (2005) (2008) 32:1431–7. doi: 10.1038/ijo.2008.102
2. Lauby-Secretan B, Scoccianti C, Loomis D, Grosse Y, Bianchini F, Straif K. Body fatness and cancer--viewpoint of the iarc working group. New Engl J Med (2016) 375:794–8. doi: 10.1056/NEJMsr1606602
3. Sjöström L. Review of the key results from the swedish obese subjects (sos) trial - a prospective controlled intervention study of bariatric surgery. J Intern Med (2013) 273:219–34. doi: 10.1111/joim.12012
4. Schauer DP, Feigelson HS, Koebnick C, Caan B, Weinmann S, Leonard AC, et al. Bariatric surgery and the risk of cancer in a large multisite cohort. Ann Surg (2019) 269(1):95–101. doi: 10.1097/SLA.0000000000002525
5. Pettersson A, Graff RE, Ursin G, Santos Silva ID, McCormack V, Baglietto L, et al. Mammographic density phenotypes and risk of breast cancer: a meta-analysis. J Natl Cancer Institute (2014) 106(5):dju078. doi: 10.1093/jnci/dju078
6. D’Orsi CJ, Sickles EA, Mendelson EB, Morris EA, Creech WE, Butler PF, et al. Mammography. acr bi-rads® atlas,breast imaging reporting and data system. Reston va: Am Coll Radiol (2013).
7. Keller BM, Nathan DL, Wang Y, Zheng Y, Gee JC, Conant EF, et al. Estimation of breast percent density in raw and processed full field digital mammography images via adaptive fuzzy c-means clustering and support vector machine segmentation. Med Phys (2012) 39:4903–17. doi: 10.1118/1.4736530
8. Inc H. Understanding quantra 2.0 user manual - man-02004 rev 002. (Quantra is Bedford, MA, USA: Hologic Inc) (2012).
9. Highnam R, Brady M, Yaffe MJ, Karssemeijer N, Harvey J. Robust breast composition measurement - volpara. In: Martí J, Oliver A, Freixenet J, Martí R, editors. Digital mammography. IWDM 2010. lecture notes in computer science, vol. 6136. Berlin, Germany: Springer (2010). p. 342–9. doi: 10.1007/978-3-642-13666-5_46
10. Wells G, Shea B, O’Connell D, Peterson J, Welch V, Losos M, et al. The Newcastle-Ottawa scale (NOS) for assessing the quality of nonrandomised studies in meta-analyses (2011). Available at: http://www.ohri.ca/programs/clinical_epidemiology/oxford.asp (Accessed November 29,2022).
11. Higgins JPT, Thompson SG, Deeks JJ, Altman DG. Measuring inconsistency in meta-analyses. BMJ (Clinical Res ed.) (2003) 327:557–60. doi: 10.1136/bmj.327.7414.557
12. Hozo SP, Djulbegovic B, Hozo I. Estimating the mean and variance from the median, range, and the size of a sample. BMC Med Res Methodol (2005) 5(13). doi: 10.1186/1471-2288-5-13
13. Hassinger TE, Mehaffey JH, Knisely AT, Contrella BN, Brenin DR, Schroen AT, et al. The impact of bariatric surgery on qualitative and quantitative breast density. Breast J (2019) 25:1198–205. doi: 10.1111/tbj.13430
14. Hosseini A, Khoury AL, Varghese F, Carter J, Wong JM, Mukhtar RA. Changes in mammographic density following bariatric surgery. Surg For Obes Related Dis (2019) 15:964–8. doi: 10.1016/j.soard.2019.03.037
15. Alvarez R, Ridelman E, Rizk N, White MS, Zhou C, Chan H, et al. Assessment of mammographic breast density after sleeve gastrectomy. Surg For Obes Related Dis (2018) 14:1643–51. doi: 10.1016/j.soard.2018.07.024
16. Partain N, Mokdad A, Puzziferri N, Porembka J, Seiler S, Christie A, et al. Mammographic density changes in surgical weight loss-an indication for personalized screening. BMC Med Imaging (2018) 18. doi: 10.1186/s12880-017-0242-4
17. Williams AD, So A, Synnestvedt M, Tewksbury CM, Kontos D, Hsiehm M, et al. Mammographic breast density decreases after bariatric surgery. Breast Cancer Res Tr. (2017) 165:565–72. doi: 10.1007/s10549-017-4361-y
18. Mokhtari TE, Rosas US, Downey JR, Miyake KK, Ikeda DM, Morton JM. Mammography before and after bariatric surgery. Surg For Obes Related Dis (2017) 13:451–6. doi: 10.1016/j.soard.2016.10.021
19. Vohra NA, Kachare SD, Vos P, Schroeder BF, Schuth O, Suttle D, et al. The short-term effect of weight loss surgery on volumetric breast density and fibroglandular volume. Obes Surg (2017) 27:1013–23. doi: 10.1007/s11695-016-2415-6
20. Egger M, Davey Smith G, Schneider M, Minder C. Bias in meta-analysis detected by a simple, graphical test. BMJ (Clinical Res ed.) (1997) 315:629–34. doi: 10.1136/bmj.315.7109.629
21. Kerlikowske K, Grady D, Barclay J, Frankel SD, Ominsky SH, Sickles EA, et al. Variability and accuracy in mammographic interpretation using the american college of radiology breast imaging reporting and data system. J Natl Cancer Institute (1998) 90:1801–9. doi: 10.1093/jnci/90.23.1801
22. Destounis S, Johnston L, Highnam R, Arieno A, Morgan R, Chan A. Using volumetric breast density to quantify the potential masking risk of mammographic density. AJR Am J Roentgenology (2017) 208:222–7. doi: 10.2214/AJR.16.16489
23. Burton A, Maskarinec G, Perez-Gomez B, Vachon C, Miao H, Lajous M, et al. Mammographic density and ageing: a collaborative pooled analysis of cross-sectional data from 22 countries worldwide. PloS Med (2017) 14:e1002335. doi: 10.1371/journal.pmed.1002335
24. Sala E, Warren R, Duffy S, Welch A, Luben R, Day N. High risk mammographic parenchymal patterns and diet: a case-control study. Brit J Cancer (2000) 83:121–6. doi: 10.1054/bjoc.2000.1151
25. Brisson J, Verreault R, Morrison AS, Tennina S, Meyer F. Diet, mammographic features of breast tissue, and breast cancer risk. Am J Epidemiol (1989) 130:14–24. doi: 10.1093/oxfordjournals.aje.a115305
26. Ziembicki S, Zhu J, Tse E, Martin LJ, Minkin S, Boyd NF. The association between alcohol consumption and breast density: a systematic review and meta-analysis. Cancer Epidemiology Biomarkers Prev (2017) 26:170–8. doi: 10.1158/1055-9965.EPI-16-0522
27. Butler LM, Gold EB, Conroy SM, Crandall CJ, Greendale GA, Oestreicher N, et al. Active, but not passive cigarette smoking was inversely associated with mammographic density. Cancer Causes Control: CCC (2010) 21:301–11. doi: 10.1007/s10552-009-9462-4
28. Boyd NF, Melnichouk O, Martin LJ, Hislop G, Chiarelli AM, Yaffe MJ, et al. Mammographic density, response to hormones, and breast cancer risk. J Clin Oncol (2011) 29:2985–92. doi: 10.1200/JCO.2010.33.7964
29. Cuzick J, Warwick J, Pinney E, Duffy SW, Cawthorn S, Howell A, et al. Tamoxifen-induced reduction in mammographic density and breast cancer risk reduction: a nested case-control study. J Natl Cancer Institute (2011) 103:744–52. doi: 10.1093/jnci/djr079
30. Vachon CM, Kuni CC, Anderson K, Anderson VE, Sellers TA. Association of mammographically defined percent breast density with epidemiologic risk factors for breast cancer (united states). Cancer Causes Control: CCC (2000) 11:653–62. doi: 10.1023/a:1008926607428
31. Hanna M, Dumas I, Orain M, Jacob S, Têtu B, Sanschagrin F, et al. Association between expression of inflammatory markers in normal breast tissue and mammographic density among premenopausal and postmenopausal women. Menopause (New York N.Y.) (2017) 24:524–35. doi: 10.1097/GME.0000000000000794
32. Lam PB, Vacek PM, Geller BM, Muss HB. The association of increased weight, body mass index, and tissue density with the risk of breast carcinoma in vermont. Cancer-Am Cancer Soc (2000) 89:369–75. doi: 10.1002/1097-0142(20000715)89:2<369::aid-cncr23>3.0.co;2-j
33. Engmann NJ, Golmakani MK, Miglioretti DL, Sprague BL, Kerlikowske K. Population-attributable risk proportion of clinical risk factors for breast cancer. JAMA Oncol (2017) 3:1228–36. doi: 10.1001/jamaoncol.2016.6326
34. Pollak M. Insulin-like growth factor physiology and cancer risk. Eur J Cancer (Oxford England: 1990) (2000) 36:1224–8. doi: 10.1016/s0959-8049(00)00102-7
35. Skaane P, Balleyguier C, Diekmann F, Diekmann S, Piguet J, Young K, et al. Breast lesion detection and classification: comparison of screen-film mammography and full-field digital mammography with soft-copy reading--observer performance study. Radiology (2005) 237:37–44. doi: 10.1148/radiol.2371041605
36. Berns EA, Hendrick RE, Cutter GR. Performance comparison of full-field digital mammography to screen-film mammography in clinical practice. Med Phys (2002) 29:830–4. doi: 10.1118/1.1472497
37. Niklason LT, Christian BT, Niklason LE, Kopans DB, Castleberry DE, Opsahl-Ong BH, et al. Digital tomosynthesis in breast imaging. Radiology (1997) 205:399–406. doi: 10.1148/radiology.205.2.9356620
38. Chong A, Weinstein SP, McDonald ES, Conant EF. Digital breast tomosynthesis: concepts and clinical practice. Radiology (2019) 292(1):1–14. doi: 10.1148/radiol.2019180760
39. Sechopoulos I. A review of breast tomosynthesis. part i. the image acquisition process. Med Phys (2013) 40:14301. doi: 10.1118/1.4770279
40. Martin KE, Helvie MA, Zhou C, Roubidoux MA, Bailey JE, Paramagul C, et al. Mammographic density measured with quantitative computer-aided method: comparison with radiologists' estimates and bi-rads categories. Radiology (2006) 240:656–65. doi: 10.1148/radiol.2402041947
41. Morrish OWE, Tucker L, Black R, Willsher P, Duffy SW, Gilbert FJ. Mammographic breast density: comparison of methods for quantitative evaluation. Radiology (2015) 275:356–65. doi: 10.1148/radiol.14141508
42. Hernández A, Miranda DA, Pertuz S. Algorithms and methods for computerized analysis of mammography images in breast cancer risk assessment. Comput Meth Prog Bio (2021) 212:106443. doi: 10.1016/j.cmpb.2021.106443
43. Gastounioti A, Kasi CD, Scott CG, Brandt KR, Jensen MR, Hruska CB, et al. Evaluation of libra software for fully automated mammographic density assessment in breast cancer risk prediction. Radiology (2020) 296:24–31. doi: 10.1148/radiol.2020192509
44. Alonzo-Proulx O, Jong RA, Yaffe MJ. Volumetric breast density characteristics as determined from digital mammograms. Phys Med Biol (2012) 57:7443–57. doi: 10.1088/0031-9155/57/22/7443
45. Brandt KR, Scott CG, Ma L, Mahmoudzadeh AP, Jensen MR, Whaley DH, et al. Comparison of clinical and automated breast density measurements: implications for risk prediction and supplemental screening. Radiology (2016) 279:710–9. doi: 10.1148/radiol.2015151261
46. Alonzo-Proulx O, Mawdsley GE, Patrie JT, Yaffe MJ, Harvey JA. Reliability of automated breast density measurements. Radiology (2015) 275:366–76. doi: 10.1148/radiol.15141686
47. Duffy SW, Morrish OWE, Allgood PC, Black R, Gillan MGC, Willsher P, et al. Mammographic density and breast cancer risk in breast screening assessment cases and women with a family history of breast cancer. Eur J Cancer (Oxford England: 1990) (2018) 88:48–56. doi: 10.1016/j.ejca.2017.10.022
48. Lovrics O, Butt J, Lee Y, Lovrics P, Boudreau V, Anvari M, et al. The effect of bariatric surgery on breast cancer incidence and characteristics: a meta-analysis and systematic review. Am J Surg (2021) 222:715–22. doi: 10.1016/j.amjsurg.2021.03.016
Keywords: bariatric surgery, breast density, obesity, mammogram, meta-analysis
Citation: Sun D, Huang Z, Dong W, Zhao X, Liu C and Sheng Y (2023) Effects of bariatric surgery on breast density in adult obese women: systematic review and meta-analysis. Front. Immunol. 14:1160809. doi: 10.3389/fimmu.2023.1160809
Received: 07 February 2023; Accepted: 19 May 2023;
Published: 31 May 2023.
Edited by:
Ouyang Chen, Duke University, United StatesReviewed by:
Zubing Mei, Shanghai University of Traditional Chinese Medicine, ChinaYutian Zou, Sun Yat-sen University Cancer Center (SYSUCC), China
Ming Zhuang, Shanghai Jiao Tong University, China
Copyright © 2023 Sun, Huang, Dong, Zhao, Liu and Sheng. This is an open-access article distributed under the terms of the Creative Commons Attribution License (CC BY). The use, distribution or reproduction in other forums is permitted, provided the original author(s) and the copyright owner(s) are credited and that the original publication in this journal is cited, in accordance with accepted academic practice. No use, distribution or reproduction is permitted which does not comply with these terms.
*Correspondence: Chaoqian Liu, bGl1Y2hhb3FpYW4yMDAyQGFsaXl1bi5jb20=; Yuan Sheng, c2hlbmc1Mjh5dWFuQDE2My5jb20=
†These authors have contributed equally to this work and share first authorship