 Arduino A. Mangoni
 Angelo Zinellu
- 1Discipline of Clinical Pharmacology, College of Medicine and Public Health, Flinders University, Adelaide, SA, Australia
- 2Department of Clinical Pharmacology, Flinders Medical Centre, Southern Adelaide Local Health Network, Adelaide, SA, Australia
- 3Department of Biomedical Sciences, University of Sassari, Sassari, Italy
Introduction: An excessive systemic pro-inflammatory state increases the risk of severe disease and mortality in patients with coronavirus disease 2019 (COVID-19). However, there is uncertainty regarding whether specific biomarkers of inflammation can enhance risk stratification in this group. We conducted a systematic review and meta-analysis to investigate an emerging biomarker of systemic inflammation derived from routine hematological parameters, the systemic inflammation index (SII), in COVID-19 patients with different disease severity and survival status.
Methods: A systematic literature search was conducted in PubMed, Web of Science, and Scopus, between the 1st of December 2019 and the 15th of March 2023. Risk of bias and certainty of evidence were assessed using the Joanna Briggs Institute Critical Appraisal Checklist and the Grades of Recommendation, Assessment, Development and Evaluation, respectively (PROSPERO registration number: CRD42023420517).
Results: In 39 studies, patients with a severe disease or non-survivor status had significantly higher SII values on admission compared to patients with a non-severe disease or survivor status (standard mean difference (SMD)=0.91, 95% CI 0.75 to 1.06, p<0.001; moderate certainty of evidence). The SII was also significantly associated with the risk of severe disease or death in 10 studies reporting odds ratios (1.007, 95% CI 1.001 to 1.014, p=0.032; very low certainty of evidence) and in six studies reporting hazard ratios (1.99, 95% CI 1.01 to 3.92, p=0.047; very low certainty of evidence). Pooled sensitivity, specificity, and area under the curve for severe disease or mortality were 0.71 (95% CI 0.67 to 0.75), 0.71 (95% CI 0.64 to 0.77), and 0.77 (95% CI 0.73 to 0.80), respectively. In meta-regression, significant correlations were observed between the SMD and albumin, lactate dehydrogenase, creatinine, and D-dimer.
Discussion: Our systematic review and meta-analysis has shown that the SII on admission is significantly associated with severe disease and mortality in patients with COVID-19. Therefore, this inflammatory biomarker derived from routine haematological parameters can be helpful for early risk stratification in this group.
Systematic review registration: https://www.crd.york.ac.uk/PROSPERO, identifier CRD42023420517.
Introduction
Coronavirus disease 2019 (COVID-19) is characterized, particularly in severe cases, by a state of excessive systemic inflammation which, in turn, promotes the dysregulation of specific pathways within the immune, hemostasis and coagulation systems (1–9). Such abnormalities are critical in disrupting several molecular and cellular homeostatic mechanisms, favoring toxicity and dysfunction in different organs and systems (10–12).
Several circulating molecules have been investigated in the quest for markers of excessive inflammatory response to guide early risk stratification and management in patients with COVID-19, including C-reactive protein, pre-albumin, albumin, lactate dehydrogenase, hydroxybutyrate dehydrogenase, and D-dimer (8, 13–15). At the same time, abnormalities in the count of specific blood cell types during the early stages of COVID-19, e.g., neutrophilia, lymphopenia, and thrombocytopenia, and associated haematological indexes, particularly the neutrophil-to-lymphocyte ratio (NLR), have also been shown to be associated with excessive inflammation and to predict severe disease and mortality in this patient group (16–19). Another haematological index, the systemic inflammation index (SII, calculated using the following formula: (neutrophils x platelets)/lymphocytes), investigated for the first time in 2014 in cancer patients (20), has been shown to have a superior predictive capacity for adverse outcomes when compared to other haematological indexes, including the NLR, in patients with COVID-19 (21).
Given the rapidly evolving clinical scenario since the beginning of the COVID-19 pandemic, with the occurrence of novel variants of the causative agent, the severe acute respiratory syndrome coronavirus 2 (SARS-CoV-2), the introduction of anti-inflammatory and immunomodulatory treatments, and the roll-out of vaccination programs, we conducted a systematic review and meta-analysis of the association between the SII and severe disease and mortality in patients with COVID-19. We speculated that patients with a severe disease or succumbing from the disease had higher SII values than patients with a non-severe disease or survivor status. Where possible, we performed meta-regression and subgroup analyses to investigate possible associations between the effect size of the between-group differences in the SII and pre-specified study and patient characteristics.
Methods
Literature search and study selection
We conducted a systematic literature search for articles published in the electronic databases PubMed, Web of Science, and Scopus, between the 1st of December 2019 and the 15th of March 2023, using the following terms (and their combination): “SII” or “Systemic Inflammation Index” and “COVID 19” or “2019-nCoV” or “SARS-CoV-2” or “coronavirus disease 2019”. We also hand-searched the reference lists of individual articles to identify additional studies. The criteria for inclusion were: (a) investigation of COVID-19 patients with different disease severity or survival status; (b) reporting of the SII as a continuous variable in COVID-19 patients; (c) reporting of odds ratio (OR) or hazard ratio (HR) with 95% confidence intervals (CIs) for measures of severe disease and/or survival using multivariate analysis; (d) reporting of the prognostic accuracy of the SII using the area under the receiver operating characteristic curve (AUROC) with 95% CIs; (e) full-text available, and (f) English language used. Abstracts and, if relevant, full articles were independently reviewed by two investigators, with a third involved in case of disagreement.
Data extracted from each study included age, sex, year of publication, study design (prospective or retrospective), geographic area where the study was performed, sample size, the clinical endpoint studied (measures of disease severity and/or mortality), markers of inflammation (albumin, lactate dehydrogenase, C-reactive protein, ferritin), markers of renal function (creatinine), markers of coagulation (D-dimer), a history of diabetes, hypertension, and cardiovascular disease, the area under the receiver operating characteristic curve (AUROC) with 95% CIs, sensitivity, specificity, and cut-off values used for the SII. True positive (TP), false positive (FP), false negative (FN), and true negative (TN) values were either extracted or calculated by generating 2 × 2 tables from each study. Sensitivity and specificity were derived from the following formulas: Sensitivity = TP/(TP + FN); Specificity = TN/(FP + TN).
We assessed the risk of bias using the Joanna Briggs Institute Critical Appraisal Checklist for case-control studies. Studies addressing ≥75% of the checklist items were considered as having a low risk (22). The certainty of evidence was assessed using the Grades of Recommendation, Assessment, Development and Evaluation (GRADE) Working Group system (23). The study was conducted per the PRISMA 2020 statement on reporting systematic reviews and meta-analyses (Supplementary Tables 1, 2) (24). The protocol was registered in the International Prospective Register of Systematic Reviews (PROSPERO, CRD42023420517).
Statistical analysis
We generated forest plots of continuous variables, using standardized mean differences (SMDs), to assess differences in the SII between patients with a non-severe disease or survivor status and those with a severe disease or non-survivor status (p<0.05 for statistical significance). Data regarding the associations between the SII and disease severity and mortality, expressed either as odds ratio (OR) or hazard ratio (HR), adjusted for confounding variables, and 95% CIs were also extracted. The ORs were then transformed into log ORs, and the standard error was calculated based on the corresponding 95% CI. We assessed heterogeneity using the Q statistic (p<0.10 for statistical significance). A random-effect model was used in the presence of significant heterogeneity (25). Sensitivity analyses were conducted to investigate the effect of sequentially removing individual studies on the overall risk estimate (26). The presence of publication bias was assessed by investigating the associations between the study size and the magnitude of effect using the Begg’s adjusted rank correlation test and the Egger’s regression asymmetry test (p<0.05 for statistical significance) (27, 28), and the Duval and Tweedie “trim-and-fill” procedure (29). Univariate meta-regression analyses were conducted to investigate associations between the effect size and the following parameters: age, sex, year of publication, study design, sample size, albumin, lactate dehydrogenase, creatinine, D-dimer, C-reactive protein, ferritin, and history of diabetes, hypertension, and cardiovascular disease. Sub-group analyses were also conducted to investigate possible differences in effect size according to specific endpoint studied (disease severity vs. mortality) and the continent where the study was conducted.
We used relevant commands (metandi, midas, mylabels) to evaluate the performance of the SII in predicting severe disease and mortality. A summary receiver operating characteristic (SROC) curve was generated using the hierarchical summary receiving operator characteristic (HSROC) model (30). This was complemented by empirical Bayes estimates that closely agree with those of a full Bayesian analysis. The pooled sensitivity and specificity values were calculated, and the corresponding forest plot was generated. The HSROC model also allowed controlling for heterogeneity across the studies, as determined by i) the correlation coefficient between logit transformed sensitivity and specificity [Corr(logits)] in the HSROC analysis using a bivariate model (31) and ii) the asymmetry parameter β. A positive correlation coefficient (>0) and a β value with p<0.05 indicated the presence of heterogeneity between studies (30, 32). We also explored heterogeneity across studies through visually examining the HSROC curve and using a bivariate boxplot (by midas). The Cook’s distance measurement was performed to estimate the influence of each data point on the overall results of the meta-analysis and identify outliers (33). Publication bias was assessed using the Deeks’ method (34). The relationship between the prior probability, the likelihood ratio, and the posterior test probability was assessed using the Fagan’s Nomogram plot (35). All analyses were performed using Stata 14 (StataCorp LLC, College Station, TX, USA) except for those involving prognostic accuracy, performed using MedCalc for Windows, version 20.109 bit (MedCalc Software, Ostend, Belgium).
Results
Study selection
We initially identified 285 articles. Of them, 235 were excluded because they were either duplicates or irrelevant. Following a full-text review of the remaining 50 articles, a further ten were excluded because they did not meet the inclusion criteria, leaving 40 articles for analysis (Figure 1) (21, 36–74). The study design was prospective in three studies (50, 67, 68), unclear in one (66), and retrospective in the remaining 36 (21, 36–49, 51–65, 69–74). The clinical endpoints included mortality in 19 studies (36, 37, 39, 41, 43, 45, 48, 49, 51, 52, 55, 56, 58, 60, 61, 65, 66, 68, 73), and measures of severe disease as follows: disease severity based on existing guidelines in eight (42, 44, 63, 64, 67, 70, 72, 74), transfer to the intensive care unit (ICU) in eight (38, 40, 45, 50, 53, 62, 68, 69), invasive mechanical ventilation in two (46, 52), disease progression in two (57, 71), prolonged hospital stay in one (21), intubation in one (37), deep vein thrombosis in one (54), acute pulmonary embolism in one (54), and acute limb ischemia in one (39). All studies reported the SII on hospital admission.
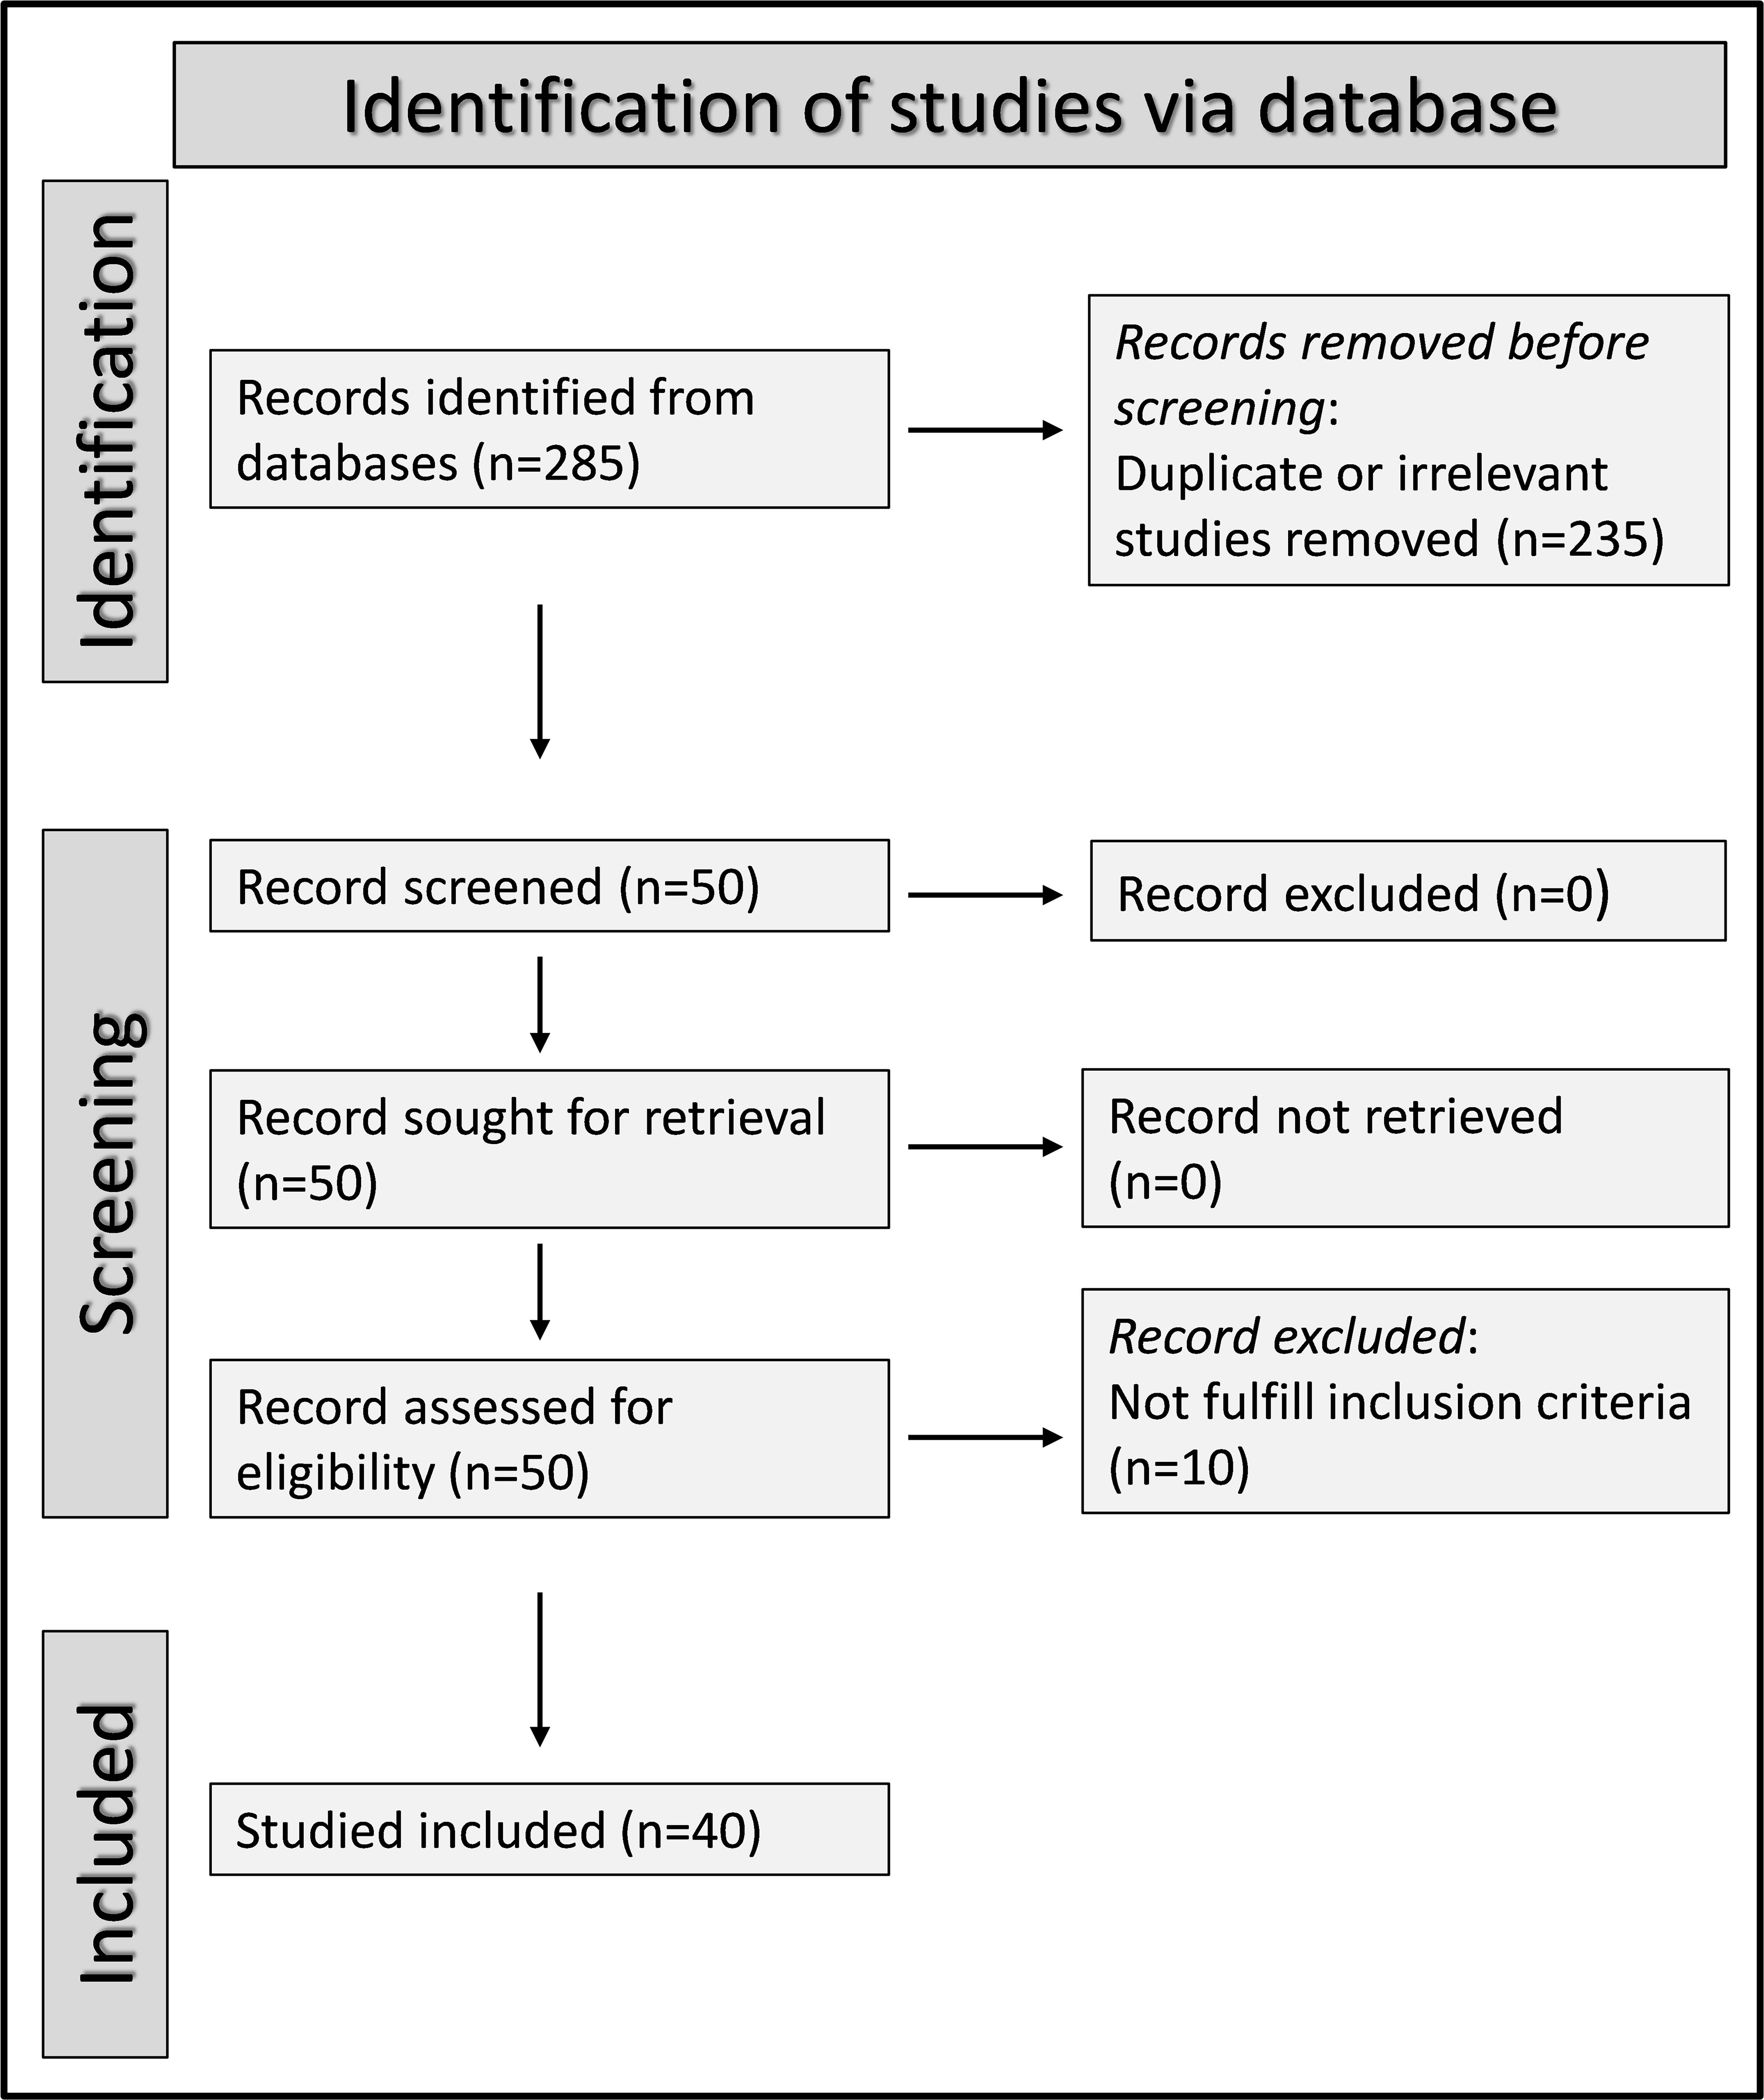
Figure 1 PRISMA 2020 flow chart of study selection.
Pooled standardized mean differences
Study characteristics
Thirty-nine studies (with 45 patient groups) reported the SII in 19,352 patients (mean age 61 years, 55% males) with a non-severe disease/survivor status and 5,524 patients (mean age 69 years, 60% males) with a severe disease/non-survivor status. Twenty-three studies were conducted in Asia (36, 38, 40–42, 48–51, 57, 59, 62–68, 70–74), eleven in Europe (21, 39, 43, 44, 47, 55, 56, 58, 60, 61, 69), four in America (37, 45, 46, 52), and one in Africa (53) (Table 1).
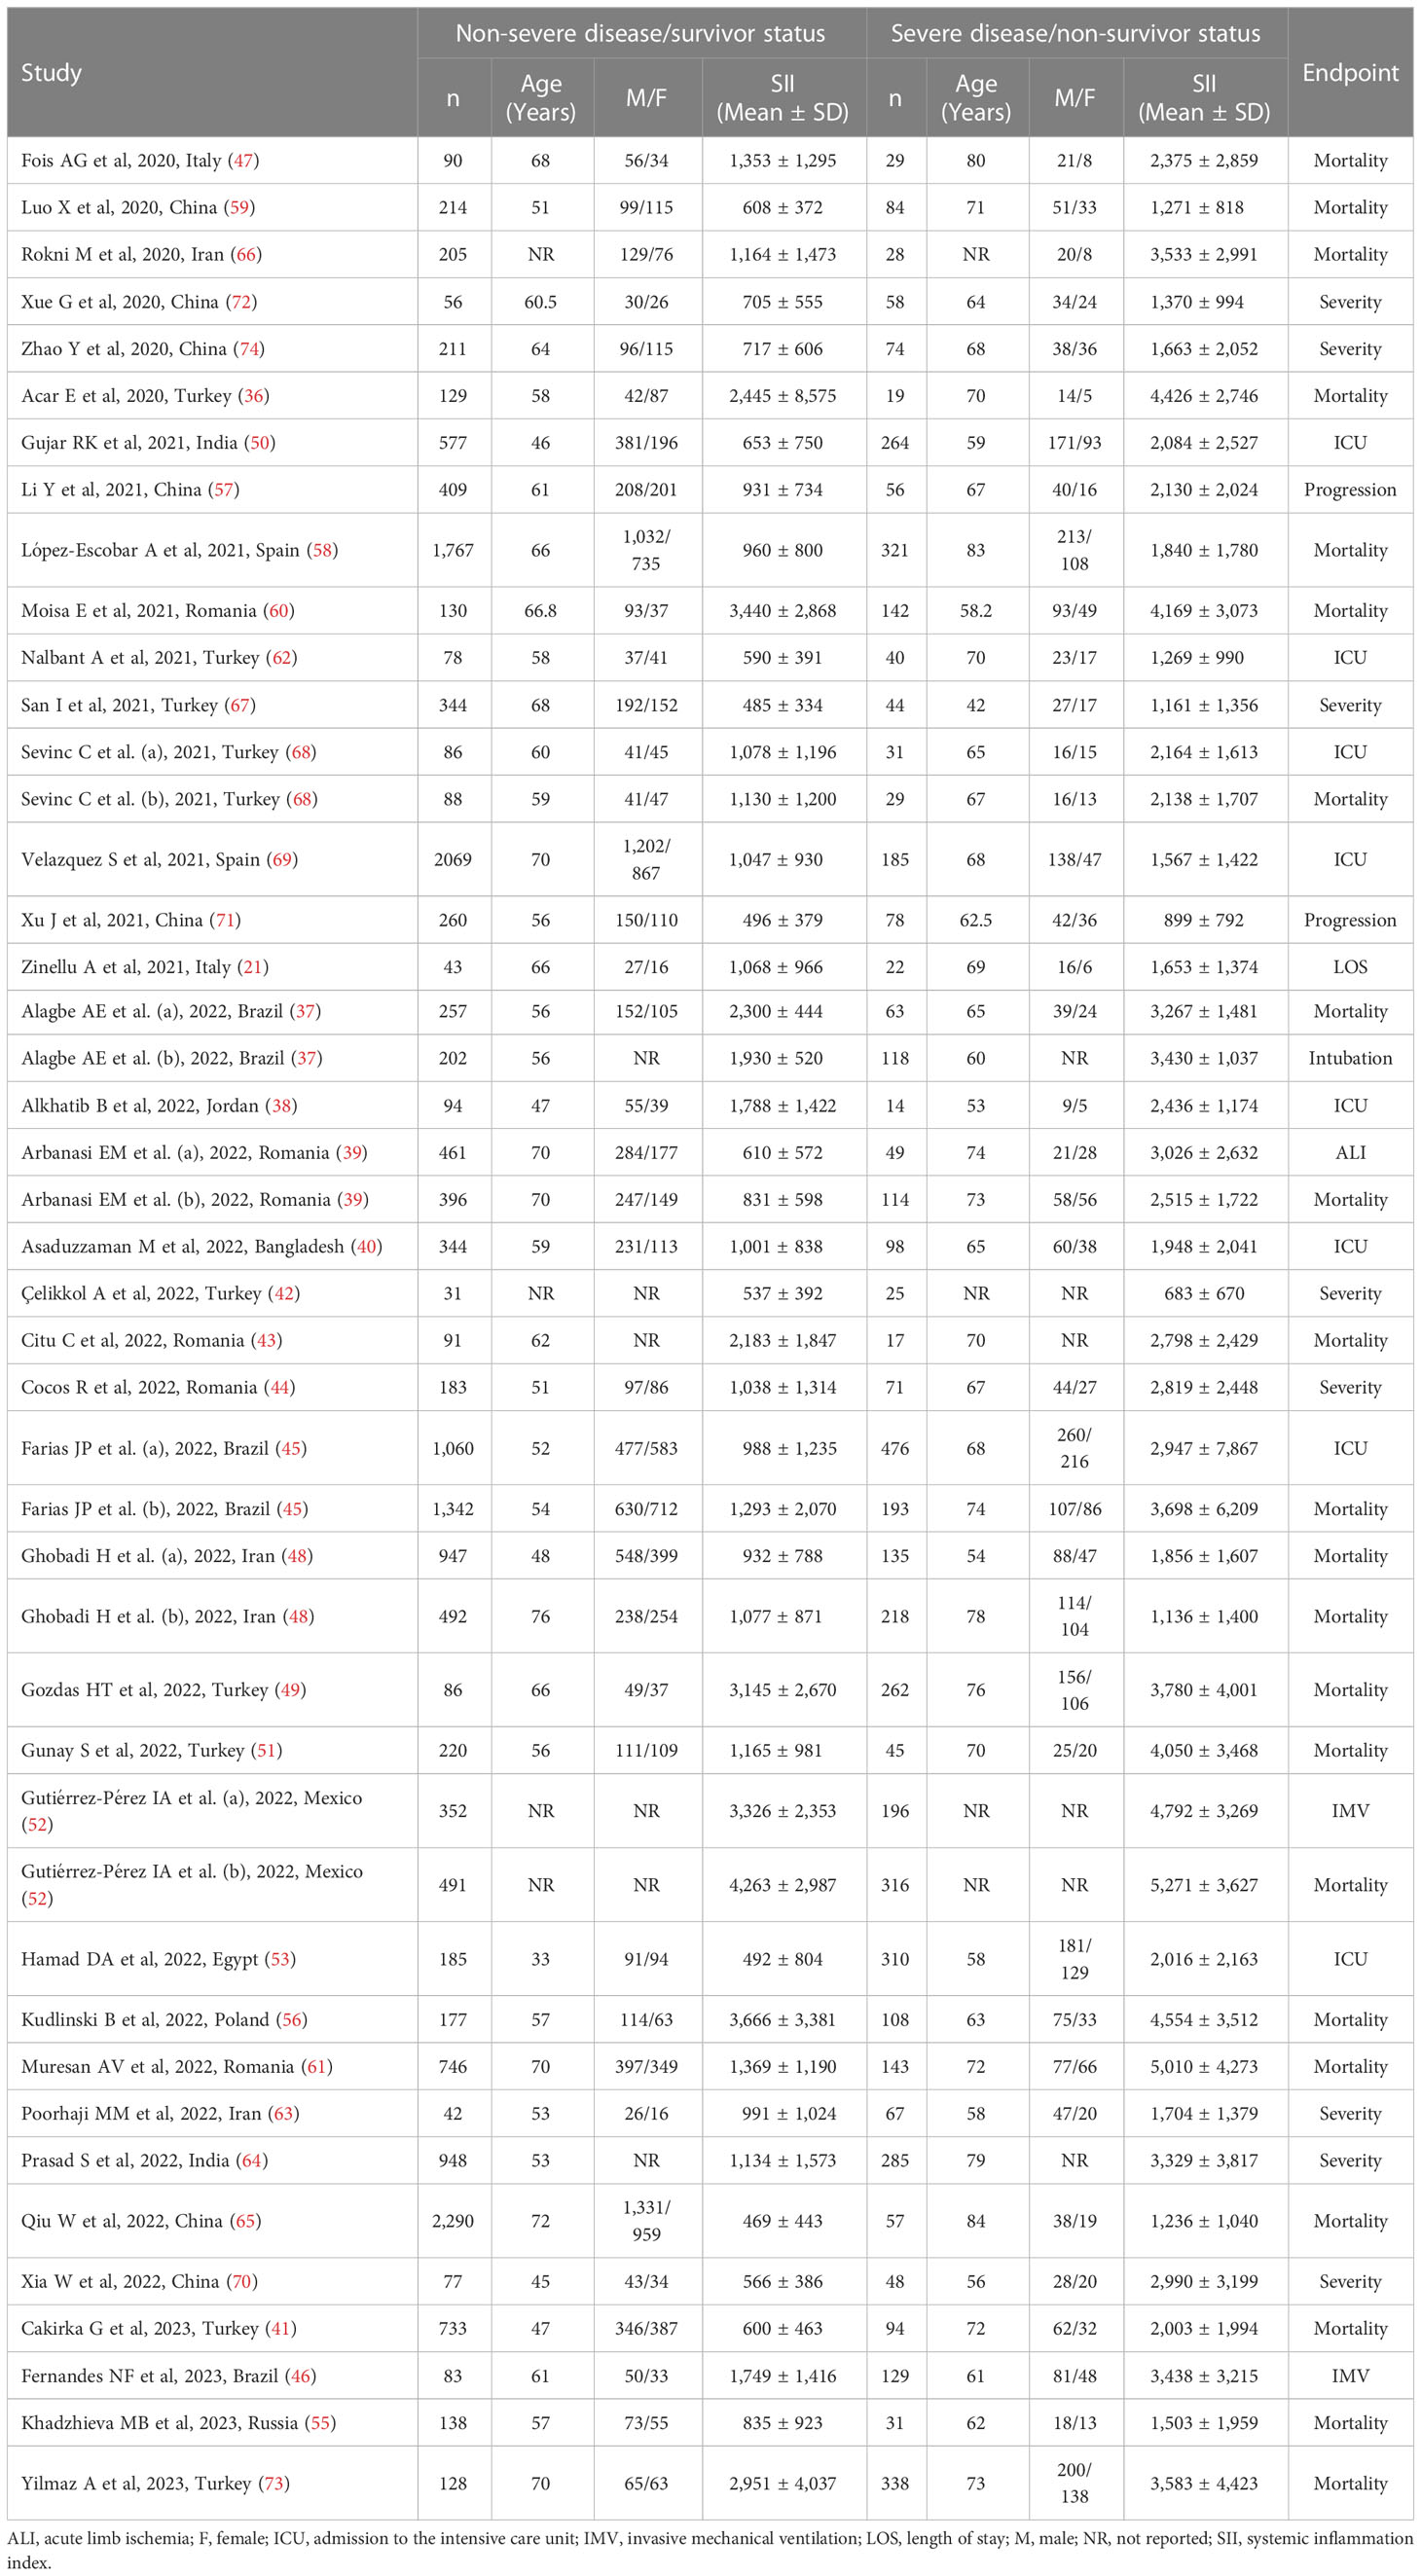
Table 1 Characteristics of the studies reporting the systemic inflammation index in COVID-19 patients with non-severe disease/survivor status and severe disease/non-survivor status.
Risk of bias
The risk of bias was low in 29 studies (21, 36, 37, 39–41, 43–45, 47, 49, 51–53, 55–61, 64, 65, 67, 69, 71–74) and high in the remaining ten (38, 42, 46, 48, 50, 62, 63, 66, 68, 70) (Supplementary Table 3).
Results of individual studies and syntheses
The forest plot of SII values in patients with a non-severe disease/survivor status and patients with a severe disease/non-survivor status is shown in Figure 2. Random-effects models were used because of the extreme heterogeneity observed (I2 = 94.9%, p<0.001). Pooled results showed that patients with a severe disease/non-survivor status had significantly higher SII values than patients with a non-severe disease/survivor status (SMD=0.91, 95% CI 0.75 to 1.06, p<0.001). In sensitivity analysis, the corresponding pooled SMD values were not substantially altered when individual studies were sequentially omitted (effect size ranged between 0.87 and 0.93, Supplementary Figure 1).
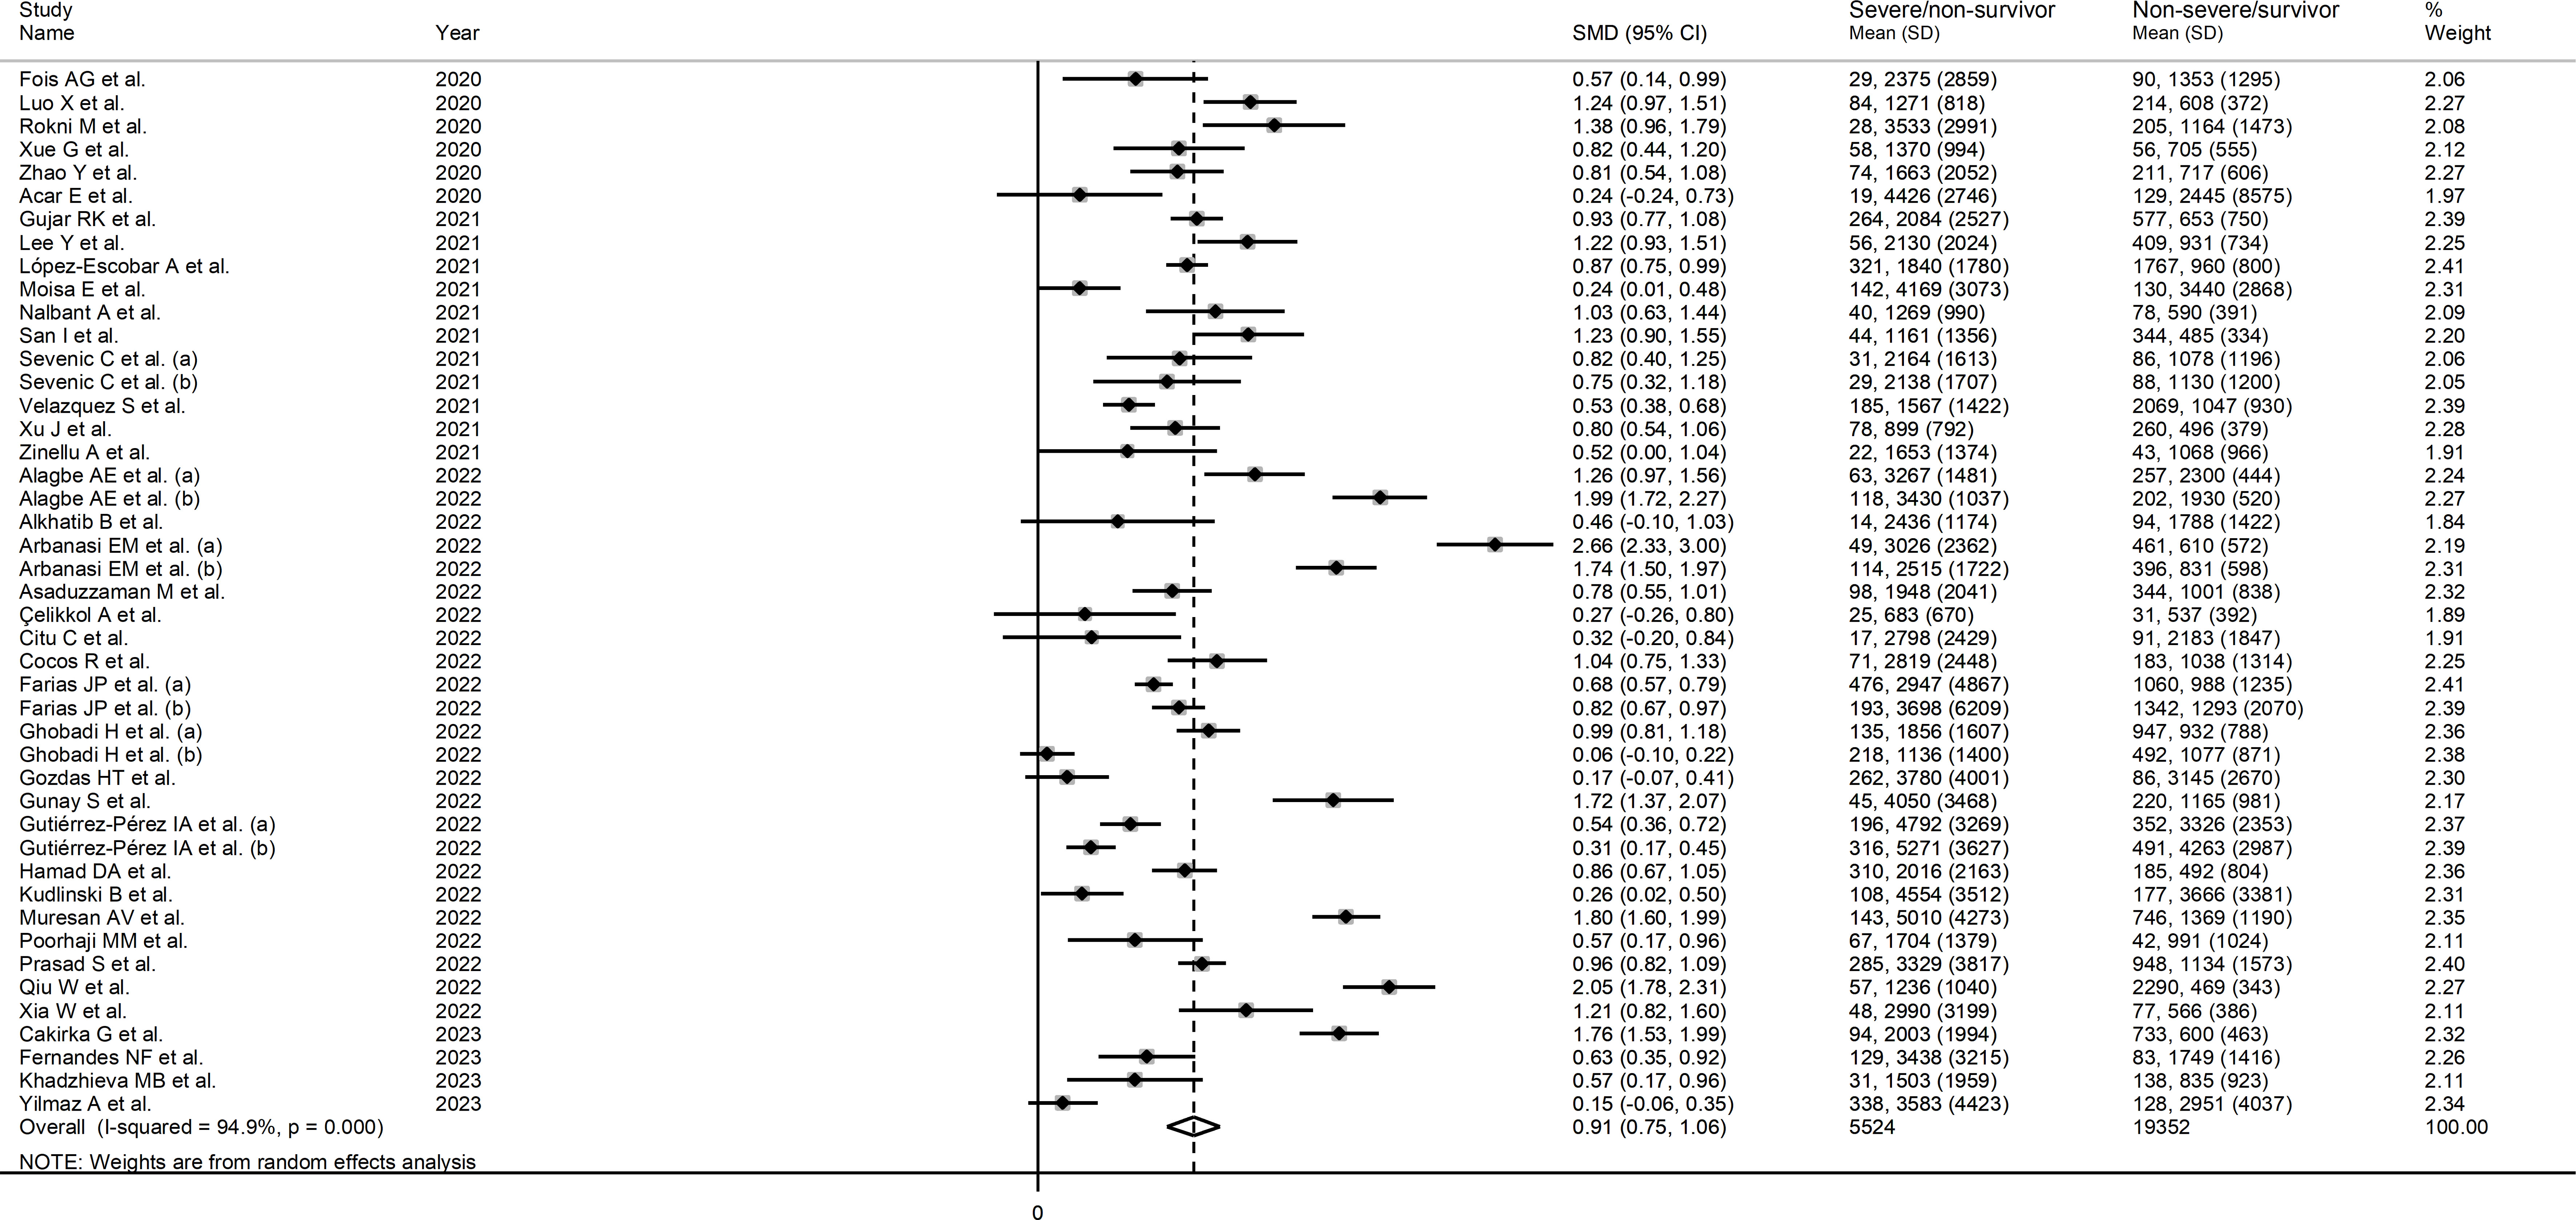
Figure 2 Forest plot of studies reporting SII values in COVID-19 patients with different disease severity and survival status.
Publication bias
There was no publication bias according to the Begg’s (p=0.87) and the Egger’s (p=0.18) test. However, the “trim-and-fill” method identified one missing study to be added to the left side of the funnel plot to ensure symmetry (Supplementary Figure 2). The resulting effect size, however, was similar to the primary analysis (SMD=0.87, 95% CI 0.71 to 1.03, p<0.001).
Sub-group and meta-regression analysis
In meta-regression, significant correlations were observed between the SMD and albumin (t=-3.96, p=0.002), lactate dehydrogenase (t=2.16, p=0.048), creatinine (t=2.53 p=0.02), and D-dimer (t=2.62, p=0.017). By contrast, no significant correlations were observed with age (t=0.66, p=0.51), sex (t=-1.26, p=0.21), publication year (t=0.35, p= 0.73), study design (t=0.04, p=0.97), sample size (t=1.11, 0.27), C-reactive protein (t=1.73, p=0.10), ferritin (t=0.87, p=0.41), and history of diabetes (t=-0.16, p=0.88), hypertension (t=0.12, p=0.90), or cardiovascular disease (t=-0.33, p=0.74).
In sub-group analysis, there were no significant differences in the pooled SMD between studies reporting disease severity (SMD=0.91, 95% CI 0.74 to 1.07, p<0.001; I2 = 96.6%, p<0.001), survival status (SMD=0.88, 95% CI 0.61 to 1.14, p<0.001; I2 = 56.5%, p=0.023), and ICU admission (SMD= 0.76, 95% CI 0.64 to 0.89, p<0.001; I2 = 63.3%, p=0.008; Supplementary Figure 3). However, the between-study variance was relatively lower in studies reporting severity and ICU admission (I2 = 56.5% and 63.3%, respectively). Similarly, there were no significant differences in the pooled SMD between studies performed in Europe (SMD=0.94, 95% CI 0.56 to 1.31, p<0.001; I2 = 96.6%, p<0.001), Asia (SMD=0.89, 95% CI 0.69 to 1.10, p<0.001; I2 = 93.5%, p<0.001) and America (SMD=0.92, 95% CI 0.56 to 1.28, p<0.001; I2 = 96.3%, p<0.001; Supplementary Figure 4).
Certainty of evidence
The initial level of certainty was considered low because of the cross-sectional nature of the studies (rating 2, ⊕⊕⊝⊝). After taking into account the low risk of bias in the majority of studies (no rating change), the substantial but partly explainable heterogeneity (no rating change), the lack of indirectness (no rating change), the relatively low imprecision (confidence intervals not crossing the threshold, no rating change), the relatively large effect size (SMD=0.91, upgrade one level), and the absence of publication bias (no rating change), the overall level of certainty was upgraded to moderate (rating 3, ⊕⊕⊕⊝).
Pooled odds ratios
Study characteristics
Ten studies (13 patient groups) in 9,851 COVID-19 patients (56% males, mean age 67 years), all retrospective, reported associations between the SII and disease severity or survival status expressed as ORs in multivariate logistic regression analysis (36, 44, 52–54, 58, 61, 69, 72, 74). The study endpoint was mortality in five studies (36, 52, 54, 58, 61), disease severity based on existing clinical guidelines in three (44, 72, 74), transfer to ICU in two (53, 69), invasive mechanical ventilation in one (52), deep vein thrombosis in one (61), and acute pulmonary embolism in one (61). Four studies were conducted in Europe (44, 58, 61, 69), four in Asia (36, 54, 72, 74), one in America (52), and one in Africa (53) (Table 2).
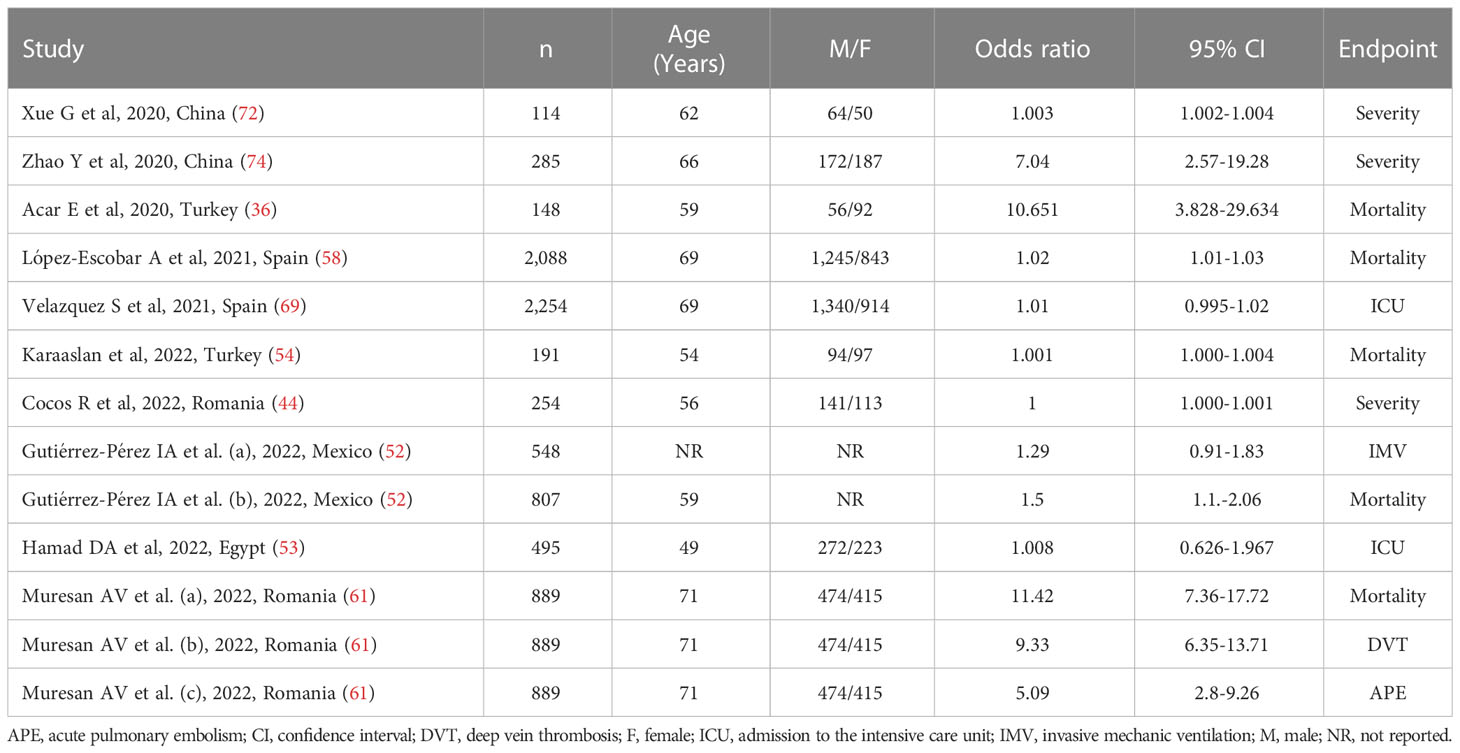
Table 2 Studies investigating the association between the systemic inflammation index and disease severity or mortality in COVID-19 patients using odds ratios.
Risk of bias
The risk of bias was low in all studies (36, 44, 52–54, 58, 61, 69, 72, 74) (Supplementary Table 3).
Results of individual studies and syntheses
The extreme between-study heterogeneity observed (I2 = 96.7%, p<0.001) required the use of random-effects models. Pooled results showed that a higher SII was significantly associated with severe disease or mortality (OR=1.007, 95% CI 1.001 to 1.014, p=0.032; Figure 3). In sensitivity analysis, the corresponding pooled ORs were influenced by two studies (44, 72) (Supplementary Figure 5). Their removal was associated with a slight increase in the effect size (OR=1.14, 95% CI 1.08-1.20, p=0.001; I2 = 97%, p<0.001; Supplementary Figure 6).
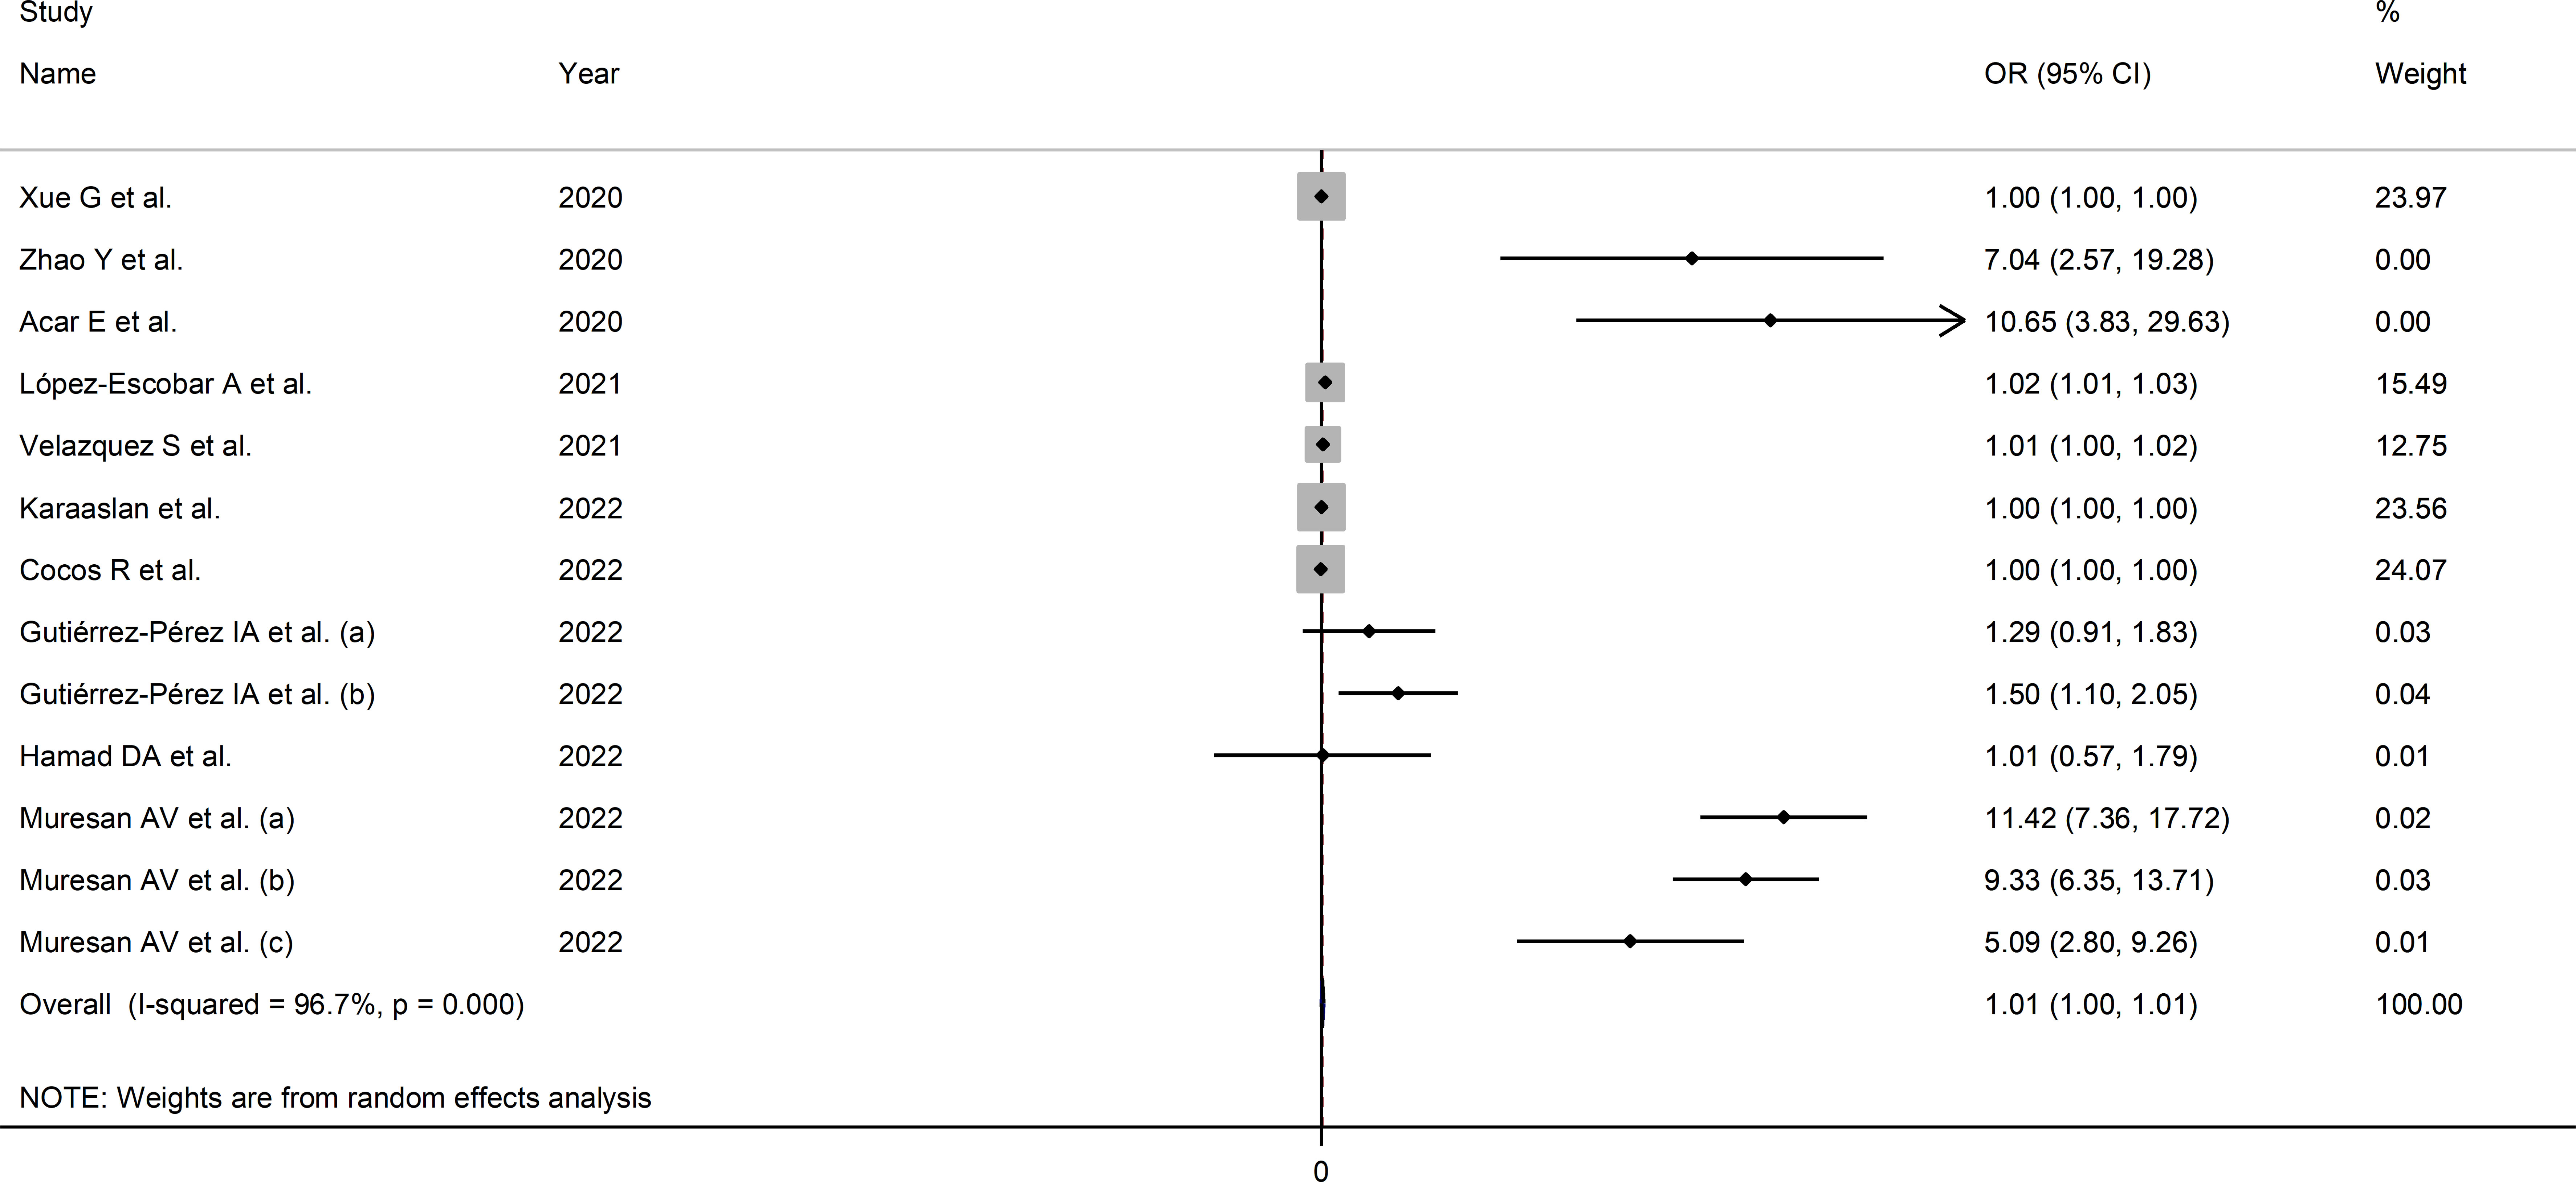
Figure 3 Forest plot of studies examining the association between the SII and disease severity or survival status in patients with COVID-19 by means of odds ratio.
Publication bias
There was evidence of publication bias according to the Egger’s (p=0.004) but not the Begg’s (p=0.213) test.
Sub-group and meta-regression analysis
In meta-regression analysis, there were no significant correlations between the OR and age (t=0.54, p=0.60), sex (t=0.17, p=0.87), publication year (t=-0.34, p=0.74), or sample size (t=0.61, p=0.56). Meta-regression of other parameters could not be conducted because of the limited information available.
In sub-group analysis, the SII was significantly associated with mortality (OR=1.08, 95% CI 1.02 to 1.15, p=0.013; I2 = 96.6%, p<0.001) but not measures of disease severity (OR=1.00, 95% CI 1.00 to 1.01, p=0.243; I2 = 97.5%, p<0.001; Supplementary Figure 7). Furthermore, the effect size was significant in European (OR=1.10, 95% CI 1.04 to 1.16, p<0.001; I2 = 98.3%, p<0.001) and American (OR=1.40, 95% CI 1.11 to 1.77, p=0.005; I2 = 0.0%, p=0.529), but not in Asian studies (OR=1.00, 95% CI 1.00 to 1.01, p=0.52; I2 = 92.1%, p<0.001; Supplementary Figure 8). Notably, the heterogeneity was virtually absent in American studies (I2 = 0.0%).
Certainty of evidence
The initial level of certainty was considered low because of the cross-sectional nature of the studies (rating 2, ⊕⊕⊝⊝). After taking into account the low risk of bias in all studies (no rating change), the substantial but partly explainable heterogeneity (no rating change), the lack of indirectness (no rating change), the relatively low imprecision (confidence intervals not crossing the threshold, no rating change), the relatively small effect size (OR=1.007, no rating change), and the presence of publication bias (downgrade by one level), the overall level of certainty was downgraded to very low (rating 1, ⊕⊝⊝⊝).
Pooled hazard ratios
Study characteristics
Six studies (with seven patient groups) in 5,100 COVID-19 patients (58% males, mean age 66 years), all retrospective, reported associations between the SII and disease severity or survival status as HRs using multivariate logistic regression analysis (47, 48, 56, 60, 65, 74). The studied endpoint was mortality in five studies (47, 48, 56, 60, 65) and severity in the remaining one (74). Three studies were conducted in Asia (48, 65, 74) and three in Europe (47, 56, 60) (Table 3).
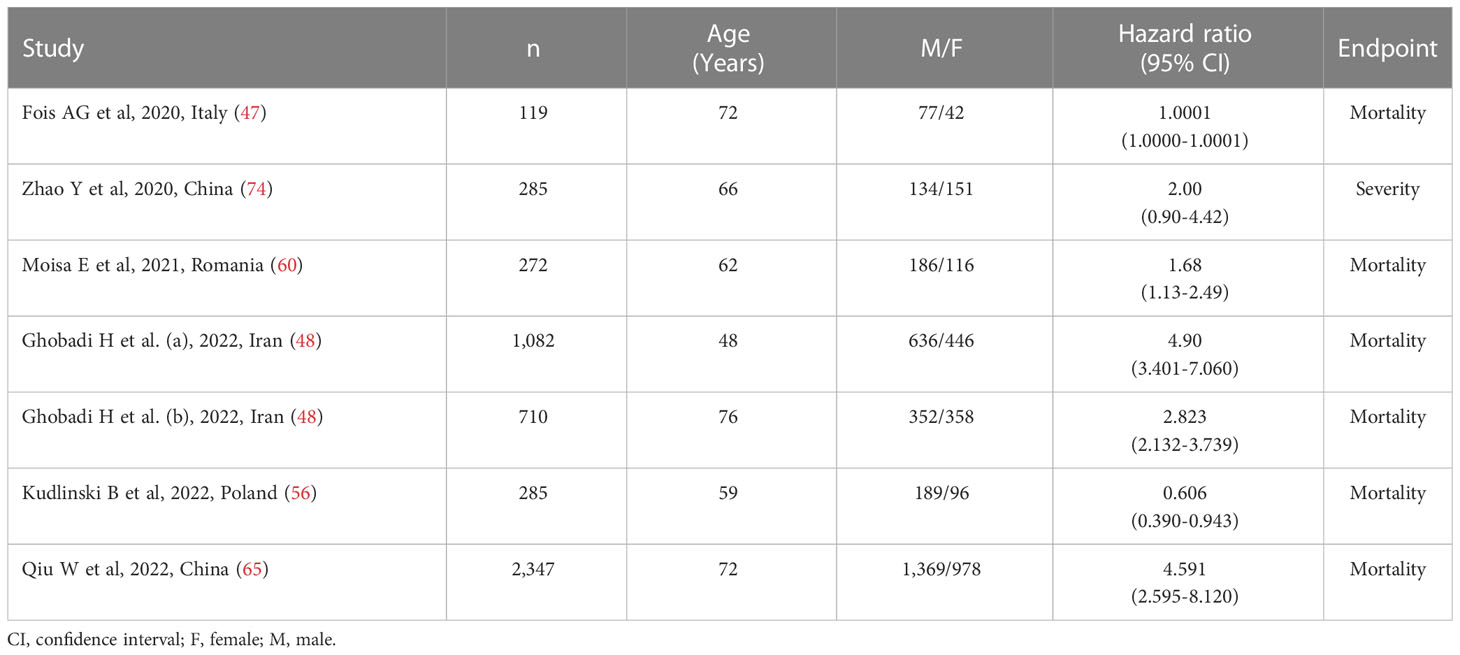
Table 3 Studies investigating the association between the systemic inflammation index and disease severity or mortality in COVID-19 patients using hazard ratio.
Risk of bias
The risk of bias was low in all studies, barring one (48) (Supplementary Table 3).
Results of individual studies and syntheses
Due to the extreme heterogeneity between studies (I2 = 96.4%, p<0.001), random-effects models were used. Pooled results showed that a higher SII was significantly associated with severe disease and mortality (HR=1.99, 95% CI 1.01 to 3.92, p=0.047; Figure 4). In sensitivity analysis, the corresponding pooled HRs were not substantially altered when individual studies were removed, suggesting that the results of the meta-analysis were stable (HR ranged between 1.70 and 2.43) (Supplementary Figure 9).
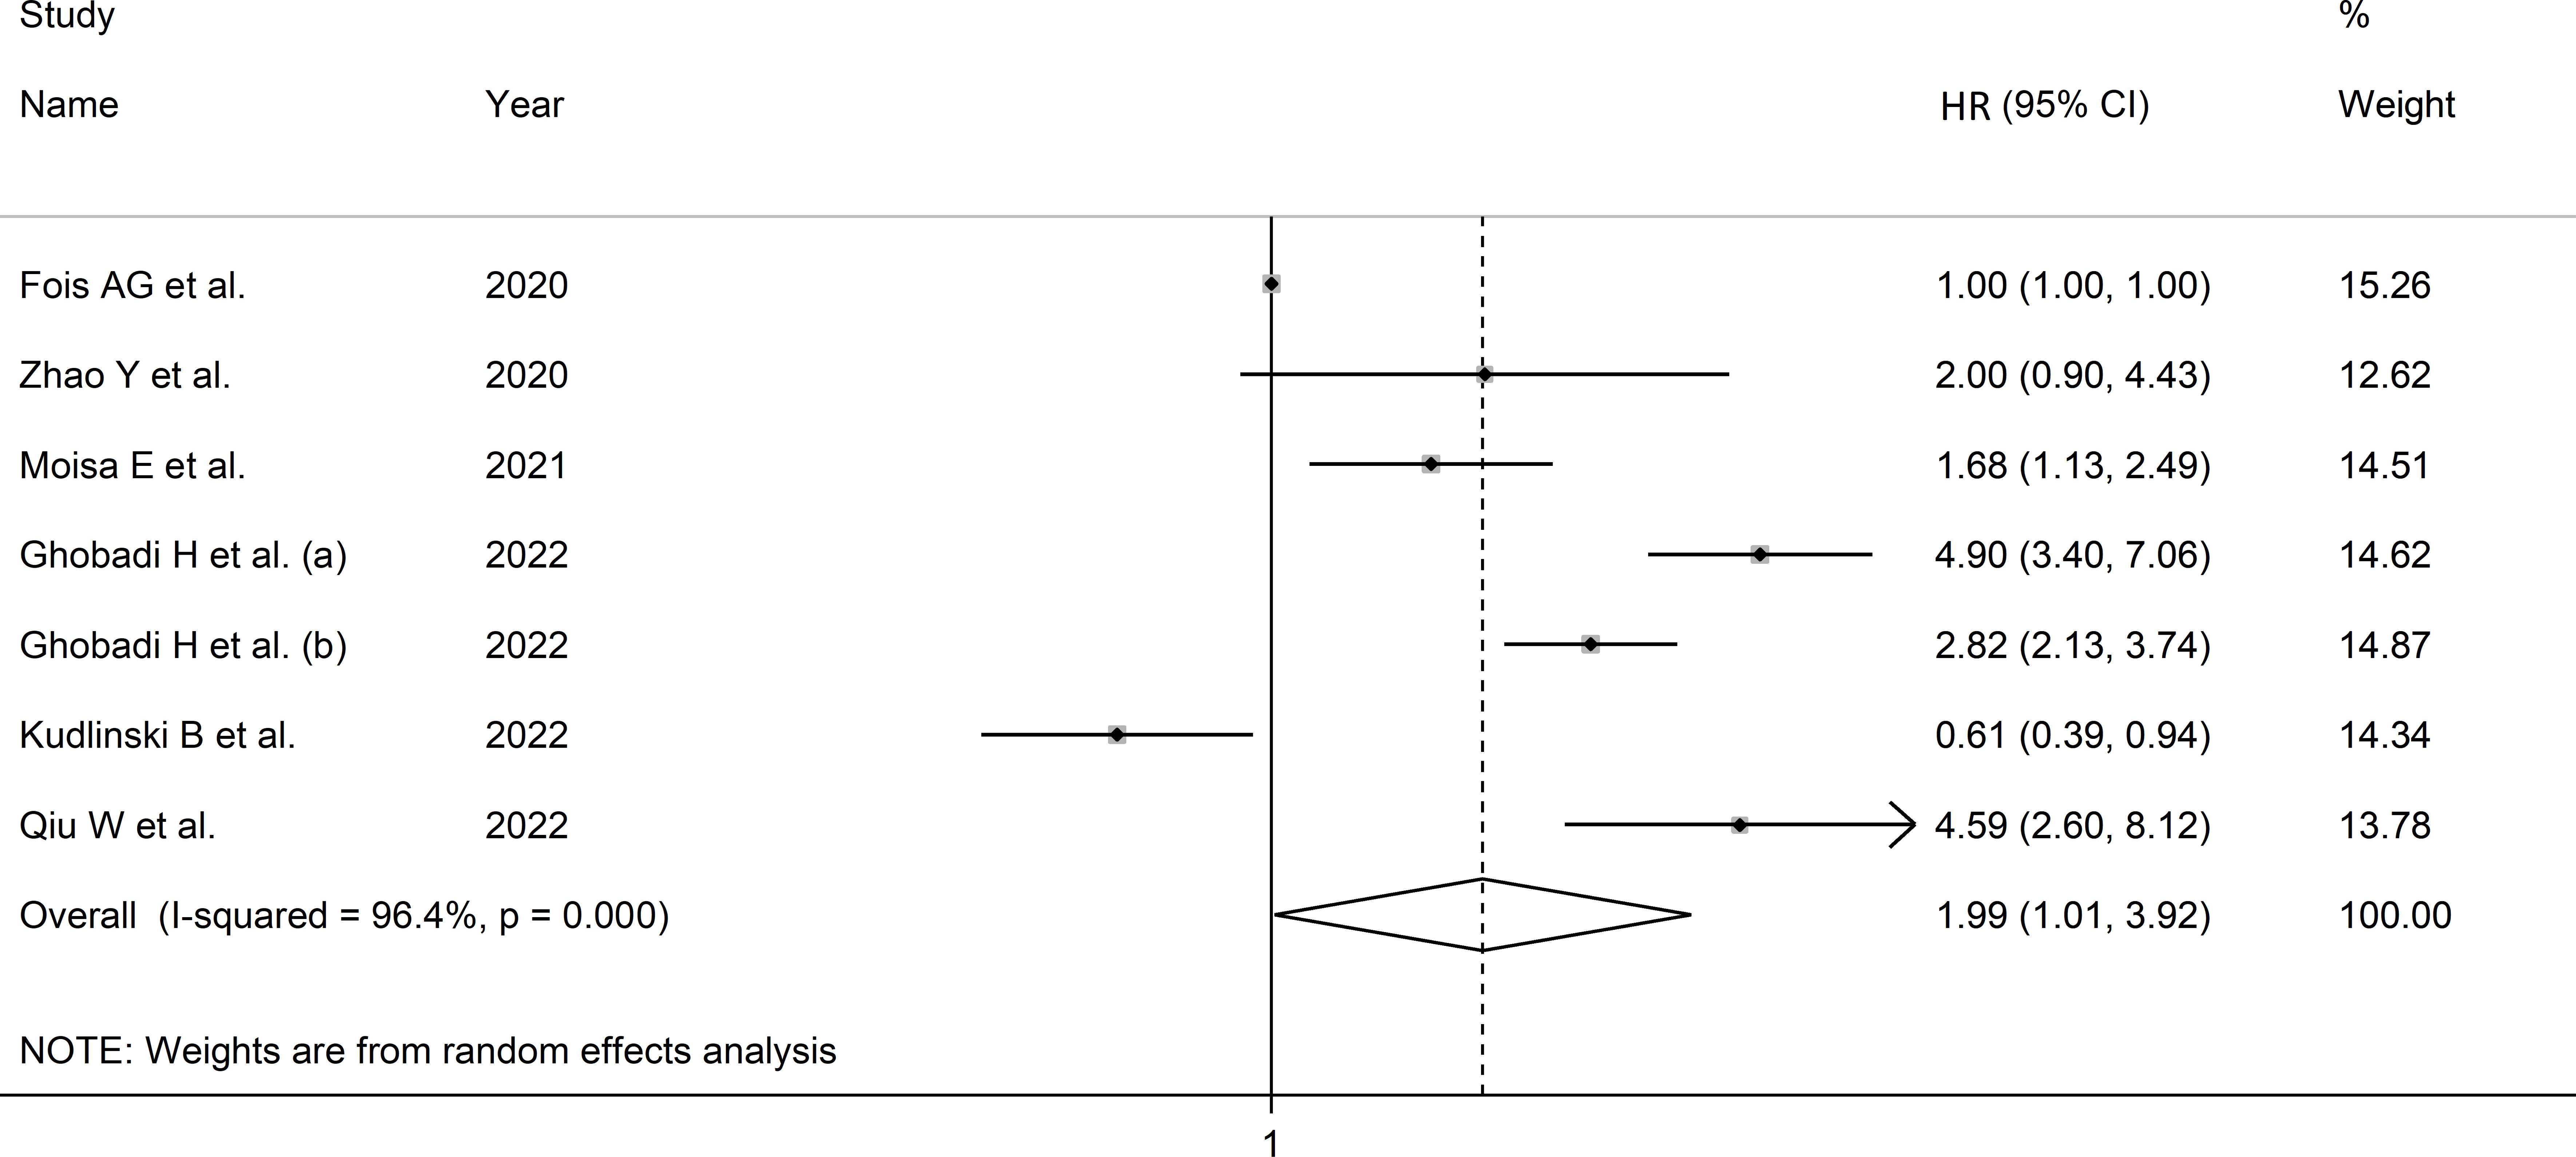
Figure 4 Forest plot of studies examining association between SII and disease severity or survival status in patients with COVID-19 through HR.
Publication bias
Assessment of publication bias was not possible because of the relatively small number of studies.
Sub-group and meta-regression analysis
Meta-regression analysis was not possible because of the relatively small number of studies. In sub-group analysis, the effect size was significant in Asian (HR=3.52, 95% CI 2.41 to 5.12, p<0.001; I2 = 63.7%, p=0.043), but not European studies (HR=1.01, 95% CI 0.39 to 2.59, p=0.986; I2 = 82.7%, p<0.001; Supplementary Figure 10), with a lower between-studies variance in the former.
Certainty of evidence
The initial level of certainty was considered low because of the cross-sectional nature of the studies (rating 2, ⊕⊕⊝⊝). After taking into account the low risk of bias in the majority of studies (no rating change), the substantial but partly explainable heterogeneity (no rating change), the lack of indirectness (no rating change), the relatively low imprecision (confidence intervals not crossing the threshold, no rating change), the moderate effect size (HR=1.99, no rating change), and the presence of publication bias (downgrade by one level), the overall level of certainty was downgraded to very low (rating 1, ⊕⊝⊝⊝).
Accuracy of the SII in predicting severe disease or mortality
Study characteristics
Twenty-one studies (28 patient groups) in 17,863 COVID-19 patients (60% males, mean age 66 years), all retrospective, reported sensitivity and specificity of the ability of the SII to predict severe disease or mortality (36–40, 42, 45, 47, 48, 51, 53, 54, 56, 58, 61, 64, 68–70, 72, 74). Twelve studies were performed in Asia (36, 38, 40, 42, 48, 51, 54, 64, 68, 70, 72, 74), six in Europe (39, 47, 56, 58, 61, 69), two in America (37, 45), and one in Africa (53). The studied endpoint was mortality in 12 studies (36, 37, 39, 45, 47, 48, 51, 54, 56, 58, 61, 68), ICU admission in seven (38–40, 45, 53, 68, 69), disease severity based on existing guidelines in five (42, 64, 70, 72, 74), acute pulmonary embolism in one (61), acute limb ischemia in one (39), and deep vein thrombosis in one (61) (Table 4).
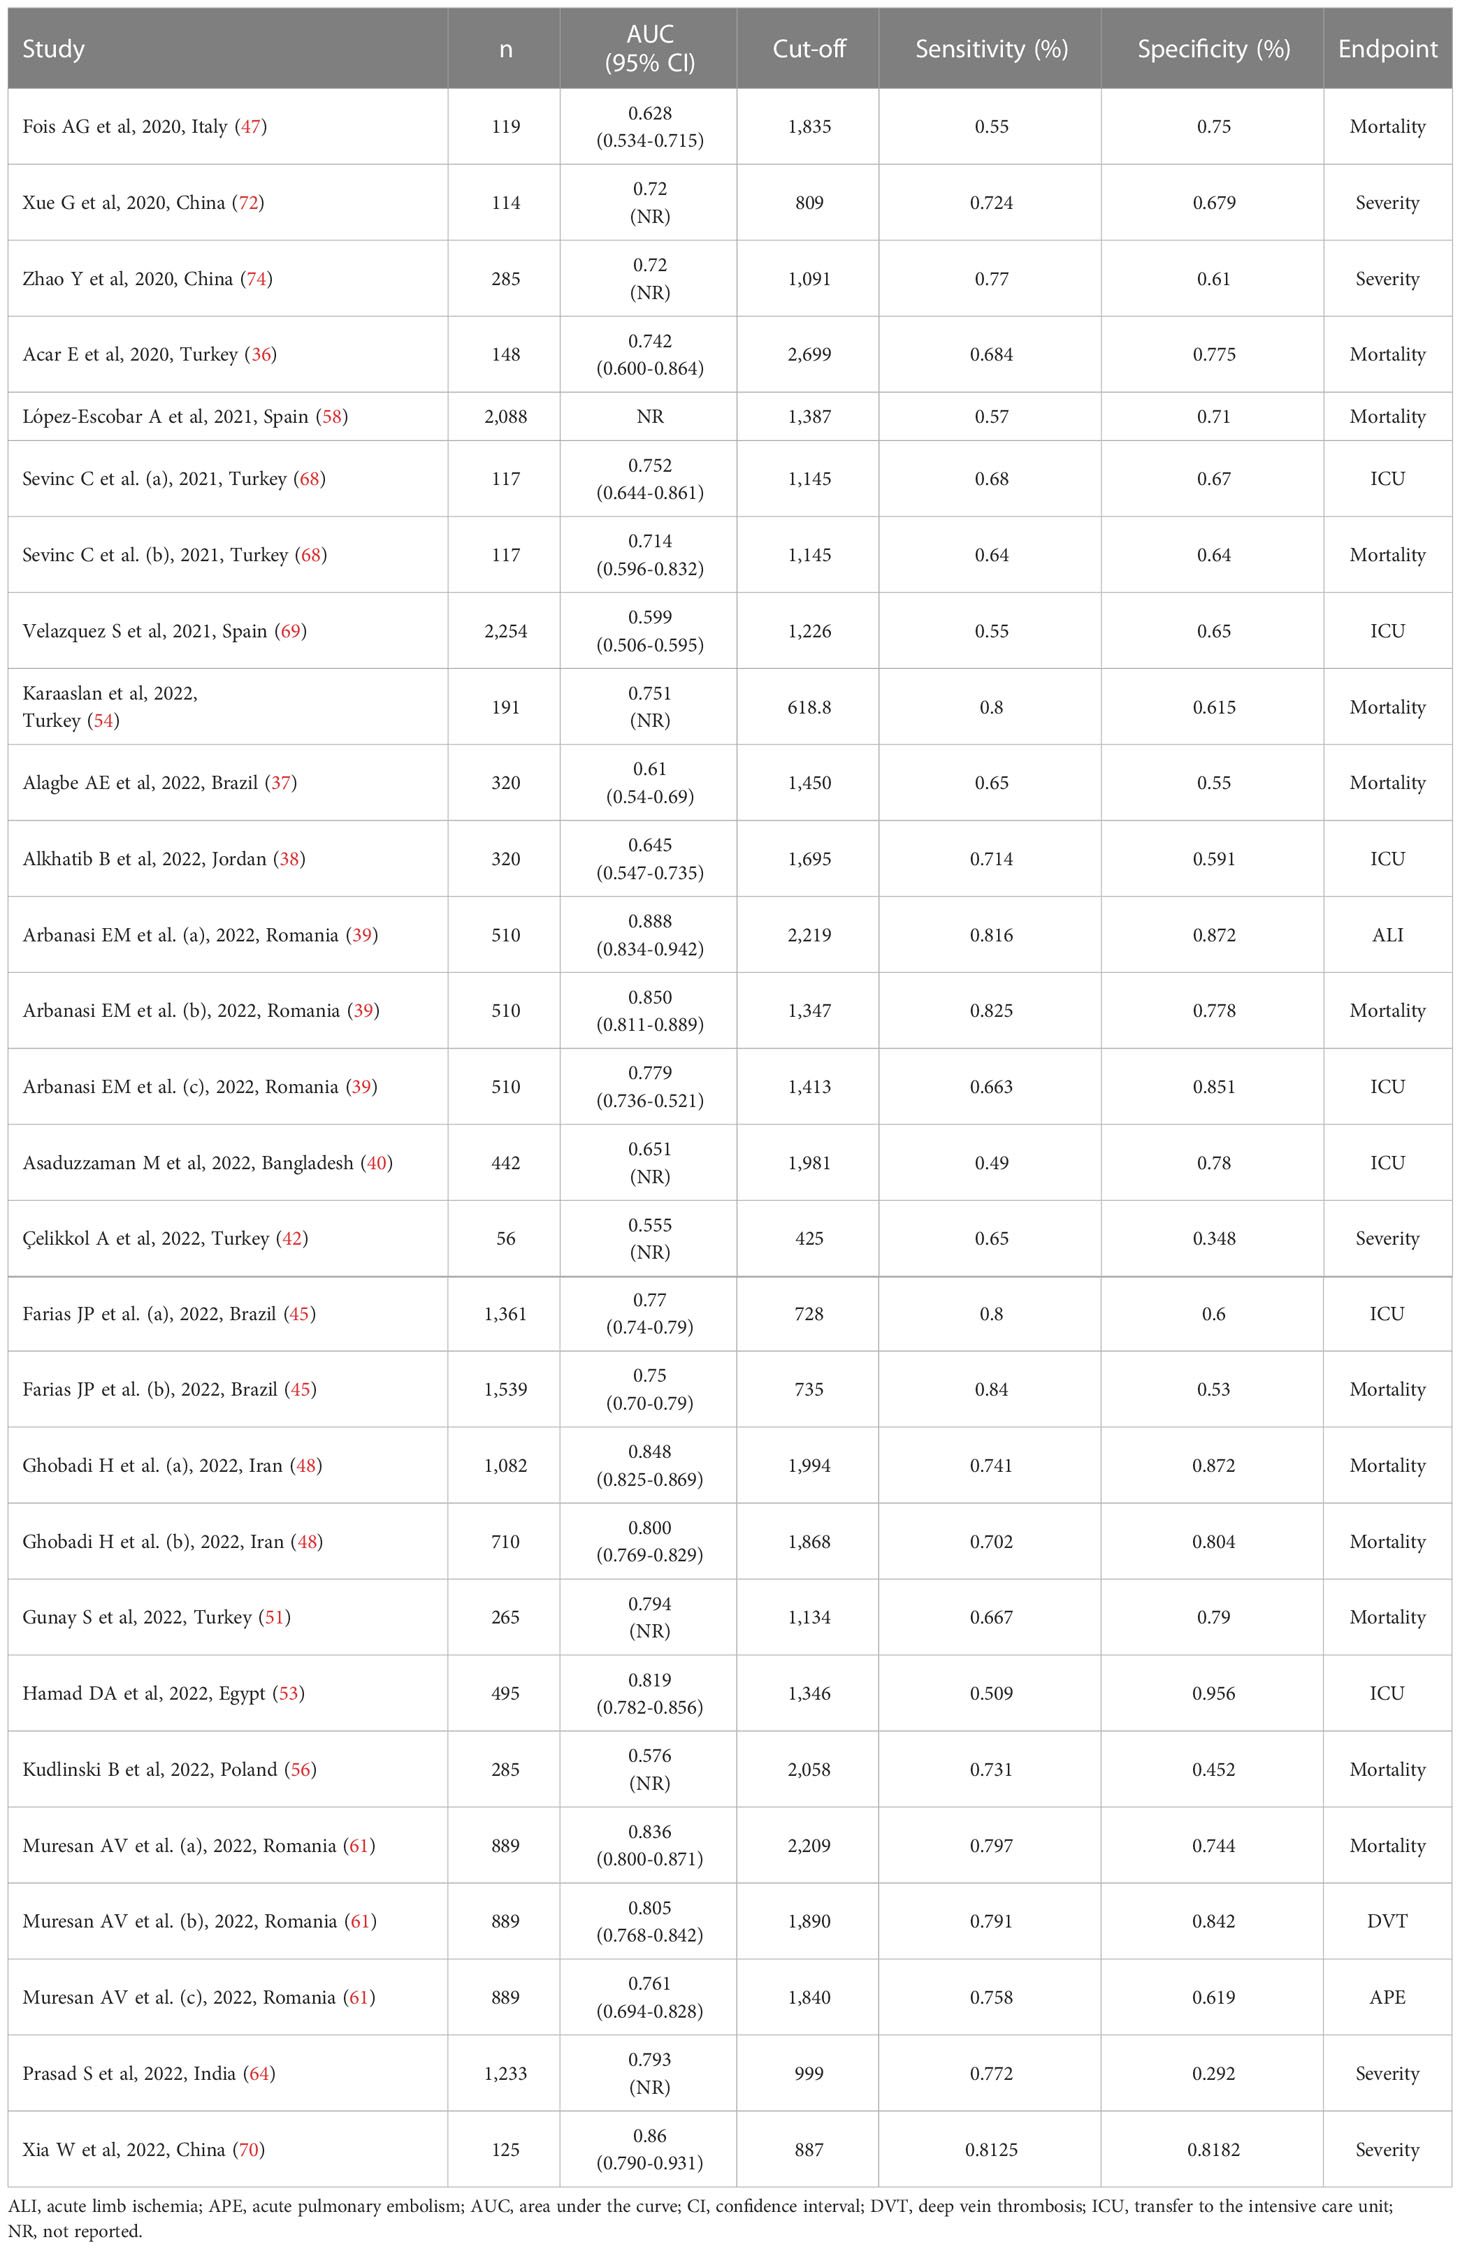
Table 4 Studies investigating the accuracy of the systemic inflammation index in predicting severe disease and mortality in COVID-19 patients.
Risk of bias
The risk of bias was low in all studies, barring five (38, 42, 48, 68, 70) (Supplementary Table 3).
Results of individual studies and syntheses
After creating forest plots for pooled sensitivity and specificity, a summary receiver operating characteristic (SROC) curve was generated using the HSROC model (midas or metandi command). The pooled sensitivity and specificity for the SII towards severe disease or mortality was 0.71 (95% CI 0.67 to 0.75) and 0.71 (95% CI 0.64 to 0.77), respectively (Figure 5). The SROC curve with 95% confidence region and prediction region is described in Figure 6. The AUC value was 0.77 (95% CI 0.73 to 0.80), with the summary operating point at a sensitivity of 0.71 and a specificity of 0.71. We also generated empirical Bayes estimates in HSROC analysis, which provide the best estimates of the true sensitivity and specificity in each study (Figure 7). The midas command was used to evaluate the quantile plot of residual based goodness-of fit, the Chi-squared probability plot of squared Mahalanobis distances for the assessment of the bivariate normality assumption, the spikeplot for assessing particularly influential observations using Cook’s distance, and a scatter plot to check for outliers using standardized predicted random effects (Figure 8). The analysis identified two outliers (53, 64). However, their removal did not exert tangible effects on the results, with AUC of 0.77, sensitivity of 0.72, and specificity of 0.71.

Figure 5 Forest plot for the pooled estimates of sensitivity and specificity of the SII towards disease severity or mortality.
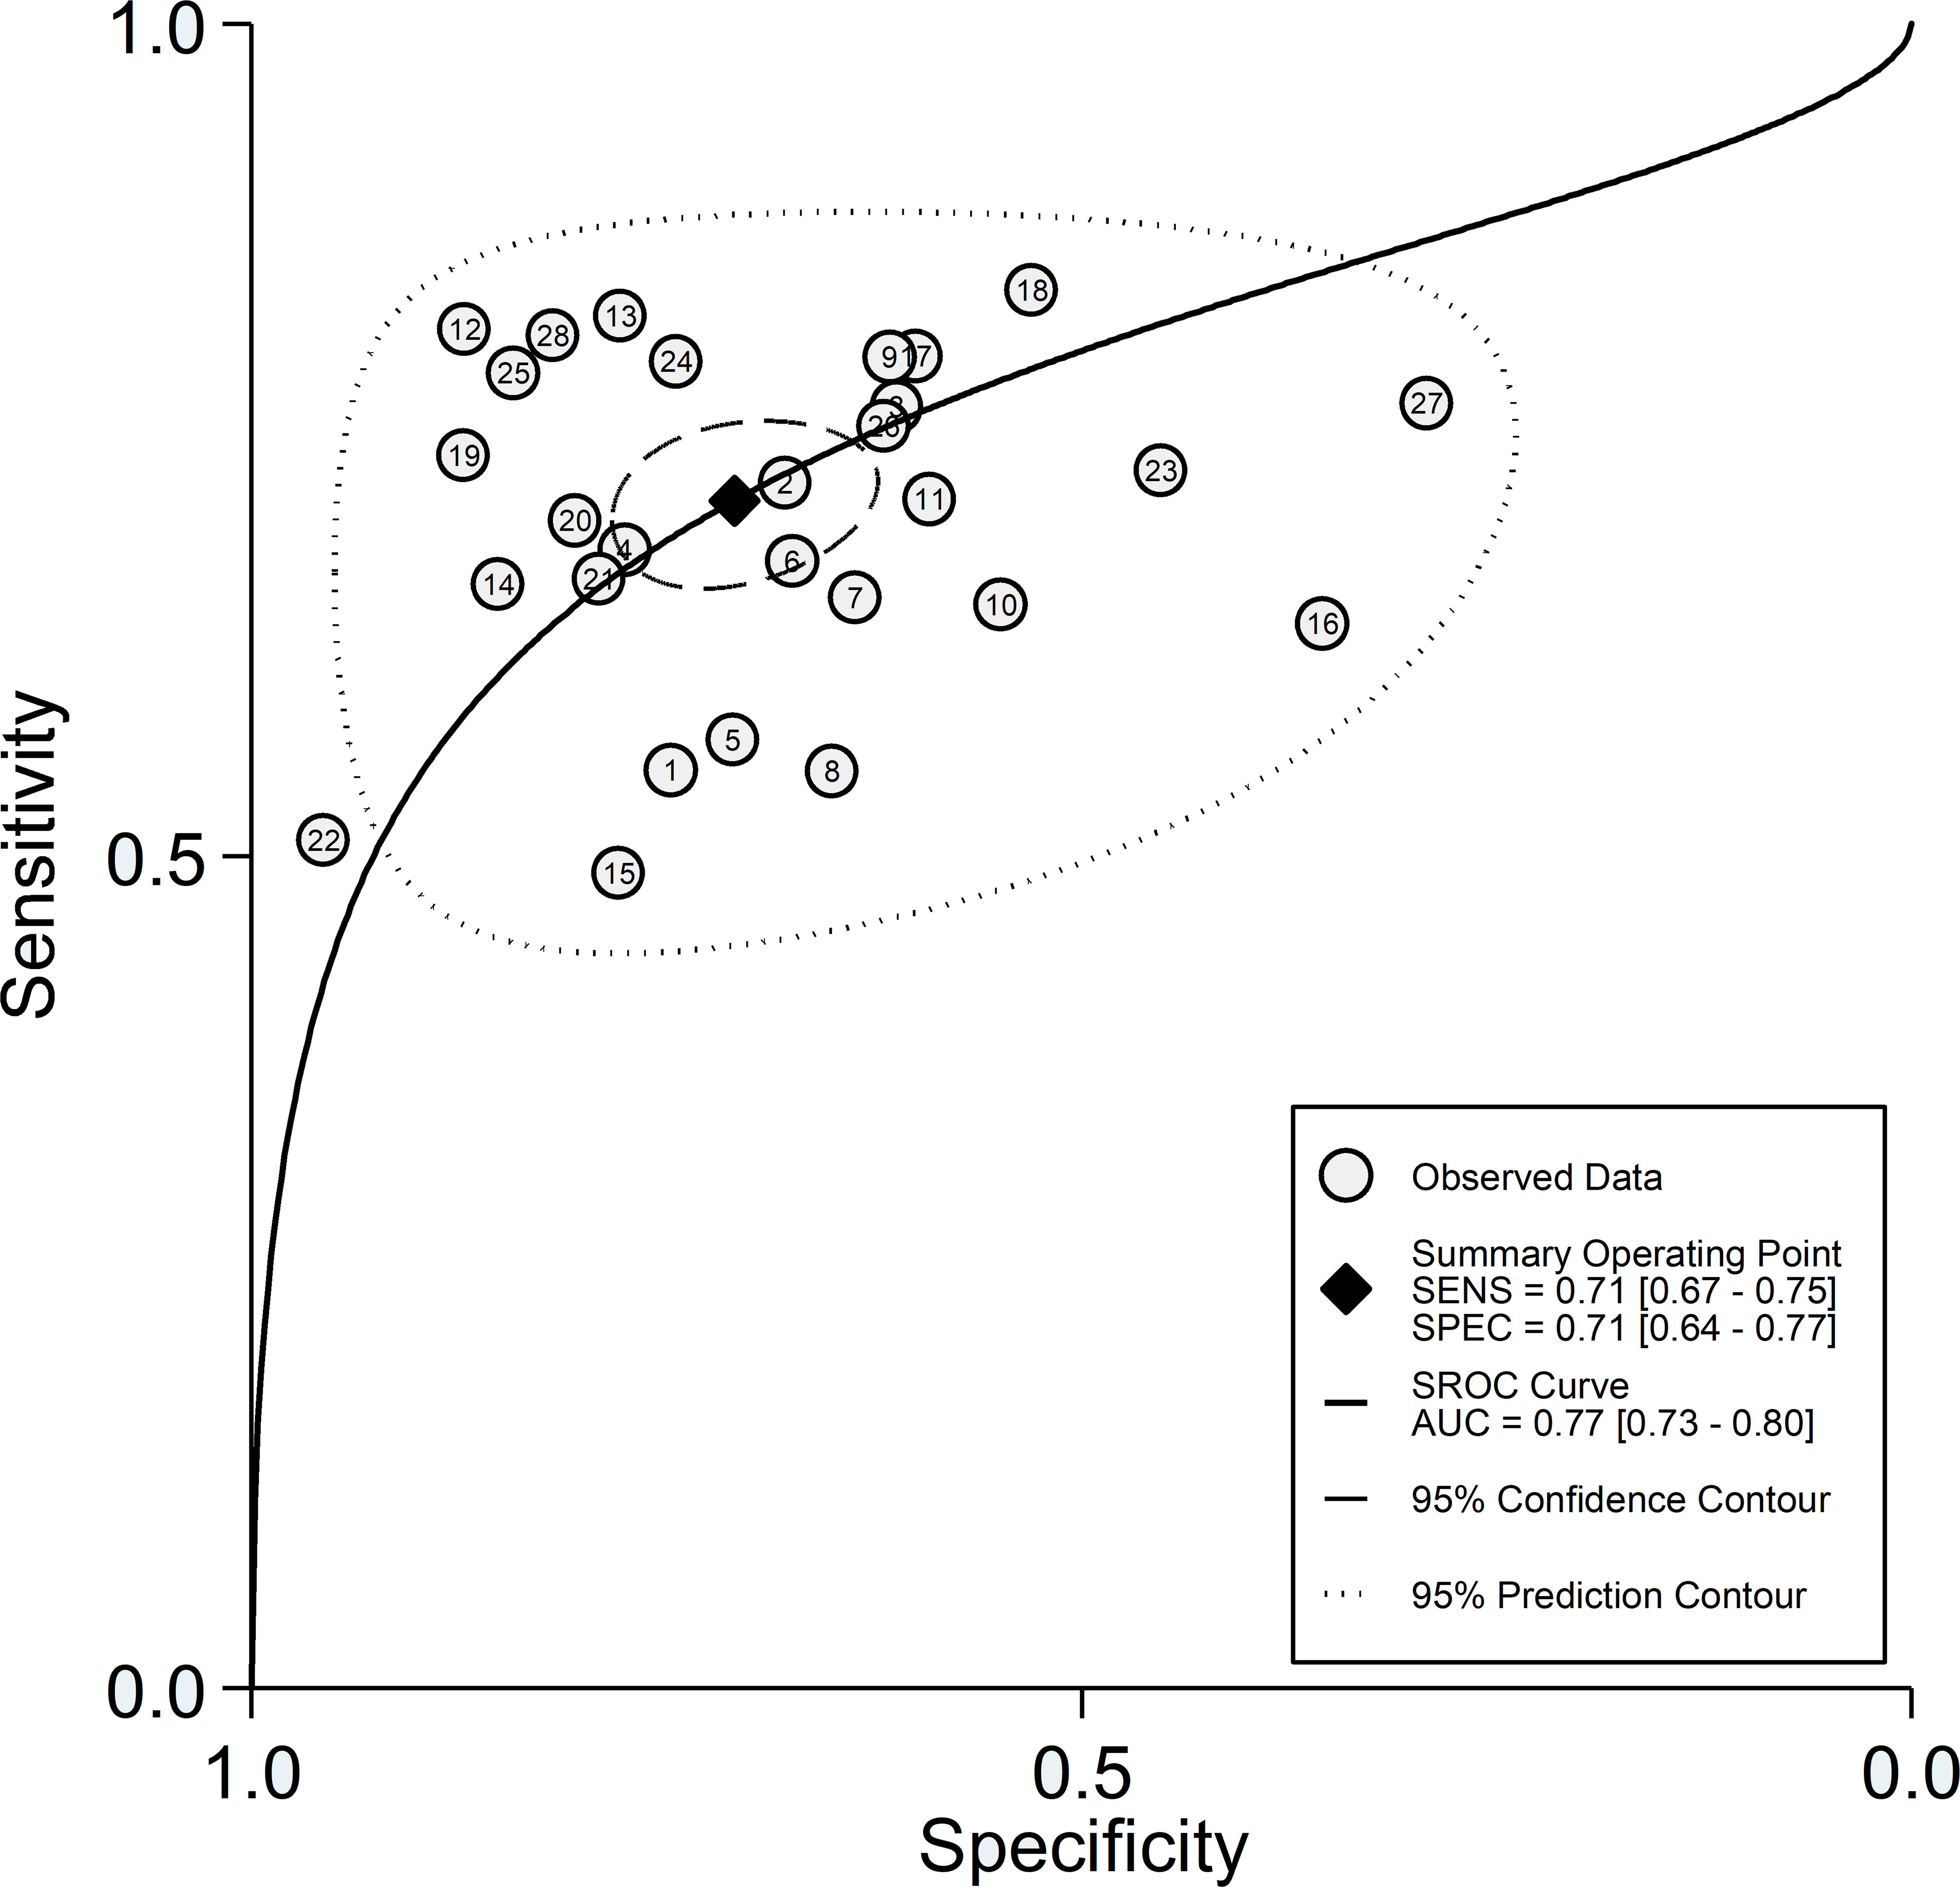
Figure 6 SROC curve with 95% confidence region and prediction region for the SII towards prediction of severe disease or mortality.
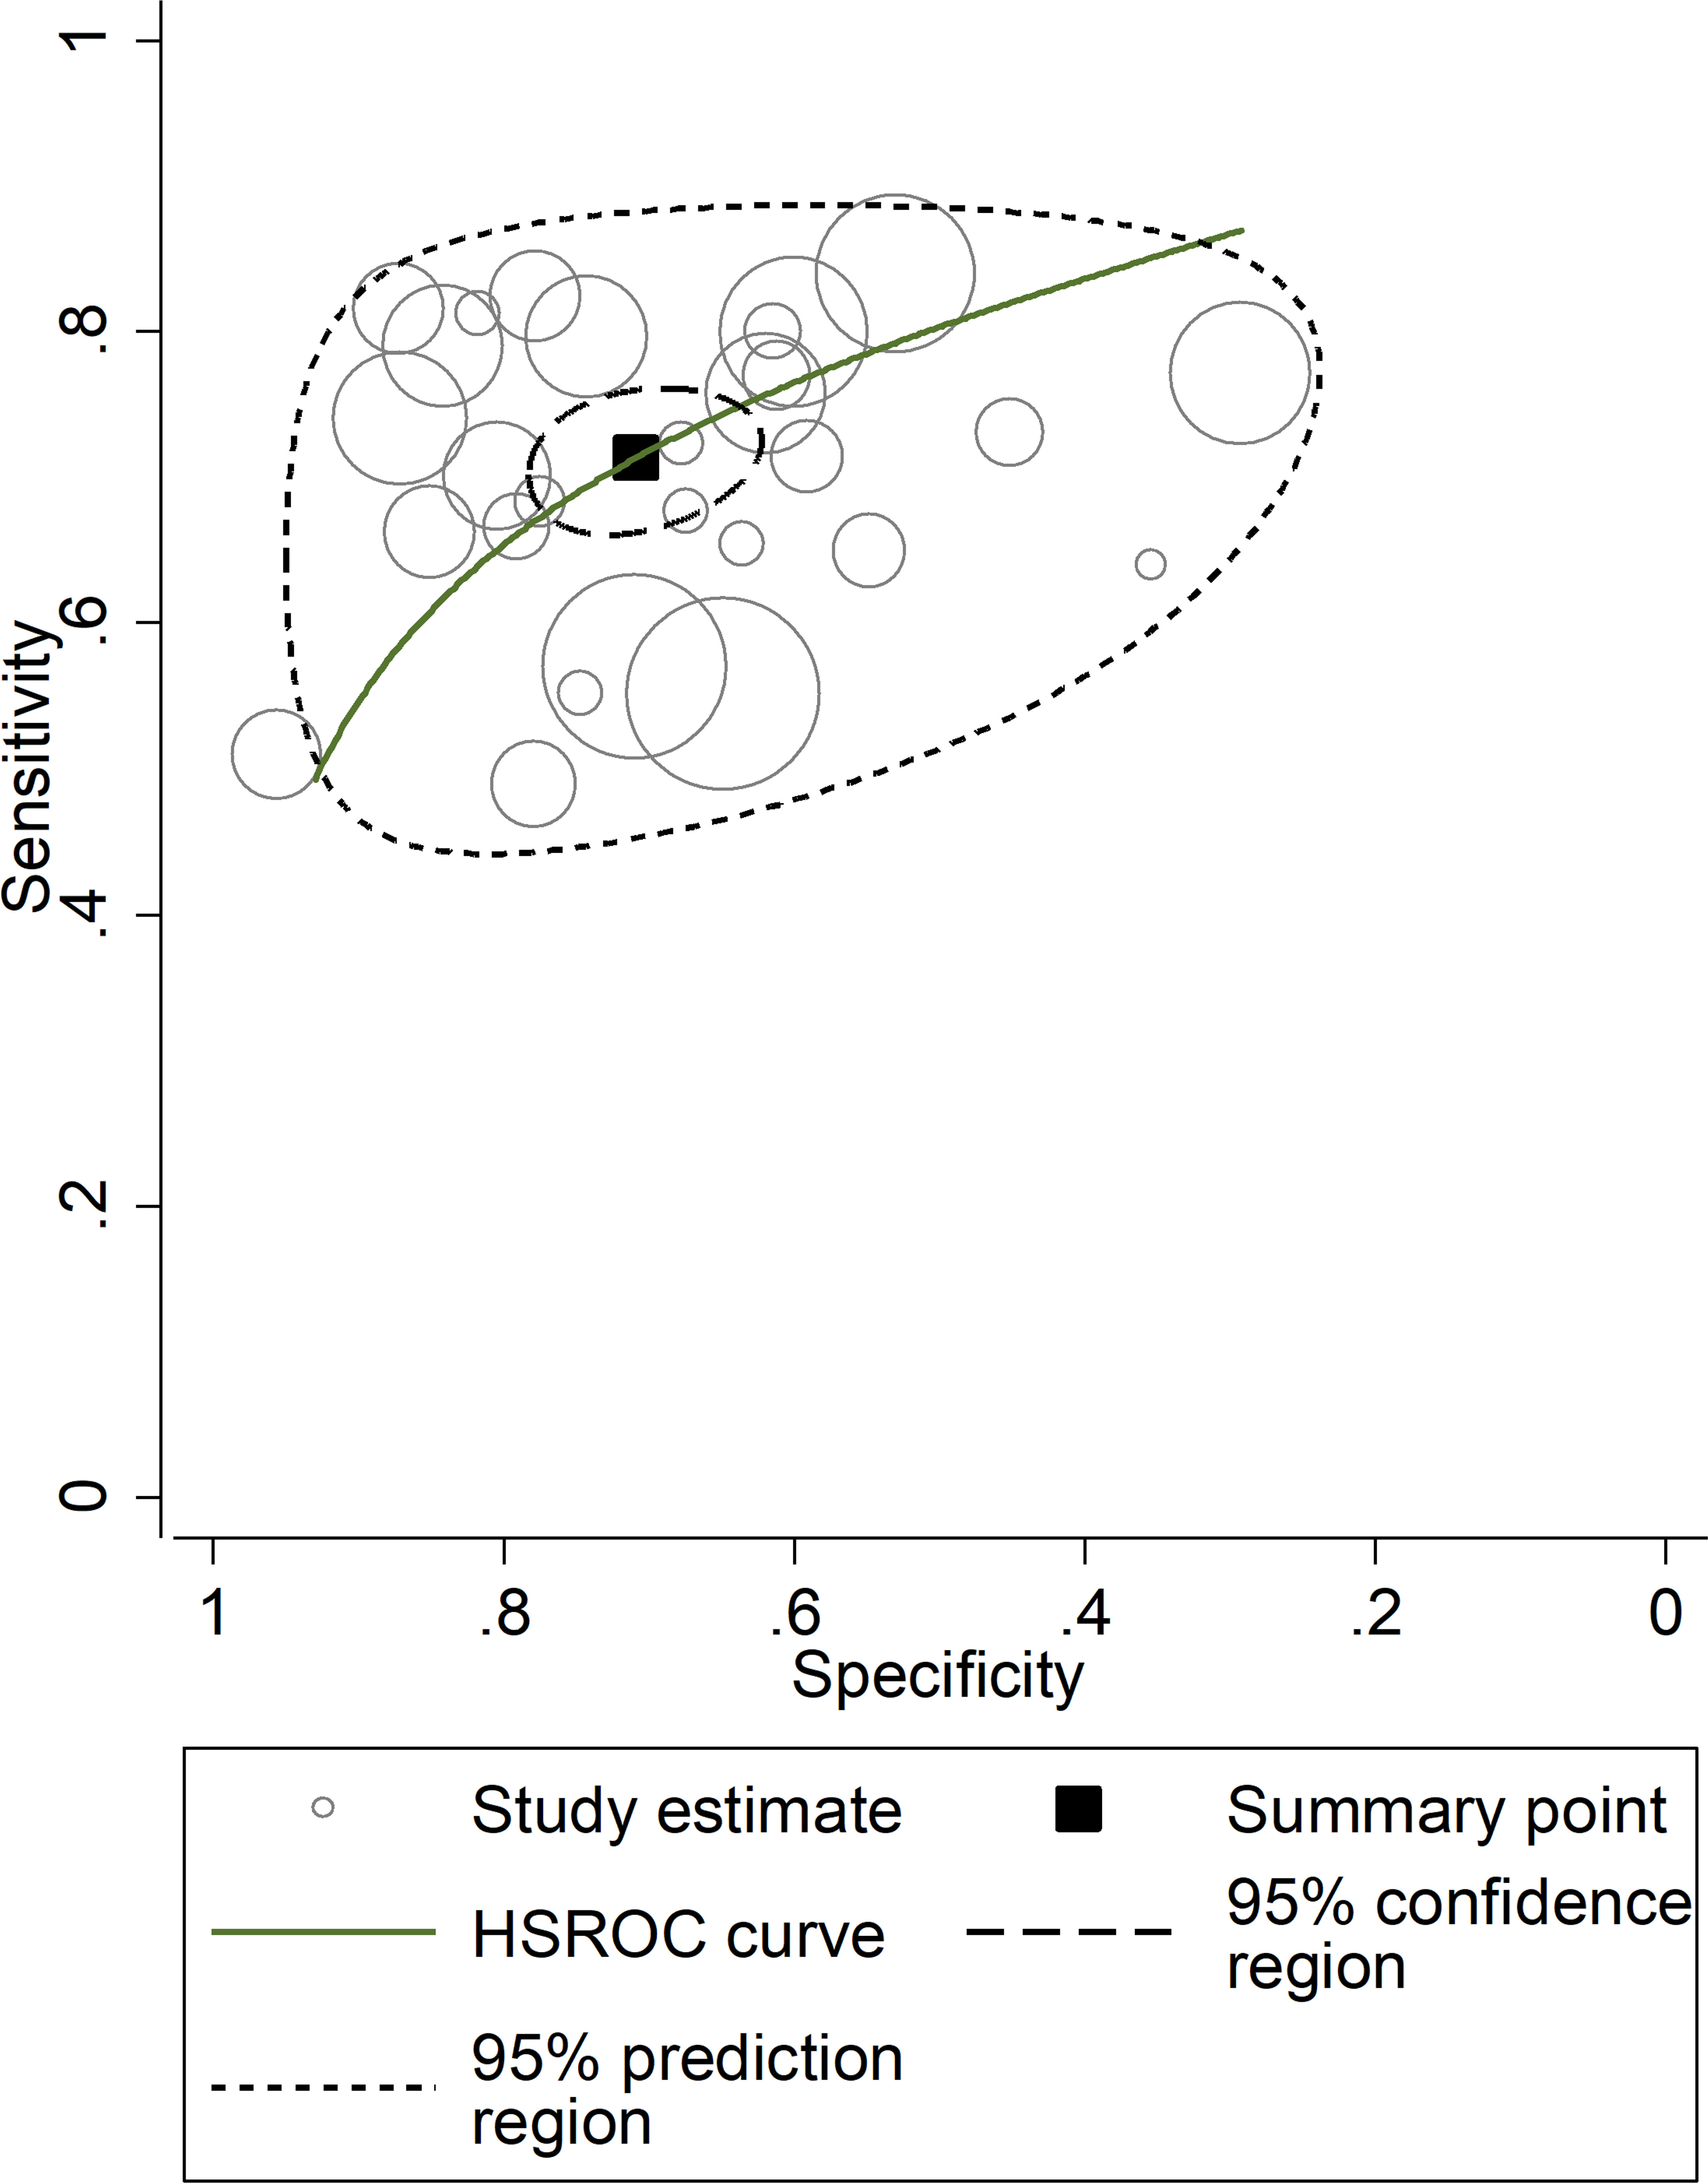
Figure 7 Empirical Bayes (posterior prediction) estimates hierarchical receiving operating characteristic (HSROC) curve with 95% confidence region and prediction region for SII towards prediction of severe disease or mortality.
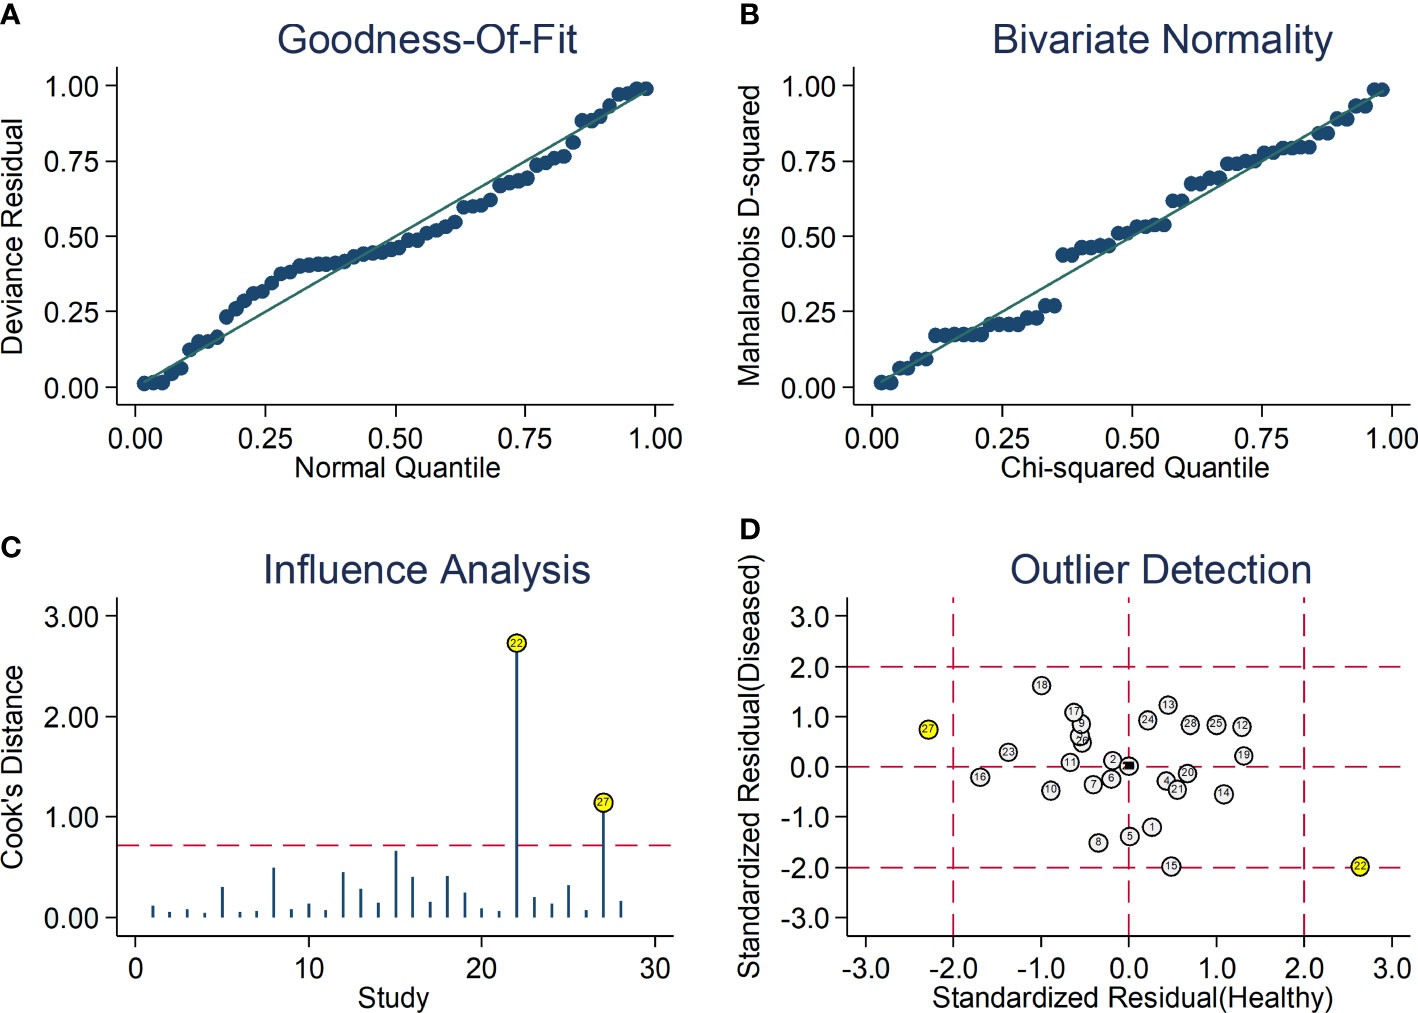
Figure 8 Graphical illustration of residual-based goodness-of-fit (A), bivariate normality (B), influence (C), and outlier detection (D) analyses.
The clinical utility of the SII at the population level was assessed by generating the Fagan’s nomogram (Figure 9). Assuming a 25% prevalence of adverse outcomes (pre-test probability), the nomogram showed that the posterior (post-test) probability of adverse outcome was 45% in patients with a relatively high SII and 12% in patients with a relatively low SII.
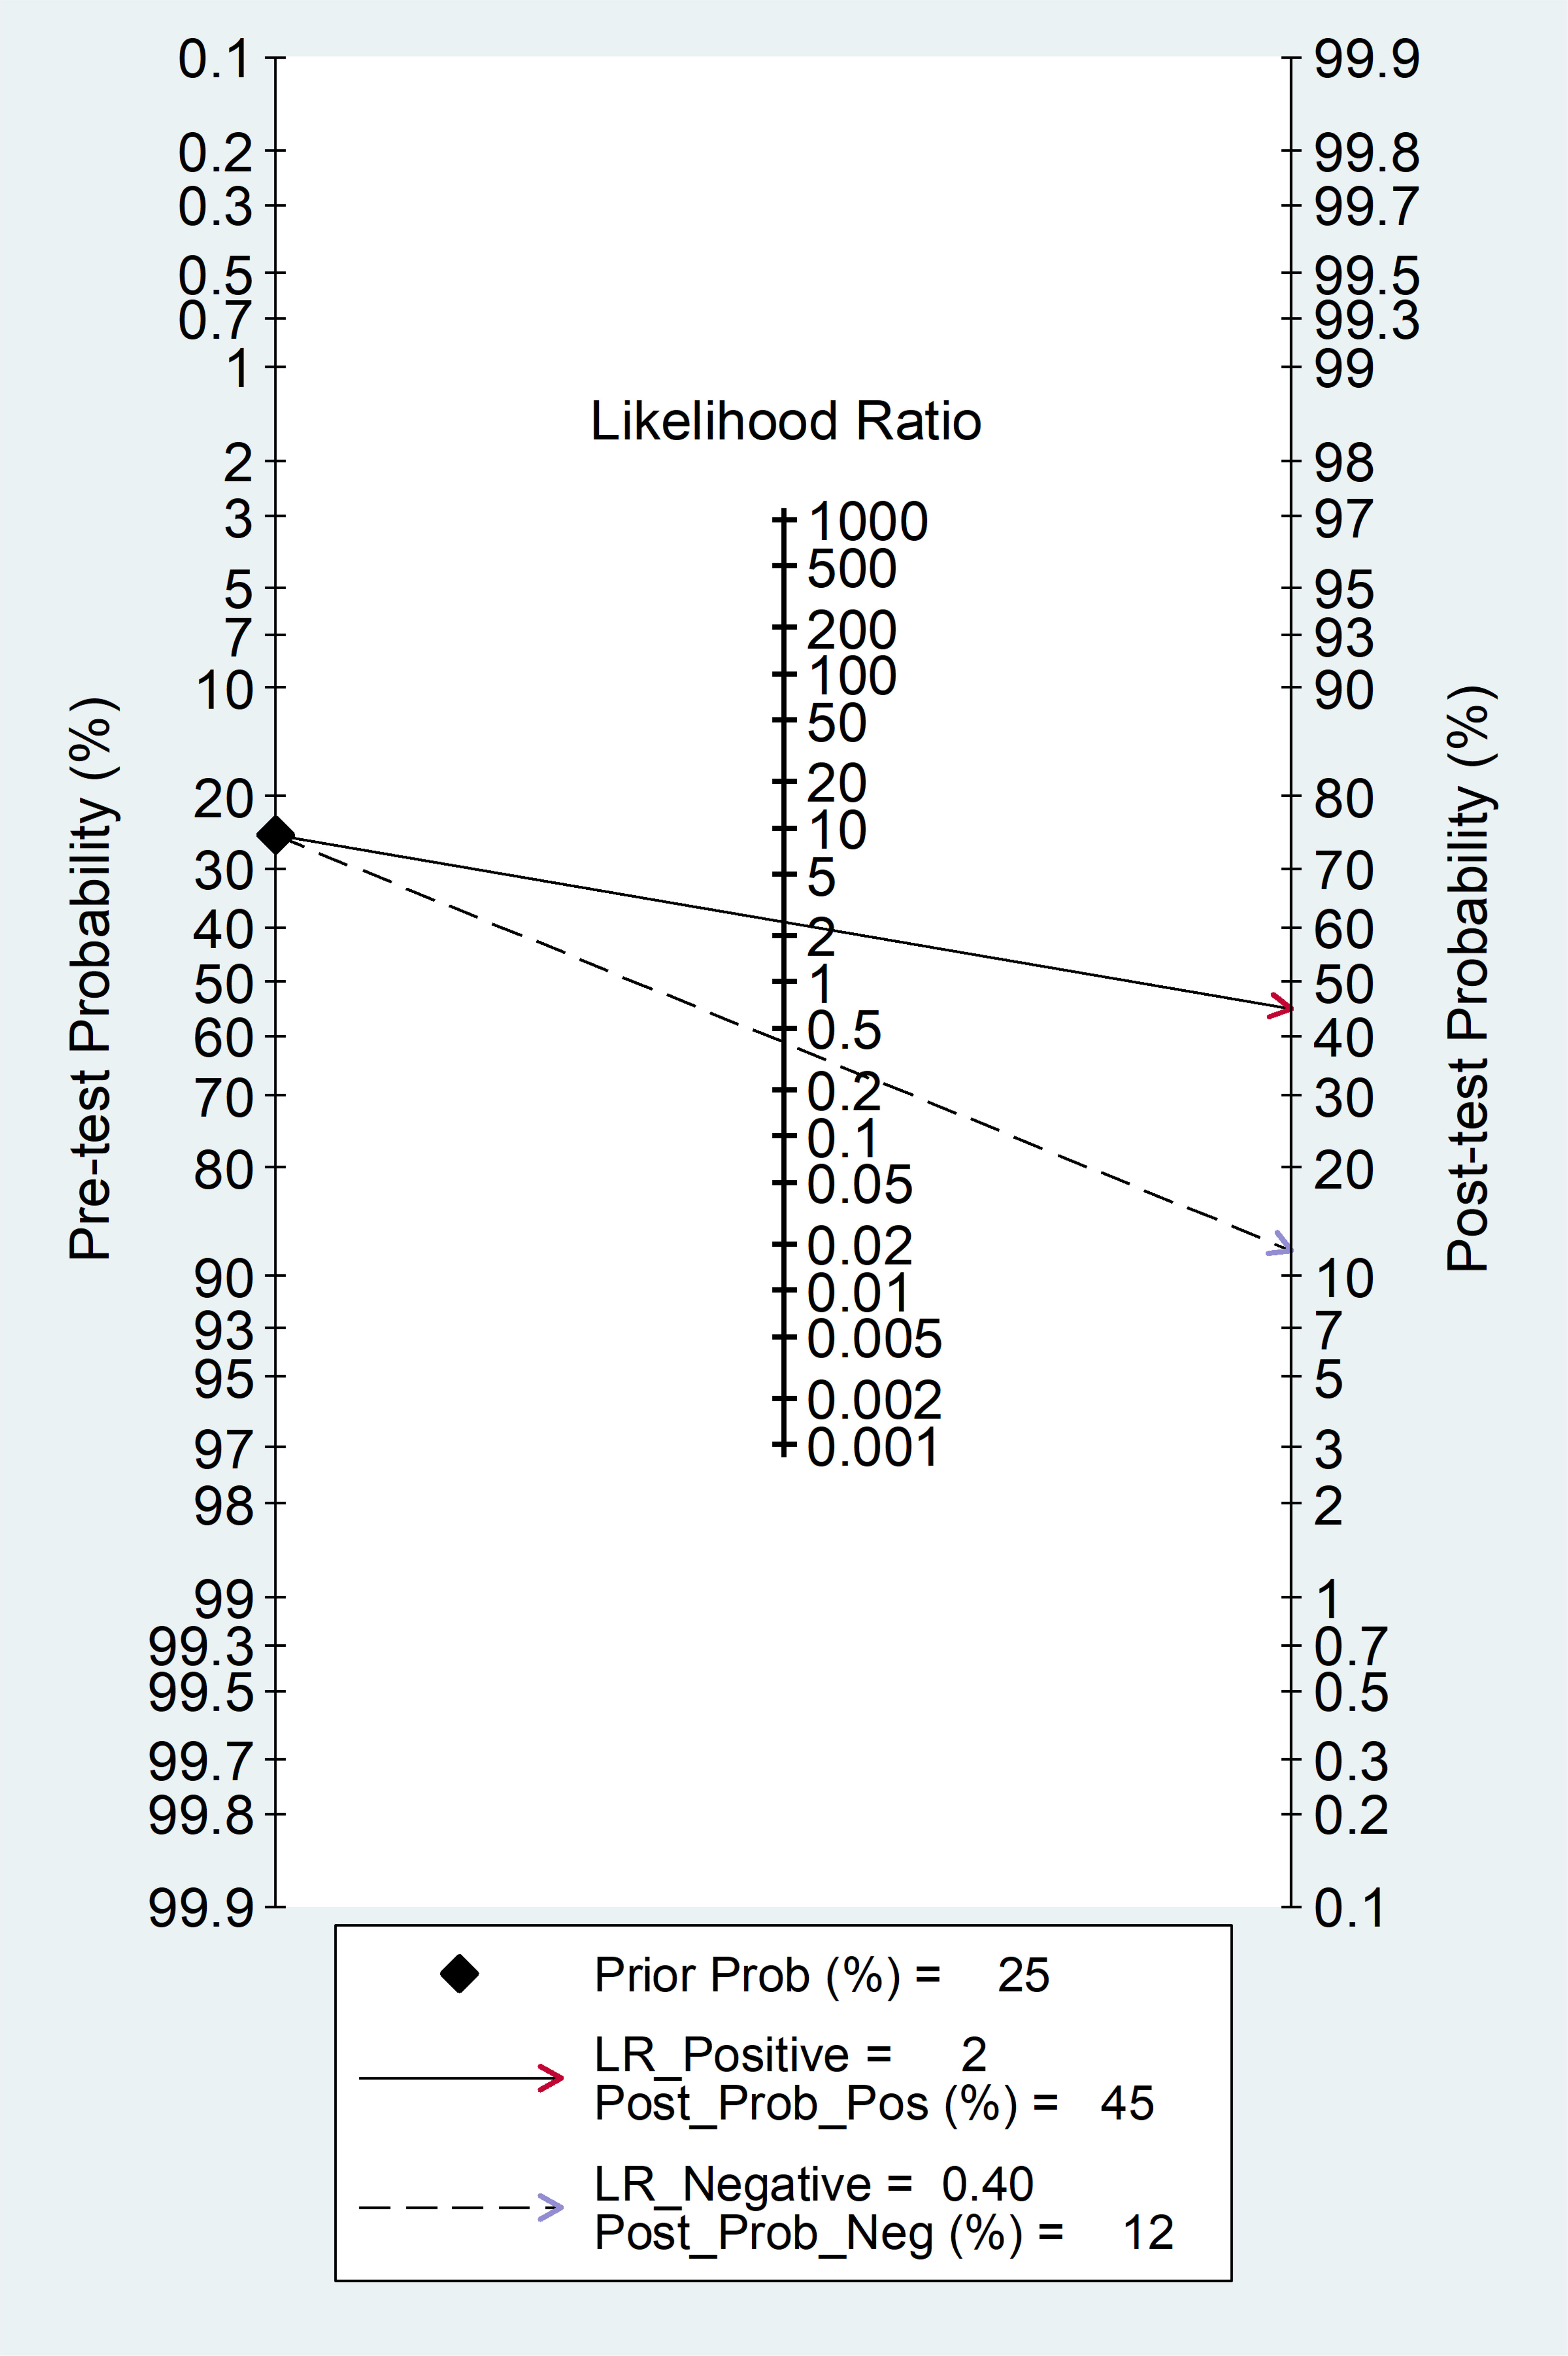
Figure 9 Fagan’s nomogram for the SII towards prediction of severe disease or mortality.
Publication bias
No significant publication bias (p=0.687) was observed in the Deeks’ funnel plot asymmetry test (Supplementary Figure 11).
Heterogeneity, sub-group, and meta-regression analysis
The presence of heterogeneity across the studies was investigated using different approaches. First, the HSROC curve was shown to be symmetric, based on the correlation coefficient between logit transformed sensitivity and specificity (HSROC model), which was negative (-0.277, 95% CI -0.616 to -0.149). However, the symmetry parameter β (0.587, 95% CI 0.169 to 1.00) showed a significant p-value (0.006), suggesting an elevated between-study variance (data not reported). In addition, the visual representation of the HSROC suggested a moderate degree of heterogeneity (95% CI 0.73 to 0.80; Figure 7). In midas, the pooled sensitivity and specificity showed an inconsistency (I2) of 88.04% and 98.23%, respectively (Figure 5). Using the bivariate boxplot with logit_Se and logit_Sp, four studies (42, 45, 53, 64) fell outside the circles, which also indicates heterogeneity (Supplementary Figure 12). The sources of heterogeneity were further explored using univariate meta-regression analysis. Age and sex were significantly associated with the effect size for sensitivity (p=0.02 and p=0.01, respectively) whereas no parameter was significantly associated with the effect size for specificity (Supplementary Figure 13).
Discussion
Our systematic review and meta-analysis has shown that the SII on admission was significantly higher in hospitalized patients with COVID-19 with a severe disease or non-survivor status when compared to patients with a non-severe disease or survivor status. Notably, the between-group differences in the SII were statistically significant using either SMDs, ORs, or HRs. Furthermore, the capacity of the SII to discriminate between the two patient groups was considered good, with an overall AUC value of 0.77. Sensitivity analysis confirmed the stability of the results of the meta-analysis. In meta-regression, the effect size was significantly associated with some markers of inflammation (e.g., albumin and lactate dehydrogenase) but not others (e.g., C-reactive protein and ferritin). Furthermore, no significant associations were observed with known risk factors for adverse outcomes in COVID-19, such as diabetes, hypertension, and cardiovascular disease (75–77). This supports the proposition that the SII may provide additional information regarding the extent of systemic inflammation in COVID-19 and could therefore be helpful in enhancing the capacity to identify those patients at risk of severe disease or death early after hospital admission. Furthermore, the lack of significant associations between the effect size and the year of publication suggests that the capacity of the SII to discriminate between patients with severe disease/non-survivor status and patients with non-severe disease/survivor status was maintained through the first three years of the COVID-19 pandemic and was not influenced by different vaccination status and vaccine dose, new SARS-CoV-2 variants, and the progressive introduction of anti-inflammatory and immunomodulatory treatment strategies. Interestingly, subgroup analysis identified differences in effect size associated with the specific study continent, particularly for studies reporting ORs and HRs, indicating a possible role of ethnicity in influencing the association between the SII and COVID-19.
The SII was initially investigated in 2014 as an inflammatory biomarker to predict clinical outcomes in cancer patients (20). Since then, an increasing number of studies, including systematic reviews and meta-analyses, have reported that the SII is significantly associated with a reduced overall survival and/or progression-free survival in several types of cancer, e.g., carcinoma patients receiving immune checkpoint inhibitors (78), prostate cancer (79), gynaecological and breast cancer (80), lung cancer (81), urinary tract cancer (82, 83), and several cancers of the gastrointestinal tract (84–87). Furthermore, relatively high SII values at baseline have been shown to be significantly associated with adverse clinical outcomes in other disease states characterised by a systemic pro-inflammatory state, e.g., stroke (88), non-alcoholic fatty liver disease (89), and ischaemic heart disease (90). Notably, in patients with coronary heart disease undergoing revascularisation the predictive capacity of the SII for adverse clinical outcomes was superior to that of traditional cardiovascular risk factors, further supporting the potential clinical utility of this index in routine practice (91). The COVID-19 pandemic has provided further impetus to investigate the potential clinical use of the SII, given the established role of a state of excess systemic inflammation in the pathophysiology of the disease and the related risk of complications and adverse outcomes (92, 93). Compared to other indexes investigated in patients with COVID-19 that are derived from routine haematological parameters, e.g., NLR and the platelet-to-lymphocyte ratio (PLR), the SII captures information from three key blood cell types involved in the pathophysiology of inflammation, i.e., neutrophils, platelets, and lymphocytes. The potential superiority of the SII over other indices in COVID-19 was initially reported by Fois et al. (47). In their study, multivariate analysis showed that the SII, but not other indices such as the aggregate index of systemic inflammation, NLR, monocyte-to-lymphocyte ratio, PLR, and systemic inflammation response index, was independently associated with the primary endpoint, hospital mortality (47).
The comprehensive appraisal of the published literature in our study provides robust evidence of the potential clinical utility of the SII in COVID-19 patients. This is further supported by the observed pooled AUC value and the results of the Fagan’s nomogram, which indicated that the post-test probability of severe disease/mortality was significantly different from the pre-test probability (94). However, before its introduction in clinical practice, further research is warranted to justify the use of the SII for the routine assessment of patients with COVID-19. In particular, appropriately designed prospective studies should investigate the predictive capacity of the SII singly or in combination with other biomarkers of inflammation and to determine the influence of specific patient characteristics. For example, in addition to the potential effects of ethnicity previously described, recent epidemiological studies have reported that age and sex can also influence the SII (95, 96).
The observed moderate-substantial between-study heterogeneity is a significant limitation of our study. However, subgroup analysis identified specific sources of heterogeneity when the effect size was expressed as SMD (study endpoint), OR (study continent), and HR (study continent). Furthermore, there was significant publication bias in studies reporting the OR whereas no assessment could be performed in studies reporting the HR because of their limited number. As discussed, a significant strength of our systematic review and meta-analysis was the comprehensive assessment of the clinical significance of the SII by means of meta-regression and subgroup analysis, SROC, and Fagan’s nomogram.
In conclusion, our systematic review and meta-analysis has shown that higher SII values on admission are significantly associated with severe clinical manifestations and the risk of mortality in hospitalized COVID-19 patients. Further prospective studies are warranted to determine whether this haematologically derived inflammatory biomarker can further enhance, singly or in combination with other inflammatory, demographic, or clinical parameters, the prognosis and management of a wide range of COVID-19 patient populations, including patients of different ethnicity.
Data availability statement
The original contributions presented in the study are included in the article/Supplementary Material. Further inquiries can be directed to the corresponding author.
Author contributions
Study conception: AZ, AM. Data collection and analysis: AZ. Data interpretation: AZ, AM. Writing - first draft: AM. Writing - Review and Editing, AZ, AM. All authors contributed to the article and approved the submitted version.
Conflict of interest
The authors declare that the research was conducted in the absence of any commercial or financial relationships that could be construed as a potential conflict of interest.
Publisher’s note
All claims expressed in this article are solely those of the authors and do not necessarily represent those of their affiliated organizations, or those of the publisher, the editors and the reviewers. Any product that may be evaluated in this article, or claim that may be made by its manufacturer, is not guaranteed or endorsed by the publisher.
Supplementary material
The Supplementary Material for this article can be found online at: https://www.frontiersin.org/articles/10.3389/fimmu.2023.1212998/full#supplementary-material
Supplementary Figure 1 | Sensitivity analysis of the association between the SII and COVID-19. The middle vertical axis indicates the overall standardized mean difference, and the two vertical axes indicate the 95% confidence intervals. The hollow circles represent the pooled standardized mean difference when the remaining study is omitted from the meta-analysis. The two ends of each broken line represent the 95% confidence intervals.
Supplementary Figure 2 | Funnel plot of studies reporting SII values in COVID-19 patients with different disease severity and survival status after “trimming-and-filling.” Dummy studies and genuine studies are represented by enclosed circles and free circles, respectively.
Supplementary Figure 3 | Forest plot of studies examining the SII in patients with COVID-19 according to specific endpoint.
Supplementary Figure 4 | Forest plot of studies examining SII in patients with COVID-19 according to specific geographic area.
Supplementary Figure 5 | Sensitivity analysis of the association between the SII and COVID-19 disease. The influence of individual studies on the overall odds ratio (OR) is shown. The middle vertical axis indicates the overall OR and the two vertical axes indicate the 95% confidence intervals (CI). Hollow circles represent the pooled OR when the remaining study is omitted from the meta-analysis. The two ends of each broken line represent the 95% CI.
Supplementary Figure 6 | Forest plot of studies examining the association between the SII and disease severity or survival status in patients with COVID-19 by means of odds ratio, after removing the studies of Xue et al and Cocos et al (44, 72).
Supplementary Figure 7 | Forest plot of studies examining the SII in patients with COVID-19 by means of odds ratio, according to specific endpoint.
Supplementary Figure 8 | Forest plot of studies examining the SII in patients with COVID-19 by means of odds ratio, according to the study continent.
Supplementary Figure 9 | Sensitivity analysis of the association between SII and COVID-19 disease using hazard ratio (HR). The middle vertical axis indicates the overall HR, and the two vertical axes indicate the 95% confidence intervals (CI). The hollow circles represent the pooled HR when the remaining study is omitted from the meta-analysis. The two ends of each broken line represent the 95% CI.
Supplementary Figure 10 | Forest plot of studies examining the SII in patients with COVID-19 by means of hazard ratio, according to the study continent.
Supplementary Figure 11 | Deeks’ funnel plot asymmetry test for the assessment of publication bias.
Supplementary Figure 12 | The bivariate boxplot exploring heterogeneity across the studies.
Supplementary Figure 13 | Forest plots of sensitivity and specificity for the study level covariates included in the univariate meta-regression model.
References
1. Merad M, Blish CA, Sallusto F, Iwasaki A. The immunology and immunopathology of COVID-19. Science (2022) 375(6585):1122–7. doi: 10.1126/science.abm8108
2. Li Q, Wang Y, Sun Q, Knopf J, Herrmann M, Lin L, et al. Immune response in COVID-19: what is next? Cell Death Differ (2022) 29(6):1107–22. doi: 10.1038/s41418-022-01015-x
3. Silberberg E, Filep JG, Ariel A. Weathering the storm: harnessing the resolution of inflammation to limit COVID-19 pathogenesis. Front Immunol (2022) 13:863449. doi: 10.3389/fimmu.2022.863449
4. de Andrade SA, de Souza DA, Torres AL, de Lima CFG, Ebram MC, Celano RMG, et al. Pathophysiology of COVID-19: critical role of hemostasis. Front Cell Infect Microbiol (2022) 12:896972. doi: 10.3389/fcimb.2022.896972
5. Zinellu A, Paliogiannis P, Carru C, Mangoni AA. INR and COVID-19 severity and mortality: a systematic review with meta-analysis and meta-regression. Adv Med Sci (2021) 66(2):372–80. doi: 10.1016/j.advms.2021.07.009
6. Zinellu A, Mangoni AA. Serum complement C3 and C4 and COVID-19 severity and mortality: a systematic review and meta-analysis with meta-regression. Front Immunol (2021) 12:696085. doi: 10.3389/fimmu.2021.696085
7. Zinellu A, Paliogiannis P, Carru C, Mangoni AA. Serum amyloid a concentrations, COVID-19 severity and mortality: an updated systematic review and meta-analysis. Int J Infect Dis (2021) 105:668–74. doi: 10.1016/j.ijid.2021.03.025
8. Zinellu A, Mangoni AA. Serum prealbumin concentrations, COVID-19 severity, and mortality: a systematic review and meta-analysis. Front Med (Lausanne) (2021) 8:638529. doi: 10.3389/fmed.2021.638529
9. Paliogiannis P, Mangoni AA, Dettori P, Nasrallah GK, Pintus G, Zinellu A. D-dimer concentrations and COVID-19 severity: a systematic review and meta-analysis. Front Public Health (2020) 8:432. doi: 10.3389/fpubh.2020.00432
10. Ghofrani Nezhad M, Jami G, Kooshkaki O, Chamani S, Naghizadeh A. The role of inflammatory cytokines (Interleukin-1 and interleukin-6) as a potential biomarker in the different stages of COVID-19 (Mild, severe, and critical). J Interferon Cytokine Res (2023) 43(4):147–63. doi: 10.1089/jir.2022.0185
11. Silva MJA, Ribeiro LR, Gouveia MIM, Marcelino BDR, Santos CSD, Lima KVB, et al. Hyperinflammatory response in COVID-19: a systematic review. Viruses (2023) 15(2):553. doi: 10.3390/v15020553
12. Nasrollahi H, Talepoor AG, Saleh Z, Eshkevar Vakili M, Heydarinezhad P, Karami N, et al. Immune responses in mildly versus critically ill COVID-19 patients. Front Immunol (2023) 14:1077236. doi: 10.3389/fimmu.2023.1077236
13. Qin R, He L, Yang Z, Jia N, Chen R, Xie J, et al. Identification of parameters representative of immune dysfunction in patients with severe and fatal COVID-19 infection: a systematic review and meta-analysis. Clin Rev Allergy Immunol (2023) 64(1):33–65. doi: 10.1007/s12016-021-08908-8
14. Paliogiannis P, Mangoni AA, Cangemi M, Fois AG, Carru C, Zinellu A. Serum albumin concentrations are associated with disease severity and outcomes in coronavirus 19 disease (COVID-19): a systematic review and meta-analysis. Clin Exp Med (2021) 21(3):343–54. doi: 10.1007/s10238-021-00686-z
15. Zinellu A, Paliogiannis P, Carru C, Mangoni AA. Serum hydroxybutyrate dehydrogenase and COVID-19 severity and mortality: a systematic review and meta-analysis with meta-regression. Clin Exp Med (2022) 22(4):499–508. doi: 10.1007/s10238-021-00777-x
16. Terpos E, Ntanasis-Stathopoulos I, Elalamy I, Kastritis E, Sergentanis TN, Politou M, et al. Hematological findings and complications of COVID-19. Am J Hematol (2020) 95(7):834–47. doi: 10.1002/ajh.25829
17. Rahman A, Niloofa R, Jayarajah U, De Mel S, Abeysuriya V, Seneviratne SL. Hematological abnormalities in COVID-19: a narrative review. Am J Trop Med Hyg (2021) 104(4):1188–201. doi: 10.4269/ajtmh.20-1536
18. Zinellu A, Mangoni AA. A systematic review and meta-analysis of the association between the neutrophil, lymphocyte, and platelet count, neutrophil-to-lymphocyte ratio, and platelet-to-lymphocyte ratio and COVID-19 progression and mortality. Expert Rev Clin Immunol (2022) 18(11):1187–202. doi: 10.1080/1744666X.2022.2120472
19. Wei T, Li J, Cheng Z, Jiang L, Zhang J, Wang H, et al. Hematological characteristics of COVID-19 patients with fever infected by the omicron variant in shanghai: a retrospective cohort study in China. J Clin Lab Anal (2023) 37(1):e24808. doi: 10.1002/jcla.24808
20. Hu B, Yang XR, Xu Y, Sun YF, Sun C, Guo W, et al. Systemic immune-inflammation index predicts prognosis of patients after curative resection for hepatocellular carcinoma. Clin Cancer Res (2014) 20(23):6212–22. doi: 10.1158/1078-0432.CCR-14-0442
21. Zinellu A, Scano V, Masotto E, De Riu G, Vaira LA, Carru C, et al. The systemic inflammation index on admission is independently associated with length of stay in hospitalized COVID-19 patients. Minerva Respir Med (2021) 60(3):65-72. doi: 10.23736/s2784-8477.21.01932-5
22. Moola S, Munn Z, Tufanaru C, Aromataris E, Sears K, Sfetcu R, et al. Systematic reviews of etiology and risk. In: Joanna Briggs Institute reviewer’s manual. Adelaide, Australia: Johanna Briggs Institute (2017). p. 1–7. Available at: https://reviewersmanual.joannabriggs.org/.
23. Balshem H, Helfand M, Schunemann HJ, Oxman AD, Kunz R, Brozek J, et al. GRADE guidelines: 3. rating the quality of evidence. J Clin Epidemiol (2011) 64(4):401–6. doi: 10.1016/j.jclinepi.2010.07.015
24. Page MJ, McKenzie JE, Bossuyt PM, Boutron I, Hoffmann TC, Mulrow CD, et al. The PRISMA 2020 statement: an updated guideline for reporting systematic reviews. BMJ (2021) 372:n71. doi: 10.1136/bmj.n71
25. Deeks JJ, Higgins JPT, Altman DG. Analysing data and undertaking meta-analyses. In: Cochrane handbook for systematic reviews of interventions. Chichester (UK: John Wiley & Sons (2022).
26. Tobias A. Assessing the influence of a single study in the meta-analysis estimate. Stata Tech Bulletin (1999) 47:15–7.
27. Begg CB, Mazumdar M. Operating characteristics of a rank correlation test for publication bias. Biometrics (1994) 50(4):1088–101. doi: 10.2307/2533446
28. Sterne JA, Egger M. Funnel plots for detecting bias in meta-analysis: guidelines on choice of axis. J Clin Epidemiol (2001) 54(10):1046–55. doi: 10.1016/s0895-4356(01)00377-8
29. Duval S, Tweedie R. Trim and fill: a simple funnel-plot-based method of testing and adjusting for publication bias in meta-analysis. Biometrics. (2000) 56(2):455–63. doi: 10.1111/j.0006-341x.2000.00455.x
30. Rutter CM, Gatsonis CA. A hierarchical regression approach to meta-analysis of diagnostic test accuracy evaluations. Stat Med (2001) 20(19):2865–84. doi: 10.1002/sim.942
31. Reitsma JB, Glas AS, Rutjes AW, Scholten RJ, Bossuyt PM, Zwinderman AH. Bivariate analysis of sensitivity and specificity produces informative summary measures in diagnostic reviews. J Clin Epidemiol (2005) 58(10):982–90. doi: 10.1016/j.jclinepi.2005.02.022
32. Harbord RM, Whiting P. Metandi: meta-analysis of diagnostic accuracy using hierarchical logistic regression. Stata J (2009) 9(2):211–29. doi: 10.1177/1536867X0900900203
33. Viechtbauer W. Conducting meta-analyses in r with the metafor package. J Stat Software (2009) 36:1–48.
34. Deeks JJ, Macaskill P, Irwig L. The performance of tests of publication bias and other sample size effects in systematic reviews of diagnostic test accuracy was assessed. J Clin Epidemiol (2005) 58(9):882–93. doi: 10.1016/j.jclinepi.2005.01.016
35. Fagan TJ. Letter: nomogram for bayes theorem. N Engl J Med (1975) 293(5):257. doi: 10.1056/NEJM197507312930513
36. Acar E, Demir A, Yildirim B, Kaya MG, Gokcek K. The role of hemogram parameters and c-reactive protein in predicting mortality in COVID-19 infection. Int J Clin Pract (2021) 75(7):e14256. doi: 10.1111/ijcp.14256
37. Alagbe AE, Pedroso GA, de Oliveira BB, de Costa E, Maia GAF, Piellusch BF, et al. Hemograms and serial hemogram-derived ratios in survivors and non-survivors of COVID-19 in campinas, Brazil. Hematol Transfus Cell Ther (2022) in press. doi: 10.1016/j.htct.2022.11.003
38. Alkhatib B, Al Hourani HM, Al-Shami I. Using inflammatory indices for assessing malnutrition among COVID-19 patients: a single-center retrospective study. J Infect Public Health (2022) 15(12):1472–6. doi: 10.1016/j.jiph.2022.11.006
39. Arbanasi EM, Halmaciu I, Kaller R, Muresan AV, Arbanasi EM, Suciu BA, et al. Systemic inflammatory biomarkers and chest CT findings as predictors of acute limb ischemia risk, intensive care unit admission, and mortality in COVID-19 patients. Diagnostics (Basel) (2022) 12(10):2379. doi: 10.3390/diagnostics12102379
40. Asaduzzaman MD, Bhuia MR, Alam ZN, Bari MZJ, Ferdousi T. Role of hemogram-derived ratios in predicting intensive care unit admission in COVID-19 patients: a multicenter study. IJID Reg (2022) 3:234–41. doi: 10.1016/j.ijregi.2022.04.011
41. Cakirca G, Cakirca TD, Bindal A, Olcen M. Inflammation-based indices predicting mortality in COVID-19. J Coll Physicians Surg Pak (2023) 33(1):112–4. doi: 10.29271/jcpsp.2023.01.112
42. Celikkol A, Guzel EC, Dogan M, Erdal B, Yilmaz A. C-reactive protein-to-Albumin ratio as a prognostic inflammatory marker in COVID-19. J Lab Physicians (2022) 14(1):74–83. doi: 10.1055/s-0041-1741439
43. Citu C, Gorun F, Motoc A, Sas I, Gorun OM, Burlea B, et al. The predictive role of NLR, d-NLR, MLR, and SIRI in COVID-19 mortality. Diagnostics (Basel) (2022) 12(1):122. doi: 10.3390/diagnostics12010122
44. Cocos R, Mahler B, Turcu-Stiolica A, Stoichita A, Ghinet A, Shelby ES, et al. Risk of death in comorbidity subgroups of hospitalized COVID-19 patients inferred by routine laboratory markers of systemic inflammation on admission: a retrospective study. Viruses (2022) 14(6):1201. doi: 10.3390/v14061201
45. Farias JP, Silva P, Codes L, Vinhaes D, Amorim AP, D'Oliveira RC, et al. Leukocyte ratios are useful early predictors for adverse outcomes of COVID-19 infection. Rev Inst Med Trop Sao Paulo (2022) 64:e73. doi: 10.1590/S1678-9946202264073
46. Fernandes NF, Costa IF, Pereira KN, de Carvalho JAM, Paniz C. Hematological ratios in coronavirus disease 2019 patients with and without invasive mechanical ventilation. J Investig Med (2023) 71(4):321–8. doi: 10.1177/10815589221149189
47. Fois AG, Paliogiannis P, Scano V, Cau S, Babudieri S, Perra R, et al. The systemic inflammation index on admission predicts in-hospital mortality in COVID-19 patients. Molecules (2020) 25(23):5725. doi: 10.3390/molecules25235725
48. Ghobadi H, Mohammadshahi J, Javaheri N, Fouladi N, Mirzazadeh Y, Aslani MR. Role of leukocytes and systemic inflammation indexes (NLR, PLR, MLP, dNLR, NLPR, AISI, SIR-I, and SII) on admission predicts in-hospital mortality in non-elderly and elderly COVID-19 patients. Front Med (Lausanne) (2022) 9:916453. doi: 10.3389/fmed.2022.916453
49. Gozdas HT, Kayis SA, Damarsoy T, Ozsari E, Turkoglu M, Yildiz I, et al. Multi-inflammatory index as a novel mortality predictor in critically ill COVID-19 patients. J Intensive Care Med (2022) 37(11):1480–5. doi: 10.1177/08850666221100411
50. Gujar RK, Meena A, Chouhan SS, Likhar KS. Hematological profiles of COVID-19 patients at the ratlam district, Madhya pradesh state, India. Bioinformation. (2021) 17(7):686–90. doi: 10.6026/97320630017686
51. Gunay S, Caliskan S, Sigirli D. A nomogram based on myocardial damage and novel inflammatory indexes for post-discharge survival rates of COVID-19. Clin Lab (2022) 68(3). doi: 10.7754/Clin.Lab.2021.210745
52. Gutierrez-Perez IA, Buendia-Roldan I, Perez-Rubio G, Chavez-Galan L, Hernandez-Zenteno RJ, Aguilar-Duran H, et al. Outcome predictors in COVID-19: an analysis of emergent systemic inflammation indices in Mexican population. Front Med (Lausanne) (2022) 9:1000147. doi: 10.3389/fmed.2022.1000147
53. Hamad DA, Aly MM, Abdelhameid MA, Ahmed SA, Shaltout AS, Abdel-Moniem AE, et al. Combined blood indexes of systemic inflammation as a mirror to admission to intensive care unit in COVID-19 patients: a multicentric study. J Epidemiol Glob Health (2022) 12(1):64–73. doi: 10.1007/s44197-021-00021-5
54. Karaaslan T, Karaaslan E. Predictive value of systemic immune-inflammation index in determining mortality in COVID-19 patients. J Crit Care Med (Targu Mures) (2022) 8(3):156–64. doi: 10.2478/jccm-2022-0013
55. Khadzhieva MB, Gracheva AS, Belopolskaya OB, Chursinova YV, Redkin IV, Pisarev MV, et al. Serial changes in blood-Cell-Count-Derived and CRP-derived inflammatory indices of COVID-19 patients. Diagnostics (Basel) (2023) 13(4):746. doi: 10.3390/diagnostics13040746
56. Kudlinski B, Zgola D, Stolinska M, Murkos M, Kania J, Nowak P, et al. Systemic inflammatory predictors of in-hospital mortality in COVID-19 patients: a retrospective study. Diagnostics (Basel) (2022) 12(4):859. doi: 10.3390/diagnostics12040859
57. Li Y, Li H, Song C, Lu R, Zhao Y, Lin F, et al. Early prediction of disease progression in patients with severe COVID-19 using c-reactive protein to albumin ratio. Dis Markers (2021) 2021:6304189. doi: 10.1155/2021/6304189
58. Lopez-Escobar A, Madurga R, Castellano JM, Ruiz de Aguiar S, Velazquez S, Bucar M, et al. Hemogram as marker of in-hospital mortality in COVID-19. J Investig Med (2021) 69(5):962–9. doi: 10.1136/jim-2021-001810
59. Luo X, Zhou W, Yan X, Guo T, Wang B, Xia H, et al. Prognostic value of c-reactive protein in patients with coronavirus 2019. Clin Infect Dis (2020) 71(16):2174–9. doi: 10.1093/cid/ciaa641
60. Moisa E, Corneci D, Negoita S, Filimon CR, Serbu A, Negutu MI, et al. Dynamic changes of the neutrophil-to-Lymphocyte ratio, systemic inflammation index, and derived neutrophil-to-Lymphocyte ratio independently predict invasive mechanical ventilation need and death in critically ill COVID-19 patients. Biomedicines (2021) 9(11):1656. doi: 10.3390/biomedicines9111656
61. Muresan AV, Halmaciu I, Arbanasi EM, Kaller R, Arbanasi EM, Budisca OA, et al. Prognostic nutritional index, controlling nutritional status (CONUT) score, and inflammatory biomarkers as predictors of deep vein thrombosis, acute pulmonary embolism, and mortality in COVID-19 patients. Diagnostics (Basel) (2022) 12(11):2757. doi: 10.3390/diagnostics12112757
62. Nalbant A, Demirci T, Kaya T, Aydin A, Altindis M, Guclu E. Can prognostic nutritional index and systemic immune-inflammatory index predict disease severity in COVID-19? Int J Clin Pract (2021) 75(10):e14544. doi: 10.1111/ijcp.14544
63. Poorhaji MM, Shahriyari M, Asadi MM, Bahrami F, Gouvarchinghaleh HE, Mohammadzadeh T, et al. Binary logistic regression and linear discriminant analyses in evaluating laboratory factors associated to patients with COVID-19: comparing the two statistical methods. Mediterr J Infect Microb Antimicrob (2022) 11(7) doi: 10.4274/mjima.galenos.2022.2021.20
64. Prasad S, Patel S, Behera AK, Sahu D, Shah S, Nanda R, et al. Influence of laboratory biomarkers on inflammatory indices for assessing severity progression in COVID-19 cases. J Family Med Prim Care (2022) 11(5):2056–72. doi: 10.4103/jfmpc.jfmpc_2014_21
65. Qiu W, Shi Q, Chen F, Wu Q, Yu X, Xiong L. The derived neutrophil to lymphocyte ratio can be the predictor of prognosis for COVID-19 omicron BA.2 infected patients. Front Immunol (2022) 13:1065345. doi: 10.3389/fimmu.2022.1065345
66. Rokni M, Ahmadikia K, Asghari S, Mashaei S, Hassanali F. Comparison of clinical, para-clinical and laboratory findings in survived and deceased patients with COVID-19: diagnostic role of inflammatory indications in determining the severity of illness. BMC Infect Dis (2020) 20(1):869. doi: 10.1186/s12879-020-05540-3
67. San I, Gemcioglu E, Davutoglu M, Catalbas R, Karabuga B, Kaptan E, et al. Which hematological markers have predictive value as early indicators of severe COVID-19 cases in the emergency department? Turk J Med Sci (2021) 51(6):2810–21. doi: 10.3906/sag-2008-6
68. Sevinc C, Demirci R, Timur O. Predicting hospital mortality in COVID-19 hemodialysis patients with developed scores. Semin Dial (2021) 34(5):347–59. doi: 10.1111/sdi.13004
69. Velazquez S, Madurga R, Castellano JM, Rodriguez-Pascual J, de Aguiar Diaz Obregon SR, Jimeno S, et al. Hemogram-derived ratios as prognostic markers of ICU admission in COVID-19. BMC Emerg Med (2021) 21(1):89. doi: 10.1186/s12873-021-00480-w
70. Xia W, Tan Y, Hu S, Li C, Jiang T. Predictive value of systemic immune-inflammation index and neutrophil-to-Lymphocyte ratio in patients with severe COVID-19. Clin Appl Thromb Hemost (2022) 28:10760296221111391. doi: 10.1177/10760296221111391
71. Xu J, Gao Y, Hu S, Li S, Wang W, Wu Y, et al. A composite risk model predicts disease progression in early stages of COVID-19: a propensity score-matched cohort study. Ann Clin Biochem (2021) 58(5):434–44. doi: 10.1177/00045632211011194
72. Xue G, Gan X, Wu Z, Xie D, Xiong Y, Hua L, et al. Novel serological biomarkers for inflammation in predicting disease severity in patients with COVID-19. Int Immunopharmacol (2020) 89(Pt A):107065. doi: 10.1016/j.intimp.2020.107065
73. Yilmaz A, Taskin O, Demir U, Soylu VG. Predictive role of biomarkers in COVID-19 mortality. Cureus (2023) 15(1):e34173. doi: 10.7759/cureus.34173
74. Zhao Y, Yu C, Ni W, Shen H, Qiu M, Zhao Y. Peripheral blood inflammatory markers in predicting prognosis in patients with COVID-19. Some Dif influenza A J Clin Lab Anal (2021) 35(1):e23657. doi: 10.1002/jcla.23657
75. Lim S, Bae JH, Kwon HS, Nauck MA. COVID-19 and diabetes mellitus: from pathophysiology to clinical management. Nat Rev Endocrinol (2021) 17(1):11–30. doi: 10.1038/s41574-020-00435-4
76. Figliozzi S, Masci PG, Ahmadi N, Tondi L, Koutli E, Aimo A, et al. Predictors of adverse prognosis in COVID-19: a systematic review and meta-analysis. Eur J Clin Invest (2020) 50(10):e13362. doi: 10.1111/eci.13362
77. Du Y, Zhou N, Zha W, Lv Y. Hypertension is a clinically important risk factor for critical illness and mortality in COVID-19: a meta-analysis. Nutr Metab Cardiovasc Dis (2021) 31(3):745–55. doi: 10.1016/j.numecd.2020.12.009
78. Wang Y, Ni Q. Prognostic and clinicopathological significance of systemic immune-inflammation index in cancer patients receiving immune checkpoint inhibitors: a meta-analysis. Ann Med (2023) 55(1):808–19. doi: 10.1080/07853890.2023.2181983
79. Meng L, Yang Y, Hu X, Zhang R, Li X. Prognostic value of the pretreatment systemic immune-inflammation index in patients with prostate cancer: a systematic review and meta-analysis. J Transl Med (2023) 21(1):79. doi: 10.1186/s12967-023-03924-y
80. Ji Y, Wang H. Prognostic prediction of systemic immune-inflammation index for patients with gynecological and breast cancers: a meta-analysis. World J Surg Oncol (2020) 18(1):197. doi: 10.1186/s12957-020-01974-w
81. Zhang Y, Chen B, Wang L, Wang R, Yang X. Systemic immune-inflammation index is a promising noninvasive marker to predict survival of lung cancer: a meta-analysis. Med (Baltimore) (2019) 98(3):e13788. doi: 10.1097/MD.0000000000013788
82. Li X, Gu L, Chen Y, Chong Y, Wang X, Guo P, et al. Systemic immune-inflammation index is a promising non-invasive biomarker for predicting the survival of urinary system cancers: a systematic review and meta-analysis. Ann Med (2021) 53(1):1827–38. doi: 10.1080/07853890.2021.1991591
83. Xu J, Song J, Yang Z, Zhao J, Wang J, Sun C, et al. Pre-treatment systemic immune-inflammation index as a non-invasive biomarker for predicting clinical outcomes in patients with renal cell carcinoma: a meta-analysis of 20 studies. Biomarkers. (2023) 28(3):249–62. doi: 10.1080/1354750X.2023.2164906
84. Peng X, Wang X, Hua L, Yang R. Prognostic and clinical value of the systemic immune-inflammation index in biliary tract cancer: a meta-analysis. J Immunol Res (2022) 2022:6988489. doi: 10.1155/2022/6988489
85. Li M, Li Z, Wang Z, Yue C, Hu W, Lu H. Prognostic value of systemic immune-inflammation index in patients with pancreatic cancer: a meta-analysis. Clin Exp Med (2022) 22(4):637–46. doi: 10.1007/s10238-021-00785-x
86. Gao H, Wusiman L, Cao BW, Wujieke A, Zhang WB. The role of preoperative systemic immune-inflammation index in predicting the prognosis of patients with digestive tract cancers: a meta-analysis. Transpl Immunol (2022) 73:101613. doi: 10.1016/j.trim.2022.101613
87. Wang B, Huang Y, Lin T. Prognostic impact of elevated pre-treatment systemic immune-inflammation index (SII) in hepatocellular carcinoma: a meta-analysis. Med (Baltimore) (2020) 99(1):e18571. doi: 10.1097/MD.0000000000018571
88. Huang YW, Yin XS, Li ZP. Association of the systemic immune-inflammation index (SII) and clinical outcomes in patients with stroke: a systematic review and meta-analysis. Front Immunol (2022) 13:1090305. doi: 10.3389/fimmu.2022.1090305
89. Zhao E, Cheng Y, Yu C, Li H, Fan X. The systemic immune-inflammation index was non-linear associated with all-cause mortality in individuals with nonalcoholic fatty liver disease. Ann Med (2023) 55(1):2197652. doi: 10.1080/07853890.2023.2197652
90. Ye Z, Hu T, Wang J, Xiao R, Liao X, Liu M, et al. Systemic immune-inflammation index as a potential biomarker of cardiovascular diseases: a systematic review and meta-analysis. Front Cardiovasc Med (2022) 9:933913. doi: 10.3389/fcvm.2022.933913
91. Yang YL, Wu CH, Hsu PF, Chen SC, Huang SS, Chan WL, et al. Systemic immune-inflammation index (SII) predicted clinical outcome in patients with coronary artery disease. Eur J Clin Invest (2020) 50(5):e13230. doi: 10.1111/eci.13230
92. Attiq A, Yao LJ, Afzal S, Khan MA. The triumvirate of NF-kappaB, inflammation and cytokine storm in COVID-19. Int Immunopharmacol (2021) 101(Pt B):108255. doi: 10.1016/j.intimp.2021.108255
93. Ramos-Casals M, Brito-Zeron P, Mariette X. Systemic and organ-specific immune-related manifestations of COVID-19. Nat Rev Rheumatol (2021) 17(6):315–32. doi: 10.1038/s41584-021-00608-z
94. Caraguel CG, Vanderstichel R. The two-step fagan's nomogram: ad hoc interpretation of a diagnostic test result without calculation. Evid Based Med (2013) 18(4):125–8. doi: 10.1136/eb-2013-101243
95. Luo H, He L, Zhang G, Yu J, Chen Y, Yin H, et al. Normal reference intervals of neutrophil-To-Lymphocyte ratio, platelet-To-Lymphocyte ratio, lymphocyte-To-Monocyte ratio, and systemic immune inflammation index in healthy adults: a Large multi-center study from Western China. Clin Lab (2019) 65(3). doi: 10.7754/Clin.Lab.2018.180715
Keywords: systemic inflammation index, risk stratification, COVID-19, disease severity, mortality, biomarkers, inflammation
Citation: Mangoni AA and Zinellu A (2023) Systemic inflammation index, disease severity, and mortality in patients with COVID-19: a systematic review and meta-analysis. Front. Immunol. 14:1212998. doi: 10.3389/fimmu.2023.1212998
Received: 27 April 2023; Accepted: 06 June 2023;
Published: 21 June 2023.
Edited by:
Praveen Papareddy, Lund University, SwedenReviewed by:
Akram M. Zaaqoq, University of Virginia, United StatesMohammad Reza Aslani, Ardabil University of Medical Sciences, Iran
Copyright © 2023 Mangoni and Zinellu. This is an open-access article distributed under the terms of the Creative Commons Attribution License (CC BY). The use, distribution or reproduction in other forums is permitted, provided the original author(s) and the copyright owner(s) are credited and that the original publication in this journal is cited, in accordance with accepted academic practice. No use, distribution or reproduction is permitted which does not comply with these terms.
*Correspondence: Arduino A. Mangoni, YXJkdWluby5tYW5nb25pQGZsaW5kZXJzLmVkdS5hdQ==